Embed Size (px)
Citation preview

1
MS-MDA: Multisource Marginal DistributionAdaptation for Cross-subject and Cross-session
EEG Emotion RecognitionHao Chen, Ming Jin, Zhunan Li, Cunhang Fan, Jinpeng Li*, Member, IEEE, Huiguang He, Senior Member, IEEE
Abstract—As an essential element for the diagnosis andrehabilitation of psychiatric disorders, the electroencephalo-gram (EEG) based emotion recognition has achieved significantprogress due to its high precision and reliability. However, oneobstacle to practicality lies in the variability between subjectsand sessions. Although several studies have adopted domainadaptation (DA) approaches to tackle this problem, most of themtreat multiple EEG data from different subjects and sessionstogether as a single source domain for transfer, which either failsto satisfy the assumption of domain adaptation that the sourcehas a certain marginal distribution, or increases the difficultyof adaptation. We therefore propose the multi-source marginaldistribution adaptation (MS-MDA) for EEG emotion recognition,which takes both domain-invariant and domain-specific featuresinto consideration. First, we assume that different EEG datashare the same low-level features, then we construct independentbranches for multiple EEG data source domains to adopt one-to-one domain adaptation and extract domain-specific features.Finally, the inference is made by multiple branches. We evaluateour method on SEED and SEED-IV for recognizing three andfour emotions, respectively. Experimental results show that theMS-MDA outperforms the comparison methods and state-of-the-art models in cross-session and cross-subject transfer scenariosin our settings. Codes at https://github.com/VoiceBeer/MS-MDA.
Index Terms—brain-computer interface, deep learning, EEG,emotion recognition, affective computing, domain adaptation,transfer learning
I. INTRODUCTION
Emotion as physiological information, unlike widely studiedlogical intelligence, is central to the quality and range ofdaily human communications [1], [2]. In the human-computerinteraction (HCI), emotion is crucial in influencing situationassessment and belief information, from cue identification to
This paragraph of the first footnote will contain the date on which yousubmitted your paper for review. This work was supported by the NationalNatural Science Foundation of China (62020106015) ,the Strategic PriorityResearch Program of CAS (XDB32040000), the Zhejiang Provincial NaturalScience Foundation of China (LQ20F030013), and the Ningbo Public ServiceTechnology Foundation, China (202002N3181).
Hao Chen, Ming Jin, Zhunan Li, Jinpeng Li are with HwaMei Hospital,University of Chinese Academy of Sciences, Ningbo, Zhejiang Province,315100, China, and are also with Ningbo Institute of Life and Health Industry,University of Chinese Academy of Sciences, Ningbo, Zhejiang Province,315100, China. Corresponding author: Jinpeng Li ([email protected]).
Cunhang Fan is with Anhui Province Key Laboratory of MultimodalCognitive Computation, School of Computer Science and Technology, AnhuiUniversity, No. 111 Jiulong Road, Shushan District, Hefei, China. email:[email protected]
Huiguang He is with Institute of Automation, Chinese Academy of Sci-ences, No. 95 Zhongguancun East Road, Haidian District, Beijing, China.email: [email protected]
situation classification, with decision selection for buildinga friendly user interface [3]. For example, affective brain-computer interfaces (aBCIs), acting as a bridge between theemotions extracted from the brain and the computer, whichhas shown potential for rehabilitation and communication[4], [5], [6]. Besides, many studies have shown a strongcorrelation between emotions and mental illness. Barrett et al.[7] studies the relation between emotion differentiation andemotion regulation. Joormann et al. [8] finds that depressionis strongly associated with the use of emotion regulationstrategies. Bucks et al. [9] investigates the identification ofnon-verbal communicative signals of emotion in people thatare suffering from Alzheimer’s disease. To quantify emotion,most researchers have focused on using conventional methodssuch as classifying emotions with facial expression or language[10]. In recent years, with the advantage of reliability, easyaccessibility, and high precision, non-invasive BCIs such aselectroencephalogram (EEG) are widely used for brain signalacquisition, and analysis of psychological disorders [11], [12],[13], [14]. With EEG signals, many works also investigatethe rehabilitation methods for psychological disorders, suchas [15] of using spatial information of EEG signals to classifydepressions, and Zhang et al. [16] proposes a brain functionalnetwork framework for major depressive disorder by using theEEG signals. Besides, Hosseinifard et al. [17] investigates thenonlinear features from EEG signals for classifying depressionpatients and normal subjects. The flow of an EEG-basedaffective BCI (aBCI) for emotion recognition is introducedin Section. III-A
Due to the non-stationary between individual sessions andsubjects of EEG signals [12], it is still challenging to get amodel that is shareable to different subjects and sessions inEEG-based emotion recognition scenarios, which elicits twoscenarios: cross-subject and cross-session (i.e., data collectedfrom the same subject at the same session can be very biased,detailed description is given in Section III-B). Besides, theanalysis and classification of the collected signals are time-consuming and labor-intensive, so it is important to makeuse of the existing labeled data to analyze new signals inthe EEG-based BCIs. With this purpose, domain adaptationis widely used in research works. As a sub-field of machinelearning, DA improves the learning in the unlabeled targetdomain through the transfer of knowledge from the sourcedomains, which can significantly reduce the number of labeledsamples [18]. In practice, we often face the situation thatcontains multiple source domain data (i.e., data from different
arX
iv:2
107.
0774
0v1
[cs
.LG
] 1
6 Ju
l 202
1

2
Source Reservoir
𝑺𝟐
𝑺𝟏
𝑺𝟑
𝑺𝟒
𝑻
DA
a) Source-combine DA
𝑺𝟐
𝑺𝟏
𝑺𝟑
𝑺𝟒
𝑻
b) MS-MDA
Source Reservoir
DA
Multi-branch
Single-branch
EEG data
Learned position
DA Domain adaptation
Marginal distribution (with colors)
𝑻;𝑺𝒏 Target domain; Source domain
Source-combine marginal distribution
One branch DA
𝑻
𝑻
𝑻𝑻
𝑻
𝑻
Fig. 1. Two strategies of multi-source domain adaptation. a) is a single-branch strategy while b) is a multi-branch strategy. In a), all source domainsare combined into one new big source and then been used to align distributionwith the target domain, while in b), multiple sources are being aligned at thesame time, and are divided into multiple branches to adopt DA with thetarget domain. In short, a) is one source, one branch with one-to-one DA; b)is multiple sources, multiple branches with one-to-one DA. The figure is bestviewed in color.
subjects or sessions). Due to the shift between domains,adopting DA for EEG data especially when facing multiplesources is difficult. In recent years, the researchers tend tomerge all source domains into one single source and then useDA to align the distribution (Source-combine DA in Fig. 1).This simple approach may improve the performance becauseit expands the training data for the model, but it ignoresthe non-stationary of each EEG source domain itself anddisrupts it (i.e., EEG data of different people obey differentmarginal distributions), besides, directly merging into one newsource domain cannot determine whether its new marginaldistribution still obeys EEG-data distribution, thus brings alarger bias.
To solve the multi-source domain adaptation problems inEEG-based emotion recognition, we propose a multi-sourcemarginal distribution adaptation for cross-subject and cross-session EEG emotion recognition (MS-MDA, as illustrated inFig. 1). First, we assume all the EEG data share low-levelfeatures, especially those taken from the same device, the samesubject and the same session. Based on this, we construct asimple common feature extractor to extract domain-invariantfeatures. Then for multiple sources, since each of them hassome specific features, we pair every single source domainwith the target domain to form a branch for one-to-one DA,and align the distribution and extract domain-specific features.After that, a classifier is trained for each branch, and the finalinference is made by these multiple classifiers from multiplebranches. The details of MS-MDA are given in Section IV.
In summary, we make three following contributions:
1) We propose MS-MDA for EEG-based emotion recog-nition in a new multi-source adaptation way to avoiddisrupting the marginal distributions of EEG data.
2) Extensive experiments demonstrate that our method out-performs the comparison methods on SEED and SEED-IV, and additional experiments also illustrate that ourmethod generalizes well.
3) During the experiments, we also notice the importance of
normalizing the EEG data, thus we design and evaluatefew normalization approaches for EEG data in the domainadaptation scenarios and draw corresponding conclusions.To our knowledge, we are the first to investigate thenormalization methods for EEG data, which we believecan be taken as a guide for other future works, and beapplied to all data in EEG-based datasets and EEG-relateddomains.
In the remainder of this paper, we first review related workson domain adaptation in the field of EEG-based emotionrecognition in Section II. Section III introduces the materials,including the diagram of EEG-based affective BCI with trans-fer scenarios, datasets and pre-processing methods. The detailsof MS-MDA are given in Section IV, whereas Section Vdemonstrates the settings, results, and additional experiments.Section VII discusses the results of the experiment and ourfindings, as well as problems and solutions. Finally, SectionVII concludes the work and outlines the future extension.
II. RELATED WORK
In recent years, the research of affective computing hasbecome one of the trends of machine learning, neural sys-tems, and rehabilitation study. Among those works, emotionsare usually characterized into two types of emotion model:discrete categories (basic emotional states, e.g., happy, sad,neutral [19]) or continuous values (e.g., in 3D space ofarousal, valence and dominance [20]). With domain adaptationtechniques, many works have achieved significant performancein the field of affective computing.
Zheng et al. [21] first applies Transfer Component Analysis[22] and Kernel Principle Analysis based methods on SEEDdataset to personalize EEG-based affective models and demon-strates the feasibility of adopting DA in EEG-based aBCIs.Chai et al. proposes adaptive subspace feature matching [23]to decrease the marginal distribution discrepancy between twodomains, which requires no labeled samples in the targetdomain. To solve cross-day binary classification, Lin et al.[24] extends robust principal component analysis (rPCA) [25]to their filtering strategy which can capture EEG oscillationsof relatively consistent emotional responses. Li et al., differentfrom the above, considering the multi-source scenario, andproposes a Multi-source Style Transfer Mapping (MS-STM)[26] framework for cross-subject transfer. They first take afew labeled training data to learn multiple STMs, which arethen being used to map the target domain distribution to thespace of the sources. Their method is similar to our MS-MDA, but they do not take the domain-invariant features intoconsideration, thus losing the low-level information.
In recent years, with the development of deep learning tech-niques and its usability, many works of EEG-based decodingwith neural networks have been proposed. Jin et al. [27], andLi et al. [28] adopts deep adaptation network (DAN) [29] toEEG-based emotion recognition, which takes maximum meandiscrepancy (MMD) [30] as a measure of the distance betweenthe source and the target domain, and training to reduce iton multiple layers. Extending the original method, Chai etal. proposes subspace alignment auto-encoder (SAAE) [31]

3
which first projects both source and target domains into adomain-invariant subspace using an auto-encoder, and thenkernel PCA, graph regularization and MMD are used to alignthe feature distribution. To adapt the joint distribution, Li etal. [32] propose a domain adaptation method for EEG-basedemotion recognition by simultaneously adapting marginal dis-tributions and conditional distributions, they also present a fastonline instance transfer (FOIT) for improved EEG emotionrecognition [33]. Zheng et al. extends SEED dataset to SEED-IV dataset and presents EmotionMeter [34], a multi-modalemotion recognition framework that combines two modali-ties of eye movements and EEG waves. With the conceptof attention-based convolutional neural network (CNN) [35],Fahimi et al. [36] develops an end-to-end deep CNN for cross-subject transfer and fine-tunes it by using some calibration datafrom the target domain. To tackle the requirement of amassingextensive EEG data, Zhao et al. [37] proposes a plug-and-play domain adaptation method for shortening the calibrationtime within a minute while maintaining the accuracy. Wang etal. [38] present a domain adaptation SPD matrix network(daSPDnet) to help cut the demand of calibration data forBCIs.
These aBCI works have gained significant improvement intheir respective directions, transfer scenarios, and on multiplebenchmark databases. However, many of them focus on comb-ing multiple sources into one and adopt one-to-one DA, whichignores the differences of the marginal distribution of differentEEG domains (source-combine DA in Fig. 1). This operationmay compromise the effectiveness of downstream tasks, andalthough it somehow extends the training data, the trainedmodels do not generalize well enough. Therefore, inspiredby [39], a novel multi-source transfer framework, we proposeMS-MDA (multi-source marginal distribution alignment forEEG-based emotion recognition), which transfers multiplesource domains to the target domain separately, thus avoidingthe destruction of the marginal distribution of the multipleEEG source domains; and also takes the domain-invariantfeatures into consideration. Due to the sensitivity of the EEGdata and intuition, we do not adopt complex networks, but justa combination of few multi-layer perceptrons (MLPs) [40], andthus makes our method computationally efficient, and easy toexpand.
III. MATERIALS
A. Diagram
The flow of one EEG-based aBCI for emotion recognitionis shown in Fig. 2, which involves five steps:• Stimulating emotions. The subjects are first stimulated
with stimuli that correspond to a target emotion. The mostcommonly used stimuli are movie clips with sound, whichcan better stimulate the desired emotion because theymix sound with images and actions. After each clip, self-assessment is also applied for the subject to ensure theconsistency of the evoked emotion and the target emotion.
• EEG signal acquisition and recording. The EEG dataare collected using the dry electrodes on the BCI, andthen be labeled with the target emotion.
Fig. 2. The flowchart of EEG-based BCI for emotion recognition. Theemotions are first evoked and encoded into EEG data, then the EEG dataare pre-processed and extracted to various forms of features for subsequentpattern recognition.
• Signal pre-processing. Since the EEG data is a mixtureof various kinds of information containing much noise, itis required to pre-process the EEG signal to get cleanerdata for subsequent recognition. This step often includesdown-sampling, band-pass filtering, temporal filtering,and spatial filtering to improve the signal-to-noise ratio(SNR).
• Feature extraction. In this step, features of the pre-processed signals are extracted in various ways. Most ofthe current research works are to extract features in thetime or frequency domain.
• Pattern recognition. The use of machine learning tech-niques to classify or regress data according to specificapplication scenarios.
B. Scenarios
Considering the sensitivity of the EEG, domain adaptationin emotion recognition can be divided into several cases: 1)Cross-subject transfer. In one session, new EEG data froma new subject is taken as the target domain, and the rest ofexisting EEG data from other subjects are taken as the sourcedomains for DA. 2) Cross-session transfer. For one subject,data collected in the previous sessions can be used as thesource domain for DA, and data collected in the new sessionare taken as the target domain.
In our work, since the datasets we evaluate on contains 3session and 15 subjects (refer to Section III-C for details),we take the first 2 session data from one subject as thesource domains for cross-session transfer, and take the first14 subjects data from one session as the source domains forcross-subject transfer. The results of cross-session scenariosare averaged over 15 subjects, and the results of cross-subjectare averaged over 3 sessions. Standard deviations are alsocalculated.
C. Datasets
The database we evaluate on are: SEED [19] [41] andSEED-IV [34], both are established by the BCMI laboratoryled by Prof. Bao-Liang Lu from Shanghai Jiao Tong Univer-sity.

4
The SEED database contains emotion-related EEG signalsthat are evoked by 15 film clips (with positive, neutral, andnegative emotions) from 15 subjects with 3 sessions each. Thesignals are recorded by a 62-channel ESI neuroscan system.
The SEED-IV is an evolution of SEED, which contains 3sessions, each has 15 subjects and 24 film clips. Comparing tothe SEED with EEG signals only, this database also includeseye movement features recorded by SMI eye-tracking glasses.
D. Pre-processing
After collecting EEG raw data, pre-processing on signalsand feature extractions will be adopted. For both SEED andSEED-IV, to increase the SNR, the raw EEG signals are firstdown-sampled to a 200 Hz sampling rate, then been processedwith a band-pass filter between 1 Hz to 75 Hz. After that,features are then being extracted.
DE = −∫X
f(x) log[f(x)]dx (1)
Recent works extract features from EEG data on thetime domain, frequency domain, and time-frequency domain.Among them, Differential Entropy (DE) as in (1), has theability to distinguish patterns from different bands [42], thuswe choose to take DE features as the input data of ourmodel. For SEED and SEED-IV, extracted DE features at fivefrequency bands of delta (1-4 Hz), theta (4-8 Hz), alpha (8-14Hz) and gamma (31-50 Hz) are provided.
One data from one subject in one session for both databasesis in the form of channel (62) × trial (15 for SEED, 24 forSEED-IV) × band (5), we then merge the channel with theband, and the form becomes trial × 310 (62 × 5). For SEED,15 trials contain 3394 samples in total for each session. ForSEED-IV, 24 trials contain 851/832/822 samples for threesessions, respectively. In the end, all data are formed into3394 × 310 (SEED), or 851/832/822 × 310 (SEED-IV) withcorresponding generated label vectors in the form of 3394 ×1, or 851/832/822 × 1.
IV. METHOD
For simplicity of demonstration, we list the symbols andtheir definition in Table I that will be used in the followingsections.
Given a set of pre-existing EEG data and a newly collectedEEG data, our goal is to learn a model φ that is trained onthese multiple independent source domain data using DA, andthus has a better prediction on the newly collected data thansimply combining the existed data into one source domain.The architecture of the proposed method is illustrated in Fig.3.
As shown in the figure, the input to the MS-MDA are Nindependent source domain data {(XS
i ,YSi )}Ni=1 and a target
domain data {XT }, and then these data are fed into a commonfeature extractor module to get the domain-invariance features{QS
i }Ni=1 and {QT }. Then for each domain-specific featureextractor, extracted common features {QS
i }Ni=1 will be fedinto one branch with {QT } and get their domain-specificfeatures: {RS
i }Ni=1 and {RTi }Ni=1, and on top of that, the MMD
TABLE INOTATION TABLE
symbol definitionX Instance set (matrix)Y Label set (matrix)S Source domainT Target domainN number of source domainsQ Common featureR Domain-specific featureY Predicted label (matrix)φ,Φ Mapping functionH Reproducing kernel Hilbert space
CFE Common feature extractorDSFE Domain-specific feature extractorDSC Domain-specific classifierx Feature vectory Label vectorq Feature vector after CFEr Feature vector after DSFEy Predicted label vector
value is calculated, which is a measure of the distance of thecurrent source and the target domain. Next, the target domainfeatures {RT
i }Ni=1 and all the source domain features {RSi }Ni=1
extracted from the last step will get to the domain-specificclassifiers to get the corresponding classification predictions:{Y
T
i }Ni=1 and {YS
i }Ni=1, then the results of the source domainare taken to calculate the classification loss. Since the targetdomain will be fed into all the source domain classifiers,multiple target domain predictions are generated. These pre-dictions are taken to calculate the discrepancy loss. In the end,the average of these target-domain predictions is taken as theoutput of the model. Details of these modules are given below.
Common Feature Extractor in the MS-MDA is used tomap the source and target domain data from the originalfeature spaces to a common sharing latent space, and thencommon representations of all domains are extracted. Thismodule can help to extract some low-level domain-invariantfeatures.
Domain-specific Feature Extractor follows the CommonFeature Extractor (CFE). After obtaining the features of alldomains, we set up N single fully connected layers to cor-respond to N source domains. For each pair of source andtarget domain, we map the data to a unique latent space viathe corresponding Domain-specific Feature Extractor (DSFE),respectively, and then obtain the domain-specific features ineach branch. To apply DA and bring the two domains closein the latent space, we choose the MMD to estimate thedistance between these two domains. MMD is widely usedin the DA and can be formulated in (2). In the process oftraining, MMD loss is decreased to narrow the source domainand the target domain in the feature space, which helps makebetter predictions for the target domain. This module aims tolearn multiple domain-specific features.
MMD(XS ,XT ) =
∥∥∥∥∥∥ 1
NS
NS∑i=1
Φ(xSi
)− 1
NT
NT∑j=1
Φ(xTj
)∥∥∥∥∥∥2
H(2)

5
𝑺𝟏
𝑻
𝑺𝑵
Common Feature Extractor
Domain-specific Feature Extractor
Domain-specific Classifier
310-D
𝑺𝟏
𝑺𝑵
𝑻 32-D 3-D/4-D
mmd lossN×
64-D
𝟑 − 𝑳𝒂𝒚𝒆𝒓 𝑴𝑳𝑷
disc.loss
cls. lossN×
predicted labels
ground-truth labels
Fig. 3. The architecture of our proposed method. Our network consists of a common feature extractor, domain-specific feature extractor, and domain-specificclassifier. For each source domain, a branch of DSFE and DSC is conducted for pair-wise domain adaptation. The model receives multiple source domainsand leverages their knowledge to transfer to the target domain.
Domain-specific Classifier uses the features extracted fromthe DSFE to predict the result. In Domain-specific Classifier(DSC), there are N single softmax classifiers that correspondto each source domain. For each classifier training, we choosecross-entropy to estimate the classification loss, as shown in(3). Besides, since there are N classifiers in this module, andthese N classifiers are trained on N source domains, if theirpredictions are simply averaged as the final result, the variancewill be high, especially when the target domain samples are atthe decision boundary, which will have a significant negativeimpact on the results. To reduce this variance, a metric calleddiscrepancy loss is introduced to make the predictions of theN classifiers converge, which is shown in (4). The average ofthe predictions of the N classifiers is taken as the final result.
Lcls =
N∑i=1
Ex∼XSJ(YS
i ,YSi
)(3)
Ldisc =
N∑i6=j
Ex∼Xt
∣∣∣YT
i − YT
j
∣∣∣ (4)
In summary, MS-MDA accepts N source domain EEGdata and one target domain EEG data, and then includes acommon feature extractor to get N source domain features andone target domain feature. Next, N domain-specific featureextractors are used to pairwise compute the MMD loss ofone individual source with the target domain and extract theirdomain-specific features. Finally, a domain-specific classifieris used to do the classification task, which also calculates theclassification loss of the N classifiers using the features, withthe discrepancy loss of the N classifiers for the features of thetarget domain data after the previous N feature extractors.
L = Lcls + αLmmd + βLdisc (5)
The training is based on the (5) and following the algorithmas shown in Algorithm. 1. For the three losses, minimizingMMD loss can get domain-invariant features for each pairof the source and target domains; minimizing classification
loss will bring more accurate classifiers for predicting thesource domain data; minimizing discrepancy loss will get moreconvergent multiple classifiers.
Algorithm 1 Overview of MS-MDAInput:
Iteration T , source domain data {(XSi ,Y
Si )}Ni=1 and target
domain data {XT }1: for t = 1,..., T do2: Take m samples {xSi
j , ySij }mj=1from source domains and
{xTj }mj=1 from target domain.3: {qSi
j }mj=1, {qT } ← CFE({xSij , y
Sij }mj=1, {xTj }mj=1)
4: {rSij }mj=1, {rTj }mj=1 ← DSFE({qSi
j }mj=1, {qT })5: Lmmd ← (2)← DSFE6: {ySi
j }mj=1, {yTj }mj=1,← DSC({rSij }mj=1, {rTj }mj=1)
7: Lcls,Ldisc ← (3)(4)← DSC8: Update model by minimizing the total loss9: end for
10: return {Y T };Output:
Prediction of target domain data, {Y T };
V. EXPERIMENTS
We perform substantial experiments in the task of classifi-cation of emotions on two datasets SEED and SEED-IV, withthe normalization study to the EEG data for domain adapta-tion. Besides, we also conduct some exploratory experimentsin addition to the evaluation of our proposed methods andcomparison methods.
A. Implementation Details
As mentioned in the Section. IV, there are many detailsin the three modules of MS-MDA. First, for the CommonFeature Extractor (CFE), since we do not take raw data (i. e.EEG signals) but the extracted DE features as vectors, complexdeep models such as deep convolutional neural networks arenot suitable for this module, thus we choose 3-layer MLP
6
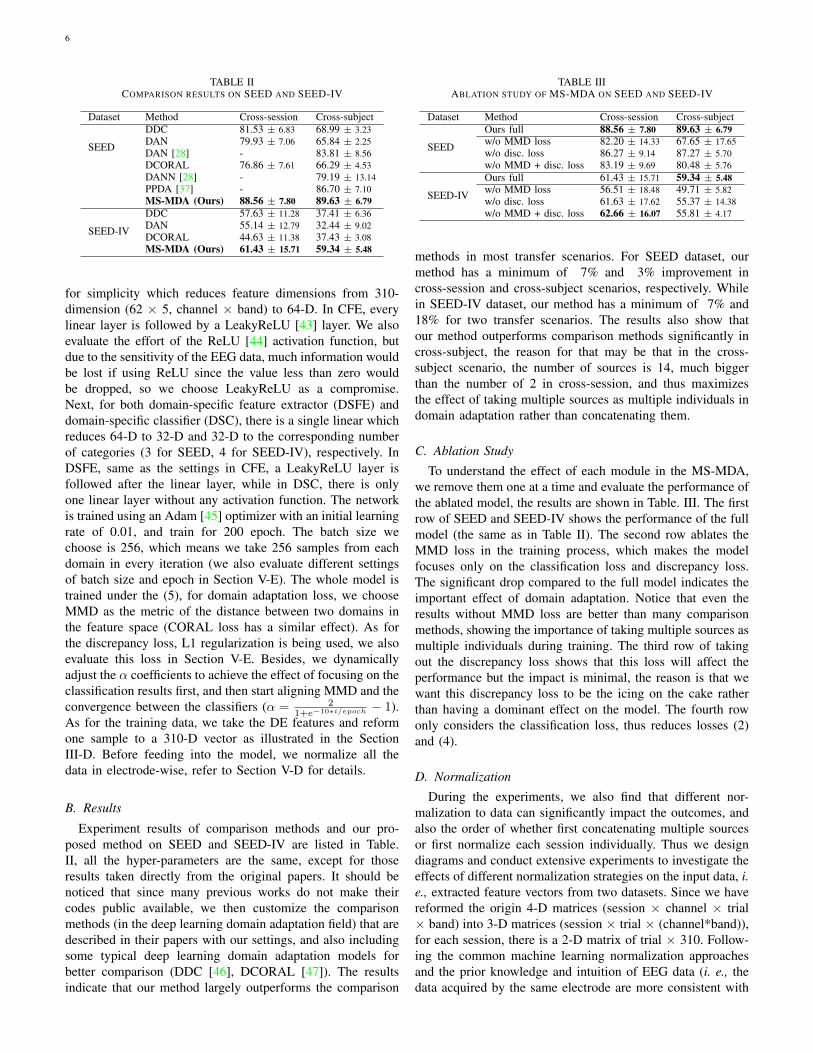
TABLE IICOMPARISON RESULTS ON SEED AND SEED-IV
Dataset Method Cross-session Cross-subject
SEED
DDC 81.53 ± 6.83 68.99 ± 3.23DAN 79.93 ± 7.06 65.84 ± 2.25DAN [28] - 83.81 ± 8.56DCORAL 76.86 ± 7.61 66.29 ± 4.53DANN [28] - 79.19 ± 13.14PPDA [37] - 86.70 ± 7.10MS-MDA (Ours) 88.56 ± 7.80 89.63 ± 6.79
SEED-IV
DDC 57.63 ± 11.28 37.41 ± 6.36DAN 55.14 ± 12.79 32.44 ± 9.02DCORAL 44.63 ± 11.38 37.43 ± 3.08MS-MDA (Ours) 61.43 ± 15.71 59.34 ± 5.48
for simplicity which reduces feature dimensions from 310-dimension (62 × 5, channel × band) to 64-D. In CFE, everylinear layer is followed by a LeakyReLU [43] layer. We alsoevaluate the effort of the ReLU [44] activation function, butdue to the sensitivity of the EEG data, much information wouldbe lost if using ReLU since the value less than zero wouldbe dropped, so we choose LeakyReLU as a compromise.Next, for both domain-specific feature extractor (DSFE) anddomain-specific classifier (DSC), there is a single linear whichreduces 64-D to 32-D and 32-D to the corresponding numberof categories (3 for SEED, 4 for SEED-IV), respectively. InDSFE, same as the settings in CFE, a LeakyReLU layer isfollowed after the linear layer, while in DSC, there is onlyone linear layer without any activation function. The networkis trained using an Adam [45] optimizer with an initial learningrate of 0.01, and train for 200 epoch. The batch size wechoose is 256, which means we take 256 samples from eachdomain in every iteration (we also evaluate different settingsof batch size and epoch in Section V-E). The whole model istrained under the (5), for domain adaptation loss, we chooseMMD as the metric of the distance between two domains inthe feature space (CORAL loss has a similar effect). As forthe discrepancy loss, L1 regularization is being used, we alsoevaluate this loss in Section V-E. Besides, we dynamicallyadjust the α coefficients to achieve the effect of focusing on theclassification results first, and then start aligning MMD and theconvergence between the classifiers (α = 2
1+e−10∗i/epoch − 1).As for the training data, we take the DE features and reformone sample to a 310-D vector as illustrated in the SectionIII-D. Before feeding into the model, we normalize all thedata in electrode-wise, refer to Section V-D for details.
B. Results
Experiment results of comparison methods and our pro-posed method on SEED and SEED-IV are listed in Table.II, all the hyper-parameters are the same, except for thoseresults taken directly from the original papers. It should benoticed that since many previous works do not make theircodes public available, we then customize the comparisonmethods (in the deep learning domain adaptation field) that aredescribed in their papers with our settings, and also includingsome typical deep learning domain adaptation models forbetter comparison (DDC [46], DCORAL [47]). The resultsindicate that our method largely outperforms the comparison
TABLE IIIABLATION STUDY OF MS-MDA ON SEED AND SEED-IV
Dataset Method Cross-session Cross-subject
SEED
Ours full 88.56 ± 7.80 89.63 ± 6.79w/o MMD loss 82.20 ± 14.33 67.65 ± 17.65w/o disc. loss 86.27 ± 9.14 87.27 ± 5.70w/o MMD + disc. loss 83.19 ± 9.69 80.48 ± 5.76
SEED-IV
Ours full 61.43 ± 15.71 59.34 ± 5.48w/o MMD loss 56.51 ± 18.48 49.71 ± 5.82w/o disc. loss 61.63 ± 17.62 55.37 ± 14.38w/o MMD + disc. loss 62.66 ± 16.07 55.81 ± 4.17
methods in most transfer scenarios. For SEED dataset, ourmethod has a minimum of 7% and 3% improvement incross-session and cross-subject scenarios, respectively. Whilein SEED-IV dataset, our method has a minimum of 7% and18% for two transfer scenarios. The results also show thatour method outperforms comparison methods significantly incross-subject, the reason for that may be that in the cross-subject scenario, the number of sources is 14, much biggerthan the number of 2 in cross-session, and thus maximizesthe effect of taking multiple sources as multiple individuals indomain adaptation rather than concatenating them.
C. Ablation Study
To understand the effect of each module in the MS-MDA,we remove them one at a time and evaluate the performance ofthe ablated model, the results are shown in Table. III. The firstrow of SEED and SEED-IV shows the performance of the fullmodel (the same as in Table II). The second row ablates theMMD loss in the training process, which makes the modelfocuses only on the classification loss and discrepancy loss.The significant drop compared to the full model indicates theimportant effect of domain adaptation. Notice that even theresults without MMD loss are better than many comparisonmethods, showing the importance of taking multiple sources asmultiple individuals during training. The third row of takingout the discrepancy loss shows that this loss will affect theperformance but the impact is minimal, the reason is that wewant this discrepancy loss to be the icing on the cake ratherthan having a dominant effect on the model. The fourth rowonly considers the classification loss, thus reduces losses (2)and (4).
D. Normalization
During the experiments, we also find that different nor-malization to data can significantly impact the outcomes, andalso the order of whether first concatenating multiple sourcesor first normalize each session individually. Thus we designdiagrams and conduct extensive experiments to investigate theeffects of different normalization strategies on the input data, i.e., extracted feature vectors from two datasets. Since we havereformed the origin 4-D matrices (session × channel × trial× band) into 3-D matrices (session × trial × (channel*band)),for each session, there is a 2-D matrix of trial × 310. Follow-ing the common machine learning normalization approachesand the prior knowledge and intuition of EEG data (i. e., thedata acquired by the same electrode are more consistent with
7
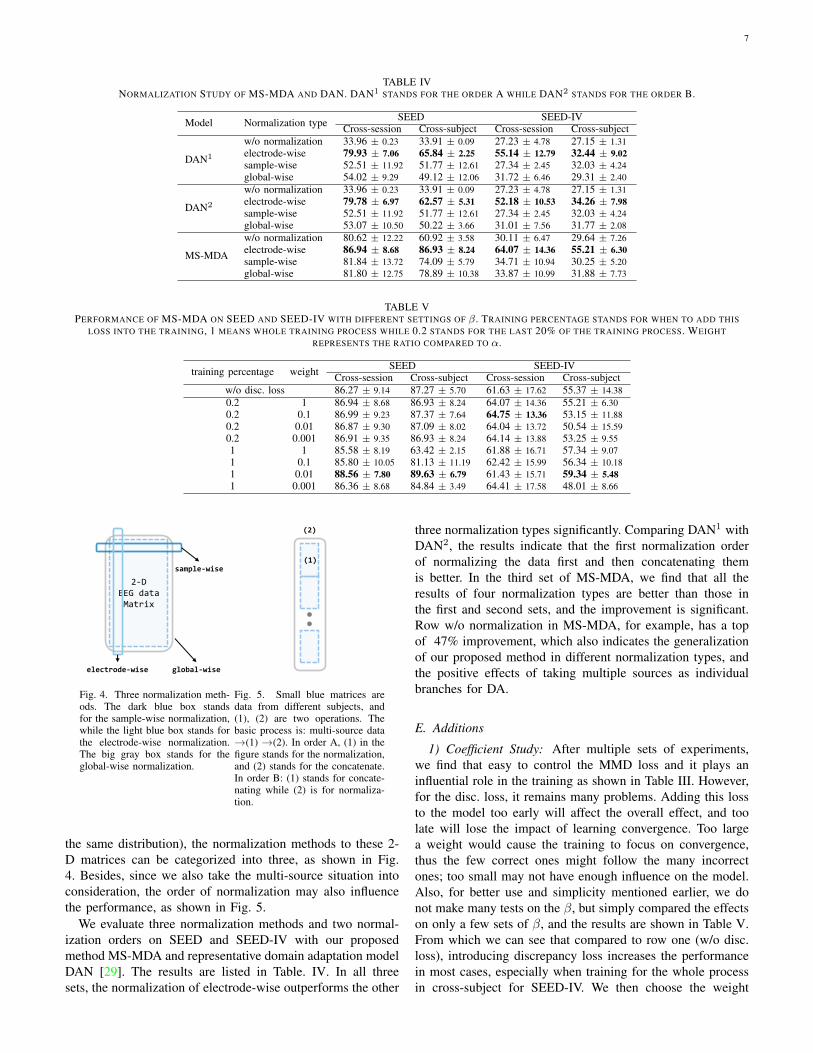
TABLE IVNORMALIZATION STUDY OF MS-MDA AND DAN. DAN1 STANDS FOR THE ORDER A WHILE DAN2 STANDS FOR THE ORDER B.
Model Normalization type SEED SEED-IVCross-session Cross-subject Cross-session Cross-subject
DAN1
w/o normalization 33.96 ± 0.23 33.91 ± 0.09 27.23 ± 4.78 27.15 ± 1.31electrode-wise 79.93 ± 7.06 65.84 ± 2.25 55.14 ± 12.79 32.44 ± 9.02sample-wise 52.51 ± 11.92 51.77 ± 12.61 27.34 ± 2.45 32.03 ± 4.24global-wise 54.02 ± 9.29 49.12 ± 12.06 31.72 ± 6.46 29.31 ± 2.40
DAN2
w/o normalization 33.96 ± 0.23 33.91 ± 0.09 27.23 ± 4.78 27.15 ± 1.31electrode-wise 79.78 ± 6.97 62.57 ± 5.31 52.18 ± 10.53 34.26 ± 7.98sample-wise 52.51 ± 11.92 51.77 ± 12.61 27.34 ± 2.45 32.03 ± 4.24global-wise 53.07 ± 10.50 50.22 ± 3.66 31.01 ± 7.56 31.77 ± 2.08
MS-MDA
w/o normalization 80.62 ± 12.22 60.92 ± 3.58 30.11 ± 6.47 29.64 ± 7.26electrode-wise 86.94 ± 8.68 86.93 ± 8.24 64.07 ± 14.36 55.21 ± 6.30sample-wise 81.84 ± 13.72 74.09 ± 5.79 34.71 ± 10.94 30.25 ± 5.20global-wise 81.80 ± 12.75 78.89 ± 10.38 33.87 ± 10.99 31.88 ± 7.73
TABLE VPERFORMANCE OF MS-MDA ON SEED AND SEED-IV WITH DIFFERENT SETTINGS OF β . TRAINING PERCENTAGE STANDS FOR WHEN TO ADD THIS
LOSS INTO THE TRAINING, 1 MEANS WHOLE TRAINING PROCESS WHILE 0.2 STANDS FOR THE LAST 20% OF THE TRAINING PROCESS. WEIGHTREPRESENTS THE RATIO COMPARED TO α.
training percentage weight SEED SEED-IVCross-session Cross-subject Cross-session Cross-subject
w/o disc. loss 86.27 ± 9.14 87.27 ± 5.70 61.63 ± 17.62 55.37 ± 14.380.2 1 86.94 ± 8.68 86.93 ± 8.24 64.07 ± 14.36 55.21 ± 6.300.2 0.1 86.99 ± 9.23 87.37 ± 7.64 64.75 ± 13.36 53.15 ± 11.880.2 0.01 86.87 ± 9.30 87.09 ± 8.02 64.04 ± 13.72 50.54 ± 15.590.2 0.001 86.91 ± 9.35 86.93 ± 8.24 64.14 ± 13.88 53.25 ± 9.551 1 85.58 ± 8.19 63.42 ± 2.15 61.88 ± 16.71 57.34 ± 9.071 0.1 85.80 ± 10.05 81.13 ± 11.19 62.42 ± 15.99 56.34 ± 10.181 0.01 88.56 ± 7.80 89.63 ± 6.79 61.43 ± 15.71 59.34 ± 5.481 0.001 86.36 ± 8.68 84.84 ± 3.49 64.41 ± 17.58 48.01 ± 8.66
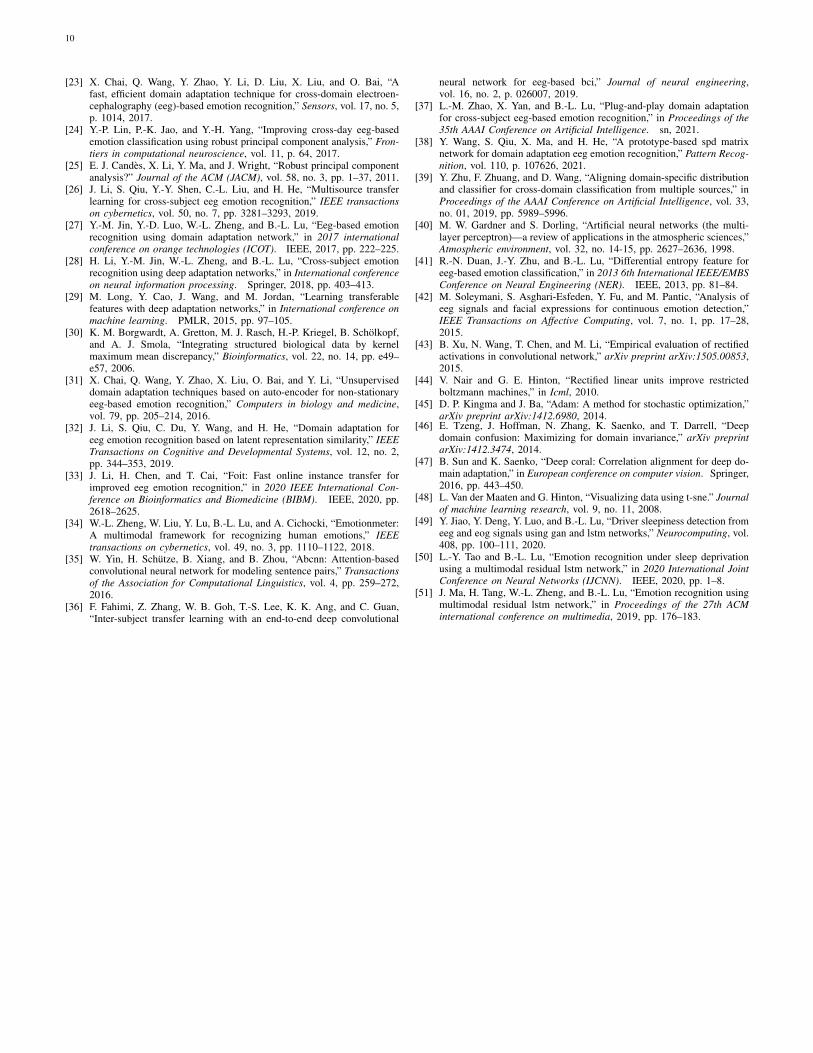
2-DEEG dataMatrix
sample-wise
electrode-wise global-wise
Fig. 4. Three normalization meth-ods. The dark blue box standsfor the sample-wise normalization,while the light blue box stands forthe electrode-wise normalization.The big gray box stands for theglobal-wise normalization.
(1)
(2)
Fig. 5. Small blue matrices aredata from different subjects, and(1), (2) are two operations. Thebasic process is: multi-source data→(1) →(2). In order A, (1) in thefigure stands for the normalization,and (2) stands for the concatenate.In order B: (1) stands for concate-nating while (2) is for normaliza-tion.
the same distribution), the normalization methods to these 2-D matrices can be categorized into three, as shown in Fig.4. Besides, since we also take the multi-source situation intoconsideration, the order of normalization may also influencethe performance, as shown in Fig. 5.
We evaluate three normalization methods and two normal-ization orders on SEED and SEED-IV with our proposedmethod MS-MDA and representative domain adaptation modelDAN [29]. The results are listed in Table. IV. In all threesets, the normalization of electrode-wise outperforms the other
three normalization types significantly. Comparing DAN1 withDAN2, the results indicate that the first normalization orderof normalizing the data first and then concatenating themis better. In the third set of MS-MDA, we find that all theresults of four normalization types are better than those inthe first and second sets, and the improvement is significant.Row w/o normalization in MS-MDA, for example, has a topof 47% improvement, which also indicates the generalizationof our proposed method in different normalization types, andthe positive effects of taking multiple sources as individualbranches for DA.
E. Additions
1) Coefficient Study: After multiple sets of experiments,we find that easy to control the MMD loss and it plays aninfluential role in the training as shown in Table III. However,for the disc. loss, it remains many problems. Adding this lossto the model too early will affect the overall effect, and toolate will lose the impact of learning convergence. Too largea weight would cause the training to focus on convergence,thus the few correct ones might follow the many incorrectones; too small may not have enough influence on the model.Also, for better use and simplicity mentioned earlier, we donot make many tests on the β, but simply compared the effectson only a few sets of β, and the results are shown in Table V.From which we can see that compared to row one (w/o disc.loss), introducing discrepancy loss increases the performancein most cases, especially when training for the whole processin cross-subject for SEED-IV. We then choose the weight

8
(a) MS-MDA with different batch size (b) DAN with different batch size
(c) MS-MDA with different epochs (d) DAN with different epochs
Fig. 6. Evaluation of MS-MDA and DAN with different batch size and epochs.Each bar stands for one cross scenario for one dataset.
of 0.01 and training discrepancy loss for the whole processaccording to the results.
2) Hyper-parameters and Data Visualization: To better in-vestigating our proposed method, we evaluate it with differenthyper-parameters, besides, we also take the representativemethod DAN as the comparison. The results are shown in Fig.6 and Fig. 7. From them we can see that, with the increase ofbatch size, both models show a drop in performance, especiallywhen the batch size is 512, which has a significant decreasecompared to 256 on SEED-IV. Besides, with the training epochincreases, neither model has a substantial improvement, espe-cially MS-MDA, but our method achieves moderate accuracyand converges faster. Comparing cross-subject experiments ontwo datasets, it can be significantly seen that MS-MDA has aclear advantage over DAN, which indirectly shows that ourapproach has a more significant performance improvementfor multiple source domain adaptation in EEG-based emotionrecognition.
For a better understanding of the effect of our proposedmethod, we randomly pick 100 EEG samples from eachsubject (domain) in the scenario of cross-subject to visualizewith t-SNE [48], as displayed in Fig. 8. We only plot the cross-subject since this transfer scenario has more sources that willmaximize visualization. In the Fig. 8, each color stands for asource domain, and the target domain are in black. To betterplotting, we transparent the target sample to avoid overlap. Itshould be noticed that in the lower left figure, we pick 1400samples since we concatenate all sources into one.
VI. DISCUSSION
As can be seen from Table II, comparing the results ofselective methods and prior works, our proposed methodhas a significant improvement, especially for cross-subjectDA in which the number of source domains is large. Theablation experiments from Table V-C also show that ourproposed method requires both MMD and discrepancy loss
(a) Batch size (b) Epoch
Fig. 7. Evaluation of MS-MDA and DAN with different settings of batchsize and epochs. Each line stands for one cross scenario for one dataset.
一·
云?
, I
.
. .
.
.
.
..
夕·.“. `·
`' I
,,5六••.
.、J
-
I
爷1_
_
• _次
,
二
f.』
;'
7
节汇牙恤.尸
r .“`vs ·· 硬 I 鹹
吝.. .
... ;1
,_
沁左
x
X j
.
y
`
Fig. 8. Visualization with t-SNE for raw data (upper left), normalization data(upper right), data using DAN (lower left), and data using MS-MDA (lowerright). The input data of the last fully-connected (DSC) layer are used for thecomputation of the t-SNE. Target data are in the shape of X with black, allother 14 source data are in 14 colors. Notice that since we have concatenatedall the source domains, the lower left figure has only one color for the sourcedomain. All four figures are best viewed in color.
in most cases. Eliminating the MMD loss has a significantperformance drop on both datasets, confirming the importanceof DA, and eliminating disc. loss does not have as large animpact as MMD loss, but also verifies the help of multi-source convergence. Also, during the experiments, we findthat the type of normalization of the data has a significantimpact on the overall results, so we also design experimentsand explore the normalization of EEG data in DA to helpimprove the performance of our model. As can be seen inTable V-D, there is not much difference between the twonormalization orders, and it is most appropriate to do datanormalization on the electrode-wise, which has a crushing per-formance improvement compared to the other three methods;for our method, which does not concatenate data, electrodenormalization is also the most effective. This conclusion isin line with our intuition that data collected from the sameelectrode are relatively more regular or conform to a certaindistribution, while data collected from different electrodes arevery different. In addition, during the experiments, we findthat the disc. loss needs to be carefully adjusted, otherwise itis easy to cause harmful effects, which we guess is becausethis loss introduces a convergence effect on multiple classifiersin the model (in other words, smooth the inferences madefrom multiple classifiers), and if most of the classifiers are

9
wrong, this convergence effect will cause the correct classifiersto error. Therefore, we also test and evaluate the impact of thedisc. loss coefficients on the model at different settings, andfrom Table V, we can see that the disc. loss achieves the bestresults if it is set to 0.01 times the MMD loss coefficient andis being used in the full model training.
After exploring the internal details of the model, we alsoevaluated the performance of the model under different hyper-parameters. For better comparison, we chose a representativeDAN as the comparison method. From Fig. 6 and Fig. 7, wecan see that both models have a significant decrease as thebatch size is increased. The reason for this we assume is thatsmall batch size tends to fall into local optimal overfitting.The performance of both models increases slightly with epoch.From Figs. 6 and 7, we can also clearly see that MS-MDA hasa significant advantage over DAN in cross-subject DA wherethe number of multiple source domains is large, which alsoconfirms the importance of constructing multiple branches formultiple source domains to adopt DA separately.
Although it is clear from the results that our proposedmethod has a significant performance improvement, we alsofound that the training time consumed increases linearly withthe number of source domains, i.e., the larger the numberof source domains and the larger the model, the longer thetraining takes, unlike concatenating all source data into one,where there is only additional time due to the increase in theamount of data. For this problem, our current idea is to discardsome less relevant source domains selectively and not buildDA branches for them, allowing the disc. loss to play a moreprominent role because there is less negative information. Inaddition, the encoders in the current model are the simplestMLP, and many literature and works have verified the usabilityof LSTM for EEG data [49], [50], [51], and we will considerswitching to use LSTM as the encoders in future works.
VII. CONCLUSION
In this paper, we propose MS-MDA, an EEG-based emotionrecognition domain adaptation method, which is applicableto multiple source domain situations. Through experimentalevaluation, we find that this method has a better ability to adaptto multiple source domains, which is validated by comparisonwith the selective approaches and the SOTA models, especiallyfor cross-subject experiments where our proposed methodconsists of up to 20% improvement. In addition, we alsoexplore the impact of different normalization methods for EEGdata in domain adaptation, which we believe can serve asan inspiration for other EEG-based works while improvingthe effectiveness of the models. As for our future work, thecurrent model for multiple source domains is to construct aDA branch for each of them without selection, which willincrease the model size and training time exponentially, andalso introduces information from the source domain that is notrelevant to the target into the model. A more efficient approachmay be to selectively build DA branches from a reservoir ofsource domains, allowing the model to be more efficient whileonly focusing on the source domain information that is relevantto the target domain.
REFERENCES
[1] R. J. Dolan, “Emotion, cognition, and behavior,” science, vol. 298, no.5596, pp. 1191–1194, 2002.
[2] C. M. Tyng, H. U. Amin, M. N. Saad, and A. S. Malik, “The influencesof emotion on learning and memory,” Frontiers in psychology, vol. 8,p. 1454, 2017.
[3] M. Jeon, “Emotions and affect in human factors and human–computerinteraction: Taxonomy, theories, approaches, and methods,” in Emotionsand affect in human factors and human-computer interaction. Elsevier,2017, pp. 3–26.
[4] N. Birbaumer, “Breaking the silence: brain–computer interfaces (bci) forcommunication and motor control,” Psychophysiology, vol. 43, no. 6, pp.517–532, 2006.
[5] S.-H. Lee, M. Lee, J.-H. Jeong, and S.-W. Lee, “Towards an eeg-basedintuitive bci communication system using imagined speech and visualimagery,” in 2019 IEEE International Conference on Systems, Man andCybernetics (SMC). IEEE, 2019, pp. 4409–4414.
[6] A. Frisoli, C. Loconsole, D. Leonardis, F. Banno, M. Barsotti, C. Chisari,and M. Bergamasco, “A new gaze-bci-driven control of an upper limbexoskeleton for rehabilitation in real-world tasks,” IEEE Transactionson Systems, Man, and Cybernetics, Part C (Applications and Reviews),vol. 42, no. 6, pp. 1169–1179, 2012.
[7] L. F. Barrett, J. Gross, T. C. Christensen, and M. Benvenuto, “Knowingwhat you’re feeling and knowing what to do about it: Mapping the rela-tion between emotion differentiation and emotion regulation,” Cognition& Emotion, vol. 15, no. 6, pp. 713–724, 2001.
[8] J. Joormann and I. H. Gotlib, “Emotion regulation in depression:Relation to cognitive inhibition,” Cognition and Emotion, vol. 24, no. 2,pp. 281–298, 2010.
[9] R. S. Bucks and S. A. Radford, “Emotion processing in alzheimer’sdisease,” Aging & mental health, vol. 8, no. 3, pp. 222–232, 2004.
[10] P. Ekman, “Facial expression and emotion.” American psychologist,vol. 48, no. 4, p. 384, 1993.
[11] B. Ay, O. Yildirim, M. Talo, U. B. Baloglu, G. Aydin, S. D. Puthankattil,and U. R. Acharya, “Automated depression detection using deep repre-sentation and sequence learning with eeg signals,” Journal of medicalsystems, vol. 43, no. 7, pp. 1–12, 2019.
[12] S. Sanei and J. A. Chambers, EEG signal processing. John Wiley &Sons, 2013.
[13] U. R. Acharya, V. K. Sudarshan, H. Adeli, J. Santhosh, J. E. Koh, andA. Adeli, “Computer-aided diagnosis of depression using eeg signals,”European neurology, vol. 73, no. 5-6, pp. 329–336, 2015.
[14] Y. Liu, H. Zhang, M. Chen, and L. Zhang, “A boosting-based spatial-spectral model for stroke patients’ eeg analysis in rehabilitation training,”IEEE Transactions on Neural Systems and Rehabilitation Engineering,vol. 24, no. 1, pp. 169–179, 2015.
[15] C. Jiang, Y. Li, Y. Tang, and C. Guan, “Enhancing eeg-based classifica-tion of depression patients using spatial information,” IEEE Transactionson Neural Systems and Rehabilitation Engineering, vol. 29, pp. 566–575,2021.
[16] B. Zhang, G. Yan, Z. Yang, Y. Su, J. Wang, and T. Lei, “Brain functionalnetworks based on resting-state eeg data for major depressive disorderanalysis and classification,” IEEE Transactions on Neural Systems andRehabilitation Engineering, vol. 29, pp. 215–229, 2020.
[17] B. Hosseinifard, M. H. Moradi, and R. Rostami, “Classifying depressionpatients and normal subjects using machine learning techniques andnonlinear features from eeg signal,” Computer methods and programsin biomedicine, vol. 109, no. 3, pp. 339–345, 2013.
[18] S. J. Pan and Q. Yang, “A survey on transfer learning,” IEEE Trans-actions on knowledge and data engineering, vol. 22, no. 10, pp. 1345–1359, 2009.
[19] W.-L. Zheng and B.-L. Lu, “Investigating critical frequency bands andchannels for eeg-based emotion recognition with deep neural networks,”IEEE Transactions on Autonomous Mental Development, vol. 7, no. 3,pp. 162–175, 2015.
[20] S. Koelstra, C. Muhl, M. Soleymani, J.-S. Lee, A. Yazdani, T. Ebrahimi,T. Pun, A. Nijholt, and I. Patras, “Deap: A database for emotion analysis;using physiological signals,” IEEE transactions on affective computing,vol. 3, no. 1, pp. 18–31, 2011.
[21] W.-L. Zheng and B.-L. Lu, “Personalizing eeg-based affective modelswith transfer learning,” in Proceedings of the twenty-fifth internationaljoint conference on artificial intelligence, 2016, pp. 2732–2738.
[22] S. J. Pan, I. W. Tsang, J. T. Kwok, and Q. Yang, “Domain adaptationvia transfer component analysis,” IEEE transactions on neural networks,vol. 22, no. 2, pp. 199–210, 2010.
10
[23] X. Chai, Q. Wang, Y. Zhao, Y. Li, D. Liu, X. Liu, and O. Bai, “Afast, efficient domain adaptation technique for cross-domain electroen-cephalography (eeg)-based emotion recognition,” Sensors, vol. 17, no. 5,p. 1014, 2017.
[24] Y.-P. Lin, P.-K. Jao, and Y.-H. Yang, “Improving cross-day eeg-basedemotion classification using robust principal component analysis,” Fron-tiers in computational neuroscience, vol. 11, p. 64, 2017.
[25] E. J. Candes, X. Li, Y. Ma, and J. Wright, “Robust principal componentanalysis?” Journal of the ACM (JACM), vol. 58, no. 3, pp. 1–37, 2011.
[26] J. Li, S. Qiu, Y.-Y. Shen, C.-L. Liu, and H. He, “Multisource transferlearning for cross-subject eeg emotion recognition,” IEEE transactionson cybernetics, vol. 50, no. 7, pp. 3281–3293, 2019.
[27] Y.-M. Jin, Y.-D. Luo, W.-L. Zheng, and B.-L. Lu, “Eeg-based emotionrecognition using domain adaptation network,” in 2017 internationalconference on orange technologies (ICOT). IEEE, 2017, pp. 222–225.
[28] H. Li, Y.-M. Jin, W.-L. Zheng, and B.-L. Lu, “Cross-subject emotionrecognition using deep adaptation networks,” in International conferenceon neural information processing. Springer, 2018, pp. 403–413.
[29] M. Long, Y. Cao, J. Wang, and M. Jordan, “Learning transferablefeatures with deep adaptation networks,” in International conference onmachine learning. PMLR, 2015, pp. 97–105.
[30] K. M. Borgwardt, A. Gretton, M. J. Rasch, H.-P. Kriegel, B. Scholkopf,and A. J. Smola, “Integrating structured biological data by kernelmaximum mean discrepancy,” Bioinformatics, vol. 22, no. 14, pp. e49–e57, 2006.
[31] X. Chai, Q. Wang, Y. Zhao, X. Liu, O. Bai, and Y. Li, “Unsuperviseddomain adaptation techniques based on auto-encoder for non-stationaryeeg-based emotion recognition,” Computers in biology and medicine,vol. 79, pp. 205–214, 2016.
[32] J. Li, S. Qiu, C. Du, Y. Wang, and H. He, “Domain adaptation foreeg emotion recognition based on latent representation similarity,” IEEETransactions on Cognitive and Developmental Systems, vol. 12, no. 2,pp. 344–353, 2019.
[33] J. Li, H. Chen, and T. Cai, “Foit: Fast online instance transfer forimproved eeg emotion recognition,” in 2020 IEEE International Con-ference on Bioinformatics and Biomedicine (BIBM). IEEE, 2020, pp.2618–2625.
[34] W.-L. Zheng, W. Liu, Y. Lu, B.-L. Lu, and A. Cichocki, “Emotionmeter:A multimodal framework for recognizing human emotions,” IEEEtransactions on cybernetics, vol. 49, no. 3, pp. 1110–1122, 2018.
[35] W. Yin, H. Schutze, B. Xiang, and B. Zhou, “Abcnn: Attention-basedconvolutional neural network for modeling sentence pairs,” Transactionsof the Association for Computational Linguistics, vol. 4, pp. 259–272,2016.
[36] F. Fahimi, Z. Zhang, W. B. Goh, T.-S. Lee, K. K. Ang, and C. Guan,“Inter-subject transfer learning with an end-to-end deep convolutional
neural network for eeg-based bci,” Journal of neural engineering,vol. 16, no. 2, p. 026007, 2019.
[37] L.-M. Zhao, X. Yan, and B.-L. Lu, “Plug-and-play domain adaptationfor cross-subject eeg-based emotion recognition,” in Proceedings of the35th AAAI Conference on Artificial Intelligence. sn, 2021.
[38] Y. Wang, S. Qiu, X. Ma, and H. He, “A prototype-based spd matrixnetwork for domain adaptation eeg emotion recognition,” Pattern Recog-nition, vol. 110, p. 107626, 2021.
[39] Y. Zhu, F. Zhuang, and D. Wang, “Aligning domain-specific distributionand classifier for cross-domain classification from multiple sources,” inProceedings of the AAAI Conference on Artificial Intelligence, vol. 33,no. 01, 2019, pp. 5989–5996.
[40] M. W. Gardner and S. Dorling, “Artificial neural networks (the multi-layer perceptron)—a review of applications in the atmospheric sciences,”Atmospheric environment, vol. 32, no. 14-15, pp. 2627–2636, 1998.
[41] R.-N. Duan, J.-Y. Zhu, and B.-L. Lu, “Differential entropy feature foreeg-based emotion classification,” in 2013 6th International IEEE/EMBSConference on Neural Engineering (NER). IEEE, 2013, pp. 81–84.
[42] M. Soleymani, S. Asghari-Esfeden, Y. Fu, and M. Pantic, “Analysis ofeeg signals and facial expressions for continuous emotion detection,”IEEE Transactions on Affective Computing, vol. 7, no. 1, pp. 17–28,2015.
[43] B. Xu, N. Wang, T. Chen, and M. Li, “Empirical evaluation of rectifiedactivations in convolutional network,” arXiv preprint arXiv:1505.00853,2015.
[44] V. Nair and G. E. Hinton, “Rectified linear units improve restrictedboltzmann machines,” in Icml, 2010.
[45] D. P. Kingma and J. Ba, “Adam: A method for stochastic optimization,”arXiv preprint arXiv:1412.6980, 2014.
[46] E. Tzeng, J. Hoffman, N. Zhang, K. Saenko, and T. Darrell, “Deepdomain confusion: Maximizing for domain invariance,” arXiv preprintarXiv:1412.3474, 2014.
[47] B. Sun and K. Saenko, “Deep coral: Correlation alignment for deep do-main adaptation,” in European conference on computer vision. Springer,2016, pp. 443–450.
[48] L. Van der Maaten and G. Hinton, “Visualizing data using t-sne.” Journalof machine learning research, vol. 9, no. 11, 2008.
[49] Y. Jiao, Y. Deng, Y. Luo, and B.-L. Lu, “Driver sleepiness detection fromeeg and eog signals using gan and lstm networks,” Neurocomputing, vol.408, pp. 100–111, 2020.
[50] L.-Y. Tao and B.-L. Lu, “Emotion recognition under sleep deprivationusing a multimodal residual lstm network,” in 2020 International JointConference on Neural Networks (IJCNN). IEEE, 2020, pp. 1–8.
[51] J. Ma, H. Tang, W.-L. Zheng, and B.-L. Lu, “Emotion recognition usingmultimodal residual lstm network,” in Proceedings of the 27th ACMinternational conference on multimedia, 2019, pp. 176–183.