Embed Size (px)
Citation preview
[1]
PROJECT REPORT
Development of Empirical Models for
Air Quality Parameters using
instruments and geospatial technology
in Haryana
December, 2020
Haryana Space Applications Centre (HARSAC)
Citizen Resource Information Department (CRID),
CCS HAU Campus, HISAR , Haryana 125004

[2]
PROJECT REPORT
Development of Empirical Models for Air
Quality Parameters Using Instruments and
Geospatial Technology In Haryana
Project Head
Dr. Dharmendra Singh,
Assistant Scientist(Ecology/Environment), HARSAC Node, Gurugram, Haryana

[3]
Table of Contents
1 Project Background ............................................................................................................... 5
2 Major Objectives.................................................................................................................... 8
3 Material and Methods ........................................................................................................... 8
3.1 Study Area ................................................................................................... 8
3.2 Data Description ........................................................................................10
3.2.1 Aerosol Optical Depth (satellite data) ...................................................10
3.2.2 Ground based PM2.5 and PM10............................................................12
3.2.3 Meteorological Parameters ....................................................................14
3.2.4 Auxiliary Data .......................................................................................15
3.3 Methodology ..............................................................................................16
3.3.1 Ground based AOD observation data processing ..................................16
3.3.2 Data processing for the Ground based CPCB data ................................18
3.3.3 Model Fitting and Description ...............................................................18
4 Results and Discussions ....................................................................................................... 20
4.1 Validation of Satellite AOD from Ground based AOD ............................20
4.2 Statistical representation of Estimated Particulate Matter (PM) ...............22
4.3 Spatio-temporal estimated PM10 and PM2.5 ............................................25
4.4 Validation using Predicted PM and Ground based PM .............................56
5 Conclusion ............................................................................................................................ 56
6 References ............................................................................................................................. 58
ANNEXURE I ............................................................................................................................. 62
ANNEXURE II ............................................................................................................................ 64
ANNEXURE III .......................................................................................................................... 76

[4]
List of Figure
Figure 3.1. Study area (Haryana region) ....................................................................................... 10
Figure 3.2. Methodology Flow Chart. .......................................................................................... 17
Figure 3.3. Statistical results showing the best fitted model among the used models .................. 19
Figure 4.1. Correlation graphs (a) Amity University, Gurugram and (b) Gual Pahari, Gurugram.
....................................................................................................................................................... 21
Figure 4.2. Monthly spatial distribution of PM2.5 for the year 2016 over Haryana .................... 27
Figure 4.3. Monthly spatial distribution of PM2.5 for the year 2017 over Haryana .................... 30
Figure 4.4. Monthly spatial distribution of PM2.5 for the year 2018 over Haryana. ................... 33
Figure 4.5. Monthly spatial distribution of PM2.5 for the year 2019 over Haryana. ................... 36
Figure 4.6. Monthly spatial distribution of PM2.5 for the year 2019 over Haryana. ................... 39
Figure 4.7. Monthly spatial distribution of PM10 for the year 2016 over Haryana. .................... 43
Figure 4.8. Monthly spatial distribution of PM10 for the year 2017 over Haryana. .................... 46
Figure 4.9. Monthly spatial distribution of PM10 for the year 2018 over Haryana. .................... 49
Figure 4.10. Monthly spatial distribution of PM10 for the year 2019 over Haryana. .................. 52
Figure 4.11. Monthly spatial distribution of PM2.5 for the year 2019 over Haryana. ................. 55
List of Tables
Table 1.1. National Ambient Air Quality Index Standard (NAAQS), New Delhi 2009. .............. 6
Table 3.1. Characteristics of MODIS Channels used in the Aerosol Retrieval ............................ 11
Table 3.2. List of cities and station for ground-based PM data collection for Haryana. .............. 13
Table 3.3. List of meteorological parameter for estimation of PM .............................................. 14
Table 3.4. List of AERONET stations for Haryana, India............................................................ 15
Table 4.1. Statistical results from Pearson’s Correlation and T-test............................................. 22
Table 4.2. Estimated PM 2.5 composite monthly average for Year 2016 to 2020 at Ground
Station points .............................................................................................................. 23
Table 4.3. Estimated PM 10 composite monthly average for Year 2016 to 2020 at Ground
Station points .............................................................................................................. 24
Table 4.4. PM10 and PM2.5 GLM Model details and description. .............................................. 56

[5]
1. Project Background
Prominent concentration of air pollution and its associated health effects in rapidly growing
megacities of developing countries particularly that of India and China have drawn our attention
in recent years. Therefore, it is critically vital to monitor air quality at high spatial–temporal
resolutions. But limited network of air pollution monitoring in developing countries restricts our
ability to evaluate time–space dynamics of air pollution and its effect on human health.
Nonetheless, advances in satellite remote sensing seems promising to compute indirect estimates
of air particles ≤2.5 μm and those of >2.5 to ≤10 μm in aerodynamic diameters (PM2.5 and
PM10, respectively) over a large area frequently and inexpensively (Chu et al. 2003). Satellite
imageries record electromagnetic radiation, reflected/emitted from the earth surface. When the
radiation travels through the atmosphere, it interacts with aerosols fine solid and/or liquid
particles suspended in the air prior to reaching the sensor mounted onto satellites. The distortion
caused by this interaction can be estimated with the aid of radiative transfer model and converted
into aerosol loading, also known as aerosol optical depth (AOD), which has shown a strong
positive relationship with the PM2.5 and PM10 observed on the surface (Chu 2006, Chu et al.
2002, Gupta et al. 2006).
Atmospheric aerosol has always been an important part in the scientific research of air quality
and environment due to its role in global climatic and environmental changes. Atmospheric
aerosol particles, particularly PM2.5 (particle matter, PM) and PM10 also known as particle
pollution is a complex but stable gaseous suspension of liquid droplets and solid particles in the
earth’s atmosphere. They reduce visibility and are serious hazards to human health. These are
important indexes to evaluate air quality.
In recent years, Haryana has suffered from the deterioration of air quality with the development,
rapid urbanization and industrialization. Fine particulate matter with an aerodynamic diameter
less than 2.5 μm (PM2.5) was a major component of the severe air pollution. Many
epidemiological studies showed that PM2.5 is associated with various adverse human health
effects, such as respiratory problems and cardiovascular diseases, and can penetrate into human
lungs and bronchi. The economic costs of particulate pollution on a country can be significant.
Air pollution not only affects the health of living being but also the health of the economy of

[6]
countries. In the European Union in 2015, the cost of air pollution-related deaths was reported to
be over US$1.4 trillion. In Israel, it is estimated that 2500 people a year die as a result of
exposure to air pollutants. In New Zealand with the population of 4/4 million, it was reported
that, despite relatively low air pollution when compared with other members of the Organisation
for Economic Co-operation and Development, during 2012 a total of 1370 deaths, 830 hospital
admissions and 2.55 million restricted activity days were linked to PM10 pollution. Even low
levels of PM10 have been found to be affecting human health significantly (Soni, Payra, and
Verma 2018).
As per a recent article in Hindustan Times it was stated that, due to high anthropogenic activities,
a blanket of haze engulfed Haryana as several districts in the states reported air quality index in
severe and very poor categories for the month of November – December 2019. Jind was the
worst-affected with average air quality index (AQI) of 480, followed by Faridabad (479),
Gurugram (469), Rohtak (467) Bhiwani (466), Sirsa (462), Hisar (458), Kaithal (448),
Ballabhgarh (438), Bahadurgarh (435), Manesar (427), Panipat (421) and Karnal (407), all under
severe category. National Ambient Air Quality Standards (NAAQS), Gazette of India, New
Delhi, India, 2009, which is based on health impacts caused by air pollutants, the air quality is
classified as Good, Satisfactory, Moderately Polluted, Poor, Very Poor and Severe, the same is
shown in Table 1.1.
Table 1.1. National Ambient Air Quality Index Standard (NAAQS), New Delhi 2009.
AQI Associated Health Impacts
Good
(0–50)
Minimal Impact
Satisfactory
(51–100)
May cause minor breathing discomfort to sensitive people.
Moderately
polluted
(101–200)
May cause breathing discomfort to people with lung disease such as
asthma, and discomfort to people with heart disease, children and older
adults.
Poor May cause breathing discomfort to people on prolonged exposure, and

[7]
(201–300) discomfort to people with heart disease
Very Poor
(301–400)
May cause respiratory illness to the people on prolonged exposure.
Effect may be more pronounced in people with lung and heart diseases.
Severe
(401-500)
May cause respiratory impact even on healthy people, and serious
health impacts on people with lung/heart disease. The health impacts
may be experienced even during light physical activity.
Fine particles in general are estimated based on the correlation between AOD and ground-based
PM2.5 (Engel-Cox et al. 2004, Hu et al. 2014). Many satellite instruments, such as the Moderate
Resolution Imaging Spectroradiometer (MODIS), the multi-angle imaging spectroradiometer
(MISR), the Medium Resolution Spectrum Imager (MERSI), and the Ozone Monitoring
Instrument (OMI), have set bands to retrieve AOD (Xia et al. 2019, Ali et al. 2019, Jin et al.
2019, Zhang et al. 2015). Scholars proposed and improved a variety of methods, such as simple
linear regression models, General Additive Model (GAM) models, General Linear Regression
(GLR) models, and machine-learning methods, to establish the relationship between ground-
level PM2.5 and AOD (Engel-Cox et al. 2004, Guo et al. 2017, Hu et al. 2014, Chu et al. 2016,
Sorek-Hamer et al. 2013). Wang and Christopher (2003) used a very simple linear model to
explain the relationship between AOD and PM2.5 in Jefferson County, Alabama, for 2002, and
obtained an R value of 0.7 (Wang and Christopher 2003). Lee et al. (2011) used the LME model
to estimate PM2.5 in the New England region for 2003 and obtained an R2 value of 0.92 (Lee et
al. 2011). Hu et al. (2013) developed a GWR model to explain the relationships among PM2.5,
AOD, meteorological parameters, and land-use information (Hu et al. 2013). Sorek-Hamer et al.
(2013) used the GAM model to estimate PM2.5 over the San Joaquin Valley (CA) for 2013 and
obtained an R2 value of 0.72 (Sorek-Hamer et al. 2013). Lary et al. combined AOD,
meteorological data, and PM2.5 to estimate daily PM2.5 values from 1997 to 2014 using a
machine-learning algorithm (Lary et al. 2014).
These types of studies have been carried out for the estimation of Particulate matter from satellite
and AErosol RObotic NETwork (AERONET) based Aerosol Optical Depth (AOD). It has been
explored in studies and resulting in estimation of PM2.5. In one of the study by Chen et al. where
AERONET data been used for PM estimation with R2 value of 0.70 over Mid-Eastern China

[8]
(Chen et al. 2018). In our study we have used AERONET based ground AOD and CPCB based
ground PM for the validation and accuracy analysis. Xie et al. estimated daily ground based
PM2.5 over Beijing China with R2 of 0.82-0.83. The estimation was based on the temporal
variation of PM with respect to satellite AOD (Xie et al. 2015). The basic monologue of our
study is to try and explore the relationship between PM and AOD over Haryana state and also
their impact and contribution in the atmospheric pollution.
2. Major Objectives
The prime objective of our study is
Generating empirical models for estimation of air quality parameters (mainly PM10
and PM2.5) over Haryana region.
Additional outputs were obtained by adding three complementary objectives beyond the project
scopes are:
Temporal and spatial variation of particulate matter over Haryana for at least half a
decade.
Validation and Accuracy assessment of the empirical models generated with respect to
ground-based PM and AOD collected over Haryana region.
Utilise web facilities to propagate project outputs
3. Material and Methods
3.1 Study Area
The Haryana region is situated in north-central India. It is bounded on the northwest by the state
of Punjab and the union territory of Chandigarh, on the north and northeast by the states of
Himachal Pradesh and Uttarakhand, on the east by the state of Uttar Pradesh and the union
territory of Delhi, and on the south and southwest by the state of Rajasthan. The city of
Chandigarh, within the Chandigarh union territory, serves as the capital of not only that territory
but also of the states of Haryana and Punjab. The geographical extent is between 27°39' to 30°35'

[9]
N latitude and between 74°28' and 77°36' E longitude. Geographical area of the state is 44,212
square km with a total population of 25,350,000. It has two major physiographic regions, the flat
alluvial plain covering most of the state and is drained by only one perennial river, the Yamuna,
located on the state’s eastern border, In the northeast, a strip of the highly dissected Siwalik
(Shiwalik) Range (including the narrow foothill zone), many seasonal streams flowing from the
Siwalik Range pass through the area, however, the most notable of these is the Ghaggar (near the
state’s northern boundary), which once flowed far enough to join the Indus River, in what is now
Pakistan. Remnants of the Aravalli Range, which stretches from south-western Rajasthan to
Delhi, are evident in parts of southern Haryana. The climate of Haryana is hot in the summer and
markedly cold in winter; maximum temperatures in May and June may exceed 43°C, and in
January, the coldest month, low temperatures may drop below the freezing point. Therefore, this
region is in arid to semiarid conditions; only in the northeast are conditions relatively humid.
Haryana is agrarian state of India and most of the people are engaged in the agriculture related
activities. The major crops of Haryana include Wheat, Rice, Cotton, Sugarcane, Jawar, Bajara
and Mustard among others. Most of the agriculture practices are mechanised in Haryana due to
which the crop residue produced after harvest is left as such and is burnt in open field at later
stage. Utilising mechanised farming practices and leaving crop residue in the field which get
burnt and creates pollution. Furthermore, the region is a major industrial and commercial hub in
India. Because of rapid economic development over the last two decades, high concentrations of
aerosols with diverse properties are being emitted in the region. These pollutants may play a
more significant role in urban regions and provide a unique opportunity for understanding the
impact of environmental change on climate systems, especially in urban areas (Figure 3.1).
The state is also surrounded by the most populous states of India like Uttar Pradesh, Rajasthan,
Delhi, and Chandigarh and these are characterised by industrial, vehicular and service sector
pollution. Due to these reasons a huge amount of aerosol particles and other pollutants such as
PM2.5, PM10, SO2, NO2, CO, CH4 among others get entered into the atmosphere with
hazardous potential to pollute air and affect the health of millions of people residing in the state
as well as in the neighbouring states. The Haryana state falls in Indo-Gangetic region which is
always high in air pollutant concentration level. Looking in to the adversities of air pollution in
the state, studies related to the pollutant assessment is must. However, with the current state of

[10]
art (i.e. the ground based stations) is limited, costly and not sufficient for the monitoring of air
quality parameters for whole state. Satellite based proxy-parameters provide cost effective
solution for this problem and therefore, explored in this study.
Figure 3.1. Study area (Haryana region)
3.2 Data Description
3.2.1 Aerosol Optical Depth (satellite data)
The MODIS Aerosol products monitor the ambient aerosol and some properties of the aerosol
over cloud-free snow ice-free land and ocean surfaces. By using various spectral and spatial

[11]
observations provided by MODIS, multiple algorithms are applied to retrieve aerosol properties
over diverse surfaces. Data from two different algorithms are provided over land, known as Deep
Blue and Dark Target Land. A further Dark Target Ocean algorithm is applied over oceanic and
inland waters. The primary data product from all of these is the aerosol optical depth (AOD, also
known as aerosol optical thickness, AOT) at a wavelength of 550 nm. In addition, each algorithm
provides selected additional information about the aerosol, such as single scattering albedo,
spectral AOD, or descriptions of relative aerosol size, as well as quality assurance information.
There are two MODIS Aerosol product files: MODIS Level 2, containing data collected from the
Terra platform available from year 2000 onwards and MODIS Level 2, containing data collected
from the Aqua platform available from year 2002 onwards. Here we are using MODIS Level 2
3x3 km Terra data for our study, but why? For the answer, we further compare the two datasets
i.e. MODIS Level 2 3x3 km and 10x10 km. The MODIS 3km product is based on the same
algorithm as MODIS 10km and using the same Look Up Tables as the standard Dark Target
aerosol product. Because of finer resolution, subtle differences are made in selecting pixels for
retrieval.
The aerosol retrieval makes use of seven wavelength bands (listed in Table 4.1), and a number of
other bands to help with cloud and other screening procedures.
Table 3.1. Characteristics of MODIS Channels used in the Aerosol Retrieval
Band
#
Bandwidth
(µm)
Weighted
Central
Wavelength
(µm)
Resolution
(m)
NeΔρ
(x10-4
)
Max ρ Required
SNR
Rayleigh
optical
depth
1 0.620-0.670 0.646 250 3.39 1.38 128 0.0520
2 0.841-0.876 0.855 250 3.99 0.92 201 0.0165
3 0.459-0.479 0.466 500 2.35 0.96 243 0.1948
4 0.545-0.565 0.553 500 2.11 0.86 228 0.0963
5 1.230–1.250 1.243 500 3.12 0.47 74 0.0037
6 1.628–1.652 1.632 500 3.63 0.94 275 0.0012
7 2.105–2.155 2.119 500 3.06 0.75 110 0.0004

[12]
Notes: Band #26 (1.38 µm channel) is used for cirrus correction; NeΔρ
corresponds to the sun at zenith (θ= 0°).
The wavelength ranges included in Table 4.1 are estimates of the central wavelength in each
band (obtained by integration of the channel-averaged response functions). To keep in line with
common references in the aerosol, MODIS channels 1, 2, 3, 4, 5, 6 and 7 are having wavelength
range of 0.66, 0.86, 0.47, 0.55, 1.24, 1.64 and 2.12 µm channels, respectively.
The MODIS Level 2 3x3 km data was retrieved for our project over Haryana region, the data
was temporally collected for last 5 years i.e. 2016 to 2020. Daily data was targeted to carry out
the work in the project domain. However, it was observed that the MODIS level 2 product were
largely affected by cloud cover on daily scale. Thus, there is the need to utilise AOD products
from other platform such as from Indian National Satellite (INSAT) which is available in a very
high temporal scale (15 minutes) and may be effective in solving cloud related problem for some
extent at least on a daily time scale.
3.2.2 Ground based PM2.5 and PM10
The 24 hourly PM2.5 and PM10 data used in this study were collected for 2016 to 2020 from
Central Pollution Control Board (CPCB) sites. CPCB has automatic monitoring stations at
various locations across the country. At these stations Respirable Suspended Particulate Matter
(RSPM), Carbon Monoxide (CO), Ozone (O3), Sulphur Dioxide (SO2), Nitrogen Dioxide (NO2)
and Suspended Particulate Matter (SPM) are being monitored regularly. This information on Air
Quality is updated every week. CPCB is also executing a nation-wide programme of ambient air
quality monitoring known as National Air Quality Monitoring Programme (NAMP). The
network consists of 779 operating stations covering 339 cities/towns in 29 states and 6 Union
Territories of the country.
Particulate matter was mainly monitored using High Volume Sampler with size selective inlet
for PM10 and PM2.5. The working principle of this instrument is that the air is sampled at a
Calibrated flow-measuring device to control the airflow at 1132 l/min, and the mass
concentrations of PM10 and PM2.5 are measured by a Glass fibre filter of 20.3 X 25.4 cm (8 X
10 in) size (CPCB 2013).

[13]
A total of 24 sites were investigated in the study, and the locations of all sites are shown in Table
3.2. PM2.5 and PM10 values greater than 1000 µg/m3 were removed to avoid the effect of
outliers, and data with a relative humidity greater than 95% were removed because high relative
humidity is produced by rainfall, which can affect the accuracy of pollutant concentration
monitoring.
Table 3.2. List of cities and station for ground-based PM data collection for Haryana.
Sr.
No
City Station Name Coordinates
1 Ambala Patti Mehar, Ambala - HSPCB 30.3779° N, 76.7733° E
2 Bahadurgarh Arya Nagar, Bahadurgarh - HSPCB 28.6771° N, 76.9283° E
3 Ballabgarh Nathu Colony, Ballabgarh - HSPCB 28.3426° N, 77.3177° E
4 Bhiwani H.B. Colony, Bhiwani - HSPCB 28.8082° N, 76.1361° E
5 Dharuhera M C Office, Dharuhera - HSPCB 28.20553°N, 76.79691°E
6 Faridabad Sector- 16A, Faridabad - HSPCB 28.4061° N, 77.3185° E
7 Fatehabad Huda Sector, Fatehabad - HSPCB 29.5031° N, 75.4738° E
8 Gurugram NISE Gwal Pahari, Gurugram - IMD 28.426° N, 77.150 ° E
9 Gurugram Vikas Sadan, Gurugram - HSPCB 28.4501° N, 77.0285° E
10 Hisar Urban Estate-II, Hisar - HSPCB 29.1359° N, 75.71297° E
11 Jind Police Lines, Jind - HSPCB 29.3070° N, 76.3478° E
12 Kaithal Rishi Nagar, Kaithal - HSPCB 29.8029° N, 76.4144° E
13 Karnal Sector-12, Karnal - HSPCB 29.6955° N, 76.9996° E
14 Kurukshetra Sector-7, Kurukshetra - HSPCB 29.9693° N, 76.8735° E
15 Mandikhera General Hospital, Mandikhera -
HSPCB
27.9002° N, 76.9938° E
16 Manesar Sector-2 IMT, Manesar - HSPCB 28.3655° N, 76.9369° E
17 Narnaul Shastri Nagar, Narnaul - HSPCB 28.0637° N, 76.1117° E
18 Palwal Shyam Nagar, Palwal - HSPCB 28.1483° N, 77.3332° E
19 Panchkula Sector-6, Panchkula - HSPCB 30.7066° N, 76.8545° E
20 Panipat Sector-18, Panipat - HSPCB 29.4363° N, 76.9773° E
21 Rohtak MD University, Rohtak - HSPCB 28.8768° N, 76.6211° E

[14]
22 Sirsa F-Block, Sirsa - HSPCB 29.5364° N, 75.0158° E
23 Sonipat Murthal, Sonipat - HSPCB 29.0316° N, 77.0724° E
24 Yamunanagar Gobind Pura, Yamuna Nagar - HSPCB 30.1501° N, 77.2850° E
The present national air quality monitoring network is limited in scope as the recorded values are
indicative and there is immense time lag in reporting the data. So real time action is not possible.
Also, involvement of various monitoring agencies, personnel and equipment’s in sampling,
chemical analyses and data reporting brings uncertainty and biases. But even with the existing
system the non-compliance with standards in cities is found to be enormous. As many as 131
cities are exceeding the permissible limit for PM10 and 18 cities are exceeding the permissible
limit for NO2. Therefore, current research is the action that matters even as these cities get
upgraded monitoring systems.
3.2.3 Meteorological Parameters
For the estimation of particulate matters from AOD, there are several meteorological parameters
which can be put into use, but here we will use selective and effective parameters, which are
very important for the estimation of PM and reported in earlier studies. Following is the list of
meteorological parameters used for our research (Table 3.3).
Table 3.3. List of meteorological parameter for estimation of PM
S.No. Parameters Details
1 Atmospheric Temperature It will be used as temperature indirectly affect, as it
can create error and false detection of aerosol.
2 Relative Humidity It will be used for humidity correction and to remove
water correction from satellite AOD.
3 Wind Speed Wind is a very important element in determining PM,
as it helps in locating the exact area of aerosol content
in atmosphere.
4 Wind Direction It determines the flow and accumulation of PM over
certain area.
CPCB website provides almost all type of meteorological datasets for various stations over
Indian region. As per our requirement relative humidity, wind speed, atmospheric temperature

[15]
and wind direction are provided in this website. It is similar to that of Particulate Matter, they all
comprise with 24 stations over Haryana. The data is acquired for the year 2018, 2019 and 2020
for the reference.
3.2.4 Auxiliary Data
Ground-based AOD data is measured by CIMEL sun-photometer which is part of Aerosol
Robotics NETwork (AERONET) and is located at more than 500 ground sites around the world
currently. As our study area is Haryana, there are 2 AERONET centers, which are having ground
based Aerosol Optical Depth (AOD) for Haryana state for around 1 to 2 years. List of the centre
is mentioned below:
Table 3.4. List of AERONET stations for Haryana, India.
Sr.No. AERONET Station Coordinates
1 Gwal Pahari, Gurugram 28.426 N, 77.150 E
2 Amity University, Gurugram 28.317 N, 76.916 E
The CIMEL sun-photometer is a multi-channel, automatic sun-and sky scanning radiometer that
measures the direct solar irradiance and sky radiance at the surface of the earth only during
daylight hours (sun above the horizon) after application of the cloud screening and quality
control procedures. The AERONET program is a federation of ground-based remote sensing
aerosol networks established by NASA and LOA-PHOTONS (CNRS) and is greatly expanded
by collaborators from national agencies, institutes, universities, individual scientists, and
partners.
Aerosol Robotic Network (AERONET) AOD products (version 3) were collected to fuse DT and
DB Aerosol Optical Depth and the products were used to validate the fused result. The
AERONET AOD includes three levels: Level 1.0 (unscreened), Level 1.5 (cloud-screened and
quality controlled), and Level 2.0 (quality-assured) (Tao et al. 2015). MODIS AOD data were
validated by AERONET level 2.0 observed at two AERONET stations: Gwal Pahari, Gurugram
(28.426 N, 77.150 E), and Amity University, Gurugram (28.317 N, 76.916 E). To match the
AOD at the 0.550 µm band of MODIS, the AODs at 0.440 µm and 0.675 µm were selected to
perform an interpolation using the Angstrom exponential (Tao et al. 2015).

[16]
3.3 Methodology
In order to create estimation model to predict PM concentrations, there is multiple organised
methods to attain spatially distributed PM. But following are important stages for our research as
in Figure 3.2.
Validation and Processing of satellite-retrieved AOT measurements.
Acquisition of ground based data from CPCB
Processing and removal of irregular and noise values from CPCB data.
Generating regression models using machine learning tools with ground, satellite and
meteorological parameters and identifying the best fitted model for the estimation.
Validation using different correlation methods taking predicted PM (from satellite) and
observed PM (from ground based measurements from CPCB portal).
Identification and reporting of suitable empirical and interpolation algorithms.
Finalisation of the best fitted models and used for further predictions of PM2.5 and
PM10.
3.3.1 Ground based AOD/AOT observation data processing
AOT ground-based observation data was obtained using the French CIMEL manufactured
automatic tracking and scanning sun photometer (CE-318). Since AERONET provides AOT data
at 500 nm, these values have been interpolated at 550 nm in order to coincide with MODIS
AOT550 using the following equation:
AOT550 = AOT500/exp[αln(λ1/λ2)] (2)
where α is the Angstrom Exponent (AE) estimated between 440 and 675 nm, λ1 is 500 nm, and
2 is 550 nm.

[17]
Fig
ure
3.2
. M
ethodolo
gy F
low
Char
t.

[18]
3.3.2 Data processing for the Ground based CPCB data
For the ground data, the heterogeneity is quiet high for validation purpose, so to regularize the
data, first we have to fill the missing values, so to have continuous data. For that KNN method is
used with weighted average of the nearest neighbour values, the missing values are filled, the
equation used for that is mentioned below (Yao and Ruzzo 2006):
∑
Where,
= predicted value for the missing values
= real valued target as training data for ith observation
= KNN scale factor
After the filling of missing value, the data is still not ready for validation as the
data is heterogeneous, so further scaling has been done, so that the data can scaled,
and there is no anomaly in the data which can hinder the validation.
3.3.3 Model Fitting and Description
The relationship between ground-level PM2.5 and AOD and PM10 and AOD are affected by
various factors, such as relative humidity, atmospheric temperature, wind speed and wind
direction (i.e. meteorological parameters), and varies on day to day basis. A simple linear model
cannot accurately reflect this relationship. Considering the daily variations in the PM2.5–AOD
and PM10-AOD relationship, Lee et al. (2011) proposed the LME model to estimate PM2.5 (Hsu
et al. 2004). Many scholars constructed the model by adding various meteorological parameters,
temperature, wind speed, and other parameters for different regions and different times. The
results of these studies suggest that added parameters improve the accuracy of PM2.5 and PM10
estimates.

[19]
In this study, four models were used to estimate PM2.5 and PM10 with MODIS AOD as in
equation (4) and (5) and then MODIS AOD with meteorological factors, which can be expressed
as in equation (6) and (7). Prior to which we have taken three models i.e. Random Forest Model
(RF), General Additive Model (GAM) and General Linear Regression Model (GLM) and also
same model are again run with Kriging added i.e. Random Forest + Kriging Regression Model
(RF+OK), General Linear + Kriging Regression Model (GLM+OK) and General Additive +
Kriging Regression Moedl (GAM + OK). The data was run through each of the above models
and then the most suitable or fitted model identified using RMSE and other statistical results as
shown in Figure 3.3. As from the above statistical results the [1] shows the RMSE of the each
model used and [2] shows the residual value.
Figure 3.3. Statistical results showing the best fitted model among the used models
As it is clearly stated that GLM is giving the best fit as RMSE of lowest 10.66 and next to it is
GLM+OK. Hence, after identification of the best fitted model i.e. GLR Model, the estimation of
PM10 and PM2.5 is done. Following are the models for PM10 and PM2.5 using GLM.
PM Model for Estimation with one variable
Eq. 4
Eq. 5
PM Model for Estimation with 5 variables
Eq. 6
Eq. 7

[20]
Finalised empirical models were used for the estimation of PM10 and PM2.5, as there was not
much difference in accuracy of the model using five parameters and one parameter. Hence we
have gone forward with model eq. 4 and eq. 5 for PM10 and PM2.5 respectively.
4. Results and Discussions
4.1 Validation of Satellite AOD from Ground based AOD
The validation has been done based on the ground points over Haryana. We have just got two
station AOD data over Haryana region from AERONET for validation. The two stations are
Gwal Pahari, Gurugram and Amity University, Gurugram. In this study, we used the data from
MODIS and AERONET derived AODs for the period 2016-2020 (Tripathi et al. 2005).
For validation, the correlation method used here is Pearson Correlation method. It is one of the
most widely used correlation statistic to measure the degree of the relationship between linearly
related variables. The equation for correlation is mentioned below (Obilor and Amadi 2018).
∑ ∑ ∑
√ ∑ ∑
√ ∑ ∑
Where,
= Pearson r correlation coefficient between x and y
= number of observations
= value of ground variable (for ith observation)
= value of satellite variable (for ith observation)
The correlation plots for Ground and Satellite observation for two centres available for year
2016-2020 for Haryana is shown in figure below.

[21]
(a)
(b)
Figure 4.1. Correlation graphs (a) Amity University, Gurugram and (b) Gual Pahari, Gurugram.
As we can see from the graphs, the correlation is evenly spread and is high for both the centres
(Figure 4.1 a and b). For better validation the t-test was performed and therefore, various
statistical evidences have been generated for further validation (Table 4.1). Statistical evidences
showed a good correlation between both databases, defining the validity of the satellite based
AOD for further analysis. Table 4.1 shown below presents different results after performing

[22]
pearson correlation and t-test. As we can see the values are ominously coming very nice
(correlation coefficients are high ≥ 0.88) for both the centres, and the coefficient of
determination is also high (i.e. ~ 0.8). The Standard Error (SE) is less (<0.11) and p-value is
below 0.005. These validation results proofs again to continue analysis further with satellite
(MODIS) derived AOD.
Table 4.1. Statistical results from Pearson’s Correlation and T-test.
AERONET Station R R2 p-value df t-value SE
Gual Pahari, Gurgaon 0.88 0.7744 0.00361 38 -1.4333 0.10432
Amity University, Gurgaon 0.89 0.7921 0.00355 45 -2.9978 0.02768
4.2 Statistical representation of Estimated Particulate Matter (PM)
The estimated PM10 and PM2.5 are analysed and statistically represented with different
statistical parameters as baseline information on air quality of our study area from satellite
platform. Various statistics were used for further understanding of the air quality scenario. The
data estimated for PM10 and PM2.5 were at daily scale (given in Annexure II and III). Hence,
these were converted in to monthly scale and monthly average of PM10 and PM2.5 is presented.
Here, the Table 4.2, and Table 4.3 is showing monthly statistics of PM2.5 and PM10 for five
years i.e. 2016-2020. SD represented Standard Deviation of yearly estimate and avg. represents
the yearly average.

[23]
Table 4.2. Estimated PM 2.5 composite monthly average for Year 2016 to 2020 at Ground Station points
ID Station District Jan Feb Mar Apr May Jun Jul Aug Sep Oct Nov Dec Min Avg. Max SD
1 Patti Mehar, Ambala Ambala 73.29 56.88 54.03 60.83 75.01 90.45 89.06 73.81 101.29 110.42 71.66 68.58 54.03 77.11 110.42 17.46
2 Arya Nagar, Bahadurgarh Jhajjar 92.72 81.11 75.67 72.68 83.44 96.50 89.80 145.52 81.09 145.07 97.34 82.89 72.68 95.32 145.52 24.56
3 Nathu Colony, Ballabgarh Faridabad 95.28 58.40 65.89 61.26 70.44 104.33 81.08 107.99 87.13 140.37 77.08 73.50 58.40 85.23 140.37 23.62
4 H.B. Colony, Bhiwani Bhiwani 83.58 66.00 67.87 55.14 76.93 93.50 94.85 97.52 70.08 126.21 90.72 72.33 55.14 82.89 126.21 19.07
5 Municipal Corporation Office, Dharuhera Rewari 82.20 69.27 62.93 53.04 69.47 78.64 71.82 93.49 67.18 126.65 75.46 66.62 53.04 76.40 126.65 18.79
6 Sector- 16A, Faridabad Faridabad 71.12 52.26 53.40 52.40 68.64 104.58 87.78 123.95 93.62 124.10 89.35 66.89 52.26 82.34 124.10 25.88
7 Huda Sector, Fatehabad Fatehabad 92.34 61.39 62.25 62.41 59.59 63.35 114.52 101.17 69.08 115.34 87.91 68.28 59.59 79.80 115.34 21.37
8 NISE Gwal Pahari, Gurugram - IMD Gurugram 71.46 60.09 57.82 59.36 85.27 100.54 88.69 76.29 81.56 146.29 97.89 67.86 57.82 82.76 146.29 24.68
9 Urban Estate-II, Hisar Hisar 75.40 63.25 59.78 53.97 74.56 100.61 88.30 105.75 72.03 113.67 86.43 62.02 53.97 79.65 113.67 19.39
10 Police Lines, Jind Jind 91.88 61.86 68.36 65.76 77.27 111.59 105.80 112.78 80.90 162.63 86.98 79.95 61.86 92.15 162.63 28.06
11 Rishi Nagar, Kaithal Kaithal 74.99 59.27 60.37 61.62 71.15 101.77 102.35 103.88 91.36 149.85 75.92 78.47 59.27 85.92 149.85 25.95
12 Sector-12, Karnal Karnal 69.93 55.47 58.76 65.48 74.33 106.73 90.03 102.48 94.67 152.30 77.27 73.97 55.47 85.12 152.30 26.78
13 Sector-7, Kurukshetra Kurukshetra 73.70 63.17 62.15 66.74 74.28 102.10 84.72 63.91 96.07 167.10 76.61 74.89 62.15 83.79 167.10 29.12
14 General Hospital, Mandikhera Mewat 93.07 75.66 51.10 45.49 54.79 75.48 68.52 66.03 49.65 96.99 108.79 80.69 45.49 72.19 108.79 20.24
15 Sector-2 IMT, Manesar Gurugram 88.97 73.51 65.30 61.76 80.76 91.48 86.85 90.90 75.26 111.58 83.57 78.05 61.76 82.33 111.58 13.28
16 Shastri Nagar, Narnaul Mahendergarh 71.60 66.24 52.76 46.90 52.74 65.09 57.42 58.32 52.22 84.47 65.07 56.09 46.90 60.74 84.47 10.35
17 Shyam Nagar, Palwal Palwal 95.72 73.41 74.71 62.19 72.81 109.95 92.75 98.83 77.78 154.52 76.94 85.90 62.19 89.63 154.52 24.48
18 Sector-6, Panchkula Panchkula 57.73 49.81 44.66 57.18 72.44 89.70 75.50 56.42 81.57 115.73 66.66 57.29 44.66 68.72 115.73 19.89
19 Sector-18, Panipat Panipat 78.55 60.45 65.25 72.73 86.74 120.77 95.13 91.26 82.94 169.98 71.33 80.15 60.45 89.61 169.98 29.83
20 MD University, Rohtak Rohtak 77.92 64.70 59.66 49.47 69.62 96.34 51.77 77.95 55.66 94.13 56.05 63.32 49.47 68.05 96.34 15.64
21 F-Block, Sirsa Sirsa 77.29 64.70 62.56 61.42 55.25 87.08 99.07 89.67 74.13 129.02 77.09 66.29 55.25 78.63 129.02 20.50
22 Murthal, Sonipat Sonipat 94.40 73.14 72.95 75.11 97.49 122.68 100.08 99.14 91.91 146.01 94.83 82.36 72.95 95.84 146.01 21.19
23 Gobind Pura, Yamuna Nagar Yamuna Nagar 70.03 57.62 55.17 62.69 71.76 96.32 74.41 58.17 96.97 146.26 63.20 70.33 55.17 76.91 146.26 25.76

[24]
Table 4.3. Estimated PM 10 composite monthly average for Year 2016 to 2020 at Ground Station points
ID Station District Jan Feb Mar Apr May Jun Jul Aug Sep Oct Nov Dec Min Avg. Max SD
1 Patti Mehar, Ambala Ambala 151.69 118.66 111.24 123.36 150.95 181.54 178.62 172.60 204.73 223.97 148.78 144.80 111.24 159.25 223.97 34.37
2 Arya Nagar, Bahadurgarh Jhajjar 188.05 170.39 154.95 144.26 167.00 201.83 184.68 291.34 172.17 284.28 197.62 167.94 144.26 193.71 291.34 46.96
3 Nathu Colony, Ballabgarh Faridabad 195.47 113.90 129.61 126.55 145.63 215.01 169.19 218.61 183.36 278.73 159.51 151.08 113.90 173.89 278.73 47.28
4 H.B. Colony, Bhiwani Bhiwani 167.15 139.53 138.17 115.80 153.26 181.47 190.68 188.42 144.51 263.50 188.16 153.13 115.80 168.65 263.50 38.20
5 Municipal Corporation Office, Dharuhera Rewari 171.17 148.82 129.08 112.57 135.36 158.91 138.50 193.05 136.50 252.16 149.89 139.47 112.57 155.46 252.16 36.85
6 Sector- 16A, Faridabad Faridabad 140.99 106.36 114.63 112.01 139.86 204.26 182.89 248.98 190.39 249.64 189.77 138.03 106.36 168.15 249.64 50.39
7 Huda Sector, Fatehabad Fatehabad 186.48 124.37 132.67 126.53 115.27 135.85 229.40 201.71 141.34 245.74 173.82 137.83 115.27 162.58 245.74 43.98
8 NISE Gwal Pahari, Gurugram - IMD Gurugram 146.57 128.23 125.03 123.30 169.13 204.83 188.57 151.45 160.85 280.73 209.76 140.37 123.30 169.07 280.73 45.92
9 Urban Estate-II, Hisar Hisar 151.41 125.57 123.89 114.01 151.43 196.27 178.28 214.44 148.22 226.11 180.78 129.84 114.01 161.69 226.11 37.15
10 Police Lines, Jind Jind 185.23 129.90 141.60 135.69 151.19 227.26 214.32 229.45 164.99 330.35 177.24 165.24 129.90 187.71 330.35 56.41
11 Rishi Nagar, Kaithal Kaithal 149.25 121.80 125.06 128.84 142.28 200.17 206.70 212.49 183.85 319.03 153.38 164.95 121.80 175.65 319.03 55.28
12 Sector-12, Karnal Karnal 145.94 114.37 121.56 133.02 153.19 217.44 177.54 207.87 179.93 310.63 164.48 159.98 114.37 173.83 310.63 53.29
13 Sector-7, Kurukshetra Kurukshetra 146.62 129.46 130.36 132.80 153.59 203.59 175.22 135.04 201.11 339.26 157.61 156.03 129.46 171.72 339.26 58.56
14 General Hospital, Mandikhera Mewat 190.44 158.76 108.13 92.78 105.67 169.09 139.72 139.60 105.89 193.62 220.20 167.81 92.78 149.31 220.20 40.87
15 Sector-2 IMT, Manesar Gurugram 177.15 154.24 137.63 130.46 155.40 198.64 180.26 186.03 156.84 231.19 174.83 167.33 130.46 170.83 231.19 27.38
16 Shastri Nagar, Narnaul Mahendargarh 146.22 136.86 113.85 97.41 97.91 129.89 120.53 129.19 105.82 177.14 139.38 116.44 97.41 125.89 177.14 22.62
17 Shyam Nagar, Palwal Palwal 196.91 157.10 156.18 129.63 150.27 228.08 186.06 193.88 154.55 313.40 155.97 188.98 129.63 184.25 313.40 48.83
18 Sector-6, Panchkula Panchkula 120.33 103.45 91.06 121.78 140.85 173.85 150.50 113.97 160.97 220.22 142.13 113.74 91.06 137.74 220.22 35.54
19 Sector-18, Panipat Panipat 163.24 127.30 133.52 150.44 174.95 252.03 201.74 188.63 170.81 344.48 147.73 165.98 127.30 185.07 344.48 60.24
20 MD University, Rohtak Rohtak 156.84 138.72 124.74 107.23 121.23 193.75 110.42 154.97 117.40 210.86 115.64 132.51 107.23 140.36 210.86 33.18
21 F-Block, Sirsa Sirsa 157.17 134.18 130.60 123.61 105.00 181.67 201.41 188.84 150.03 264.23 158.71 137.36 105.00 161.07 264.23 43.03
22 Murthal, Sonipat Sonipat 187.73 153.33 151.65 152.04 190.71 219.65 208.09 191.38 184.90 300.12 190.12 171.66 151.65 191.78 300.12 40.36
23 Gobind Pura, Yamuna Nagar Yamuna Nagar 146.59 114.24 116.25 127.92 149.88 197.20 151.14 136.00 202.55 295.48 131.51 143.63 114.24 159.37 295.48 50.99

[25]
4.3 Spatio-temporal Variations of PM10 and PM2.5
After identification of the best fitted model, the PM10 and PM2.5 are generated with temporal
resolution of daily and for the half decade duration i.e. 2016 to 2020. To restrict the size of final
reports daily results for PM has not been presented here (as it requires almost 1825 maps to be
added in the report and may make the report bulky). Therefore, monthly outputs are generated
for both PM10 and PM2.5. These were further evaluates and discussed year-wise for half
decades. Figure 4.2 is showing the results for the year 2016 for PM2.5.

[26]

[27]
Figure 4.2. Monthly spatial distribution of PM2.5 for the year 2016 over Haryana
October month witnesses highest PM2.5 concentration (i.e. up to 350 µg/m3). The variation of
PM2.5 is having extreme values during the month of October, and November mainly due to high
anthropogenic activities such as crop and stubble burning, Diwali crackers burning etc. This
trend will be seen for almost every year, but for the change, the month of February is showing
higher PM2.5 accumulation than usual, mainly due to stagnant meteorological conditions. July,
August and April is showing lower value of PM mainly due to less anthropogenic activities and
also August been a monsoon month, showing gradually lower PM accumulation. Figure 4.3 is
showing the results for PM2.5 for the year 2017 over Haryana.

[28]

[29]

[30]
Figure 4.3. Monthly spatial distribution of PM2.5 for the year 2017 over Haryana
From the above figure, it can be observed that the variation of PM2.5 is relatively higher. High
values were estimated during the month October and November. November and October is
understandable as during these months there is increase in anthropogenic activities such as
agricultural practices, stubble burning and festival events. Figure 4.4 is showing the monthly
spatial pattern of PM2.5 for the year 2018.

[31]

[32]

[33]
Figure 4.4. Monthly spatial distribution of PM2.5 for the year 2018 over Haryana.
As we can see from the above figure, the variation of PM2.5 is showing higher value during the
month of January, April, October, and November. October and November are understandable as
during these months there is increase in anthropogenic activities such as stubble burning and
festival events. Exceptionally January and April were showing high values than usual for the
year 2018, which is possibly due to dust storm or other natural causes, resulted in the stayed
accumulation of PM2.5 for a long time. Relatively lower values were observed in the month of
December possibly due to clear meteorological conditions. Interestingly, two corridors of High
PM2.5 concentrations were observed in the month of November, one from Sirsa and another

[34]
from Punchkula-Ambala, following the most rushed road network towards Delhi and
Chandigarh. This indicates the pollution from Vehicle movement. Figure 4.5 is showing the
results for the year 2019 over Haryana for PM2.5.

[35]

[36]
Figure 4.5. Monthly spatial distribution of PM2.5 for the year 2019 over Haryana.
As we can see from the above figure, the variation of PM2.5 for the year 2019 is lower as
compare to previous years and trend is gradual i.e. showing higher value during the month of
October which is gradual due to high anthropogenic activities but showing lower PM
accumulation on the first half of the year. The reason behind this may be favourable
meteorological conditions for the pollutants dispersion. Figure 4.6 is showing the results for the
year 2020 over Haryana for PM2.5.

[37]

[38]

[39]
Figure 4.6. Monthly spatial distribution of PM2.5 for the year 2019 over Haryana.
High variability in the spatial pattern of PM2.5 for the year 2020 specially in the month of April
and May is be due to various local reasons in the year 2020 (like COVID-19) have shown the
lowest accumulation of PM2.5 as compared to previous 4 years (Figure 4.6). The results for
other months were following the earlier trend, the maximum value was estimated in month of
October as usual and little bit high in November and December. Comparatively low
accumulation of PM2.5 in other months may be due to the variable conditions of meteorology
and the lockdown cause due to COVID-19 pandemic.

[40]
Results for PM10 for the year 2016 to 2020 are also presented in the similar way as for PM2.5 in
above sections. As discussed earlier, same fitted model was used for the generation of PM10 as
well. The output was satisfactory and related to the trend and scenario of PM accumulation.
Figure 4.7, 4.8, 4.9, 4.10 and 4.11 is showing the spatial pattern and variation of PM10 over
Haryana state for the year 2016, 2017, 2018, 2019 and 2020 respectively.
As we can see from the Figure 4.7, the PM10 is highly variable on monthly scale for the year
2016. Accumulation of PM10 for the year 2016 is showing higher values as compared to the
other years. This may be due to preventive measures taken by the government for curbing air
pollution in the area. The accumulation was following a specific trend i.e. showing high value
during month of October, and November, mainly due to high anthropogenic activities like
stubble burning, crop burning and festival event involving cracker burst. Comparatively less
concentration of PM10 were observed in the month of August may be due to the rainfall
dependent settling on the ground.

[41]

[42]

[43]
Figure 4.7. Monthly spatial distribution of PM10 for the year 2016 over Haryana.
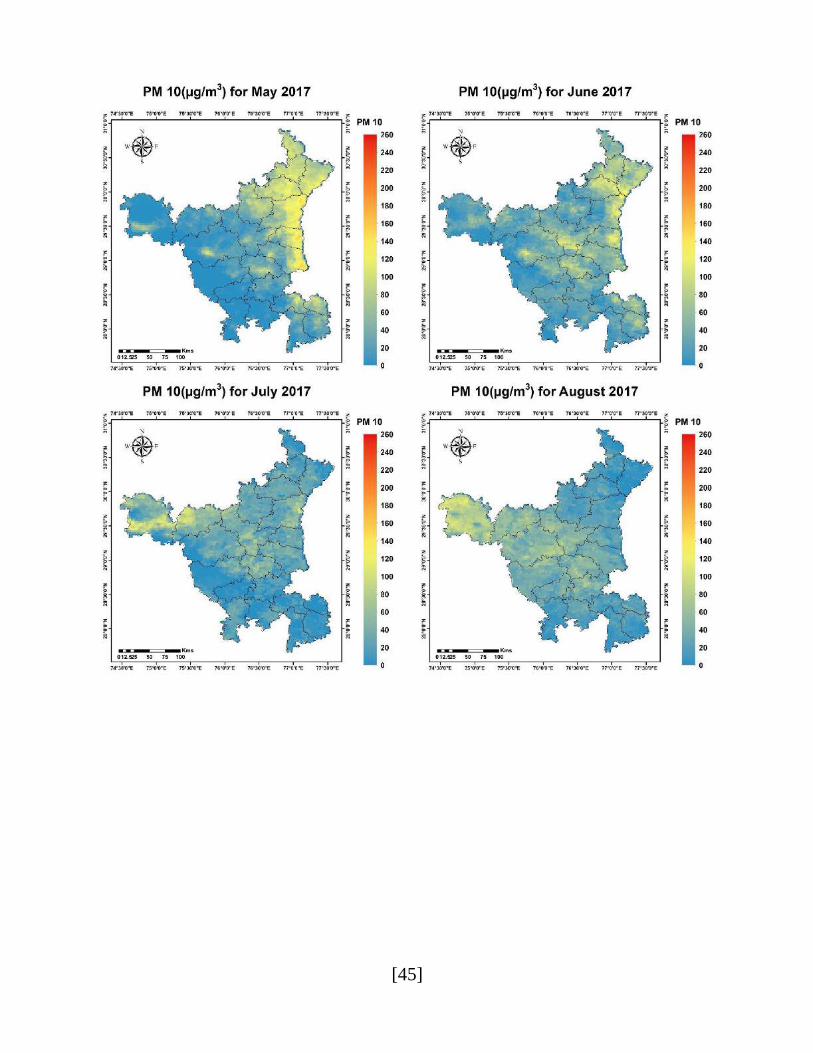
Figure 4.8 is showing the spatio-temporal variations in the concentration of PM10 over Haryana
state for the year 2017. The trend of variation in PM10 concentration is following the trend of
variation in PM2.5 concentration. PM10 accumulation was found to be high during the month of
October and November. Further October and November month is showing high value mainly due
to the late stubble burning and other natural and anthropogenic activities. Interestingly the high
values of PM10 were observed in the month of October in the northern part of the state which is
mainly due to early started the stubble burning in the northern part of the state. Again high values
of PM10 in lower regions of the state which is following rice belt show the late start of stubble
burning in these regions. The May and June months show lower PM10 concentration may be due
to favourable dispersion conditions.

[44]
[45]

[46]
Figure 4.8. Monthly spatial distribution of PM10 for the year 2017 over Haryana.
Figure 4.9 is showing the results for the year 2018 over Haryana for PM10. As we can see from
the Figure 4.9, the variation of PM10 for the year 2018 is following similar trend as of the year
2017. However, in the month of January the PM10 was lower as compared to the previous year.
The possible reasons may be the favourable meteorological conditions. Relatively high values of
PM10 in the month of October, November and December, indicates wheat stubble burning in the
region. High values in the Month of May and June may be due to agriculture practices like field
ploughing and natural dust brought to the area through wind. Reduced concentration in the
month of August and September is due to the rainfall which settled the PM10 on to the ground.

[47]

[48]

[49]
Figure 4.9. Monthly spatial distribution of PM10 for the year 2018 over Haryana.
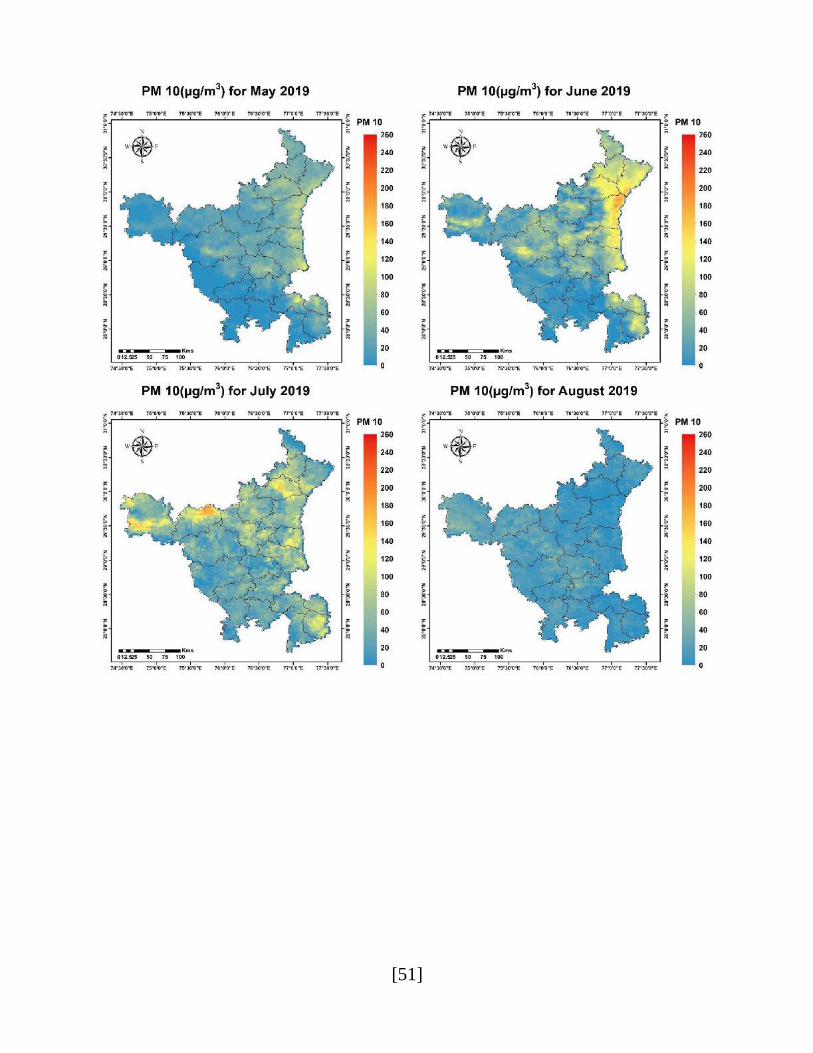
Results related to the spatio-temporal variation in the concentration of PM10 for the year 2019 is
presented in Figure 4.10. The variation of PM10 for the year 2019 is lower as compare to
previous years and trend is gradual i.e. showing higher value during the month on January and
October which is mainly due to natural dust and stubble burning activities respectively along
with other factors. Lower PM accumulation on the first half of the year was observed may be due
to the favourable meteorology and the monsoon. Low values were observed for the month of
February and March. Relatively low values of PM10 in the month of July, is due to the after
effect of the month of June.

[50]
[51]

[52]
Figure 4.10. Monthly spatial distribution of PM10 for the year 2019 over Haryana.
Figure 4.11 is showing spatio-temporal variations in the concentration of PM10 over Haryana
state for the year 2020. The variation of PM10 concentration especially in the months of March,
April and May, is mainly due to various local reasons originated from COVID-19 driven
lockdown. The year 2020 showed lowest accumulation of PM10 as compared to previous 4
years. However it was following the trend and the maximum values were observed in month of
October, November and December mainly due to the rice based stubble burning and stagnant
meteorological conditions. Relatively high values were observed in the month of February is
mainly due to excessive biomass burning for heat and natural dust accumulation.

[53]

[54]

[55]
Figure 4.11. Monthly spatial distribution of PM2.5 for the year 2019 over Haryana.
By analysing the trend for PM2.5 and PM10 accumulation for the year 2016 to 2020 it was
concluded that the concentration of both the PM2.5 and PM10 follows a specific trend where
October and November showed high concentration and March, April, and August show lowest
concentration. Both the PM2.5 and PM10 were found highly correlated with each other.
However, the spatio-temporal trends in the concentration of PM2.5 and PM10 do match perfectly
with the scenarios and reasoning’s related to the activities happening throughout the year. Rather
it is showing the contribution from both the natural and anthropogenic activities which is mainly
considered as anthropogenic in general conceptions. High correlation of satellite based estimates

[56]
of PM2.5 and PM10 concentration with the ground-based accumulation indicates the suitability
of methodology for the regular monitoring of these pollutants which may further help in the air
quality estimation and health management.
4.4 Validation using Predicted PM and Ground based PM
As discussed earlier, the validation was done using Ground based PM10 and PM2.5 from CPCB
as observed data and estimated PM10 and PM2.5 for the generated models as predicted data. The
statistical details of each of the model generated for the estimation of PM10 and PM2.5 is shown
in Table 4.4.
Table 4.4. PM10 and PM2.5 GLM Model details and description.
Model Details Model RMSE St.Error R2 Pr Value
GLM for PM10 with 05 variables Eq. 4 2.1216 0.0166 0.9747 2e -16
GLM for PM2.5 with 05 variables Eq. 5 1.7674 0.0257 0.9681 2e -16
GLM for PM10 with 01 variables Eq. 6 2.2187 0.0169 0.9746 2e -16
GLM for PM2.5 with 01 variables Eq. 7 1.8458 0.0259 0.9683 2e -16
As from the above details we can see that the accuracy of model is excellent as having R2 of 0.97
for PM10 and 0.96 for PM2.5. The simple regression models were compared with the model
including five variables (AOD, Temp, RH, WD, WS) and there was not much difference in the
results. Hence, the simple regression models have been opted for the easy implementation and
accurate estimation.
5. Conclusions
This study was done to develop suitable models for the estimation of PM2.5 and PM10. Though,
there were many new and interesting outcomes, this may be considered as a vital baseline for
further research and applications. Some of the key conclusions are presented here.
MODIS aerosol retrievals provide useful perspective to the regional air pollution. The two
case regions situated in the Gurugram namely Gwal Pahari and Amity University

[57]
demonstrated the MODIS capability for monitoring regional and local air pollution. With
Terra and Aqua MODIS direct broadcasting (data processing time <1 hour), the near real time
(twice a day) monitoring of air pollution is possible in any places around the world however
facilities needs to be developed for near real time monitoring. The correlation values (R2) of
0.77 and 0.79 for Gwal Pahari and Amity University respectively, were obtained between
AERONET-derived data (ground data) and Satellite retrieved data. This gives statistical
evidence about how efficient and effective MODIS AOD data is for global and regional
environmental research.
This study becomes more important as it have included the ground based PM data from CPCB
for the validation. The satellite based estimates showed variations as compared to the ground
based estimates though the coefficient of correlation was high (r2>0.9). Hence further
estimation of PM becomes so vital and necessary for better understanding of air quality.
The output which defines the role of particulate matter in the air quality of the region signifies
the current study. The variation and trends which was observed in last half decade gives an
idea about how we can keep such pollutant in check, and when and where we press the panic
or control button, to stabilise the accumulation. This study may also provide various aspect of
understanding of roles of air pollution in various climatic events. Furthermore, the trend
hasn’t change in half a decade, so taking measure for putting barrier during high wave can
keep such pollutant in control.
Current study also gives us a brief idea about characteristic relationship between different
meteorological parameters and how they defies and alter certain part of major pollutant
matters. The relationship between PM and AOD gives us brief idea about the role they play in
impacting air quality.
Baseline data for the PM2.5 and PM10 which was lacking is being generated for half decade
in this study.
Machine learning tools always play important role in estimation and prediction of satellite
derived PM and implied here in this study is uniqueness of the study. Their accuracy defines
the fitness of the certain models likewise with R2 of 0.97 and 0.96 for PM10 and PM2.5
respectively shows how accurate the model has behaved with limited use of parameters.

[58]
However underestimation was observed and further analysis may help in tackling this
problem.
This study also gives alarming signs to certain places of the study area, which should be taken
care of as soon as possible. Mainly Gurugram, Faridabad, Jind, Karnal requires special
attention in improving the quality of air by taking various control measures. These cities are
marked as worst places to live; the air to breath is not even close to quality mark of NAAQs.
This current study is unique and may be considered as baseline for the further studies and
research as no such work was done earlier. Further the database and model generated in this
study would be valuable for the regular monitoring of PM2.5 and PM10 which may further be
valuable for the air quality estimation and health management.
6. References
Ali, Gohar et al. 2019. “Evaluating MODIS and MISR Aerosol Optical Depth Retrievals over
Environmentally Distinct Sites in Pakistan.” Journal of Atmospheric and Solar-Terrestrial
Physics 183(December 2018): 19–35. https://doi.org/10.1016/j.jastp.2018.12.008.
Chen, G et al. 2018. “A Physically Based PM2.5 Estimation Method Using AERONET Data in
Beijing Area.” IEEE Journal of Selected Topics in Applied Earth Observations and Remote
Sensing 11(6): 1957–65.
Chu, D. A. et al. 2002. “Validation of MODIS Aerosol Optical Depth Retrieval over Land.”
Geophysical Research Letters 29(12): MOD2-1-MOD2-4.
Chu, D. A., Kaufman, Y. J., Zibordi, G., Chern, J. D., Mao, Jietai, Li, Chengcai, Holben, B. N.
2003. “Global Monitoring of Air Pollution over Land from the Earth Observing System-
Terra Moderate Resolution Imaging Spectroradiometer (MODIS).” Journal of Geophysical
Research: Atmospheres 108(21): 1–18.
Chu, D. Allen. 2006. “Analysis of the Relationship between MODIS Aerosol Optical Depth and
PM 2.5 in the Summertime US.” Remote Sensing of Aerosol and Chemical Gases, Model
Simulation/Assimilation, and Applications to Air Quality 6299: 629903.
Chu, Yuanyuan et al. 2016. “A Review on Predicting Ground PM2.5 Concentration Using

[59]
Satellite Aerosol Optical Depth.” Atmosphere 7(10): 1–25.
CPCB. 2013. “Guidelines for the Measurement of Ambient Air Pollutants Guidelines for Manual
Sampling Guidelines for Manual Sampling.” http://www.cpcb.nic.in.
Engel-Cox, Jill A., Christopher H. Holloman, Basil W. Coutant, and Raymond M. Hoff. 2004.
“Qualitative and Quantitative Evaluation of MODIS Satellite Sensor Data for Regional and
Urban Scale Air Quality.” Atmospheric Environment 38(16): 2495–2509.
Guo, Yuanxi, Qiuhong Tang, Dao Yi Gong, and Ziyin Zhang. 2017. “Estimating Ground-Level
PM2.5 Concentrations in Beijing Using a Satellite-Based Geographically and Temporally
Weighted Regression Model.” Remote Sensing of Environment 198: 140–49.
Gupta, Pawan et al. 2006. “Satellite Remote Sensing of Particulate Matter and Air Quality
Assessment over Global Cities.” Atmospheric Environment 40(30): 5880–92.
Hsu, N C, Si-Chee Tsay, M D King, and J R Herman. 2004. “Aerosol Properties over Bright-
Reflecting Source Regions.” IEEE Transactions on Geoscience and Remote Sensing 42(3):
557–69.
Hu, Xuefei et al. 2013. “Estimating Ground-Level PM2.5 Concentrations in the Southeastern
U.S. Using Geographically Weighted Regression.” Environmental Research 121: 1–10.
Hu, Xuefei, Waller, Lance A., Lyapustin, Alexei, Wang, Yujie, Al-Hamdan, Mohammad Z.,
Crosson, William L., Estes, Maurice G., Estes, Sue M., Quattrochi, Dale A., Puttaswamy,
Sweta Jinnagara, Liu, Yang. 2014. “Estimating Ground-Level PM2.5 Concentrations in the
Southeastern United States Using MAIAC AOD Retrievals and a Two-Stage Model.”
Remote Sensing of Environment 140: 220–32.
Jin, Shikuan et al. 2019. “Retrieval of 500 m Aerosol Optical Depths from MODIS
Measurements over Urban Surfaces under Heavy Aerosol Loading Conditions in Winter.”
Remote Sensing 11(19).
Lary, David J. et al. 2014. “Estimating the Global Abundance of Ground Level Presence of
Particulate Matter (PM2.5).” Geospatial Health 8(3): S611–30.

[60]
Lee, H. J. et al. 2011. “A Novel Calibration Approach of MODIS AOD Data to Predict PM2.5
Concentrations.” Atmospheric Chemistry and Physics 11(15): 7991–8002.
Obilor, Esezi Isaac, and Eric Chikweru Amadi. 2018. “Test for Significance of Pearson’s
Correlation Coefficient (R).” International Journal of Innovative Mathematics, Statistics &
Energy Policies 6(1): 11–23.
Soni, Manish, Swagata Payra, and Sunita Verma. 2018. “Particulate Matter Estimation over a
Semi Arid Region Jaipur, India Using Satellite AOD and Meteorological Parameters.”
Atmospheric Pollution Research 9(5): 949–58. https://doi.org/10.1016/j.apr.2018.03.001.
Sorek-Hamer, M et al. 2013. “Improved Retrieval of PM2.5 from Satellite Data Products Using
Non-Linear Methods.” Environmental pollution (Barking, Essex : 1987) 182: 417–23.
Tao, Minghui et al. 2015. “Comparison and Evaluation of the MODIS Collection 6 Aerosol Data
in China.” Journal of Geophysical Research : Atmospheres Collection 6 aerosol data in
China: 6992–7005.
Tripathi, S. N. et al. 2005. “Comparison of MODIS and AERONET Derived Aerosol Optical
Depth over the Ganga Basin, India.” Annales Geophysicae 23(4): 1093–1101.
Wang, Jun, and Sundar A. Christopher. 2003. “Intercomparison between Satellite-Derived
Aerosol Optical Thickness and PM2.5 Mass: Implications for Air Quality Studies.”
Geophysical Research Letters 30(21): 2–5.
Xia, Xiaoli et al. 2019. “Aerosol Data Assimilation Using Data from Fengyun-3A and MODIS:
Application to a Dust Storm over East Asia in 2011.” Advances in Atmospheric Sciences
36(1): 1–14. https://doi.org/10.1007/s00376-018-8075-9.
Xie, Yuanyu et al. 2015. “Daily Estimation of Ground-Level PM2.5 Concentrations over Beijing
Using 3 Km Resolution MODIS AOD.” Environmental Science and Technology 49(20):
12280–88.
Yao, Zizhen, and Walter L. Ruzzo. 2006. “A Regression-Based K Nearest Neighbor Algorithm
for Gene Function Prediction from Heterogenous Data.” BMC Bioinformatics 7(SUPPL.1):
1–11.

[61]
Zhang, Wenhao et al. 2015. “Assessment of OMI Near-UV Aerosol Optical Depth over Central
and East Asia.” Journal of Geophysical Research: Atmospheres 175(4449): 238.

[62]
7. ANNEXURE I
S.No. Sub-datasets in MODIS AOD retrieval Type/Class
1 Scan Start Time 64-bit floating point
2 Solar Zenith 16-bit integer
3 Solar Azimuth 16-bit integer
4 Sensor Zenith 16-bit integer
5 Sensor Azimuth 16-bit integer
6 :Scattering Angle 16-bit integer
7 Glint Angle 16-bit integer
8 Land Ocean Quality Flag 16-bit integer
9 Land sea Flag 16-bit integer
10 Wind Speed Ncep Ocean 16-bit integer
11 Optical Depth Land And Ocean 16-bit integer
12 Image Optical Depth Land And Ocean 16-bit integer
13 Aerosol Type Land 16-bit integer
14 Fitting Error Land 16-bit integer
15 Surface Reflectance Land 16-bit integer
16 Corrected Optical Depth Land 16-bit integer
17 Corrected Optical Depth Land wav2p1 16-bit integer
18 Optical Depth Ratio Small Land 16-bit integer
19 Number Pixels Used Land 16-bit integer
20 Mean Reflectance Land 16-bit integer
21 STD Reflectance Land 16-bit integer
22 Mass Concentration Land 32-bit floating point
23 Aerosol Cloud Fraction Land 16-bit integer
24 Quality Assurance Land 8-bit integer
25 Solution Index Ocean Small 16-bit integer
26 Solution Index Ocean Large 16-bit integer
27 Effective Optical Depth Best Ocean 16-bit integer
28 Effective Optical Depth Average Ocean 16-bit integer
29 Optical Depth Small Best Ocean 16-bit integer
30 Optical Depth Small Average Ocean 16-bit integer
31 Optical Depth Large Best Ocean 16-bit integer
32 Optical Depth Large Average Ocean 16-bit integer
33 Mass Concentration Ocean 32-bit floating point
34 Aerosol Cloud Fraction Ocean 16-bit integer
35 Effective Radius Ocean 16-bit integer
36 PSML003 Ocean 32-bit floating point
37 Asymmetry Factor Best Ocean 16-bit integer
38 Asymmetry Factor Average Ocean 16-bit integer
39 Backscattering Ratio Best Ocean 16-bit integer
40 Backscattering Ratio Average Ocean 16-bit integer
41 Angstrom Exponent 1 Ocean 16-bit integer
42 Angstrom Exponent 2 Ocean 16-bit integer
43 Least Squares Error Ocean 16-bit integer

[63]
44 Optical Depth Ratio Small Ocean 0.55micron 16-bit integer
45 Optical Depth by models ocean 16-bit integer
46 Number Pixels Used Ocean 16-bit integer
47 Mean Reflectance Ocean 16-bit integer
48 STD Reflectance Ocean 16-bit integer
49 Quality Assurance Ocean 16-bit integer
50 Topographic Altitude Land 16-bit integer
51 BowTie Flag 16-bit integer

[64]
8. ANNEXURE II
Estimated PM 2.5 daily composite for Year 2016 to 2020 for the month of January at ground station points in Haryana
Districts 1-
Jan
2-
Jan
3-
Jan
4-
Jan
5-
Jan
6-
Jan
7-
Jan
8-
Jan
9-
Jan
10-
Jan
11-
Jan
12-
Jan
13-
Jan
14-
Jan
15-
Jan
16-
Jan
17-
Jan
18-
Jan
19-
Jan
20-
Jan
21-
Jan
22-
Jan
23-
Jan
24-
Jan
25-
Jan
26-
Jan
27-
Jan
28-
Jan
29-
Jan
30-
Jan
31-
Jan
Ambala 53 50 65 83 101 79 116 90 69 69 62 86 60 51 NA 26 88 159 85 NA 85 74 64 58 73 40 90 82 49 46 NA
Jhajjar NA NA 101 86 130 118 NA 141 76 51 67 104 NA NA 63 NA 95 80 NA NA NA NA 75 76 82 81 142 80 37 172 NA
Faridabad 86 NA 140 NA 80 NA NA NA 85 79 NA 135 NA NA 84 NA NA 86 84 NA NA NA NA NA NA 83 NA 121 NA 80 NA
Bhiwani 80 105 76 86 89 127 80 54 67 71 56 103 116 24 60 31 98 73 NA 53 101 131 NA 103 78 65 147 89 95 84 82
Rewari 87 105 92 68 106 103 76 82 61 63 65 94 84 43 57 158 87 63 68 NA NA 135 76 114 99 55 NA 77 28 76 78
Faridabad 100 NA 90 94 79 NA 120 NA 48 78 NA 88 58 38 62 27 104 NA 80 25 NA 78 74 NA 81 59 98 57 53 56 60
Fatehabad NA 107 82 94 261 NA 105 53 63 59 73 88 157 33 68 NA 142 103 97 NA 22 84 74 120 73 79 135 60 81 98 81
Gurugram 93 209 66 84 86 NA 94 63 64 42 66 71 NA 44 59 31 NA 50 56 36 36 68 74 97 94 69 108 76 43 63 61
Hisar NA 109 72 81 82 164 54 43 28 64 63 119 40 27 61 NA 86 NA 79 NA NA 168 75 76 77 79 NA 54 25 82 NA
Jind 123 95 80 104 83 174 105 NA 60 61 69 103 161 47 67 NA 117 82 74 NA 69 110 70 101 84 58 184 90 51 56 95
Kaithal 72 37 87 99 136 NA 62 65 45 48 59 113 86 38 61 39 149 49 35 NA NA 80 72 70 78 77 172 59 79 58 NA
Karnal 61 95 77 99 116 NA 57 77 35 53 82 76 102 38 34 NA 69 70 35 51 NA 60 56 78 67 66 170 58 NA NA 37
Kurukshetra 53 32 68 82 100 NA 61 76 66 52 84 91 49 38 45 42 90 49 41 NA NA 64 64 86 81 NA 127 NA 86 216 NA
Mewat 85 145 109 95 128 189 105 129 72 59 67 90 63 60 70 16 94 96 58 49 45 108 74 103 122 71 146 165 86 88 99
Gurugram 113 117 82 88 97 95 NA NA NA 59 60 89 75 52 67 NA 122 71 112 NA 87 NA 74 117 78 90 152 82 79 79 87
Mahendar
-garh 84 93 98 62 89 135 75 82 44 55 42 92 123 30 44 64 66 55 66 43 26 97 63 77 77 60 102 60 84 61 73
Palwal 84 138 114 112 116 99 147 72 69 61 56 96 121 77 81 73 119 104 78 21 NA 122 79 NA 97 56 148 143 91 106 98
Panchkula 40 NA 48 NA 69 NA 50 NA 51 74 52 56 67 38 61 51 NA 44 24 50 68 75 43 35 39 60 126 84 76 63 NA
Panipat 75 108 84 106 119 201 129 49 59 63 93 87 109 43 62 35 100 85 33 50 40 87 66 95 68 36 90 60 76 37 87
Rohtak 64 107 76 70 127 143 65 79 61 60 57 93 71 32 56 17 87 78 51 39 67 120 75 125 97 66 133 68 52 78 102
Sirsa 103 136 79 90 156 NA 67 NA 67 58 75 51 55 28 NA NA 91 NA 113 46 27 88 74 88 79 79 NA 80 52 70 80
Sonipat 125 97 100 112 138 219 50 50 52 56 78 97 116 81 65 43 152 97 52 57 NA 86 94 97 83 64 176 71 107 123 NA
Y.Nagar 25 NA 60 89 72 84 65 105 65 54 68 82 61 29 NA 93 54 58 64 63 94 85 55 63 47 61 124 73 113 45 76
Y Nagar= Yamuna Nagar

[65]
Estimated PM 2.5 daily composite for Year 2016 to 2020 for the month of February at ground station points in Haryana
Districts 1-
Feb
2-
Feb
3-
Feb
4-
Feb
5-
Feb
6-
Feb
7-
Feb
8-
Feb
9-
Feb
10-
Feb
11-
Feb
12-
Feb
13-
Feb
14-
Feb
15-
Feb
16-
Feb
17-
Feb
18-
Feb
19-
Feb
20-
Feb
21-
Feb
22-
Feb
23-
Feb
24-
Feb
25-
Feb
26-
Feb
27-
Feb
28-
Feb
Ambala 24 67 54 51 54 75 47 65 58 53 58 77 62 54 78 55 76 66 70 39 85 40 17 27 73 28 28 111
Jhajjar 96 101 72 82 NA 99 87 68 67 NA 83 140 67 99 71 79 NA NA NA 76 122 43 40 NA 83 32 NA 96
Faridabad NA NA NA 80 NA NA 82 81 60 84 NA NA 75 34 76 77 79 32 49 NA 63 12 33 6 72 NA NA 55
Bhiwani 67 58 51 54 100 75 110 66 69 72 65 100 75 62 60 102 66 53 61 53 101 57 20 33 48 35 46 90
Rewari 109 76 83 43 80 104 56 48 67 59 NA 112 70 56 46 76 80 92 78 57 101 49 57 56 98 28 21 67
Faridabad 51 NA 60 55 78 NA 28 42 53 79 44 73 66 39 78 108 63 39 40 29 79 12 49 34 53 27 13 66
Fatehabad 31 58 36 54 74 67 93 60 79 96 NA 76 65 60 67 102 NA 42 51 59 75 40 35 33 65 NA 45 71
Gurugram 82 48 87 38 NA 83 51 68 49 80 22 136 59 66 58 87 76 45 47 24 82 9 67 43 29 69 NA 61
Hisar 49 60 46 50 63 88 100 61 58 65 68 115 74 59 65 106 76 NA 52 74 72 38 NA 31 31 10 59 76
Jind 51 77 43 51 89 84 61 60 57 33 NA 93 74 60 63 107 75 43 NA 72 69 72 27 63 42 21 45 77
Kaithal 51 61 52 48 78 109 96 83 52 16 NA 75 74 42 63 74 NA 52 61 55 111 41 24 33 51 37 41 62
Karnal 44 67 34 45 78 81 47 67 53 33 46 94 74 29 58 76 76 63 55 70 78 65 30 34 50 33 32 44
Kurukshetra 44 62 NA 76 78 83 NA 58 48 NA 110 91 56 65 75 60 76 63 36 48 86 61 34 35 56 NA 42 75
Mewat 89 57 57 45 111 140 109 50 72 64 119 133 100 76 74 91 83 50 53 52 83 80 59 71 93 18 17 72
Gurugram 74 75 83 58 80 116 82 61 60 57 89 137 63 73 76 83 76 87 68 47 91 50 33 84 97 7 NA 77
Mahendar -garh
47 69 59 46 81 62 109 87 58 50 44 99 58 117 92 125 78 51 51 32 46 79 63 29 73 26 58 65
Palwal 74 86 56 48 137 130 48 62 67 54 NA 131 75 66 61 112 81 68 54 73 76 40 81 42 118 29 21 92
Panchkula 40 44 19 37 63 84 48 62 31 49 51 NA 74 65 81 69 NA 37 57 NA 48 NA 16 35 87 21 13 65
Panipat 35 74 44 41 56 86 62 63 59 41 82 96 99 53 60 54 75 54 63 68 100 20 29 80 69 38 18 74
Rohtak 70 67 53 53 84 87 59 71 70 64 55 104 64 60 60 91 84 62 70 59 96 53 13 61 67 33 20 80
Sirsa 44 62 NA 22 159 68 NA 70 57 81 162 NA 54 65 54 116 75 35 63 66 80 37 26 44 40 13 43 80
Sonipat 106 73 NA 52 68 143 81 79 63 54 NA 104 63 63 46 82 75 55 86 59 122 81 27 118 72 27 22 80
Y.Nagar 59 NA 44 51 85 96 61 61 37 43 23 70 74 44 83 78 77 62 69 NA 81 NA 32 40 50 23 NA 41
Y Nagar= Yamuna Nagar

[66]
Estimated PM 2.5 daily composite for Year 2016 to 2020 for the month of March at ground station points in Haryana
Districts 1-
Mar
2-
Mar
3-
Mar
4-
Mar
5-
Mar
6-
Mar
7-
Mar
8-
Mar
9-
Mar
10-
Mar
11-
Mar
12-
Mar
13-
Mar
14-
Mar
15-
Mar
16-
Mar
17-
Mar
18-
Mar
19-
Mar
20-
Mar
21-
Mar
22-
Mar
23-
Mar
24-
Mar
25-
Mar
26-
Mar
27-
Mar
28-
Mar
29-
Mar
30-
Mar
31-
Mar
Ambala 72 61 70 75 40 30 23 56 52 76 57 51 76 62 52 53 39 NA 63 44 67 59 60 47 39 43 44 52 60 55 43
Jhajjar NA 94 118 93 60 78 67 105 85 83 98 91 83 92 82 92 53 80 51 97 66 46 56 58 61 81 71 53 54 46 76
Faridabad 85 77 115 83 55 43 30 NA NA 87 84 76 59 91 67 55 59 58 69 62 61 50 59 73 54 68 51 61 65 46 69
Bhiwani 107 90 91 109 47 57 42 74 83 66 71 66 66 76 56 92 54 79 70 61 87 53 73 52 58 37 87 47 52 46 57
Rewari 46 93 96 89 42 35 NA 71 85 53 92 69 61 95 53 65 34 52 78 57 61 62 63 58 48 50 51 52 63 52 60
Faridabad 46 74 NA 52 18 36 33 67 83 58 73 62 56 69 55 71 53 32 69 47 59 38 44 29 40 71 40 56 55 47 67
Fatehabad 80 78 68 71 50 39 44 61 61 81 55 73 61 89 48 91 73 61 83 43 59 51 66 39 56 46 73 76 56 31 68
Gurugram 50 67 82 67 52 56 41 80 88 47 72 51 51 80 56 96 38 55 61 NA 94 16 57 23 54 55 50 52 45 43 55
Hisar 87 72 82 71 58 NA 116 53 44 46 63 75 80 70 53 54 13 54 91 56 33 41 44 30 81 47 64 45 50 40 82
Jind 78 66 88 75 85 47 51 76 67 71 48 67 69 73 61 80 54 80 87 87 66 48 73 50 NA 57 77 73 62 61 71
Kaithal 74 84 60 51 54 34 49 68 61 54 NA 66 82 51 56 53 60 53 81 86 59 41 80 38 NA 64 75 48 60 71 39
Karnal 71 89 75 60 47 17 39 57 53 74 54 71 68 94 55 65 33 62 75 73 59 48 49 27 54 60 60 51 62 76 42
Kurukshetra 90 82 74 58 8 15 NA 65 56 74 50 67 77 83 62 72 47 55 65 78 60 74 62 53 NA 47 46 74 59 93 57
Mewat 75 111 85 76 42 32 48 63 68 40 88 56 48 70 43 52 31 45 49 43 54 6 43 42 37 29 24 43 49 35 56
Gurugram 39 110 86 111 51 51 49 69 84 53 69 54 60 76 52 77 77 59 55 84 80 52 51 106 56 45 38 54 63 52 57
Mahendar -garh
53 80 90 54 37 37 64 64 75 48 66 61 59 76 37 68 42 47 78 44 55 49 33 44 28 30 46 39 41 39 NA
Palwal 49 110 89 77 57 69 44 69 123 97 85 69 72 117 69 129 48 48 80 77 108 70 50 80 60 51 62 61 60 65 71
Panchkula 78 54 NA 54 50 26 26 44 14 57 NA 34 57 44 44 29 36 49 41 53 61 50 42 16 NA 43 55 67 46 48 31
Panipat 81 100 67 70 39 33 41 64 65 67 77 61 68 135 64 72 41 61 74 81 74 67 56 55 61 61 55 61 55 66 52
Rohtak 83 96 124 60 32 47 32 75 85 64 63 55 55 82 51 92 43 63 57 64 64 49 49 44 53 41 45 53 48 38 43
Sirsa 86 NA 74 81 51 26 67 61 57 33 72 70 77 81 60 54 60 67 78 NA 42 73 71 42 NA 51 75 57 64 71 53
Sonipat 78 78 78 85 64 36 50 96 72 85 68 69 76 NA 63 135 46 80 141 89 97 56 56 61 56 55 66 65 65 49 74
Y.Nagar 56 76 76 54 51 29 23 50 46 50 62 57 NA 69 44 55 46 57 49 76 60 64 65 54 34 45 47 71 76 67 45
Y Nagar= Yamuna Nagar

[67]
Estimated PM 2.5 daily composite for Year 2016 to 2020 for the month of April at ground station points in Haryana
Districts 1-
Apr
2-
Apr
3-
Apr
4-
Apr
5-
Apr
6-
Apr
7-
Apr
8-
Apr
9-
Apr
10-
Apr
11-
Apr
12-
Apr
13-
Apr
14-
Apr
15-
Apr
16-
Apr
17-
Apr
18-
Apr
19-
Apr
20-
Apr
21-
Apr
22-
Apr
23-
Apr
24-
Apr
25-
Apr
26-
Apr
27-
Apr
28-
Apr
29-
Apr
30-
Apr
Ambala 56 68 43 76 74 112 100 66 36 7 53 55 24 48 39 54 69 64 67 85 72 42 66 54 66 55 65 60 87 63
Jhajjar 74 71 65 72 119 57 150 95 54 49 106 59 39 47 52 76 60 77 75 80 96 39 57 46 NA 52 90 102 77 72
Faridabad 73 64 39 76 61 53 63 66 54 27 62 59 45 54 85 83 56 73 62 NA 80 55 59 46 51 61 74 67 65 67
Bhiwani 51 54 33 87 76 58 120 73 52 29 50 51 41 53 48 NA 48 54 24 NA 23 41 43 NA 75 66 87 33 63 56
Rewari 41 72 31 65 39 21 108 74 62 NA 64 43 2 NA 39 75 63 48 NA NA 23 21 29 NA 88 NA 79 NA 60 71
Faridabad 64 69 22 62 63 45 87 58 48 45 67 32 36 37 55 63 38 28 62 40 59 42 66 42 40 54 71 68 51 58
Fatehabad 82 51 75 96 96 78 93 58 40 59 63 62 41 56 49 56 82 63 63 NA NA 69 40 64 27 55 71 31 71 58
Gurugram 49 57 60 64 73 61 68 66 41 53 95 NA 41 48 55 59 57 44 68 56 72 44 58 51 59 54 67 75 64 65
Hisar 50 57 9 82 65 NA 90 49 38 66 58 41 38 48 41 62 44 54 50 57 48 73 53 30 53 70 83 69 47 42
Jind 78 67 96 73 95 122 140 73 46 37 69 57 37 47 35 NA 73 52 80 NA 59 60 40 43 22 95 89 9 80 67
Kaithal 30 61 61 87 80 100 116 79 63 64 61 37 15 53 24 31 62 55 71 81 109 49 37 59 35 81 80 29 49 91
Karnal 56 68 66 89 105 109 113 55 37 63 60 53 34 52 36 42 43 67 74 83 75 40 73 58 64 79 60 48 84 79
Kurukshetra 51 62 68 98 175 100 96 33 40 69 58 56 58 48 34 78 49 62 88 77 75 33 70 41 60 73 73 44 76 57
Mewat NA 61 14 NA 47 12 74 NA 41 NA 78 47 14 NA 38 NA NA 50 NA NA NA NA NA NA NA NA NA NA NA 71
Gurugram 66 55 28 81 33 54 75 55 63 78 92 46 50 54 61 75 65 60 71 81 93 42 40 48 63 NA 79 65 56 64
Mahendar -garh
58 39 57 54 28 108 54 46 64 NA 55 28 28 29 29 73 NA 60 NA NA 11 NA NA NA 8 28 NA 118 15 40
Palwal 59 65 64 73 80 96 69 67 63 68 80 58 51 44 55 NA 48 44 66 54 86 42 47 38 59 59 80 59 63 66
Panchkula 29 77 27 34 67 NA 106 71 31 103 65 44 64 NA 43 38 53 60 75 77 88 14 60 48 49 61 50 49 73 46
Panipat 70 64 59 79 109 109 120 83 42 66 81 65 42 64 48 76 65 64 109 83 78 44 40 52 67 62 67 82 103 89
Rohtak 43 43 30 57 53 101 45 27 42 61 46 33 NA 55 35 NA NA 50 NA NA 25 NA NA NA NA NA 74 NA NA 71
Sirsa 76 73 NA 91 142 78 75 82 46 78 73 NA 19 66 70 59 70 61 29 57 50 67 43 49 42 16 67 26 45 67
Sonipat 67 59 82 89 73 87 149 91 51 85 46 58 55 54 45 77 86 65 108 89 108 54 44 68 96 NA 75 54 94 72
Y.Nagar 56 76 76 54 51 29 23 50 46 50 62 57 NA 69 44 55 46 57 49 76 60 64 65 54 34 45 47 71 76 67
Y Nagar= Yamuna Nagar

[68]
Estimated PM 2.5 daily composite for Year 2016 to 2020 for the month of May at ground station points in Haryana
Districts 1-
May
2-
May
3-
May
4-
May
5-
May
6-
May
7-
May
8-
May
9-
May
10-
May
11-
May
12-
May
13-
May
14-
May
15-
May
16-
May
17-
May
18-
May
19-
May
20-
May
21-
May
22-
May
23-
May
24-
May
25-
May
26-
May
27-
May
28-
May
29-
May
30-
May
31-
May
Ambala 62 63 62 63 46 145 88 94 86 81 81 64 87 96 106 37 97 68 71 54 88 58 90 104 56 64 54 50 79 75 57
Jhajjar 65 80 77 91 68 NA NA 96 NA 107 85 131 NA 55 NA 74 45 91 39 78 118 NA 78 110 73 72 77 128 NA 82 NA
Faridabad 53 82 NA 64 45 50 80 81 85 NA 75 49 NA 83 59 79 36 84 56 91 71 73 88 76 87 58 47 68 101 71 81
Bhiwani 66 68 94 34 32 NA 71 115 90 97 173 105 75 52 156 62 49 88 45 75 68 75 74 51 51 42 81 105 65 43 103
Rewari 46 78 NA 86 NA NA NA NA 76 104 140 NA NA 24 NA 74 46 68 NA 75 NA NA 28 38 93 NA NA NA 55 81 NA
Faridabad 63 52 50 54 50 71 65 76 90 69 73 94 84 60 81 85 57 60 45 62 63 64 95 67 61 82 74 46 49 85 100
Fatehabad 57 68 82 87 26 NA 51 93 58 67 NA NA NA 65 46 72 12 55 35 73 NA 54 73 NA 56 NA 74 48 NA NA NA
Gurugram 82 84 70 68 68 108 110 75 99 113 90 94 102 98 95 76 112 66 57 64 74 73 95 77 75 81 78 70 97 77 119
Hisar 54 68 71 59 48 54 60 103 86 92 92 90 103 66 119 120 72 60 44 72 53 68 75 26 89 89 72 47 72 49 138
Jind 89 64 77 85 67 NA 57 99 54 84 110 102 87 78 30 91 129 81 52 74 117 65 100 73 48 95 60 84 48 14 104
Kaithal 90 70 68 73 41 90 54 61 61 86 99 74 130 46 35 71 65 79 58 74 86 64 NA 62 44 80 59 76 56 76 106
Karnal 61 63 87 73 59 53 67 70 57 80 79 97 96 97 105 66 70 65 80 72 84 84 76 70 48 73 42 59 82 79 110
Kurukshetra 48 55 51 70 51 51 93 88 66 108 72 118 83 104 105 71 73 65 89 64 54 91 63 104 40 51 62 68 26 93 127
Mewat 71 76 NA NA NA NA NA NA 75 NA NA NA NA NA 32 73 25 39 NA NA NA NA NA NA NA NA NA NA 48 NA NA
Gurugram 42 72 67 73 109 124 74 82 95 109 NA 109 NA 53 34 75 49 92 49 79 205 69 111 75 49 60 NA 73 96 47 91
Mahendar
-garh 46 71 116 75 61 NA NA NA 75 40 NA 56 NA 23 33 72 20 NA 24 74 NA NA NA 50 35 NA 38 NA 44 49 NA
Palwal 80 79 NA 74 96 NA 90 NA 78 68 75 110 99 84 55 78 51 67 45 73 34 67 NA 82 78 58 40 103 46 67 87
Panchkula 63 58 57 37 41 115 41 92 37 107 60 66 66 118 93 120 39 82 75 58 143 90 76 100 55 48 59 49 81 NA 48
Panipat 79 89 51 66 65 75 81 85 77 107 96 117 78 102 125 84 45 99 67 101 108 86 117 96 55 118 65 102 77 65 109
Rohtak 71 79 NA NA NA NA NA NA 77 NA NA NA NA 29 NA 73 NA NA NA NA NA NA NA NA 72 NA NA NA NA 80 76
Sirsa 40 83 NA 82 30 NA 47 NA 59 86 NA 87 NA 40 NA 74 9 74 38 44 NA 50 73 55 47 55 74 NA 60 9 NA
Sonipat 58 89 105 81 57 71 79 NA 90 138 113 174 93 106 80 96 117 78 72 78 107 94 112 94 93 91 80 96 87 98 197
Y.Nagar 45 84 77 49 56 62 62 79 45 76 93 118 56 88 68 90 49 81 67 62 92 100 81 76 69 60 57 56 79 77 71
Y Nagar= Yamuna Nagar

[69]
Estimated PM 2.5 daily composite for Year 2016 to 2020 for the month of June at ground station points in Haryana
Districts 1-
Jun
2-
Jun
3-
Jun
4-
Jun
5-
Jun
6-
Jun
7-
Jun
8-
Jun
9-
Jun
10-
Jun
11-
Jun
12-
Jun
13-
Jun
14-
Jun
15-
Jun
16-
Jun
17-
Jun
18-
Jun
19-
Jun
20-
Jun
21-
Jun
22-
Jun
23-
Jun
24-
Jun
25-
Jun
26-
Jun
27-
Jun
28-
Jun
29-
Jun
30-
Jun
Ambala 88 86 96 61 104 73 116 84 80 74 116 76 103 68 84 67 144 113 116 77 NA 47 75 85 121 60 92 70 96 151
Jhajjar 93 NA 116 NA 72 NA 55 63 66 50 122 133 NA 105 79 NA 76 150 80 87 83 NA 114 93 208 NA NA 85 NA NA
Faridabad 119 83 89 63 107 117 85 73 72 77 105 99 116 83 54 83 136 131 121 77 149 73 84 NA 126 206 139 164 105 91
Bhiwani 170 76 73 60 73 58 104 43 60 45 130 82 107 86 64 80 153 116 140 102 140 31 91 64 153 NA 141 88 91 NA
Rewari 76 71 NA NA NA NA 46 16 60 76 16 NA NA 92 81 84 75 227 NA 88 NA NA NA NA NA NA NA 80 NA 90
Faridabad 118 90 75 87 101 103 54 55 56 68 96 75 134 122 60 183 123 124 110 89 151 62 76 129 134 236 NA 148 81 96
Fatehabad 53 NA NA NA NA 23 57 19 68 56 116 82 NA NA NA NA 77 NA 75 NA 53 33 87 NA NA NA NA 88 NA NA
Gurugram 116 118 96 108 104 111 106 59 59 99 101 85 91 118 61 79 175 120 105 90 92 69 103 NA 90 NA NA 165 81 117
Hisar 107 82 51 93 84 64 103 56 103 76 93 86 98 122 69 77 172 199 134 82 61 23 79 203 118 137 135 101 111 NA
Jind 105 95 106 84 94 136 96 97 97 89 100 82 NA 104 99 111 83 154 128 113 120 60 84 106 158 226 207 94 107 101
Kaithal 62 72 131 81 87 NA 115 46 103 70 87 73 NA NA 70 81 71 104 97 141 NA 80 107 166 179 46 202 91 92 190
Karnal 81 68 99 71 91 145 86 105 90 83 96 106 101 71 115 83 164 148 181 135 122 93 138 78 144 73 93 73 106 163
Kurukshetra 85 82 93 85 108 91 98 62 89 84 103 72 90 69 59 82 77 128 101 131 209 78 79 135 165 176 94 128 106 NA
Mewat 74 NA 76 NA NA 83 62 NA NA 75 26 NA NA NA NA NA 74 NA NA 93 NA NA NA NA NA NA NA NA NA 117
Gurugram 75 74 116 NA 80 101 42 49 67 76 127 121 100 NA 64 80 76 NA NA 98 81 NA NA NA 115 NA 88 201 88 93
Mahendar
-garh 74 NA 30 NA 77 25 NA 3 6 48 133 104 108 NA NA NA 74 87 63 92 NA NA 43 65 66 64 59 81 NA NA
Palwal 97 103 106 82 97 87 105 48 82 98 104 96 122 NA 61 81 76 131 91 122 115 85 124 262 114 180 199 156 90 75
Panchkula 94 69 92 90 122 70 132 89 73 37 93 51 95 175 68 78 68 103 84 142 NA 82 63 NA 112 80 NA 84 76 99
Panipat 104 113 141 96 105 98 105 93 139 111 119 120 104 120 64 84 130 133 163 146 113 97 104 114 177 107 209 109 109 197
Rohtak 74 NA NA NA NA NA NA NA NA 73 109 NA NA NA NA NA 73 167 NA 81 NA NA NA NA NA NA NA NA NA NA
Sirsa 56 95 91 38 85 25 94 52 61 64 113 80 NA NA 58 NA 97 124 83 84 NA 73 66 149 64 75 137 140 63 199
Sonipat 113 117 102 115 109 117 NA 79 96 83 121 99 116 102 73 81 76 222 134 NA NA 61 113 119 194 330 216 86 93 144
Y.Nagar 82 82 107 86 94 93 108 55 81 91 87 77 88 96 91 82 144 82 110 123 100 91 90 91 87 133 95 81 105 159
Y Nagar= Yamuna Nagar

[70]
Estimated PM 2.5 daily composite for Year 2016 to 2020 for the month of July at ground station points in Haryana
Districts 1-
Jul
2-
Jul
3-
Jul
4-
Jul
5-
Jul
6-
Jul
7-
Jul
8-
Jul
9-
Jul
10-
Jul
11-
Jul
12-
Jul
13-
Jul
14-
Jul
15-
Jul
16-
Jul
17-
Jul
18-
Jul
19-
Jul
20-
Jul
21-
Jul
22-
Jul
23-
Jul
24-
Jul
25-
Jul
26-
Jul
27-
Jul
28-
Jul
29-
Jul
30-
Jul
31-
Jul
Ambala NA 106 NA 91 88 95 53 NA 185 203 NA NA 64 NA NA NA NA NA NA 109 NA 152 NA 85 NA NA NA NA 94 NA NA
Jhajjar 56 NA 92 79 NA 114 NA NA 117 NA NA 85 NA NA NA 458 NA NA NA NA 166 164 170 NA NA NA 89 83 263 94 NA
Faridabad NA NA 163 108 167 139 NA NA 181 161 NA 86 83 185 83 242 NA NA NA 146 140 182 NA 131 NA NA 84 84 163 NA NA
Bhiwani 83 NA 87 114 82 88 162 173 103 145 169 199 91 91 91 89 NA NA NA 88 103 232 97 186 NA NA NA 85 181 NA 165
Rewari NA NA NA 78 NA NA 202 143 80 141 151 NA NA NA NA NA NA NA 104 NA 118 152 126 190 NA NA 82 80 NA NA NA
Faridabad 39 NA 96 NA 152 99 NA NA 165 NA NA 86 79 190 79 NA 95 NA NA 109 126 167 217 164 NA NA 86 80 206 NA NA
Fatehabad 72 148 NA 101 100 131 155 NA 100 182 187 NA 91 91 91 92 NA NA 116 NA 132 NA NA 100 88 171 NA 80 78 NA NA
Gurugram 69 NA 91 NA NA 167 NA NA 137 NA 416 NA 78 167 78 NA NA NA 223 160 NA 111 NA NA NA NA 85 81 185 NA NA
Hisar 81 89 82 123 106 147 168 191 110 203 135 82 88 88 88 90 NA NA NA 81 NA 85 NA 124 NA NA NA 81 145 NA NA
Jind 179 NA NA 100 239 78 127 194 143 271 232 93 89 89 89 NA NA NA 268 NA 156 142 NA NA NA 196 NA NA 241 NA NA
Kaithal NA NA 108 86 98 NA 117 NA 167 288 NA NA 88 88 88 NA NA 256 NA 96 218 196 NA NA NA NA NA NA 240 80 183
Karnal 110 229 173 125 NA 213 155 172 NA 281 NA NA 85 85 85 96 NA NA NA NA 170 215 NA NA 92 NA NA NA NA NA NA
Kurukshetra 193 NA 107 91 96 229 102 NA 207 227 578 NA 84 84 84 NA NA 102 NA NA 178 163 NA NA NA NA NA NA 149 NA NA
Mewat NA NA NA 78 87 80 100 101 174 NA NA NA NA NA NA NA NA NA NA 70 88 NA 114 78 NA NA NA NA NA NA NA
Gurugram 45 NA 90 79 NA 79 128 NA 126 178 136 85 83 162 83 NA NA NA 109 NA 101 165 NA 167 NA NA NA 82 NA NA NA
Mahendar
-garh 72 NA 87 76 NA 74 117 NA 55 80 88 NA 89 87 96 NA NA NA NA 96 88 90 70 NA NA NA NA NA NA 86 NA
Palwal 65 221 204 162 147 125 181 150 226 183 NA 88 229 166 82 280 NA NA 120 160 111 142 NA NA 94 NA 83 81 253 NA NA
Panchkula 71 NA NA 96 131 139 53 91 NA 218 NA NA NA NA NA NA 90 NA 96 NA NA NA 204 83 NA NA NA NA NA NA NA
Panipat 101 286 188 123 354 274 180 194 NA 236 NA NA 86 86 86 NA NA NA 104 NA 142 119 236 NA 94 NA NA NA NA NA NA
Rohtak 58 NA NA 78 NA NA 61 140 92 NA 105 NA 88 88 88 NA NA NA NA 73 79 103 89 NA NA NA NA 78 199 86 NA
Sirsa 100 153 130 126 181 185 137 214 77 202 91 NA 90 120 90 187 NA NA 147 133 79 146 NA 138 73 129 NA 88 80 NA NA
Sonipat NA 288 104 88 NA 151 NA 197 196 NA NA NA 88 88 88 NA NA NA NA 90 204 241 NA NA NA NA NA 87 135 NA NA
Y.Nagar 122 90 NA 101 181 192 150 247 172 256 NA NA 82 82 82 NA NA NA NA NA NA NA NA NA NA NA NA NA NA NA NA
Y Nagar= Yamuna Nagar

[71]
Estimated PM 2.5 daily composite for Year 2016 to 2020 for the month of August at ground station points in Haryana
Districts 1-
Aug
2-
Aug
3-
Aug
4-
Aug
5-
Aug
6-
Aug
7-
Aug
8-
Aug
9-
Aug
10-
Aug
11-
Aug
12-
Aug
13-
Aug
14-
Aug
15-
Aug
16-
Aug
17-
Aug
18-
Aug
19-
Aug
20-
Aug
21-
Aug
22-
Aug
23-
Aug
24-
Aug
25-
Aug
26-
Aug
27-
Aug
28-
Aug
29-
Aug
30-
Aug
31-
Aug
Ambala 44 NA 91 NA NA NA NA NA NA NA 187 NA NA NA NA 49 74 NA NA 49 NA 86 NA NA NA 77 NA 53 27 NA NA
Jhajjar NA NA 148 NA NA 158 NA NA NA NA 184 NA NA NA 127 111 116 NA NA NA NA NA NA NA NA NA NA NA NA NA 175
Faridabad 56 NA 152 NA NA NA NA NA NA NA NA NA NA NA 156 103 NA 127 NA NA NA 114 NA NA NA NA 47 NA NA NA NA
Bhiwani 115 153 80 NA 83 NA NA NA 201 NA NA NA NA NA 108 62 69 114 NA NA 70 34 56 NA NA NA NA NA NA 122 NA
Rewari 49 NA 118 NA NA NA NA NA NA NA NA NA NA NA 119 NA 92 NA NA NA NA 61 64 NA 152 NA NA NA NA NA NA
Faridabad NA NA 82 NA NA 117 NA NA NA NA NA NA NA NA 230 100 107 109 NA NA NA 165 NA NA NA NA 80 NA NA NA NA
Fatehabad 62 154 183 NA NA 120 NA NA 165 NA 117 NA 148 NA NA 39 59 89 81 NA 155 44 53 100 NA 77 NA NA NA NA 76
Gurugram 56 NA 81 NA NA NA NA NA NA NA NA NA NA NA NA 74 100 71 NA NA NA 90 84 NA NA NA 55 NA NA NA NA
Hisar 125 199 NA NA NA 131 NA NA 138 NA NA NA 82 NA 103 71 61 100 NA NA 214 35 32 NA NA NA NA NA NA 84 NA
Jind 66 NA 84 56 130 180 75 NA 285 NA NA NA 170 NA NA NA 67 NA NA NA NA 51 NA NA NA NA NA NA 78 112 NA
Kaithal NA NA 84 220 NA NA NA NA NA NA 118 NA NA NA NA 103 53 NA NA NA NA NA NA 79 NA 76 NA NA NA 98 NA
Karnal 38 NA 81 211 NA 194 NA NA NA NA NA NA NA 137 92 NA 82 72 NA 16 NA NA NA NA NA NA NA NA NA NA NA
Kurukshetra NA NA 79 89 NA NA NA NA NA NA NA NA NA NA NA 54 74 NA 52 NA NA NA NA NA NA NA NA NA 35 NA NA
Mewat 51 NA NA NA NA NA NA 16 NA NA NA NA NA NA 114 NA 98 56 NA NA 61 NA NA NA NA NA NA NA NA NA NA
Gurugram 51 NA 123 NA NA NA NA NA NA NA NA NA NA NA 138 90 NA 52 NA NA NA NA NA NA NA NA NA NA NA NA NA
Mahendar -garh
45 NA 77 NA NA NA NA NA NA NA NA NA NA NA NA NA NA 53 NA NA 43 50 63 NA NA NA 52 NA NA NA 84
Palwal 60 NA 81 NA NA 177 NA 32 NA NA 149 NA NA NA NA 128 NA NA NA NA NA 108 92 NA NA NA 63 NA NA NA NA
Panchkula NA NA NA NA NA NA NA NA NA NA NA NA NA NA NA NA 38 NA NA NA NA 37 NA 82 NA 69 NA NA NA NA NA
Panipat 54 241 85 NA NA NA NA NA NA NA NA NA 87 124 91 NA 93 68 NA 6 NA NA NA NA NA NA 64 NA NA NA NA
Rohtak 52 79 80 NA NA NA NA NA 176 NA NA NA 84 76 99 73 72 100 NA NA 52 41 56 NA 135 NA 13 NA 73 63 NA
Sirsa 63 219 133 NA 90 85 77 NA NA NA NA 80 NA NA 112 NA 52 NA 63 92 49 NA NA 82 NA 81 NA NA 67 NA NA
Sonipat 55 NA NA NA NA 187 74 NA NA NA NA NA NA 150 184 98 102 93 NA 11 NA NA 72 NA NA 64 NA NA NA NA NA
Y.Nagar 46 NA NA 43 NA 79 NA NA NA NA NA NA NA NA 161 NA NA NA NA 18 NA NA NA NA NA 46 51 NA 22 NA NA
Y Nagar= Yamuna Nagar

[72]
Estimated PM 2.5 daily composite for Year 2016 to 2020 for the month of September at ground station points in Haryana
Districts 1-
Sep
2-
Sep
3-
Sep
4-
Sep
5-
Sep
6-
Sep
7-
Sep
8-
Sep
9-
Sep
10-
Sep
11-
Sep
12-
Sep
13-
Sep
14-
Sep
15-
Sep
16-
Sep
17-
Sep
18-
Sep
19-
Sep
20-
Sep
21-
Sep
22-
Sep
23-
Sep
24-
Sep
25-
Sep
26-
Sep
27-
Sep
28-
Sep
29-
Sep
30-
Sep
Ambala NA NA NA NA 57 NA 139 49 77 NA 73 107 NA 113 29 100 257 68 NA 69 64 147 86 76 93 127 128 184 87 98
Jhajjar NA NA NA 61 87 66 105 NA 171 NA 49 99 72 83 51 46 73 73 95 75 96 NA 84 NA 80 83 79 84 106 47
Faridabad NA NA NA NA 78 68 NA 104 106 103 80 72 73 65 98 42 NA 75 140 85 105 180 79 NA 84 87 72 92 69 45
Bhiwani NA NA 108 NA NA 44 78 67 68 52 67 84 65 65 79 73 110 69 80 64 107 98 92 56 15 58 43 60 66 52
Rewari NA NA NA 47 NA NA 83 NA 89 52 60 77 61 69 58 NA 103 68 88 55 41 142 81 50 NA 53 37 58 50 56
Faridabad NA NA NA NA 118 67 NA NA NA 107 107 80 87 NA 76 46 127 76 131 89 104 180 NA NA 77 80 83 66 100 71
Fatehabad NA NA 65 26 71 35 76 NA 53 69 58 72 70 54 95 67 75 64 56 84 76 109 100 79 84 79 59 71 66 53
Gurugram NA NA NA NA 74 91 99 90 NA 88 77 67 83 79 55 NA 82 74 87 83 125 NA 78 NA NA 59 74 78 85 83
Hisar NA NA NA NA NA 34 80 68 62 81 55 78 68 NA NA 66 71 57 90 71 77 93 81 61 113 76 70 78 74 52
Jind NA NA NA NA 61 61 83 79 96 NA 76 74 74 71 74 48 113 73 107 76 92 120 100 53 83 83 77 90 92 68
Kaithal NA NA NA NA 50 49 143 69 87 103 55 88 92 57 63 75 91 68 76 59 135 143 221 NA 90 87 92 89 105 97
Karnal NA NA NA NA 48 181 NA 59 87 NA 57 84 96 118 65 62 97 61 98 106 NA 190 89 45 87 115 91 86 130 124
Kurukshetra NA NA 61 NA 57 NA 135 65 NA NA 79 88 116 94 62 113 144 69 142 79 28 166 NA 57 95 151 103 122 80 103
Mewat NA NA NA NA NA 55 77 43 81 40 38 NA 50 57 49 17 68 56 NA 33 45 115 NA 43 41 47 31 43 45 16
Gurugram NA NA NA 55 66 88 103 95 89 NA 74 83 69 NA 87 34 100 71 75 80 54 147 80 NA NA 53 49 58 70 52
Mahendar
-garh NA NA 76 NA NA NA 57 58 NA 35 52 58 28 56 62 49 79 42 25 56 55 34 81 57 112 50 26 29 45 32
Palwal NA NA NA 56 76 55 NA 67 96 60 71 86 67 72 71 78 84 72 108 83 100 145 81 NA 49 78 73 84 56 75
Panchkula NA NA 18 30 28 NA NA NA NA NA 108 241 NA 90 NA 79 78 84 148 77 60 79 56 63 46 NA 155 79 75 34
Panipat NA NA NA NA 62 NA 83 71 103 83 85 87 102 56 48 61 110 76 92 80 89 80 88 56 78 85 89 87 122 100
Rohtak NA NA NA NA 64 38 64 58 64 45 62 63 47 49 52 56 86 57 35 67 52 92 NA 60 102 43 24 28 45 39
Sirsa NA NA NA NA 93 42 75 53 53 72 71 83 66 71 82 84 57 60 69 76 95 85 99 89 83 99 72 60 70 69
Sonipat NA NA NA NA 70 89 79 97 79 82 99 86 86 97 54 114 85 65 102 56 144 129 152 98 NA 82 77 83 122 73
Y.Nagar NA NA NA NA 63 NA NA 80 NA NA 103 91 NA NA NA 42 90 72 174 172 NA 190 82 54 55 105 NA 81 76 120
Y Nagar= Yamuna Nagar

[73]
Estimated PM 2.5 daily composite for Year 2016 to 2020 for the month of October at ground station points in Haryana
Districts 1-
Oct
2-
Oct
3-
Oct
4-
Oct
5-
Oct
6-
Oct
7-
Oct
8-
Oct
9-
Oct
10-
Oct
11-
Oct
12-
Oct
13-
Oct
14-
Oct
15-
Oct
16-
Oct
17-
Oct
18-
Oct
19-
Oct
20-
Oct
21-
Oct
22-
Oct
23-
Oct
24-
Oct
25-
Oct
26-
Oct
27-
Oct
28-
Oct
29-
Oct
30-
Oct
31-
Oct
Ambala 62 71 194 78 110 63 86 86 87 108 96 64 69 100 73 90 100 79 66 78 86 91 112 76 80 131 81 71 66 106 100
Jhajjar 57 79 67 86 68 64 103 104 82 108 102 88 89 70 61 80 74 98 92 81 89 71 80 102 110 117 111 132 NA 139 NA
Faridabad 68 57 65 78 56 58 65 78 77 104 94 93 99 62 68 86 88 89 83 69 91 75 62 110 76 88 97 125 NA 90 NA
Bhiwani 51 34 104 72 97 73 88 62 80 97 95 109 68 74 63 75 77 75 82 68 105 61 81 99 110 118 172 155 94 130 269
Rewari 21 21 47 66 44 64 NA 76 66 87 109 72 64 64 29 53 58 61 50 116 NA 48 NA 73 NA 89 159 140 NA 119 NA
Faridabad 44 56 57 96 61 66 66 89 75 104 106 118 84 74 93 86 94 98 70 90 79 82 81 100 109 80 145 99 94 143 82
Fatehabad 105 131 106 206 70 84 71 65 113 122 109 106 70 85 72 89 84 106 86 73 81 60 88 152 101 158 152 180 211 155 259
Gurugram 67 57 60 100 64 62 63 91 78 100 106 73 99 53 73 72 96 74 72 96 103 69 67 153 90 92 127 101 97 125 171
Hisar 90 95 53 61 91 102 60 75 88 85 88 93 75 57 52 84 78 78 75 72 100 51 74 115 103 69 113 159 88 115 199
Jind 51 164 167 78 125 60 81 82 110 106 153 101 89 67 75 122 76 99 97 72 74 89 87 147 99 138 123 112 157 195 84
Kaithal 142 55 187 80 63 53 82 101 100 136 114 89 100 73 89 138 101 104 106 83 63 80 100 127 104 133 120 84 113 148 NA
Karnal 44 66 157 87 56 56 58 98 113 132 113 98 86 77 71 76 83 82 95 84 75 77 97 81 89 102 121 88 105 144 79
Kurukshetra 52 59 166 113 52 54 84 91 88 112 77 68 72 61 83 98 102 78 81 76 79 67 125 80 93 NA 91 79 78 107 77
Mewat 76 11 42 39 44 NA NA 69 46 83 68 62 35 59 34 99 82 NA 26 108 66 30 46 66 116 NA 108 77 168 121 NA
Gurugram 61 51 74 85 63 71 57 86 78 99 86 94 77 78 74 99 85 97 66 93 110 63 93 115 97 98 88 133 NA 117 117
Mahendar -garh
42 21 41 39 60 54 46 45 NA 58 45 36 40 40 26 53 79 56 48 86 64 30 41 46 101 70 101 65 64 137 88
Palwal 59 71 68 79 68 64 67 61 84 107 115 80 89 95 74 106 94 103 81 93 138 82 91 113 114 103 122 112 NA 124 125
Panchkula 58 163 77 61 50 58 111 80 80 69 82 69 69 48 58 62 66 80 76 75 47 61 54 51 82 102 64 92 90 133 73
Panipat 54 58 90 95 64 57 90 98 103 127 101 104 99 79 99 84 110 87 103 97 69 67 100 110 119 102 117 95 79 135 156
Rohtak 33 32 33 77 39 57 23 48 49 65 45 63 24 86 32 45 43 40 63 96 53 10 59 NA NA 79 NA 81 73 NA NA
Sirsa 131 115 140 65 71 87 74 83 120 124 92 92 74 65 65 77 80 78 82 79 83 54 79 123 108 145 136 200 83 84 179
Sonipat 51 88 94 91 118 56 95 90 84 106 96 120 107 69 97 135 95 98 101 90 106 73 90 126 121 136 98 123 130 137 83
Y.Nagar 76 73 83 94 64 66 52 86 79 100 107 65 74 53 75 76 71 70 57 65 74 74 77 69 74 101 66 81 60 72 72
Y Nagar= Yamuna Nagar

[74]
Estimated PM 2.5 daily composite for Year 2016 to 2020 for the month of November at ground station points in Haryana
Districts 1-
Nov
2-
Nov
3-
Nov
4-
Nov
5-
Nov
6-
Nov
7-
Nov
8-
Nov
9-
Nov
10-
Nov
11-
Nov
12-
Nov
13-
Nov
14-
Nov
15-
Nov
16-
Nov
17-
Nov
18-
Nov
19-
Nov
20-
Nov
21-
Nov
22-
Nov
23-
Nov
24-
Nov
25-
Nov
26-
Nov
27-
Nov
28-
Nov
29-
Nov
30-
Nov
Ambala 112 109 73 101 53 100 56 60 73 77 56 82 65 84 64 77 42 54 78 100 65 77 40 55 47 43 79 93 70 66
Jhajjar 104 102 93 69 71 85 71 93 110 NA 107 169 NA 85 131 90 NA NA 104 126 94 76 59 59 229 NA 60 92 76 78
Faridabad 84 NA 92 82 98 56 NA NA 79 NA NA NA NA NA NA 65 112 NA 89 NA 81 77 35 NA 75 NA NA 77 51 80
Bhiwani 93 96 79 193 50 108 48 221 101 127 102 84 103 144 NA 91 103 90 80 99 88 62 41 68 57 58 61 62 59 60
Rewari 116 87 NA 87 NA 85 89 NA 168 NA 39 52 NA 119 94 61 73 82 NA 71 NA 53 41 73 63 NA 40 52 37 78
Faridabad 98 116 130 103 105 68 81 93 66 174 146 82 NA 83 104 87 91 118 83 91 82 76 50 38 92 49 56 64 53 111
Fatehabad 116 116 85 147 152 69 69 105 98 90 87 84 83 156 190 28 98 64 67 75 50 65 NA 63 46 NA 77 74 46 59
Gurugram 124 146 90 141 101 59 67 93 134 135 95 140 182 91 105 59 142 83 83 91 88 74 73 68 83 52 70 123 67 78
Hisar 110 100 137 128 41 61 56 89 116 117 59 99 124 139 NA 112 80 85 73 78 83 52 53 47 61 60 57 114 80 96
Jind 142 110 90 162 52 65 85 100 NA 141 156 79 117 111 NA 59 57 94 82 99 69 73 59 71 54 51 42 69 65 81
Kaithal 152 136 85 94 62 64 50 64 44 88 NA 79 108 NA 140 NA 38 74 73 121 53 81 44 34 47 69 51 52 65 81
Karnal 171 122 90 72 47 59 58 73 83 121 NA 87 111 NA 133 31 55 72 86 85 77 75 48 39 73 36 42 52 76 91
Kurukshetra 137 130 80 85 62 98 70 66 25 98 99 77 103 82 119 38 49 72 86 91 72 79 46 45 68 39 61 63 78 79
Mewat NA 102 94 96 63 209 131 152 119 179 117 285 121 NA 196 84 115 69 97 78 92 68 44 50 98 86 57 100 77 68
Gurugram 100 84 92 88 87 77 79 98 80 NA 90 75 113 89 100 NA 150 72 82 89 96 65 56 82 48 72 71 63 73 68
Mahendar -garh
69 62 NA 74 63 73 60 68 69 49 30 44 80 NA 153 102 67 72 46 50 61 37 58 46 88 22 34 101 54 93
Palwal 124 126 91 75 75 52 88 NA 42 NA 121 82 NA NA 110 83 66 80 86 112 80 73 32 36 80 38 29 62 70 87
Panchkula 132 84 92 101 94 96 62 82 94 80 67 78 63 101 116 60 7 64 57 68 47 59 25 23 38 34 40 27 70 38
Panipat 91 141 NA 80 47 62 47 72 48 NA NA 110 118 90 NA 34 44 84 76 100 56 77 41 53 74 47 54 53 75 82
Rohtak NA 77 NA 75 NA 38 36 NA NA NA NA 66 107 NA NA 46 NA NA 50 41 70 56 35 NA 51 NA 54 NA 45 47
Sirsa 156 103 82 98 122 137 73 83 96 53 89 NA 101 NA NA 48 NA 49 72 68 49 51 NA 53 23 NA 54 77 42 72
Sonipat 116 125 93 90 59 66 78 85 102 109 193 122 112 112 150 NA 58 97 104 121 94 102 59 65 80 52 61 74 69 102
Y.Nagar 107 75 68 65 57 63 80 55 61 58 65 68 109 82 108 32 40 30 73 83 55 59 47 38 34 30 34 71 74 74
Y Nagar= Yamuna Nagar

[75]
Estimated PM 2.5 daily composite for Year 2016 to 2020 for the month of December at ground station points in Haryana
Districts 1-
Dec
2-
Dec
3-
Dec
4-
Dec
5-
Dec
6-
Dec
7-
Dec
8-
Dec
9-
Dec
10-
Dec
11-
Dec
12-
Dec
13-
Dec
14-
Dec
15-
Dec
16-
Dec
17-
Dec
18-
Dec
19-
Dec
20-
Dec
21-
Dec
22-
Dec
23-
Dec
24-
Dec
25-
Dec
26-
Dec
27-
Dec
28-
Dec
29-
Dec
30-
Dec
31-
Dec
Ambala 80 98 59 102 80 57 59 58 NA 78 88 75 95 66 41 32 44 52 70 92 NA 50 NA 63 90 75 84 50 60 78 46
Jhajjar 90 74 81 86 100 85 86 67 81 79 82 NA 117 NA 74 47 53 55 63 NA 83 52 49 183 NA NA 90 NA 111 103 NA
Faridabad 83 66 66 NA 83 NA 85 80 NA 84 NA NA NA 77 80 40 NA NA NA NA 59 NA NA NA NA NA NA NA NA NA 80
Bhiwani 71 50 57 77 61 58 64 67 82 59 78 96 122 58 67 39 25 38 60 84 84 56 43 105 136 67 82 101 69 87 97
Rewari 75 60 38 76 92 65 77 68 89 63 86 64 91 76 38 29 37 36 63 62 81 58 39 85 94 91 61 45 76 89 60
Faridabad 65 79 61 NA 74 86 93 57 79 79 NA NA NA 76 61 NA 37 47 48 NA NA 29 80 109 NA NA NA NA 47 NA 65
Fatehabad 60 53 55 NA 80 53 40 64 85 56 78 NA 68 59 40 37 52 37 49 74 114 31 24 112 120 73 135 74 70 79 109
Gurugram 66 59 56 63 77 84 99 65 99 67 NA NA 116 62 66 40 45 44 52 58 NA 75 33 115 105 NA 72 46 46 NA 57
Hisar 68 50 49 86 80 49 35 58 81 94 79 84 87 NA 44 42 NA 30 33 NA 46 22 18 78 96 81 94 NA 70 56 NA
Jind 79 81 60 92 74 69 68 57 81 93 99 NA 123 89 68 43 34 54 56 98 97 62 58 114 125 82 119 93 70 92 69
Kaithal 67 77 65 77 90 74 70 60 68 102 76 79 122 94 66 40 40 44 62 55 67 62 87 134 111 93 122 75 76 99 74
Karnal 83 90 74 90 87 71 61 57 78 80 97 78 137 47 56 57 41 38 76 67 NA 68 NA 72 109 92 NA 62 58 81 66
Kurukshetra 81 94 63 90 104 70 68 58 85 70 77 78 88 46 55 54 33 49 77 62 97 34 86 53 140 84 114 64 68 NA 106
Mewat 78 94 56 85 73 85 95 105 97 91 89 260 128 81 58 32 27 39 62 63 64 55 48 87 97 67 70 48 56 130 83
Gurugram 75 68 69 79 61 76 76 85 107 87 80 84 104 88 70 34 35 16 61 67 71 75 91 124 162 83 56 NA NA 68 109
Mahendar -garh
63 64 68 54 52 50 78 70 77 53 59 30 86 74 56 32 21 27 40 49 61 41 53 67 44 132 43 35 60 51 47
Palwal 69 62 60 75 65 85 116 69 98 71 86 180 93 76 61 71 39 41 58 81 124 60 90 134 153 86 87 73 74 139 NA
Panchkula 59 61 73 88 66 57 58 46 38 93 70 63 NA NA 55 10 53 22 68 65 52 71 64 31 30 46 73 60 61 80 47
Panipat 83 96 88 99 89 78 85 58 90 92 79 NA 108 65 58 59 66 50 72 74 57 60 95 79 127 87 124 65 75 NA 68
Rohtak 54 45 49 61 71 51 92 71 113 51 83 56 97 53 61 30 28 34 59 62 75 32 87 40 105 67 64 44 68 69 91
Sirsa 61 47 51 34 79 49 51 48 79 61 78 87 75 87 43 34 44 32 49 60 74 53 24 127 141 77 122 79 76 64 NA
Sonipat 74 97 70 84 83 79 67 63 91 91 81 NA 109 68 93 63 61 47 75 92 73 74 78 137 109 95 97 83 84 NA 71
Y.Nagar 69 87 64 87 66 77 56 57 65 86 75 79 55 57 34 27 76 35 128 75 51 97 81 53 100 81 68 87 57 98 52
Y Nagar= Yamuna Nagar

[76]
9. ANNEXURE III
Estimated PM 10 daily composite for Year 2016 to 2020 for the month of January at ground station points in Haryana
Districts 1-
Jan
2-
Jan
3-
Jan
4-
Jan
5-
Jan
6-
Jan
7-
Jan
8-
Jan
9-
Jan
10-
Jan
11-
Jan
12-
Jan
13-
Jan
14-
Jan
15-
Jan
16-
Jan
17-
Jan
18-
Jan
19-
Jan
20-
Jan
21-
Jan
22-
Jan
23-
Jan
24-
Jan
25-
Jan
26-
Jan
27-
Jan
28-
Jan
29-
Jan
30-
Jan
31-
Jan
Ambala 115 110 133 167 207 164 234 184 146 132 124 177 128 111 NA 64 182 316 176 NA 175 144 120 115 154 90 185 169 111 116 NA
Jhajjar NA NA 204 184 261 238 NA 282 158 110 137 207 NA NA 134 NA 194 167 NA NA NA NA 129 136 NA 164 222 NA 119 340 NA
Faridabad 186 NA 275 NA 157 NA NA NA 176 151 NA 270 NA NA 174 NA NA 177 172 NA NA NA NA NA NA NA 170 318 160 NA 155
Bhiwani 166 211 156 176 179 256 167 116 141 144 109 205 235 59 128 73 201 152 NA 115 206 264 NA 198 136 129 220 191 184 177 155
Rewari 188 219 191 153 215 210 158 170 130 128 133 187 173 97 122 314 180 135 144 NA NA 271 136 231 188 135 NA NA 103 157 153
Faridabad 203 NA 176 192 149 NA 243 NA 106 144 NA 173 124 86 128 65 213 NA 155 62 NA 145 124 NA 170 117 176 78 114 111 130
Fatehabad NA 213 165 189 511 NA 213 114 134 118 141 181 313 78 144 NA 285 209 199 NA 56 166 127 241 138 155 258 134 167 200 NA
Gurugram 191 412 139 174 175 NA 192 134 136 93 132 142 NA 98 123 73 NA 109 120 82 82 136 126 198 221 138 180 150 93 124 132
Hisar NA 214 148 159 165 327 117 95 68 123 125 241 90 66 129 NA 178 NA 163 NA NA 333 128 133 137 154 142 117 61 171 NA
Jind 248 195 163 213 168 344 214 NA 129 124 145 204 320 104 142 NA 236 170 155 NA 145 224 133 195 183 119 259 197 104 132 224
Kaithal 152 85 174 200 269 NA 131 137 100 96 111 228 178 86 128 89 297 108 81 NA NA 166 136 139 163 139 240 108 162 127 NA
Karnal 130 194 155 202 235 NA 122 160 80 113 170 159 208 86 78 NA 146 142 80 111 NA 127 120 149 141 140 337 125 NA NA 84
Kurukshetra 114 75 139 169 197 NA 130 158 139 104 174 187 108 86 100 94 186 107 91 NA NA 135 125 163 167 NA 256 NA 184 276 NA
Mewat 185 289 220 202 256 373 214 260 149 123 138 181 133 158 149 45 192 196 124 107 99 225 141 210 236 144 222 380 177 178 196
Gurugram 230 237 165 182 196 195 NA NA NA 127 122 178 156 113 140 NA 245 150 227 NA 179 NA 141 236 135 176 225 NA 164 161 171
Mahendar
-garh 176 191 201 134 181 270 156 170 98 112 88 184 248 71 97 135 138 119 139 97 64 199 121 160 135 121 174 113 167 126 151
Palwal 177 277 228 238 231 202 294 150 145 127 114 190 244 200 166 153 240 212 157 55 NA 246 151 NA 187 112 227 404 185 210 188
Panchkula 90 NA 97 NA 134 NA 108 NA 112 127 113 120 142 85 131 112 NA 97 59 109 142 128 96 80 89 128 253 NA 176 118 162
Panipat 157 219 169 215 239 397 259 107 126 131 192 180 222 97 131 81 205 177 77 109 90 180 129 181 144 82 186 129 NA 110 179
Rohtak 135 217 154 148 253 285 137 164 130 118 116 186 149 75 120 47 180 162 112 89 142 243 131 251 185 132 208 126 127 163 177
Sirsa 210 264 158 183 310 NA 142 NA 142 116 157 110 118 68 NA NA 187 NA 230 101 65 172 126 182 NA 149 149 NA 126 147 NA
Sonipat 252 198 195 229 272 431 108 109 112 121 156 194 235 168 136 96 303 199 113 122 NA 177 182 188 NA 134 259 142 212 213 NA
Y.Nagar 62 NA 119 199 146 175 138 213 138 116 136 170 131 69 NA 190 116 124 136 134 193 176 109 125 103 130 249 150 218 122 159
Y Nagar= Yamuna Nagar

[77]
Estimated PM 10 daily composite for Year 2016 to 2020 for the month of February at ground station points in Haryana
Districts 1-
Feb
2-
Feb
3-
Feb
4-
Feb
5-
Feb
6-
Feb
7-
Feb
8-
Feb
9-
Feb
10-
Feb
11-
Feb
12-
Feb
13-
Feb
14-
Feb
15-
Feb
16-
Feb
17-
Feb
18-
Feb
19-
Feb
20-
Feb
21-
Feb
22-
Feb
23-
Feb
24-
Feb
25-
Feb
26-
Feb
27-
Feb
28-
Feb
Ambala 60 135 106 114 97 153 124 114 131 97 134 161 121 106 129 115 124 139 130 119 180 71 95 18 143 116 68 225
Jhajjar 196 206 131 172 162 219 204 158 142 NA 171 280 141 202 139 150 159 NA NA 158 290 121 113 99 166 114 NA 197
Faridabad NA NA NA NA 154 NA NA 167 128 NA 176 NA NA 105 NA 134 157 106 78 77 133 37 33 68 152 NA NA 119
Bhiwani 141 138 111 99 200 145 230 139 149 146 146 220 137 126 119 200 125 120 118 125 208 134 95 45 125 81 102 183
Rewari 219 159 140 133 NA 201 121 140 129 132 168 249 136 110 115 156 162 159 159 135 193 148 142 138 215 100 55 103
Faridabad 84 150 89 140 NA 143 68 94 115 NA 123 NA 123 79 146 205 118 106 65 98 164 37 91 69 130 65 38 118
Fatehabad 95 92 100 95 148 136 192 133 162 177 NA 159 126 120 128 195 132 94 91 141 148 94 75 74 135 88 99 130
Gurugram 171 134 187 113 NA NA 110 143 117 NA 104 273 97 136 108 170 150 113 73 90 169 31 134 88 118 145 NA 106
Hisar 107 94 126 80 128 174 202 127 120 135 152 232 NA 125 124 197 131 135 87 156 127 109 63 41 103 33 125 158
Jind 101 163 114 61 176 170 125 125 115 104 NA 223 133 118 118 208 126 113 NA 150 134 150 77 132 90 90 100 161
Kaithal 111 103 93 109 137 215 192 165 113 45 NA NA 131 84 119 135 124 113 120 133 252 89 65 65 110 121 92 132
Karnal 97 120 101 42 135 157 100 142 110 103 101 225 138 83 89 136 133 134 93 151 159 133 76 70 124 76 75 98
Kurukshetra 98 117 146 NA 135 144 167 105 121 NA 222 216 109 120 127 116 130 134 NA 121 181 125 87 72 112 108 93 130
Mewat 183 132 94 120 254 275 223 128 144 137 203 295 200 152 127 179 166 118 114 113 131 214 133 148 197 80 46 140
Gurugram 151 150 154 147 NA 227 183 129 124 129 176 332 121 145 145 157 134 157 128 120 170 144 87 176 200 75 NA 149
Mahendar
-garh 83 141 119 95 180 123 219 178 121 109 119 218 118 230 179 188 165 118 91 105 38 196 139 80 155 86 124 117
Palwal 153 167 114 125 385 252 107 147 127 127 169 263 NA 132 121 219 162 139 117 152 134 129 173 82 231 69 55 189
Panchkula 90 98 50 85 102 152 112 127 90 76 127 NA NA 123 130 147 126 84 82 71 104 NA 45 NA 168 54 39 137
Panipat 81 153 112 60 107 167 124 133 123 107 170 217 191 104 117 110 131 122 116 148 220 94 37 161 141 116 48 154
Rohtak 140 140 107 116 171 173 135 150 144 138 133 228 126 121 119 167 182 133 140 138 194 136 81 118 140 101 53 160
Sirsa 116 100 144 57 317 114 173 140 122 157 249 NA 117 122 119 276 122 106 101 137 162 86 59 96 88 82 97 166
Sonipat 216 146 141 90 123 285 192 164 125 131 NA 237 125 123 111 175 139 125 178 126 268 178 30 237 139 114 56 166
Y.Nagar 126 NA 98 88 135 195 139 134 96 59 108 134 143 88 143 167 144 134 137 72 170 74 33 81 123 57 NA 92
Y Nagar= Yamuna Nagar

[78]
Estimated PM 10 daily composite for Year 2016 to 2020 for the month of March at ground station points in Haryana
Districts 1-
Mar
2-
Mar
3-
Mar
4-
Mar
5-
Mar
6-
Mar
7-
Mar
8-
Mar
9-
Mar
10-
Mar
11-
Mar
12-
Mar
13-
Mar
14-
Mar
15-
Mar
16-
Mar
17-
Mar
18-
Mar
19-
Mar
20-
Mar
21-
Mar
22-
Mar
23-
Mar
24-
Mar
25-
Mar
26-
Mar
27-
Mar
28-
Mar
29-
Mar
30-
Mar
31-
Mar
Ambala 147 119 142 151 101 71 58 121 112 NA 128 111 NA 133 88 111 78 127 122 120 111 133 127 103 87 97 97 102 117 117 96
Jhajjar NA 193 256 182 138 162 141 268 171 162 191 184 NA 182 169 180 100 131 125 198 139 68 117 136 121 155 149 104 109 109 NA
Faridabad NA 163 203 NA 131 58 121 NA NA NA 186 157 130 165 142 118 94 109 140 139 87 110 124 153 101 142 111 122 131 86 145
Bhiwani 228 192 196 205 114 123 93 153 162 129 153 130 124 153 124 181 94 140 138 136 180 69 145 122 111 107 179 74 111 104 112
Rewari 147 NA 218 183 95 116 NA 144 169 103 177 149 125 175 114 138 80 86 154 128 88 133 130 124 99 119 110 101 116 101 121
Faridabad 118 150 171 84 87 83 77 134 160 104 147 129 122 146 119 141 113 68 135 124 111 87 96 86 74 144 91 114 111 95 134
Fatehabad 176 193 137 143 104 115 98 117 119 160 126 145 129 147 136 188 148 120 168 126 98 128 130 105 121 102 152 NA 116 90 143
Gurugram 120 131 175 139 111 124 128 172 175 93 154 109 107 161 120 196 51 105 120 157 197 113 123 57 116 119 109 101 91 100 100
Hisar 178 160 167 133 127 180 235 94 116 81 136 154 141 135 137 93 91 69 176 132 77 23 92 97 NA 123 135 71 97 97 170
Jind 163 128 179 138 170 142 112 159 136 142 118 111 141 159 130 166 96 135 170 179 130 129 144 103 181 123 161 148 124 127 144
Kaithal 148 170 118 105 113 110 107 143 123 111 132 97 193 138 108 125 101 100 161 176 103 100 151 106 NA 135 156 80 122 134 89
Karnal 145 174 155 122 100 107 89 122 101 130 119 130 167 167 98 131 71 117 149 152 97 121 100 92 117 113 142 88 124 137 94
Kurukshetra 204 163 150 116 87 42 NA 124 117 126 117 118 212 159 131 141 101 105 131 160 101 175 124 124 NA 104 102 155 118 152 122
Mewat 166 220 180 163 93 108 105 123 137 83 174 121 100 146 97 113 45 91 99 106 117 26 73 88 80 90 60 78 89 92 88
Gurugram 144 261 206 227 132 51 139 142 166 108 140 120 121 155 113 150 167 117 112 169 161 122 108 185 102 108 87 105 124 105 116
Mahendar -garh
139 160 190 142 63 109 137 126 147 97 131 145 119 151 106 135 86 97 139 121 119 94 92 97 68 71 101 55 85 79 128
Palwal 158 246 188 156 125 147 118 138 240 190 172 146 156 190 145 260 91 123 NA 160 230 151 104 164 117 127 131 121 117 129 144
Panchkula NA 111 141 96 118 63 64 97 41 122 NA 78 89 116 37 92 90 94 113 115 130 66 100 44 NA 95 118 142 77 108 74
Panipat 168 197 143 138 102 77 92 135 133 133 152 130 127 228 124 144 90 114 149 162 146 157 114 127 121 124 130 120 114 134 114
Rohtak 179 191 261 137 74 104 75 157 170 130 139 95 111 165 139 200 94 128 117 139 135 89 104 109 99 104 99 97 97 93 36
Sirsa 177 187 144 160 105 118 141 115 117 93 150 148 NA 153 95 131 113 128 160 NA 94 149 139 105 NA 111 157 84 128 131 123
Sonipat NA 154 166 167 129 119 110 212 152 192 139 145 153 168 116 270 101 155 269 185 192 133 118 135 78 126 139 129 134 113 152
Y.Nagar 83 150 153 113 122 70 58 86 96 98 140 103 183 122 98 115 95 116 116 158 113 148 129 124 78 100 104 147 154 132 99
Y Nagar= Yamuna Nagar
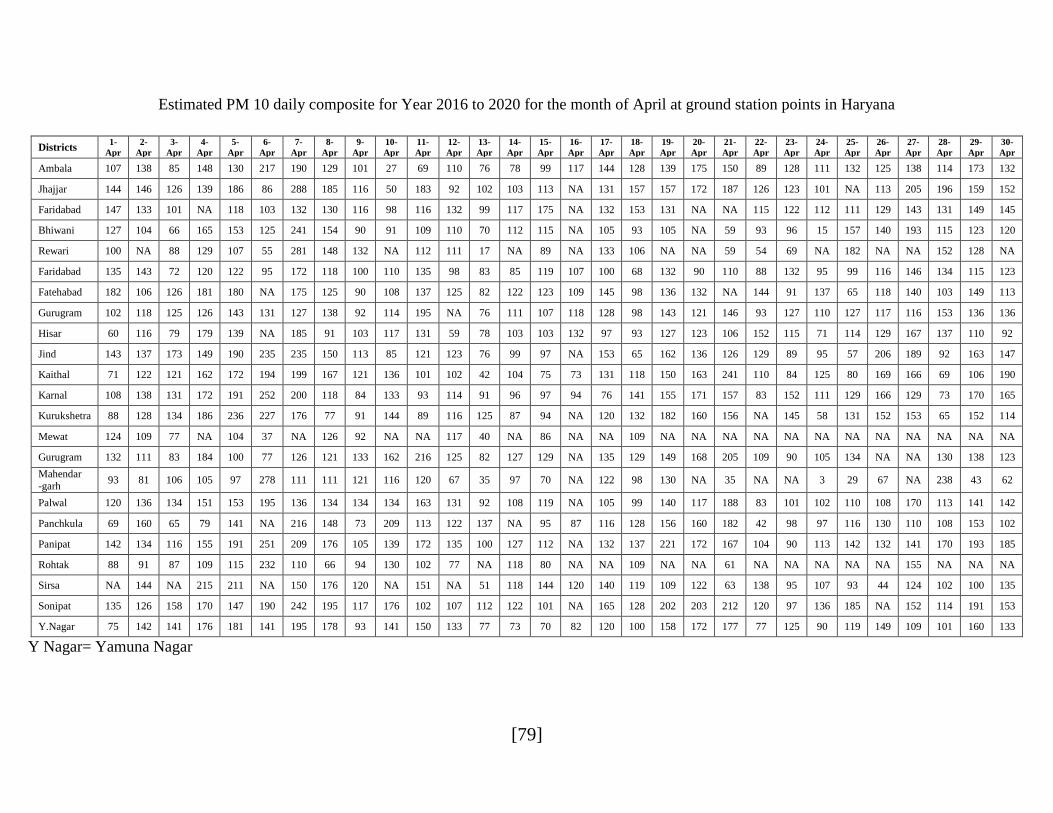
[79]
Estimated PM 10 daily composite for Year 2016 to 2020 for the month of April at ground station points in Haryana
Districts 1-
Apr
2-
Apr
3-
Apr
4-
Apr
5-
Apr
6-
Apr
7-
Apr
8-
Apr
9-
Apr
10-
Apr
11-
Apr
12-
Apr
13-
Apr
14-
Apr
15-
Apr
16-
Apr
17-
Apr
18-
Apr
19-
Apr
20-
Apr
21-
Apr
22-
Apr
23-
Apr
24-
Apr
25-
Apr
26-
Apr
27-
Apr
28-
Apr
29-
Apr
30-
Apr
Ambala 107 138 85 148 130 217 190 129 101 27 69 110 76 78 99 117 144 128 139 175 150 89 128 111 132 125 138 114 173 132
Jhajjar 144 146 126 139 186 86 288 185 116 50 183 92 102 103 113 NA 131 157 157 172 187 126 123 101 NA 113 205 196 159 152
Faridabad 147 133 101 NA 118 103 132 130 116 98 116 132 99 117 175 NA 132 153 131 NA NA 115 122 112 111 129 143 131 149 145
Bhiwani 127 104 66 165 153 125 241 154 90 91 109 110 70 112 115 NA 105 93 105 NA 59 93 96 15 157 140 193 115 123 120
Rewari 100 NA 88 129 107 55 281 148 132 NA 112 111 17 NA 89 NA 133 106 NA NA 59 54 69 NA 182 NA NA 152 128 NA
Faridabad 135 143 72 120 122 95 172 118 100 110 135 98 83 85 119 107 100 68 132 90 110 88 132 95 99 116 146 134 115 123
Fatehabad 182 106 126 181 180 NA 175 125 90 108 137 125 82 122 123 109 145 98 136 132 NA 144 91 137 65 118 140 103 149 113
Gurugram 102 118 125 126 143 131 127 138 92 114 195 NA 76 111 107 118 128 98 143 121 146 93 127 110 127 117 116 153 136 136
Hisar 60 116 79 179 139 NA 185 91 103 117 131 59 78 103 103 132 97 93 127 123 106 152 115 71 114 129 167 137 110 92
Jind 143 137 173 149 190 235 235 150 113 85 121 123 76 99 97 NA 153 65 162 136 126 129 89 95 57 206 189 92 163 147
Kaithal 71 122 121 162 172 194 199 167 121 136 101 102 42 104 75 73 131 118 150 163 241 110 84 125 80 169 166 69 106 190
Karnal 108 138 131 172 191 252 200 118 84 133 93 114 91 96 97 94 76 141 155 171 157 83 152 111 129 166 129 73 170 165
Kurukshetra 88 128 134 186 236 227 176 77 91 144 89 116 125 87 94 NA 120 132 182 160 156 NA 145 58 131 152 153 65 152 114
Mewat 124 109 77 NA 104 37 NA 126 92 NA NA 117 40 NA 86 NA NA 109 NA NA NA NA NA NA NA NA NA NA NA NA
Gurugram 132 111 83 184 100 77 126 121 133 162 216 125 82 127 129 NA 135 129 149 168 205 109 90 105 134 NA NA 130 138 123
Mahendar -garh
93 81 106 105 97 278 111 111 121 116 120 67 35 97 70 NA 122 98 130 NA 35 NA NA 3 29 67 NA 238 43 62
Palwal 120 136 134 151 153 195 136 134 134 134 163 131 92 108 119 NA 105 99 140 117 188 83 101 102 110 108 170 113 141 142
Panchkula 69 160 65 79 141 NA 216 148 73 209 113 122 137 NA 95 87 116 128 156 160 182 42 98 97 116 130 110 108 153 102
Panipat 142 134 116 155 191 251 209 176 105 139 172 135 100 127 112 NA 132 137 221 172 167 104 90 113 142 132 141 170 193 185
Rohtak 88 91 87 109 115 232 110 66 94 130 102 77 NA 118 80 NA NA 109 NA NA 61 NA NA NA NA NA 155 NA NA NA
Sirsa NA 144 NA 215 211 NA 150 176 120 NA 151 NA 51 118 144 120 140 119 109 122 63 138 95 107 93 44 124 102 100 135
Sonipat 135 126 158 170 147 190 242 195 117 176 102 107 112 122 101 NA 165 128 202 203 212 120 97 136 185 NA 152 114 191 153
Y.Nagar 75 142 141 176 181 141 195 178 93 141 150 133 77 73 70 82 120 100 158 172 177 77 125 90 119 149 109 101 160 133
Y Nagar= Yamuna Nagar

[80]
Estimated PM 10 daily composite for Year 2016 to 2020 for the month of May at ground station points in Haryana
Districts 1-
May
2-
May
3-
May
4-
May
5-
May
6-
May
7-
May
8-
May
9-
May
10-
May
11-
May
12-
May
13-
May
14-
May
15-
May
16-
May
17-
May
18-
May
19-
May
20-
May
21-
May
22-
May
23-
May
24-
May
25-
May
26-
May
27-
May
28-
May
29-
May
30-
May
31-
May
Ambala 133 128 136 134 81 214 192 168 172 166 169 136 179 196 215 84 199 139 146 112 172 112 174 238 116 128 113 97 160 158 112
Jhajjar 139 111 158 187 142 NA NA 197 NA 218 NA 220 NA 120 NA NA 114 208 108 165 206 NA 162 222 NA 136 NA 218 NA NA 142
Faridabad 94 170 155 124 120 108 170 152 172 144 150 134 NA 169 131 165 105 184 113 185 136 138 175 161 188 124 71 145 NA 169 170
Bhiwani 132 116 175 80 75 NA NA 193 209 180 343 214 157 114 311 110 114 203 121 NA 136 155 134 120 69 102 179 174 120 95 162
Rewari 83 111 144 177 NA NA NA NA NA 173 280 NA NA 61 NA NA 114 125 138 NA 132 NA 67 87 211 121 NA NA 118 NA 161
Faridabad 118 118 125 117 95 150 132 123 178 147 147 181 174 115 167 173 121 119 92 128 124 126 189 137 128 164 148 108 108 177 207
Fatehabad 110 115 157 183 96 NA 71 155 91 137 NA NA NA 137 102 NA 77 80 105 NA 121 117 NA 122 85 130 NA 114 NA NA NA
Gurugram 161 160 140 151 137 201 245 127 195 214 193 193 195 209 198 154 201 132 114 137 142 145 184 160 151 159 162 138 191 157 199
Hisar 109 119 148 98 96 129 102 187 184 177 189 188 196 131 206 330 143 120 113 NA 116 135 151 85 197 164 147 118 132 129 204
Jind 167 127 158 181 139 NA 93 176 77 159 224 208 180 162 72 225 187 168 127 NA 180 114 194 148 81 177 116 151 106 40 249
Kaithal 195 128 147 142 89 169 83 123 98 170 237 155 262 101 81 NA 129 167 128 NA 153 104 153 131 43 152 110 152 121 159 244
Karnal 133 135 160 150 122 134 138 126 118 167 165 198 196 203 216 141 138 129 164 143 168 162 154 142 105 145 91 127 169 165 247
Kurukshetra 109 97 120 147 99 128 209 162 128 209 148 233 171 235 194 147 141 130 172 127 117 212 136 211 59 116 121 132 107 190 256
Mewat 111 111 133 NA NA NA NA NA NA 131 NA NA NA NA 75 NA 90 88 NA NA NA NA NA NA NA NA NA NA 106 NA NA
Gurugram 75 124 149 146 211 207 154 170 227 183 NA 220 NA 61 120 NA 118 211 119 NA 278 139 181 157 61 124 NA 153 NA 124 174
Mahendar
-garh 83 127 198 NA 130 NA NA NA NA 109 NA 120 NA 58 76 NA 85 NA 60 NA 125 NA NA 108 14 110 11 142 98 107 NA
Palwal 153 138 151 148 179 NA 185 NA 167 141 156 223 202 171 125 164 118 124 113 148 107 131 147 172 162 124 90 210 102 126 180
Panchkula 115 123 122 84 69 186 63 171 85 217 128 127 143 238 191 243 87 181 150 107 235 199 154 224 116 109 126 88 165 16 106
Panipat 174 166 129 134 132 153 172 151 155 207 197 236 163 217 230 197 109 219 146 230 213 170 207 197 100 211 127 184 161 121 217
Rohtak 111 111 148 NA NA NA NA NA NA 139 NA NA NA 70 NA NA 119 NA NA NA NA NA NA NA NA 118 NA NA NA NA 153
Sirsa 72 111 169 169 71 NA 53 122 96 155 NA 199 141 22 133 NA 79 NA 99 97 NA 109 NA 119 56 119 NA 64 128 32 NA
Sonipat 126 170 199 168 109 147 168 132 196 233 229 345 192 224 191 199 199 NA 147 155 198 220 202 198 196 173 162 171 149 248 275
Y.Nagar 110 162 150 111 117 133 125 155 113 158 191 257 133 186 147 204 109 170 137 125 179 196 159 159 142 120 119 111 159 161 150
Y Nagar= Yamuna Nagar

[81]
Estimated PM 10 daily composite for Year 2016 to 2020 for the month of June at ground station points in Haryana
Districts 1-
Jun
2-
Jun
3-
Jun
4-
Jun
5-
Jun
6-
Jun
7-
Jun
8-
Jun
9-
Jun
10-
Jun
11-
Jun
12-
Jun
13-
Jun
14-
Jun
15-
Jun
16-
Jun
17-
Jun
18-
Jun
19-
Jun
20-
Jun
21-
Jun
22-
Jun
23-
Jun
24-
Jun
25-
Jun
26-
Jun
27-
Jun
28-
Jun
29-
Jun
30-
Jun
Ambala 195 165 205 157 212 NA 235 178 162 148 226 151 212 156 93 135 122 212 218 161 NA 103 158 175 245 128 NA 160 203 388
Jhajjar 242 NA 234 NA 168 183 118 92 176 110 270 221 NA 213 NA 152 NA 263 166 179 172 NA 230 190 491 NA NA NA 165 NA
Faridabad 236 175 192 143 243 263 179 141 183 176 211 205 210 195 62 171 279 231 208 184 249 129 176 NA 253 406 278 469 194 193
Bhiwani 217 157 152 156 138 121 199 26 132 40 190 167 179 227 146 151 154 185 379 214 258 73 197 154 307 NA 345 208 208 NA
Rewari NA 135 NA NA NA NA 101 44 160 NA 91 NA NA NA 215 161 175 288 NA 181 NA NA NA NA NA NA NA NA NA 197
Faridabad 217 165 159 214 219 207 128 90 119 132 188 151 256 245 82 364 233 208 239 195 301 113 162 258 268 NA NA 439 167 201
Fatehabad 65 149 NA NA NA 59 123 51 107 77 225 176 164 NA NA NA NA 138 224 185 116 77 179 NA NA NA NA NA 194 NA
Gurugram 235 209 202 207 194 229 204 104 139 197 203 169 213 238 90 163 338 189 230 196 188 112 199 NA 184 NA NA 483 165 249
Hisar 239 162 110 191 177 141 209 60 195 156 189 174 171 247 127 144 302 325 298 180 149 57 157 307 187 274 331 207 225 NA
Jind 218 189 223 177 198 284 192 211 200 190 194 168 173 212 220 218 171 298 193 215 270 74 182 197 314 443 519 206 216 254
Kaithal 156 153 262 169 176 195 233 40 210 157 186 147 209 NA 129 150 148 241 191 263 NA 153 223 330 353 102 NA 214 208 406
Karnal 179 138 249 149 190 344 183 235 183 175 193 213 212 183 236 169 196 285 310 270 246 189 266 163 288 153 NA 172 214 323
Kurukshetra 186 168 202 185 229 190 209 97 200 176 200 143 211 173 86 160 162 243 196 247 NA 137 165 367 327 349 NA 280 209 NA
Mewat NA 124 NA 134 NA NA 144 178 NA NA 97 NA NA NA NA NA NA 125 NA 192 NA NA NA NA 301 NA NA NA NA 227
Gurugram 151 141 235 NA NA 197 132 43 154 NA 227 304 281 250 104 156 153 136 332 201 168 NA NA NA 233 NA NA 416 160 196
Mahendar
-garh NA 127 71 NA NA 101 NA 20 26 56 195 266 192 NA NA NA NA 153 108 136 213 NA 97 137 140 135 126 NA 168 NA
Palwal 200 191 243 142 207 209 209 36 172 202 200 219 254 326 91 166 157 196 262 235 233 165 229 512 230 350 406 449 180 171
Panchkula 181 140 185 179 245 NA 201 193 141 125 161 49 191 190 154 159 140 182 210 218 NA 170 134 NA 227 165 NA 168 166 247
Panipat 203 224 278 197 228 217 209 200 277 229 241 238 291 241 100 170 264 248 314 274 230 197 212 230 350 217 628 242 225 389
Rohtak 154 128 NA NA NA NA NA NA NA NA 188 NA NA NA NA NA NA 227 298 168 NA NA NA NA NA NA NA NA NA NA
Sirsa 75 183 190 124 NA 121 192 113 154 107 188 NA 154 NA 96 123 236 213 171 172 NA 135 130 346 136 156 274 382 159 393
Sonipat 254 222 220 216 235 242 218 156 194 171 242 199 238 230 133 174 158 285 307 213 NA 130 228 240 344 188 NA 215 186 312
Y.Nagar 175 158 235 171 193 193 215 76 165 179 178 161 184 200 198 152 288 143 208 241 204 179 204 187 180 266 NA 196 232 361
Y Nagar= Yamuna Nagar

[82]
Estimated PM 10 daily composite for Year 2016 to 2020 for the month of July at ground station points in Haryana
Districts 1-
Jul
2-
Jul
3-
Jul
4-
Jul
5-
Jul
6-
Jul
7-
Jul
8-
Jul
9-
Jul
10-
Jul
11-
Jul
12-
Jul
13-
Jul
14-
Jul
15-
Jul
16-
Jul
17-
Jul
18-
Jul
19-
Jul
20-
Jul
21-
Jul
22-
Jul
23-
Jul
24-
Jul
25-
Jul
26-
Jul
27-
Jul
28-
Jul
29-
Jul
30-
Jul
31-
Jul
Ambala NA 234 NA 210 193 184 115 NA 365 410 NA NA 53 NA NA NA NA NA NA NA NA 302 NA 178 NA NA NA NA 221 NA NA
Jhajjar 121 NA 212 151 NA 226 NA NA 237 NA NA 177 NA NA NA 884 NA NA NA 212 284 317 338 NA NA NA 198 170 515 223 NA
Faridabad NA NA 341 220 332 275 NA NA 358 320 NA 185 167 364 167 474 NA NA NA 292 218 360 NA NA NA NA 172 173 323 NA NA
Bhiwani 172 NA 188 226 166 174 322 346 210 290 337 392 206 206 206 199 NA NA NA 182 243 456 198 368 NA 380 NA 176 355 NA 328
Rewari NA NA NA 145 NA NA 398 286 166 282 301 NA NA NA NA NA NA NA 212 NA 239 302 254 374 NA NA 164 155 NA NA NA
Faridabad 89 NA 229 NA 302 195 NA NA 328 NA NA 182 148 368 148 NA 227 NA NA 198 253 331 426 325 NA NA 182 155 406 NA NA
Fatehabad 152 297 NA 205 216 262 330 NA 182 360 369 NA 208 208 208 210 NA NA 235 NA 264 410 NA 212 193 338 NA 154 147 NA NA
Gurugram 175 NA 206 169 NA 273 NA NA 275 NA 804 NA 142 321 142 NA NA NA 438 318 NA 225 NA NA NA NA 183 175 365 NA NA
Hisar 171 198 167 246 216 294 333 359 224 317 240 164 192 192 192 201 NA NA NA 173 NA 175 NA 250 NA NA NA 158 287 NA NA
Jind 354 NA NA 203 469 279 256 382 287 528 455 219 197 197 197 NA NA NA 523 NA 311 285 NA NA NA NA NA NA 472 NA NA
Kaithal NA NA 298 182 254 NA 237 NA 332 561 NA NA 201 201 201 NA NA 500 NA NA 428 391 NA NA NA NA NA NA 471 167 362
Karnal 222 449 366 255 NA 425 308 342 NA 549 NA NA 177 177 177 232 NA NA NA NA 336 436 NA NA 208 NA NA NA NA NA NA
Kurukshetra 381 NA 283 206 232 449 209 NA 407 446 1111 NA 174 174 174 NA NA 208 NA NA 353 323 NA NA NA NA NA NA 297 NA NA
Mewat NA NA NA 145 180 153 205 206 344 NA NA NA NA NA NA NA NA NA NA 148 184 NA 227 145 NA NA NA NA NA NA NA
Gurugram 99 NA 205 150 NA 148 258 NA 253 353 276 179 168 320 168 NA NA NA 221 NA NA 327 NA 410 NA NA NA 163 NA NA NA
Mahendar
-garh 142 NA 180 137 NA 155 239 NA 118 166 182 NA 187 187 201 NA NA NA NA 211 182 186 147 NA NA 209 NA NA NA 184 NA
Palwal 137 434 402 322 293 252 358 299 444 444 NA 193 447 327 163 546 NA NA 241 318 255 284 NA NA 223 NA 170 161 495 NA NA
Panchkula 153 NA NA 231 264 279 116 187 NA 429 NA NA NA NA NA NA 184 NA 197 NA NA NA NA 163 NA NA NA NA NA NA NA
Panipat 205 558 409 251 687 535 356 382 NA 463 NA NA 184 184 184 NA NA NA 211 NA 284 276 463 NA 224 NA NA NA NA NA NA
Rohtak 124 NA NA 143 NA NA 131 281 190 NA 214 NA 193 193 193 NA NA NA 416 153 165 259 211 NA NA NA NA 143 393 182 NA
Sirsa 203 305 269 249 360 371 274 411 161 322 174 NA 203 250 203 370 NA 310 293 266 164 292 NA 283 NA 259 NA 195 154 NA NA
Sonipat NA 561 268 194 NA 301 NA 388 387 NA NA NA 191 191 191 NA NA NA NA 199 398 472 NA NA NA NA NA 190 270 NA NA
Y.Nagar 246 201 NA 257 358 379 NA 483 340 501 NA NA 162 162 162 NA NA NA NA NA NA NA NA NA NA NA NA NA NA NA NA
Y Nagar= Yamuna Nagar

[83]
Estimated PM 10 daily composite for Year 2016 to 2020 for the month of August at ground station points in Haryana
Districts 1-
Aug
2-
Aug
3-
Aug
4-
Aug
5-
Aug
6-
Aug
7-
Aug
8-
Aug
9-
Aug
10-
Aug
11-
Aug
12-
Aug
13-
Aug
14-
Aug
15-
Aug
16-
Aug
17-
Aug
18-
Aug
19-
Aug
20-
Aug
21-
Aug
22-
Aug
23-
Aug
24-
Aug
25-
Aug
26-
Aug
27-
Aug
28-
Aug
29-
Aug
30-
Aug
31-
Aug
Ambala 98 NA 205 NA 108 NA NA NA NA NA 370 NA NA NA NA 108 155 400 NA 107 NA 177 NA NA NA 161 NA 114 66 NA NA
Jhajjar NA NA 293 NA NA 314 NA NA NA NA 364 NA NA NA 256 224 242 NA NA NA NA NA NA NA NA NA NA NA NA NA 346
Faridabad 120 NA 305 NA NA NA NA NA NA NA NA NA NA NA 311 204 NA 255 NA NA NA 232 NA NA NA NA 104 NA NA NA NA
Bhiwani 232 300 155 NA 171 113 NA NA 397 NA NA NA NA NA 220 132 141 170 NA NA 147 80 136 NA NA NA NA NA NA 245 NA
Rewari 107 NA 234 NA NA NA NA NA NA NA NA NA NA NA 240 NA 202 NA NA NA NA 129 135 NA 304 NA NA NA NA NA NA
Faridabad NA NA 166 NA NA 236 NA NA NA NA NA NA NA NA 452 205 217 222 NA NA NA 328 NA NA NA NA 166 NA NA NA NA
Fatehabad 129 308 361 NA NA 245 NA NA 328 NA 236 NA 293 NA NA 87 127 138 159 NA 309 98 115 204 NA 160 NA NA NA NA 133
Gurugram 121 NA 158 NA NA NA NA NA NA NA NA NA NA NA NA 155 NA 148 NA NA NA 186 174 NA NA NA 118 NA NA NA NA
Hisar 252 392 NA NA NA 262 NA NA 276 NA NA NA 163 NA 210 149 128 204 NA NA 421 82 74 NA NA NA NA NA NA 174 NA
Jind 148 NA 176 120 253 357 129 NA 555 NA NA NA 337 NA NA 267 141 NA NA NA NA 111 NA NA NA NA NA NA 162 227 NA
Kaithal NA NA 174 432 NA NA NA NA NA NA 239 NA NA NA NA 217 115 NA NA NA NA NA NA 164 NA 159 NA NA NA 201 NA
Karnal 86 NA 159 415 NA 383 NA NA NA NA NA NA NA 274 189 NA 170 151 NA 45 NA NA NA NA NA NA NA NA NA NA NA
Kurukshetra NA NA 151 199 NA NA NA NA NA NA NA NA NA NA NA 58 155 NA 113 NA NA NA NA NA NA NA NA NA NA NA NA
Mewat 111 NA NA NA NA NA NA 45 NA NA NA NA NA NA 230 NA 201 121 NA NA 129 NA NA NA NA NA NA NA NA NA NA
Gurugram 111 NA 244 NA NA NA NA NA NA NA NA NA NA NA 277 NA NA 113 NA NA NA NA NA NA NA NA NA NA NA NA NA
Mahendar -garh
100 NA 142 NA NA NA NA NA NA NA NA NA NA NA NA 219 NA 114 NA NA 96 108 134 NA NA NA 77 NA NA NA 173
Palwal 127 NA 160 NA NA 351 NA 75 NA NA 296 NA NA NA NA NA NA NA NA NA NA 219 190 NA NA NA 133 NA NA NA NA
Panchkula NA NA NA NA NA NA NA NA NA NA NA NA NA NA NA NA NA 157 NA 14 NA 84 NA 170 NA 144 NA NA NA NA NA
Panipat 124 472 180 NA NA NA NA NA NA NA NA NA 180 249 186 NA 191 143 NA 25 NA NA NA NA NA NA 135 NA NA NA NA
Rohtak 116 152 154 NA NA NA NA NA 349 NA NA NA 175 159 202 150 151 113 NA NA 113 92 121 NA 271 NA 39 NA 144 133 NA
Sirsa 134 431 256 NA 171 178 141 NA 262 NA NA 166 NA NA 227 NA 124 NA 133 212 108 NA NA 169 NA 167 NA NA 142 NA NA
Sonipat 119 NA NA 132 NA 369 124 NA NA NA NA NA NA 300 363 203 209 191 NA 34 NA NA 117 NA NA 136 NA NA NA NA NA
Y.Nagar 101 NA NA 96 NA 151 NA NA NA NA NA NA NA NA 320 NA NA NA NA 48 NA NA NA NA NA 101 NA NA NA NA NA
Y Nagar= Yamuna Nagar

[84]
Estimated PM 10 daily composite for Year 2016 to 2020 for the month of September at ground station points in Haryana
Districts 1-
Sep
2-
Sep
3-
Sep
4-
Sep
5-
Sep
6-
Sep
7-
Sep
8-
Sep
9-
Sep
10-
Sep
11-
Sep
12-
Sep
13-
Sep
14-
Sep
15-
Sep
16-
Sep
17-
Sep
18-
Sep
19-
Sep
20-
Sep
21-
Sep
22-
Sep
23-
Sep
24-
Sep
25-
Sep
26-
Sep
27-
Sep
28-
Sep
29-
Sep
30-
Sep
Ambala NA NA 102 NA 123 NA 278 108 252 NA 154 217 NA 229 69 195 502 140 NA 144 132 287 182 171 162 274 254 363 174 196
Jhajjar NA NA NA 132 179 139 194 242 271 NA 140 198 148 173 111 102 176 148 195 156 209 NA 173 NA 166 170 165 165 202 179
Faridabad NA NA NA NA 162 133 NA 212 218 209 167 147 151 138 201 93 313 154 281 185 213 304 152 NA 173 179 150 181 145 138
Bhiwani NA NA 220 NA 149 98 NA 141 143 113 140 181 126 143 164 153 218 140 166 136 181 191 212 120 43 118 96 120 135 108
Rewari NA NA NA 104 122 NA 177 115 182 107 121 137 121 132 125 NA 210 139 182 118 98 284 158 109 NA 106 84 117 108 118
Faridabad NA NA NA NA 239 141 NA 227 NA 203 160 154 168 NA 158 102 256 153 263 198 239 357 NA NA 161 165 170 134 204 146
Fatehabad NA NA 138 63 149 80 158 NA 115 141 117 146 139 117 211 140 161 130 121 172 154 212 201 178 173 112 123 122 130 112
Gurugram NA NA NA NA 155 186 NA NA NA 182 175 178 170 121 119 NA 170 156 180 175 NA NA 145 NA NA 126 155 156 176 169
Hisar NA NA 128 NA 119 78 171 149 128 169 114 162 137 132 NA 142 143 118 185 150 146 181 223 130 236 152 141 159 149 109
Jind NA NA NA NA 129 146 168 164 196 NA 158 155 146 150 155 105 298 144 151 159 182 252 250 105 171 170 158 148 184 77
Kaithal NA NA NA NA 110 NA 286 145 179 210 112 175 178 158 133 163 184 138 110 124 272 155 452 NA 186 180 190 176 209 189
Karnal NA NA NA NA 106 358 NA 127 179 NA 122 185 195 239 113 133 199 127 173 133 NA 265 198 101 179 236 184 169 189 230
Kurukshetra NA NA 129 NA 122 158 270 138 NA NA 165 194 235 192 133 229 288 144 NA 166 277 318 NA 129 194 302 208 240 161 233
Mewat NA NA NA NA NA 111 160 96 168 90 87 NA 104 123 78 47 150 110 NA 77 NA 239 NA 95 92 96 74 87 94 45
Gurugram NA NA NA 120 140 181 210 195 182 NA 153 170 140 NA 179 79 223 146 156 168 123 307 152 NA NA 111 107 115 138 111
Mahendar
-garh NA NA 133 NA NA NA 122 124 NA 76 100 129 62 114 132 96 155 94 61 114 108 67 168 89 204 103 63 68 89 67
Palwal NA NA NA 120 148 124 201 145 197 128 149 153 134 153 149 96 175 149 224 173 114 273 159 NA 107 155 150 163 121 158
Panchkula NA NA 62 85 68 NA NA NA NA NA 134 472 NA 185 NA 175 162 115 296 157 123 150 117 133 101 NA 308 152 149 74
Panipat NA NA NA NA 133 127 172 149 210 172 176 173 208 181 106 130 222 156 184 163 182 157 195 122 162 179 181 173 245 182
Rohtak NA NA 179 NA 136 83 135 124 135 100 128 124 103 116 112 114 171 117 81 142 120 165 NA 121 208 86 61 54 98 42
Sirsa NA NA 145 NA 184 94 157 120 115 142 144 163 124 149 169 170 115 137 145 150 188 166 205 184 172 195 112 120 141 143
Sonipat NA NA NA NA 142 204 163 223 181 159 206 172 177 192 116 230 200 135 170 120 270 253 295 NA NA 165 160 167 245 92
Y.Nagar NA NA NA NA 135 NA NA 166 NA NA 210 183 NA NA NA 93 184 147 314 339 NA 431 163 129 119 213 NA 161 158 299
Y Nagar= Yamuna Nagar

[85]
Estimated PM 10 daily composite for Year 2016 to 2020 for the month of October at ground station points in Haryana
Districts 1-
Oct
2-
Oct
3-
Oct
4-
Oct
5-
Oct
6-
Oct
7-
Oct
8-
Oct
9-
Oct
10-
Oct
11-
Oct
12-
Oct
13-
Oct
14-
Oct
15-
Oct
16-
Oct
17-
Oct
18-
Oct
19-
Oct
20-
Oct
21-
Oct
22-
Oct
23-
Oct
24-
Oct
25-
Oct
26-
Oct
27-
Oct
28-
Oct
29-
Oct
30-
Oct
31-
Oct
Ambala 123 144 376 157 217 125 170 169 176 217 192 132 144 203 154 188 201 162 135 156 172 171 227 155 170 249 164 140 132 216 199
Jhajjar 116 152 127 173 139 130 203 226 167 208 206 188 185 154 143 163 151 201 192 171 222 144 149 208 184 236 230 259 NA 329 NA
Faridabad 138 119 127 157 115 118 134 186 155 205 188 197 204 142 142 154 181 186 176 135 183 154 132 224 157 186 249 227 NA 237 NA
Bhiwani 107 79 205 145 186 147 177 130 159 196 193 216 139 156 133 153 159 156 168 139 211 128 158 207 225 235 270 307 221 282 525
Rewari 55 54 52 61 93 136 NA 159 127 179 221 151 135 132 63 115 119 130 108 235 NA 106 NA 153 NA 145 316 280 NA NA NA
Faridabad 91 115 111 198 125 135 132 223 155 213 212 239 172 177 195 185 204 202 148 181 160 166 168 204 220 174 275 206 223 294 166
Fatehabad 207 258 209 399 141 167 133 131 222 257 216 217 145 180 155 198 170 217 172 146 167 124 181 303 208 316 311 353 421 280 507
Gurugram 132 116 117 164 130 125 123 181 160 207 214 151 200 155 192 158 218 158 152 195 208 160 161 305 186 233 296 214 238 260 337
Hisar 183 190 104 122 180 105 122 147 176 173 176 185 153 129 113 169 158 160 150 147 200 106 141 233 210 175 231 312 188 275 414
Jind 104 301 234 158 247 122 166 167 214 228 304 210 185 164 169 266 157 196 190 145 171 180 182 287 220 279 296 223 336 370 173
Kaithal 276 114 373 155 128 107 157 203 214 275 225 182 201 154 194 268 206 212 196 167 131 162 199 257 215 274 249 168 227 312 NA
Karnal 90 130 165 174 115 115 118 196 221 263 223 200 178 172 158 156 177 173 198 143 143 159 200 168 190 208 244 178 206 293 152
Kurukshetra 105 120 338 224 104 110 111 182 178 247 162 154 160 147 171 209 187 168 169 190 152 140 253 165 198 NA 179 160 155 266 153
Mewat 134 35 80 87 89 NA NA 140 101 134 142 114 81 122 80 209 171 NA 63 220 129 71 101 138 234 NA 220 161 333 245 NA
Gurugram 123 103 146 174 129 136 118 198 163 205 175 202 159 161 165 220 174 190 143 176 262 131 194 182 198 201 225 270 NA 255 233
Mahendar -garh
86 55 77 88 121 116 92 94 135 118 100 75 95 104 64 116 161 121 127 178 126 71 92 100 201 129 207 141 93 272 181
Palwal 119 142 136 161 140 131 136 125 168 219 232 164 184 195 158 209 193 197 157 168 237 166 188 218 228 206 239 264 NA 251 251
Panchkula 115 323 137 121 105 115 218 111 158 140 166 158 142 104 123 131 138 155 137 148 99 123 118 104 166 179 126 202 180 268 154
Panipat 110 261 253 190 131 115 181 197 208 259 200 213 195 172 206 171 225 178 209 193 144 140 209 228 244 208 239 192 149 330 304
Rohtak 68 75 61 160 81 109 57 113 NA 126 101 130 54 178 74 99 94 91 158 196 115 33 127 NA NA 149 NA 159 153 NA NA
Sirsa 246 229 271 126 143 171 150 163 243 244 182 185 151 139 145 158 161 169 166 160 167 114 162 258 220 292 283 391 180 204 370
Sonipat 105 178 189 181 134 115 190 178 174 215 193 232 218 165 200 270 194 200 198 178 270 163 188 252 249 327 208 246 276 394 169
Y.Nagar 151 148 163 188 129 134 105 172 160 202 212 151 148 105 158 152 151 137 112 140 146 150 158 136 155 207 136 165 119 157 139
Y Nagar= Yamuna Nagar

[86]
Estimated PM 10 daily composite for Year 2016 to 2020 for the month of November at ground station points in Haryana
Districts 1-
Nov
2-
Nov
3-
Nov
4-
Nov
5-
Nov
6-
Nov
7-
Nov
8-
Nov
9-
Nov
10-
Nov
11-
Nov
12-
Nov
13-
Nov
14-
Nov
15-
Nov
16-
Nov
17-
Nov
18-
Nov
19-
Nov
20-
Nov
21-
Nov
22-
Nov
23-
Nov
24-
Nov
25-
Nov
26-
Nov
27-
Nov
28-
Nov
29-
Nov
30-
Nov
Ambala 232 205 150 205 117 201 109 124 164 159 131 164 127 172 161 161 80 115 159 201 127 162 84 119 103 105 164 179 142 139
Jhajjar 213 203 216 140 149 196 148 218 223 NA 217 332 NA 178 263 184 NA NA 210 225 189 142 127 126 450 NA 115 182 152 144
Faridabad 172 NA 210 162 200 121 NA NA 163 NA NA NA NA NA NA 138 NA NA 199 NA 161 155 NA NA 157 NA NA 138 101 155
Bhiwani 256 190 150 376 109 231 106 447 206 230 211 173 228 288 NA 188 210 186 162 207 178 128 92 150 123 125 130 122 120 134
Rewari 235 179 NA 166 NA NA 182 NA 333 NA 78 114 NA 241 192 129 152 170 NA 140 NA 114 92 117 134 NA 91 101 57 130
Faridabad 233 231 270 225 192 152 169 217 139 326 292 166 335 167 NA 180 212 238 167 217 159 154 110 91 190 108 123 122 100 218
Fatehabad 223 233 179 293 303 163 145 221 201 186 187 173 174 311 375 68 NA 135 130 159 110 129 53 131 102 NA 97 128 133 126
Gurugram 208 274 213 153 NA 186 142 226 271 305 194 282 476 185 237 125 337 172 175 177 179 153 154 149 173 126 147 331 166 165
Hisar 216 201 271 253 92 138 120 198 232 182 119 200 257 279 334 226 166 177 151 192 158 121 109 106 131 104 120 222 156 193
Jind 279 219 205 322 113 140 181 210 NA 283 311 151 236 225 NA 127 133 201 164 203 138 150 104 134 117 111 79 134 131 163
Kaithal 291 272 176 193 87 129 109 126 98 182 NA 148 212 NA 280 NA 92 155 148 244 105 162 92 79 104 146 117 101 126 168
Karnal 332 269 185 152 103 257 113 146 171 243 NA 171 226 NA 266 74 126 151 174 178 154 149 97 88 130 82 123 105 152 187
Kurukshetra 265 260 174 176 130 207 136 134 62 198 192 142 208 162 256 54 106 159 177 189 151 158 98 99 164 88 133 120 163 165
Mewat NA 209 192 188 133 410 262 304 239 355 236 556 246 NA 387 174 233 156 200 166 181 145 94 110 192 187 122 195 156 139
Gurugram 202 169 213 171 180 176 165 241 167 NA 185 156 229 179 205 NA 275 187 168 186 191 147 119 170 105 150 147 124 148 139
Mahendar -garh
137 123 NA 124 134 151 111 194 144 145 71 97 195 NA 308 207 187 153 100 107 128 86 119 97 173 55 75 198 101 184
Palwal 258 253 205 150 157 114 181 NA 94 NA 243 165 NA NA 205 173 139 166 183 200 155 129 75 82 165 100 55 97 140 172
Panchkula 270 160 187 250 189 191 89 167 192 186 190 161 115 203 235 127 72 132 114 148 92 117 61 57 87 79 89 78 136 86
Panipat 180 282 NA 166 104 128 104 141 106 NA NA 215 238 186 NA 78 101 185 154 203 112 154 88 115 152 103 120 107 152 168
Rohtak NA 141 NA 131 NA 87 83 NA NA NA NA 140 217 NA NA 102 NA NA 110 92 148 110 81 NA 109 NA 112 NA 85 104
Sirsa 318 211 163 207 257 279 153 169 175 118 183 NA 201 NA NA 105 NA 107 140 150 107 105 NA 115 58 NA 113 139 86 151
Sonipat 234 251 217 199 126 142 166 278 187 NA 380 239 160 227 NA NA 126 196 205 214 187 194 127 132 167 146 158 145 127 207
Y.Nagar 209 155 148 139 119 142 158 110 130 122 129 134 216 163 218 77 92 79 152 171 114 120 100 86 78 71 54 140 164 156
Y Nagar= Yamuna Nagar

[87]
Estimated PM 10 daily composite for Year 2016 to 2020 for the month of December at ground station points in Haryana
District 1-
Dec
2-
Dec
3-
Dec
4-
Dec
5-
Dec
6-
Dec
7-
Dec
8-
Dec
9-
Dec
10-
Dec
11-
Dec
12-
Dec
13-
Dec
14-
Dec
15-
Dec
16-
Dec
17-
Dec
18-
Dec
19-
Dec
20-
Dec
21-
Dec
22-
Dec
23-
Dec
24-
Dec
25-
Dec
26-
Dec
27-
Dec
28-
Dec
29-
Dec
30-
Dec
31-
Dec
Ambala 165 200 123 211 153 120 129 120 NA 159 168 131 190 139 148 75 97 113 148 189 NA 108 NA 133 186 156 175 109 137 163 108
Jhajjar 185 154 158 175 170 160 178 151 167 170 164 NA 198 NA 158 104 115 118 134 NA 171 114 108 362 NA NA 185 NA 225 210 NA
Faridabad 168 140 139 NA 167 NA 177 169 NA 172 NA NA NA 140 154 96 NA NA NA NA 124 NA NA NA NA NA NA NA NA NA 167
Bhiwani 148 110 117 165 118 129 135 145 170 137 175 196 246 125 139 88 62 115 138 175 173 120 97 214 265 142 170 206 150 180 198
Rewari 151 128 87 152 148 134 160 144 188 136 181 136 184 158 100 70 79 83 123 132 183 125 89 175 193 187 128 100 158 184 128
Faridabad 132 163 123 NA 162 161 192 122 151 162 NA NA NA 135 124 NA 85 103 95 NA 136 69 166 222 NA NA NA NA 119 NA 137
Fatehabad 125 115 113 NA 154 110 91 111 172 115 143 NA 133 127 90 84 98 84 107 128 231 78 60 224 242 153 224 155 147 164 222
Gurugram 140 122 118 149 180 184 203 143 199 133 NA NA 235 129 136 91 54 97 94 124 NA 157 76 197 214 NA 150 102 101 NA 122
Hisar 125 109 101 150 153 104 80 131 165 171 147 174 178 NA 93 94 NA 72 77 NA 102 57 49 163 197 169 192 NA 201 121 NA
Jind 163 167 126 188 156 146 144 127 164 183 195 NA 271 183 143 90 79 116 121 194 191 131 125 232 252 170 232 190 147 188 145
Kaithal 138 158 135 162 201 159 153 130 142 199 135 150 257 193 140 88 91 98 133 116 173 161 179 225 226 191 253 212 159 202 154
Karnal 170 183 153 192 188 152 131 120 163 161 188 143 281 103 120 122 131 86 159 169 NA 196 NA 165 221 188 NA NA 124 169 139
Kurukshetra 167 180 133 200 219 151 147 122 176 143 139 144 184 101 119 138 77 108 160 130 199 78 178 124 281 173 223 131 143 NA 215
Mewat 159 188 115 177 148 183 203 215 200 186 200 507 256 168 119 74 70 88 131 129 130 114 103 181 199 142 148 106 121 272 171
Gurugram 156 139 140 157 126 157 158 220 214 177 180 NA 205 187 137 72 87 45 130 142 150 245 186 319 322 172 120 NA NA 120 222
Mahendar
-garh 124 130 139 107 103 104 158 142 150 106 128 58 171 162 110 70 33 66 88 99 115 90 115 136 92 236 91 99 170 112 104
Palwal 144 131 123 162 136 178 235 149 201 148 182 355 184 155 123 238 103 93 128 135 302 125 187 260 304 178 180 154 156 521 NA
Panchkula 123 126 129 181 130 90 116 136 86 NA 134 123 NA NA 102 34 107 59 143 137 106 150 136 64 71 102 124 129 85 167 96
Panipat 171 194 181 207 191 168 178 126 184 182 149 NA 220 137 125 115 146 110 151 154 117 131 194 168 255 179 249 130 157 NA 143
Rohtak 114 99 97 125 136 106 185 159 227 106 168 113 204 115 130 65 67 78 126 125 159 69 180 93 213 142 137 95 143 145 186
Sirsa 125 103 110 79 150 99 110 105 160 123 144 180 134 179 101 80 98 76 103 128 156 114 61 256 282 161 247 165 158 135 NA
Sonipat 154 199 146 169 188 163 144 137 186 211 157 NA 219 144 193 134 130 104 159 182 152 153 163 275 222 194 198 181 174 NA 150
Y.Nagar 145 174 134 190 136 161 119 118 137 178 131 120 120 122 79 65 87 81 257 156 116 192 169 129 205 168 148 179 122 201 112
Y Nagar= Yamuna Nagar