Embed Size (px)
Citation preview

Calvin College Engineering Department
Senior Design Project
Project Proposal and Feasibility Study
Team 3
Arnold Aquino, Daniel Bosscher, Walter Schnoor, Daniel Ziegler
Engineering 339
12 December 2011
Team 3 Sim Escape
12 December 2011 Project Proposal and Feasibility Study
Executive Summary
The proposed senior design project is a head mounted display (HMD) simulation system that immerses a
user in a virtual environment. The purpose of this design is to give an accurate representation of
situations that are not feasible, safe, or otherwise realizable. This product can then be used for training,
designing, and learning in a safe and productive manner.
The goal of the project of creating an immersive environment will be achieved through designing as
natural a human-machine interface as possible. This interface will include a stereoscopic 3 dimensional
display array to be mounted in front of the user’s eyes to give a realistic view of the environment and a
head motion tracking system to allow the user to control the view with natural motion.
The proposed design of this system was determined to be technically feasible as a two semester academic
project. The design success is defined by meeting requirements for system latency, picture quality, weight,
and cost.
Design projections for full scale production were estimated and determined to be a financially feasible
model for a business with a 20% growth in the first three years and an internal rate of return of 48% after
those three years.

Team 3 Sim Escape i
12 December 2011 Project Proposal and Feasibility Study
Table of Contents 1 Project Introduction .............................................................................................................................. 1
1.1 Project Definition and Motivation ................................................................................................ 1 1.2 Acronym Definitions .................................................................................................................... 1 1.3 Course Overview .......................................................................................................................... 2 1.4 Team Information .......................................................................................................................... 3
1.4.1 Arnold Aquino ...................................................................................................................... 3 1.4.2 Dan Bosscher ........................................................................................................................ 3 1.4.3 Walter Schnoor ...................................................................................................................... 3 1.4.4 Dan Ziegler ........................................................................................................................... 4
2 System Architecture ............................................................................................................................. 4
2.1 Overall System .............................................................................................................................. 4 2.2 Head Tracker ................................................................................................................................. 5 2.3 Software ........................................................................................................................................ 5 2.4 Display System ............................................................................................................................. 5
3 Requirements ........................................................................................................................................ 5
3.1 Functional Requirements .............................................................................................................. 6 3.2 Electrical Requirements ................................................................................................................ 6
3.2.1 Head Tracker ......................................................................................................................... 6 3.2.2 Software ................................................................................................................................ 6 3.2.3 Display System ..................................................................................................................... 7
3.3 Physical Requirements .................................................................................................................. 7
3.3.1 Product Weight ...................................................................................................................... 7 3.3.2 Product Shape ....................................................................................................................... 8 3.3.3 Product Materials .................................................................................................................. 8
3.4 Power Requirements ..................................................................................................................... 8 3.5 Safety Requirements ..................................................................................................................... 9
3.5.1 Electrical Safety .................................................................................................................... 9 3.5.2 Physical Safety and Health Concerns ................................................................................... 9
3.6 Design Norms ............................................................................................................................... 9
3.6.1 Designing for Humility ....................................................................................................... 10 3.6.2 Designing for Trust ............................................................................................................. 10 3.6.3 Designing a Product of Integrity ......................................................................................... 10 3.6.4 Designing as Stewards ........................................................................................................ 10
4 Electrical System Specifications ........................................................................................................ 10
4.1 Head Tracker ............................................................................................................................... 11
4.1.1 Sensors ................................................................................................................................ 12 4.1.2 Data Acquisition .................................................................................................................. 17 4.1.3 System Integration .............................................................................................................. 18 4.1.4 Testing ................................................................................................................................. 18
4.2 Software ...................................................................................................................................... 19
4.2.1 Input Interface ..................................................................................................................... 20
Team 3 Sim Escape ii
12 December 2011 Project Proposal and Feasibility Study
4.2.2 Input Mapping ..................................................................................................................... 21 4.2.3 Virtual Environment Development and Simulation ............................................................ 22
4.3 Display System ........................................................................................................................... 25
4.3.1 3D Display Method ............................................................................................................. 25 4.3.2 Video Processing Platform .................................................................................................. 27 4.3.3 Video Input Format ............................................................................................................. 33 4.3.4 Video Buffers ...................................................................................................................... 38 4.3.5 Video Output Format (to the LCDs) ................................................................................... 41
5 Physical System Specifications .......................................................................................................... 43
5.1 Helmet ......................................................................................................................................... 43 5.2 System Interface Module (SIM) Enclosure................................................................................. 43 5.3 Wiring and Interconnection ......................................................................................................... 43 5.4 Optics .......................................................................................................................................... 43
6 System Integration Testing ................................................................................................................. 44
6.1 Video Delay Testing .................................................................................................................... 44 6.2 Motion Sensitivity Testing .......................................................................................................... 44 6.3 Power Consumption Testing ....................................................................................................... 44
7 Business Plan ..................................................................................................................................... 44
7.1 Vision and Mission Statement ..................................................................................................... 44 7.2 Industry Profile and Overview .................................................................................................... 45
7.2.1 Major Customer Groups ...................................................................................................... 45 7.2.2 Regulations and Restrictions ............................................................................................... 46 7.2.3 Significant Trends ............................................................................................................... 46 7.2.4 Growth Rate ........................................................................................................................ 46 7.2.5 Barriers to Entry .................................................................................................................. 47 7.2.6 Key Success Factors in Industry ......................................................................................... 47 7.2.7 Outlook for the Future ......................................................................................................... 47
7.3 Business Strategy ........................................................................................................................ 47
7.3.1 Company Goals and Objectives .......................................................................................... 47 7.3.2 SWOT Analysis ................................................................................................................... 47 7.3.3 Competitive Strategy........................................................................................................... 48
7.4 Marketing Strategy ...................................................................................................................... 48
7.4.1 Target Market ...................................................................................................................... 49 7.4.2 Customers' Motivation to Buy ............................................................................................ 49 7.4.3 Market Size and Trends ....................................................................................................... 49 7.4.4 Advertising and promotion ................................................................................................. 49 7.4.5 Promotion Costs .................................................................................................................. 50 7.4.6 Pricing ................................................................................................................................. 50 7.4.7 Distribution Strategy ........................................................................................................... 50
7.5 Competitor Analysis .................................................................................................................... 51
7.5.1 Existing Competitors........................................................................................................... 51 7.5.2 Potential Competitors .......................................................................................................... 52
7.6 Financial Forecasts ...................................................................................................................... 53
7.6.1 Financial Forecast Description ............................................................................................ 53

Team 3 Sim Escape iii
12 December 2011 Project Proposal and Feasibility Study
7.6.2 Key Assumptions ................................................................................................................ 53 7.6.3 Financial Statements ........................................................................................................... 54 7.6.4 Break-Even Analysis ........................................................................................................... 54 7.6.5 Ratio Analysis ..................................................................................................................... 55
7.7 Loan or Investment Proposal ...................................................................................................... 55
7.7.1 Amount Requested .............................................................................................................. 55 7.7.2 Purpose of Uses of Funds .................................................................................................... 55 7.7.3 Repayment Schedule ........................................................................................................... 55 7.7.4 Timetable for implementing plan and launching the business ............................................ 55
8 Project Management ........................................................................................................................... 56
8.1 Team Organization ...................................................................................................................... 56
8.1.1 Division of Work ................................................................................................................. 56 8.1.2 Team Advisors and Support ................................................................................................ 56 8.1.3 Team Meetings .................................................................................................................... 56 8.1.4 Storing Files ........................................................................................................................ 57
8.2 Schedule ...................................................................................................................................... 57
8.2.1 Schedule Management ........................................................................................................ 57 8.2.2 Critical Path ........................................................................................................................ 57 8.2.3 Current Progress and Feasibility ......................................................................................... 58
8.3 Budget ......................................................................................................................................... 58 8.4 Method of Approach ................................................................................................................... 58
9 Conclusions ........................................................................................................................................ 59
9.1 Current Progress .......................................................................................................................... 59
9.1.1 Prototypes ........................................................................................................................... 59 9.1.2 Experiments ........................................................................................................................ 59 9.1.3 Setbacks .............................................................................................................................. 60
9.2 Remaining High Risk Obstacles ................................................................................................. 60
9.2.1 PCB Design ......................................................................................................................... 60 9.2.2 Lenses and Lens Mounting ................................................................................................. 60
10 Credits and Acknowledgements ......................................................................................................... 61 11 References .......................................................................................................................................... 62 12 Appendices ............................................................................................................................................ I
12.1 Appendix A – Angular Velocity Test Data ..................................................................................... I 12.2 Appendix B - Texas Instruments TMS320C647x Block Diagram ............................................... II 12.3 Appendix C – Projected Financials ............................................................................................. III 12.4 Appendix D – Project Prototype Budget ..................................................................................... VI 12.5 Appendix E – Team Work Breakdown Schedule ...................................................................... VII
Team 3 Sim Escape iv
12 December 2011 Project Proposal and Feasibility Study
List of Figures
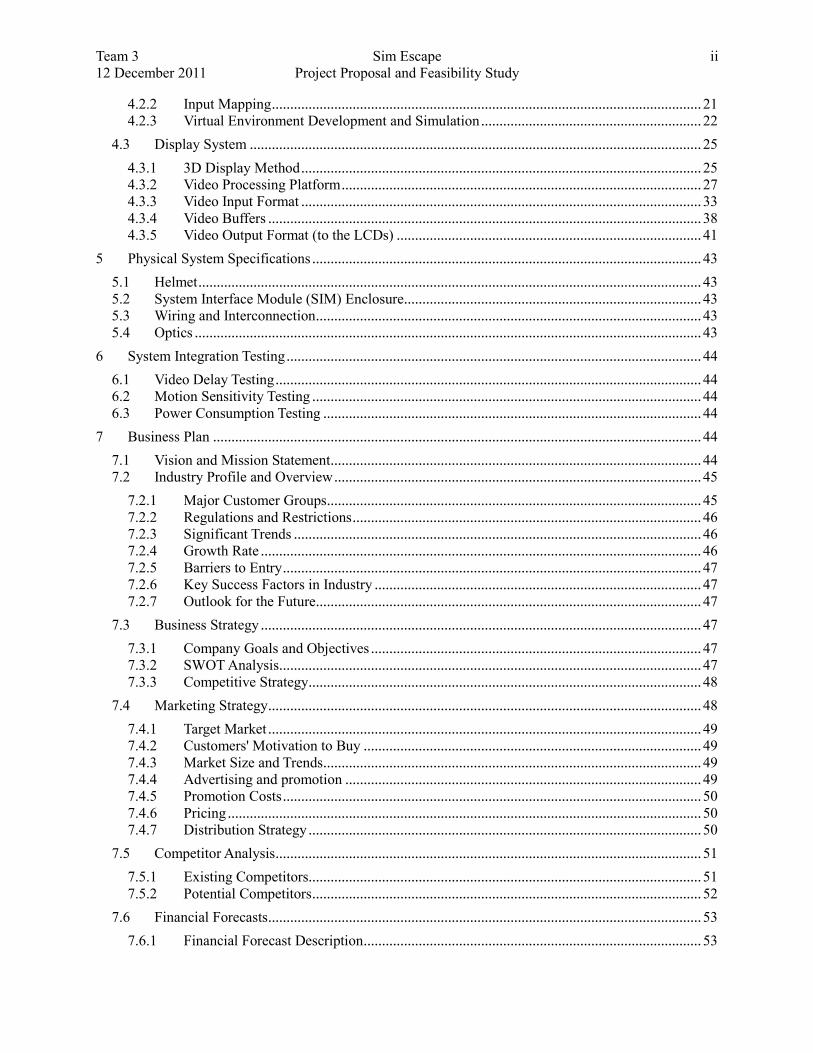
Figure 1. Photo of Team 3 (Arnold Aquino, Dan Ziegler, Walter Schnoor, Dan Bosscher) ......................... 3 Figure 2. High Level System Interconnection .............................................................................................. 5 Figure 3. System Interface Module Block Diagram ................................................................................... 11 Figure 4. Head Tracker Block Diagram ...................................................................................................... 11 Figure 5. Software Architecture Block Diagram......................................................................................... 19 Figure 6. Display System Block Diagram .................................................................................................. 25 Figure 7. 16-Bit and 24-Bit RGB Color Resolutions .................................................................................. 37
List of Tables
Table 1. Meanings of Acronyms ................................................................................................................... 1 Table 2. Head Tracker Technology Alternatives ......................................................................................... 12 Table 3. Accelerometer Alternatives ........................................................................................................... 14 Table 4. Gyroscope Alternatives ................................................................................................................. 14 Table 5. Accelerometer Decision Matrix .................................................................................................... 16 Table 6. Gyroscope Decision Matrix .......................................................................................................... 17 Table 7. Data Acquisition Alternatives ....................................................................................................... 17 Table 8 Virtual Environment Software Decision Matrix ............................................................................ 23 Table 9. Video Processing Alternatives ....................................................................................................... 27 Table 10. FPGA Alternatives ...................................................................................................................... 30 Table 11. Proposed FPGA IO Pins (Minimum) .......................................................................................... 31 Table 12. Video Processor Test Matrix ....................................................................................................... 32 Table 13. Video Input Format Alternatives ................................................................................................. 34 Table 14. 16-Bit Color Format .................................................................................................................... 37 Table 15. Input Format Test Matrix ............................................................................................................ 38 Table 16. Frame Buffer Alternatives ........................................................................................................... 39 Table 17. Video Buffer Memory Test Matrix .............................................................................................. 41 Table 18. Output Video Test Matrix ............................................................................................................ 42 Table 19. Comparison of Competitor Product Functionality ...................................................................... 51 Table 20. Project Management Critical Paths ............................................................................................. 57

Team 3 Sim Escape Page 1 of 62
12 December 2011 Project Proposal and Feasibility Study
1 Project Introduction
1.1 Project Definition and Motivation
The primary goal of the team’s project is to design a simulation helmet that will allow the user to
visualize a computer generated virtual environment in three dimensions. In addition to being a 3D
visualization tool, the helmet will track movements of the user’s head. This will allow the user to look
around the virtual environment simply by turning their head.
The main reason for this project is the evolution of the human machine interface. A human machine
interface (HMI) is the means by which people interact with a technology. In 1946, ENIAC, the first
general-purpose computer, interacted with its users by means of a punched card. Since then, HMI
solutions have progressed to give us the keyboard and mouse, the handheld controller, and the touch
screen. In the past decade, these technologies have all been designed to answer this question: how do we
make interfacing to a machine feel as natural as possible? The more natural a HMI feels to the user, the
more likely the user is to both use the technology and benefit from the technology.
A natural feeling may not sound necessary for a task such as word processing. However, computers are
being used to solve much more complex problems such as flight training simulations, advanced robotic
surgery, and architectural modeling. These unique applications pose a challenge to the conventional HMI.
For these applications, it would be quite beneficial for the user to be able to become more immersed in the
interaction, from both an input and an output perspective. Advanced simulations are best seen rendered in
three dimensions. This is how the eye naturally perceives objects in space. In addition, when a person
wishes to see what is to their left or right, they look to the left or right. This sounds trivial, but computers
currently offer no ability to change what the user is seeing on a screen simply by turning their head. The
ability to visualize an environment in three dimensions and to look through this environment by simply
turning one’s head is something that would lend itself to making a simulation more immersive and
realistic for the user.
1.2 Acronym Definitions
Below in Table 1 is a list of acronyms that apply to the project. This table is for reference and the reader’s
convenience.
Table 1. Meanings of Acronyms
Acronym Meaning
3D Three Dimensional
AV Audio-Visual
BGA Ball Grid Array
CPU Central Processing Unit
DAQ Data Acquisition
DMA Dynamic Memory Access
DSP Digital Signal Processor
DVI Digital Video Interface
FIFO First In First Out
FPGA Field Programmable Gate Array (Programmable Logic Device)
GUI Graphical User Interface
HDMI High Definition Multimedia Interconnect

Team 3 Sim Escape Page 2 of 62
12 December 2011 Project Proposal and Feasibility Study
Acronym Meaning
HMI Human Machine Interface
Hz Hertz (cycles per second)
I2C Inter-Integrated Circuit
IC Integrated Circuit
IMU Inertial Measurement Unit
LCD Liquid Crystal Display
MEMS Microelectromechanical Systems
NTSC National Television Systems Committee
PAL Phase Alternating Line
PC Personal Computer
PCB Printed Circuit Board
PLL Phase Lock Loop
SDRAM Synchronous Dynamic Random Access Memory
SPI Serial Peripheral Interface
SRAM Static Random Access Memory
SSRAM Synchronous Static Random Access Memory
TFT Thin Film Transistor
USB Universal Serial Bus
VGA Video Graphics Array (A display format as well as a display connector)
VHDL VHSIC Hardware Description Language
VHSIC Very High Speed Integrated Circuits
1.3 Course Overview
As a requirement for graduation from Calvin College's Engineering Program, all students go through a
course titled Senior Design. The purpose of this course is to give senior engineering students an
opportunity work on a design of their own through the entire design process. All students divide into
groups of 3-5 depending on the size of the project they are working on. Throughout the course of their
senior year, each group must come up with a design idea, develop an implementation plan, identify
project requirements, come up with alternatives, make design decisions, and if possible, construct a
prototype. Each group reports to a Calvin engineering professor who provides the team with advice and
accountability throughout the year. At the end of the year each group presents the results of their work to
the Calvin community with a poster and a demonstration session open house. The group will also present
to their family and friends with a formal presentation. Additionally, two reports are required for the class,
one at the end of each semester. The first report, the Project Proposal and Feasibility Study (PPFS) is due
at the end of the fall semester and gives an introduction of the project, current design plans, and the
results of any tests that have been carried out. The Final Report, due at the end of the spring semester, is a
complete report of the project and the work done throughout the year to finish it. This document is the
PPFS submitted at the end of the fall semester.
Team 3 Sim Escape Page 3 of 62
12 December 2011 Project Proposal and Feasibility Study
1.4 Team Information
The senior design team is comprised of four senior engineering students in the electrical and computer
concentration. The team is pictured in Figure 1.
Figure 1. Photo of Team 3 (Arnold Aquino, Dan Ziegler, Walter Schnoor, Dan Bosscher)
1.4.1 Arnold Aquino
Arnold is an Engineering student in the Electrical and Computer concentration. His favorite part of the
Engineering program has been the analog oriented classes from his junior year. He likes to work with
transfer functions, filters, and amplifiers. Outside of the engineering program, Arnold also works on
music production and composition. He enjoys playing video games in his free time, mainly racing
simulation and music rhythm games. He is also the president of the Calvin student chapter of IEEE.
Arnold currently works part time at Dematic and has also accepted a full time position after graduation.
At Dematic, he programs programmable logic controllers and drafts using AutoCAD. For this project,
Arnold’s main goal is to design the sensor circuit and the data acquisition unit.
1.4.2 Dan Bosscher
Dan is a senior Engineering student in the Electrical and Computer concentration at Calvin College.
Along with his engineering degree, he is planning on graduating with a minor in mathematics. Dan is
currently working part time at Johnson Controls where he has been an intern for the past two summers.
Dan is also a member of Calvin College Wind Ensemble, where he plays the euphonium. In his free time,
Dan enjoys running (mainly road racing), reading, and playing video games. He is not sure what his plans
are after graduation, but is applying to a variety of engineering positions, graduate schools, and urban
education programs (such as Teach for America or Memphis Teacher Residency).
1.4.3 Walter Schnoor
Walter is a senior Engineering student in the Electrical and Computer concentration at Calvin College.
Walter has worked for Johnson Controls in Holland, MI designing functional testers for automotive

Team 3 Sim Escape Page 4 of 62
12 December 2011 Project Proposal and Feasibility Study
electronics. In addition, Walter has professional experience as a network analyst in healthcare as well as
professional experience in audio and video production. Walter brings to the team a technical background
in video systems and signal flow, as well as organizational and communication skills. In his free time,
Walter enjoys working on late model muscle cars, listening to country music, and helping others with
technical problems. Upon graduation, Walter will be taking a position in applications engineering with
Texas Instruments in Dallas.
1.4.4 Dan Ziegler
Dan is a senior Engineering student in the Electrical and Computer concentration Calvin College. He
currently works as an intern at Dematic doing CAD design, automation software design, and data
collection software. He also enjoys playing and modifying video games as a hobby. He brings varied
experience with software design and virtual environment programming to the project. His section of the
project is the virtual environment and the hardware-software interfaces.
2 System Architecture
The 3D simulation helmet will be designed as a human machine interface to a simulated environment on a
personal computer. Therefore, the system will have two-way communication between the computer and
the user. The computer will communicate with the user through a display system, and the user will
communicate back to the computer through head movement.
The system consists of 3 main subsystems. The system is divided according to the kind of data that is
processed or converted in the subsystem. Data flows through the subsystems as physical, electrical, or
visual data. The first subsystem is the head tracker. The head tracker subsystem includes the inertial
measurement unit and the data acquisition unit. The head tracker subsystem converts the physical
movement to electrical signal data that software can utilize. The next subsystem is the software. The
software subsystem includes the head tracking software and the virtual environment software. The
software subsystem processes the digital data from the head tracker subsystem and outputs the appropriate
video data. The next subsystem is the display system. The display system includes the video processor
and the screens. The display system uses the video data from the software and outputs the data to a pair of
screens as visual information.
2.1 Overall System
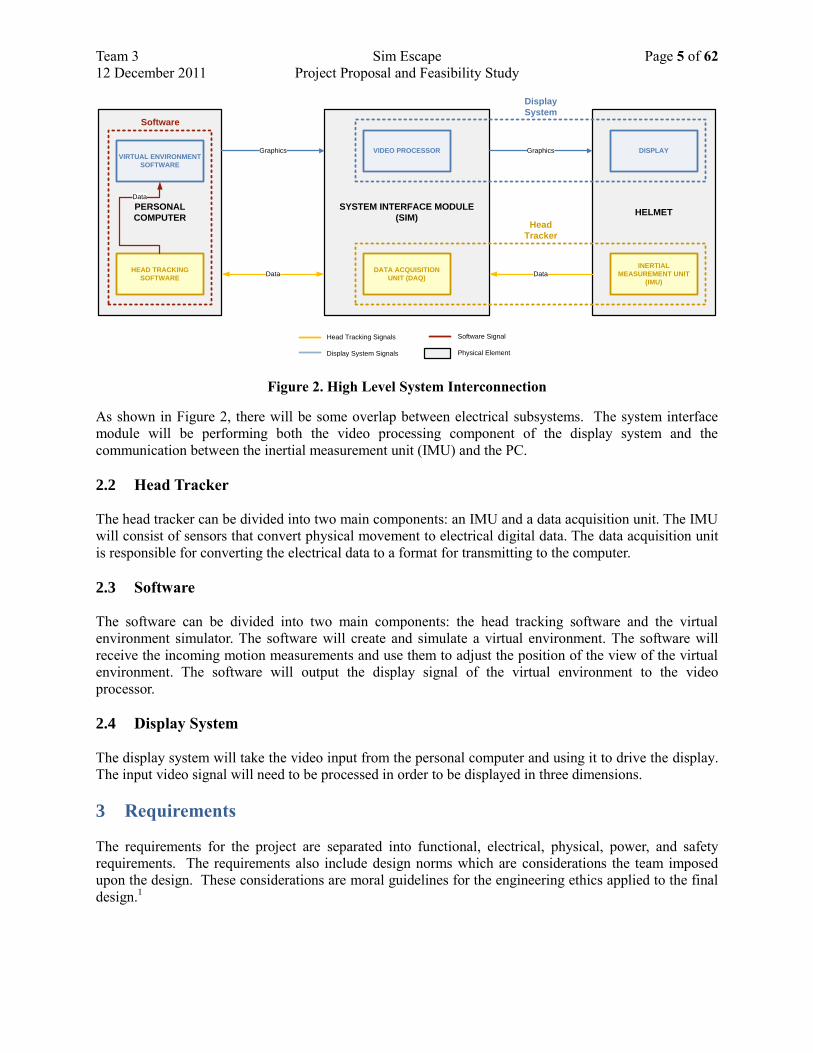
The 3D simulation helmet will have two physical components. The first will be the helmet itself. The
helmet will house the stereoscopic LCD array, as well as the inertial measurement unit (IMU) for the head
tracker. The second component will be the system interface module (SIM). The SIM will consist of a
printed circuit board and power supply assembly. The printed circuit board will contain the hardware to
drive the stereoscopic LCD array and the data acquisition (DAQ) hardware to capture the input from the
IMU. The 3D simulation helmet will also connect to a personal computer which will generate the virtual
environment. The high-level system interconnection can be seen in Figure 2 on the following page.
Team 3 Sim Escape Page 5 of 62
12 December 2011 Project Proposal and Feasibility Study
HELMETSYSTEM INTERFACE MODULE
(SIM)
INERTIAL
MEASUREMENT UNIT
(IMU)
DISPLAY
PERSONAL
COMPUTER
Graphics
Data
Graphics
Data
VIRTUAL ENVIRONMENT
SOFTWARE
HEAD TRACKING
SOFTWARE
DATA ACQUISITION
UNIT (DAQ)
VIDEO PROCESSOR
Data
Display
System
Head
Tracker
Software
Head Tracking Signals
Display System Signals
Software Signal
Physical Element
Figure 2. High Level System Interconnection
As shown in Figure 2, there will be some overlap between electrical subsystems. The system interface
module will be performing both the video processing component of the display system and the
communication between the inertial measurement unit (IMU) and the PC.
2.2 Head Tracker
The head tracker can be divided into two main components: an IMU and a data acquisition unit. The IMU
will consist of sensors that convert physical movement to electrical digital data. The data acquisition unit
is responsible for converting the electrical data to a format for transmitting to the computer.
2.3 Software
The software can be divided into two main components: the head tracking software and the virtual
environment simulator. The software will create and simulate a virtual environment. The software will
receive the incoming motion measurements and use them to adjust the position of the view of the virtual
environment. The software will output the display signal of the virtual environment to the video
processor.
2.4 Display System
The display system will take the video input from the personal computer and using it to drive the display.
The input video signal will need to be processed in order to be displayed in three dimensions.
3 Requirements
The requirements for the project are separated into functional, electrical, physical, power, and safety
requirements. The requirements also include design norms which are considerations the team imposed
upon the design. These considerations are moral guidelines for the engineering ethics applied to the final
design.1

Team 3 Sim Escape Page 6 of 62
12 December 2011 Project Proposal and Feasibility Study
3.1 Functional Requirements
In this section, the system as a whole is referred to as “the device.”
REQ 3.1a: The device shall have a power on/off button.
REQ 3.1b: The device shall display in three dimensions.
REQ 3.1c: The device shall track the motion of the user’s head.
REQ 3.1d: The device shall have a method of calibration.
3.2 Electrical Requirements
The project is subdivided into three main systems: the head tracker, the display system, and the virtual
environment. The electrical requirements are described in terms of each of the three main systems.
3.2.1 Head Tracker
REQ 3.2.1a: The head tracker shall be connected through a USB Type A connector
The USB Type A connector is a very common device connector on personal computers.
REQ 3.2.1b: The head tracker shall be able to detect rotation and movement along the x-axis, y-axis, and
z-axis.
The acceleration shall be measured up to 6.7 g’s.2 The angular velocity shall be measured up to 800
degrees per second (See Appendix A). The sensor shall detect an acceleration minimum of one hundredth
of the acceleration due to gravity to avoid a jittery output. The sensor shall detect an angular velocity
minimum of one hundredth of a degree per second.
3.2.2 Software
REQ 3.2.2a: The software shall be supported by Windows XP SP2 or later Windows operating systems.
The software shall run on Windows XP SP2 or later because, based on the team’s research, 93% of the
personal computer market share belongs to machines that fit into this category.3
REQ 3.2.2b: The software shall be able to run the virtual environment and head tracking programs
independently.
This means that the head tracker and virtual environment programs are two separate programs. It also
means that the head tracking program can be run without the virtual environment program being run and
vice versa. This is important to the customer for modularity of the input interface and the virtual
environment software. If the programs are independent, the user can purchase our system even if they
already have an established virtual reality training program.

Team 3 Sim Escape Page 7 of 62
12 December 2011 Project Proposal and Feasibility Study
REQ 3.2.2c: This software shall be able to simulate the virtual environment using a physics engine.
This requirement states that the software shall be able to accurately depict the user’s movement through a
virtual environment by applying mathematical models of physical laws. The physics engine is necessary
for the user’s immersion in the virtual environment.4
REQ 3.2.2d: The user interface for creating the virtual world shall be graphical and not require
programming language knowledge.
This is necessary to expand the target market and to assure the product can stand alone without the user
needing to hire a programmer.
3.2.3 Display System
REQ 3.2.3a: It shall accept an input video stream in a 3D format, and contain the necessary components
to display the video output in 3D.
REQ 3.2.3b: The displays shall be mounted on the helmet.
The 3D simulation helmet is defined as a head mounted display. The helmet will be the physical
component worn by the user of the headgear.
REQ 3.2.3c: The display system shall be able to accept a common signal format used in AV and
computing.
For the system to be successful from a business perspective, the device needs to be able to connect to a
common AV format that is used on desktop and laptop personal computers running Microsoft Windows.
REQ 3.2.3d: The display system shall input a resolution of at least 640x480 pixels resolution.
This is the minimum effective resolution for Microsoft Windows.5
REQ 3.2.3e: The display system video shall have a frame rate of 30 frames per second.
A frame rate of 30 frames per second is beyond the persistence of vision, and a higher frame rate would
not provide any performance benefit to the user.
3.3 Physical Requirements
There are a number of restrictions on the physical design of the project. Many of these requirements are
based on improving the user experience and preventing injury while the product is in use.
3.3.1 Product Weight
REQ 3.3.1: The system shall place a load on the user's head of no more than 2.0 lbs.
If the product weighs too much it would cause discomfort or even injury to the user. The limit of 2.0
pounds is an estimate of what the weight limit should be. The team will run initial weight tests on team
members during interim, and will have run a more extensive test on unbiased groups not connected to the
team by the end of interim.

Team 3 Sim Escape Page 8 of 62
12 December 2011 Project Proposal and Feasibility Study
3.3.2 Product Shape
REQ 3.3.2: The product shall have a shape that is balanced over the user's head.
An unbalanced product can apply torque to the user’s neck; this can affect the motion of the user’s head
possibly causing discomfort or injury for the user. Balanced means that the product shall not cause
torques on the neck that could cause discomfort, even after extended continuous use. Research provided
maximum neck torques of 54.38 Nm for lateral flexion along the coronal plane (returning head to vertical
from being tilted to the side), 56.37 Nm for extension torque along the sagittal plane (returning head to
vertical from being tilted to forward), and 29.10 Nm for flexion torque along the sagittal plane (returning
head to vertical from being tilted back).6 These measures, however, are the maximum load the neck can
bear and the group must define the requirement for comfort.
The team will run initial torque tests on team members during interim, and will have run a more extensive
test on unbiased groups not connected to the team by the end of interim.
3.3.3 Product Materials
REQ 3.3.3a: The helmet shall be made of recyclable materials.
The use of recyclable plastics is necessary for the team be good stewards, limiting the amount of waste
generated by the product.
REQ 3.3.3b: The product shall avoid use of materials that would be harmful to the environment. If this
cannot be achieved the team shall publish proper disposal methods for users.
The use of non-toxic materials is necessary to minimize the impact of the product. However, if a required
part cannot be acquired without toxic materials (if the sensor break-out boards did not use lead-free circuit
design), this impact could also be minimized with proper disposal methods. Either way, the team needs to
address this in the design.
3.4 Power Requirements
REQ 3.4a: The power supply shall provide at least as much voltage as the greatest voltage for a single
part.
REQ 3.4b: The power supply shall provide at least as much current as the combined maximum current
draw of all included parts.
These requirements will be specified during interim, when the team has finalized the parts list.
REQ 3.4c: The power supply shall contain a current-limiting fuse.
This requirement is to protect the device from an internal short circuit which could potentially injure the
user and damage the device.

Team 3 Sim Escape Page 9 of 62
12 December 2011 Project Proposal and Feasibility Study
REQ 3.4d: The power supply shall be AC mains isolated.
This requirement provides the device with isolation from the higher voltage mains to protect against high
voltage shock.
REQ 3.4e: The power supply shall accept 110-120 volts of alternating current at 60Hz.
This requirement is to enable the device to be supported by North American power standards.
3.5 Safety Requirements
It is imperative that the product is safe for the user under normal conditions. Therefore, it is necessary to
identify potential hazards and what can be done to avoid them. It is also important for the team to
communicate to the user what hazards he or she shares responsibility for preventing (proper use of the
device). The team wants its customers to be able to trust that, when used properly, the product can be a
safe and helpful tool. The team feels the best way to create this trust is by open communication about the
product.
3.5.1 Electrical Safety
REQ 3.5.1a: The product shall use insulated wiring and mount electrical components in a manner such
that the user will not be able to access them.
If any electrical parts or wires are exposed, there is a potential for shock damage to the part, and
discomfort or injury for the user.
REQ 3.5.1b: The product shall also have relatively low power for the safety of the user.
The perceptible current for humans is 1 milliamp. The user shall not perceive any current from the
helmet.7
3.5.2 Physical Safety and Health Concerns
REQ 3.5.2a: The user shall be notified of safe usage of the product and potential safety risks.
There are certain situations and people who should not use this product (people with epilepsy or prone to
seizures). These situations will be made known to the user through a manual and a splash screen on start-
up.
REQ 3.5.2b: The maximum delay (lag) of the system shall be 33 ms.
If the system delay is too great, the user can develop headaches or motion sickness from the motion being
out of sync with the video. The video output is 30 frames per second, and the input can only be realized
by the display once every 33 ms (the frame period).
3.6 Design Norms
Design decisions cannot be merely objective, but must be considered in their societal context. Other
people will be affected by the decisions that the team makes. Therefore, we need to be considerate of

Team 3 Sim Escape Page 10 of 62
12 December 2011 Project Proposal and Feasibility Study
other people in our design. Several things that we are focusing on in our design when we consider how
other people interact with our product are humility, trust, integrity, and stewardship.
3.6.1 Designing for Humility
The goal for the team is to provide a 3D simulation headgear that would provide the user with an
immersive, lifelike experience. However, the team recognizes that the technology it is using has
limitations, and will not be able to create a flawless simulation of any event. The team feels it is important
to recognize the limitations of the system and to be open about these limitations with the customer, so that
the customer does not expect more of the product than it can provide.
3.6.2 Designing for Trust
Because we are designing our product to be used as a simulation tool, it is important that we can
accurately represent any situation a customer might want. Users of this product will need to be
able to trust it to make an accurate representation of what they try to simulate with it. If they
cannot trust our product, it will not be useful to them as a training tool and will reflect poorly
upon the designers.
3.6.3 Designing a Product of Integrity
We want our design to be intuitive to use. When simulating any situation, you want to be able to interact
with the simulation the same way you would interact with the real world. For example, when we change
what we look at in real life we turn our head. A major portion of our project is emulating this same
behavior, so that when users turn their heads, their view of the environment will change.
3.6.4 Designing as Stewards
As Christians, we are called to take care of God's creation and use the resources of the world responsibly.
Furthermore, we live in a world of limited resources. Therefore, we feel it is important to make as small
of an impact as possible with our product. We want to minimize the amount of power that our product
uses in effort to use the world's resources responsibly. For this same reason, we want to use recyclable
materials as much as possible in our product. This allows our product to be disposed of in a sustainable
way. However, it cannot be assumed that the user will dispose of the product properly; therefore we want
to use toxin free materials in our design to reduce the environmental impact if our device ends up in a
landfill. One way we can accomplish this is through the use of lead-free circuit boards.
4 Electrical System Specifications
The electrical components of the system will primarily reside in the system interface module. The current
design consists of a field programmable gate array (FPGA) device at the center of the design. The display
system was chosen to be a stereoscopic display consisting of 2 LCD displays at 320x240 pixels. The
system interface module block diagram can be seen in Figure 3 on the following page. The configuration
seen in Figure 3 allows for customization after physical construction. The head tracker and display
system share the resources of the FPGA. The design process and alternative designs for each subsystem
(Display System, Head Tracker, and Software) are detailed in this chapter.

Team 3 Sim Escape Page 11 of 62
12 December 2011 Project Proposal and Feasibility Study
ALTERA
CYCLONE II FPGA
PIXEL BUFFER A
512kB SRAM16-Bit 1 Plane 320x240
PIXEL BUFFER B
512kB SRAM16-Bit 1 Plane 320x240
INERTIAL
MEASUREMENT UNITDIGITAL OUT
CLOCK 50MHz
INPUT VIDEO
DECODERTV-VIDEO NTSC
Hardware Video
Processor
On-Chip Memory
16KB
NIOS II CPU
32-bit SoftcorePhase Lock Loop
UART RS-232
SERIAL DRIVER
USB UART
JTAG to USB
RIGHT LCD DRIVERLEFT LCD DRIVER
SYSTEM INTERFACE MODULE (SIM)
Data Interface to
Software System
Graphics Interface to
Software System
Data Interface to
Head Tracker
LEFT LCD RIGHT LCD
Figure 3. System Interface Module Block Diagram
4.1 Head Tracker
The head tracker consists of sensors and a data acquisition unit. The sensors convert physical movement
to electrical signals. The data acquisition unit communicates with the computer through its own
communication protocol. A block diagram of the proposed head tracker can be seen in Figure 4.
ALTERA CYCLONE II FPGA
DATA ACQUISITION PROCESSING MODULES
NIOS II
SOFTCORE 32-BIT
MICROPROCESSOR
ON CHIP MEMORY
UART MODULE
AVALON
I2C MODULE
AVALON
AVALON
UART I2C
OUT TO PERSONAL
COMPUTER
USB
I2C BUS
3-AXIS
ACCELEROMETER
3-AXIS
GYROSCOPE
I2C
I2C
USB TO UART
Figure 4. Head Tracker Block Diagram

Team 3 Sim Escape Page 12 of 62
12 December 2011 Project Proposal and Feasibility Study
4.1.1 Sensors
The team must select sensors that can track the specific types of movement for the application of the
helmet. Sensors that convert physical movement to electrical signals have been around for a long time and
have had time to grow into different markets.
4.1.1.1 Problem Specification
The team needs to map out the location and orientation of the user’s head. The device needs a way for the
software to tell at what rate and in which direction the user’s head is moving. This physical movement
must be measured in three dimensions. This means that a physical to electrical conversion system is
needed to translate the physical movement into a set of data. The sensors will communicate with the data
acquisition unit which then communicates with the software to map out the location and direction of the
user’s head.
4.1.1.2 Alternatives
The following table shows possible technologies that can be used to motion tracking.
Table 2. Head Tracker Technology Alternatives
Technology Description
3D Scanner Uses depth sensors and infrared lasers to reconstruct a 3D image
Magnetic Fields Emitting magnetic fields and uses magnetic field sensors to determine
location
MEMS Uses independent sensors
Camera Image
Tracking
Uses stereo image comparison between frames from a camera to
determine rate of movement.
4.1.1.3 Decision Criteria
Size/Weight - The sensors used for the tracking must be small. Ideally, the sensors would be less
than a square inch for small board footprint on the circuit board. The circuit board that the sensors
are mounted on will be attached to the helmet itself. Too much weight could put a strain on the
user’s neck (See section 3.3.1). Small sensor size will also add to the aesthetics of the final
product.
Setup Complexity - The team also aims for the product to be easy to set up. External sensors will
tend to have more complexity for usage such as limited product usage area and orientation.
Design Type – This criterion refers to whether the design will be software or hardware based. The
team aims to design more hardware and hardware interface than software.
4.1.1.4 Design Selection
Motion-sensing technology that requires emitters such as infrared or magnetic field emitters will not be
feasible because setup for such a system is too complicated. Another possible technology is visual
tracking. This requires mounted cameras on the helmet. The problem with this alternative is that it would
mostly be a software design which is not the goal of this project. Another type of image tracking
technology is a 3D scanner. These types of scanners are external sensors that calculate depth using

Team 3 Sim Escape Page 13 of 62
12 December 2011 Project Proposal and Feasibility Study
stereoscopic cameras. The Microsoft Kinect system uses 3D scanners for head tracking. This type of
technology has the same problem as the visual tracking because it is centered on software design.
The team decided to use MEMS (microelectromechanical systems) technology sensors. These sensors are
used in many consumer electronic devices such as video game controllers and smart phones. They are
also used for larger scale applications such as vibration measurements for bridges, buildings, and other
structures. These sensors are small and compact which means that it will be easy to mount to the user’s
head while making the extra weight unnoticeable. Finally, the cost for MEMS sensors has decreased over
the years because of the continuously growing market.
The MEMS sensors that the team decided on are accelerometers and gyroscopes. The accelerometers are
important in measuring the linear acceleration of the head. 3-axis accelerometers are ideal to measure
movement of the user in three directions. For example, if the user jumps or crouches, an accelerometer
measuring the Z-axis is required. If the user moves forward and backward, an accelerometer measuring
the Y-axis is required. If the user strafes left and right, an accelerometer measuring the X-axis is required.
In addition to measuring the movement along each axis, the sensors also need to measure the rotation
around each axis. Rotation around the X-axis needs to be measured when the user looks up and down. If
the user looks left or right, the rotation around the Z-axis needs to be measured. Finally, if the user tilts his
or her head, the sensors need to measure the rotation around the Y-axis.
With the accelerometer and gyroscope, the total sensor circuit has six degrees of freedom. This is just
enough to map out the movement of any unit in a three dimensional space. The team also considered
adding a magnetometer to the sensor unit. A magnetometer would tell the software the direction of true
North. This is useful in recalibration. However, it is only useful for recalibration in the X-axis and Y-axis.
The added cost for a breakout board and production cost were too much for the limited added
functionality. Therefore, the team decided not to include a magnetometer, as it is not necessary for the
product to function correctly.
4.1.1.5 Implementation
The chosen sensor technology presented the need to select a specific sensor.
4.1.1.5.1 Alternatives
The MEMS sensors the team selected are accelerometers and gyroscopes as mentioned in section 4.1.1.4
Design Selection. Decisions needed to be individually made as to which accelerometers and gyroscopes
will be selected.
4.1.1.5.1.1 Accelerometers
The team found Accelerometer devices from electronic component distributors such as Avnet8 and
DigiKey9. The table on the following page shows the devices along with their electronic characteristics
and device specifications.

Team 3 Sim Escape Page 14 of 62
12 December 2011 Project Proposal and Feasibility Study
Table 3. Accelerometer Alternatives
Manufacturer Part No. Unit
Cost
($)
Breakout
Board
Cost ($)
Output
Signal
Supply
Voltage
(V)
Acceleration
range (+/- g)
Bandwidth
(Hz)
Current
Consumption
(µA)
Analog Devices ADXL335 3.22 24.95 Analog 1.8 - 3.6 3 550, 1600 350
Analog Devices ADXL345 13.67 27.95 I2C or SPI
2 - 3.6 2, 4, 8, 16 6.25 - 3200 145
Bosch BMA180 3.108 29.95 I2C or
SPI
1.6 - 3.6 1, 1.5, 2, 3, 4, 8,
16
10 - 1200 640
STMicroelectronics LIS331HH 3.604 27.95 I2C or
SPI
2.16 - 3.6 6,12,24 50 - 1000 250
Freescale Semiconductor
MMA7361L 1.275 19.95 Analog 2.2 - 3.6 1.5,6 300, 400 600
VTI Technologies SCA3000-D01 16.88 44.95 SPI 2.35-3.6 2 45 480
4.1.1.5.1.2 Gyroscopes
The team decided to use 3-axis gyroscopes for reasons explained in the next section 4.1.1.5.2
Implementation Decision Criteria. Specifications for some or the gyroscopes that fit the criteria can be
seen in Table 4 below.
Table 4. Gyroscope Alternatives
Manufacturer Part No. Unit
Price
($)
Breakout
Board
Cost ($)
Output
Signal
Supply
Voltage
(V)
Angular
velocity range
(degrees/s)
Bandwidth
(Hz)
Current
Consumption
(mA)
STMicroelectronics L3G4200D 6.353 49.95 I2C or
SPI
2.4 - 3.6 250, 500, 2000 100 - 800 6.1
Invensense ITG-3200 10 49.95 I2C 2.1 - 3.6 2000 1000 6.5
VTI Technologies CMR3000-D01 7.5 N/A I2C or SPI
2.5 - 3.6 2000 20 - 80 5
4.1.1.5.2 Decision Criteria
The criteria used for selecting sensors are described below. The criteria were given weights based on
importance to the project. The team used these weights in the decision matrices in sections 4.1.1.5.3.1
Accelerometer Design Selection and 4.1.1.5.3.2 Gyroscopes Design Selection.
Unit Cost [7] – The cost for each unit made for a large volume production.
Breakout Board cost [9] – The cost for a breakout board. A breakout board is used to wire up the
chip easily. The pins for the chip are too close together because they are surface mount chips.
Therefore, breakout boards make it easier for the developer to design and test the head tracker
circuit.
Interface/Output Signal [7] – The interface is the type of output signal that the sensor circuits
have. These include analog, digital SPI, and digital I2C. The interface is important because it
determines how the data acquisition unit is laid out. For example, for an analog interface, the
team would need to include an Analog to Digital converter.
Bandwidth [6] – The bandwidth is the rate at which data can be read from the sensors. Generally,
the team is looking for high bandwidth in order to process the information accurately and output
the results to the video as quickly as possible. The minimum bandwidth has yet to be determined.
The minimum bandwidth depends on the rate at which the software processes the sensors’ data
and outputs to the video processing unit. If this rate is higher than the rate that the set of data (x,
y, and z components) is read from the sensors, then the sensor bandwidth is the limiting factor
which causes noticeable delays in the data flow. After testing sensors with bandwidth of 800Hz,
the response was pretty accurate with no noticeable delay.

Team 3 Sim Escape Page 15 of 62
12 December 2011 Project Proposal and Feasibility Study
Number of Axes – The number of axes represents the freedom of movement. The team wants
three axes of motion to be detected for both the accelerometer and the gyroscope. The team is
also looking for sensor circuits that have as many axes in one chip as possible. The reason for this
is to keep the reference point the same for all three axes. For instance, the pitch, yaw, and roll
zero reference point should be the same point so as to not overlap data.
Range [8] – The range refers to how accurate the sensors sense linear movement or rotational
movement. The accelerometers measure up to a certain acceleration represented by a number of
g’s (a fraction of that acceleration over the gravitational acceleration constant). The gyroscopes
have measurements in degrees per second. The team is looking for the range of measurement
greater than or equal to the range of movement of a human head. Humans rarely experiences
forces greater than 6.7 g’s10
, so the product would not need to detect accelerations greater than
this. The team measured the average rotational speed of the human head to be 253.3 degrees per
second and the maximum rotational speed of 842.1 degrees per second. (See Appendix A) Since
the user of the helmet is not likely to use the helmet near the maximum rotational speed, this
limits the amount of rotation the gyroscope needs to detect.
Power [5] (current consumption) – This refers to the power consumption of the circuits. Since this
project is tethered to a power supply (not battery powered), the team was not concerned with
specifically low power applications. However, power consumption is still taken into account in
order to be good stewards of electricity as well as for heat considerations.
Datasheet [6] – This criterion refers to how understandable the datasheets are. Datasheets that
have complete electrical and physical specifications would help the team design other parts of the
project, such as power requirements for example. Also, the team prefers datasheets that contain
detailed information on interaction with the devices. The team considers language and format
when reading datasheets. Usually devices from the same manufacturer follow the same format on
datasheets. The process of communicating with the device will be similar for both which will cut
down design time.
4.1.1.5.3 Design Selection
The team chose to work with accelerometers and gyroscopes that were available as breakout boards. If the
team would choose sensors without breakout boards, the team would have to pay for the sensors to be
surface mounted to a custom board and wait for the process to be completed by an outsourced company.
Sunstone charges $28 for a 1” x 1” board. The board can be completed in 3 – 5 days if it is expedited, but
this would increase the board cost. The design time for the PCB would also be lost time that could be
used to work on other portions of the project. Sensors that are available as breakout boards help speed up
the development and keep cost down. The team found a variety of sensors from the company SparkFun11
.
For the high volume production, parts will be ordered from Digikey12
.
At first, team member Arnold Aquino decided to work with analog interface sensors because of his
background with analog devices and experience using analog accelerometers. However, after consulting
professors and the team’s industrial consultant, the team decided that using digital sensors is the more
logical choice since the data has to be converted to digital data for the software. This speeds up the team’s
development by removing an unnecessary element from the system.
As mentioned in the previous section, collecting information on all three axes is preferred. It is also
possible to use three different one-axis chips. However, this would add to the complexity of the system
because it would require more clocks and interfaces involved in the data acquisition unit.

Team 3 Sim Escape Page 16 of 62
12 December 2011 Project Proposal and Feasibility Study
4.1.1.5.3.1 Accelerometers
The following table shows the decision matrix for the accelerometers available based on the design
criteria mentioned in the previous section.
Table 5. Accelerometer Decision Matrix
Alternative Unit
Cost
Breakout
Board Cost
Interface Range Bandwidth Power
Consumption
Datasheets Total
Criteria Weight 7 9 7 8 6 5 6
Analog Devices
ADXL335 Score 90 90 60 40 60 80 80 500
Weighted 630 810 420 320 360 400 480 3420
Analog Devices
ADXL345 Score 20 85 100 90 100 100 60 555
Weighted 140 765 700 720 600 500 360 3785
Bosch
BMA180 Score 80 70 100 100 95 50 90 585
Weighted 560 630 700 800 570 250 540 4050
STMicroelectronics
LIS331HH Score 75 85 100 70 90 90 100 610
Weighted 525 765 700 560 540 450 600 4140
Freescale Semiconductor
MMA7361L Score 100 100 60 50 50 60 90 510
Weighted 700 900 420 400 300 300 540 3560
VTI Technologies
SCA3000-D01
Score 10 40 80 40 20 70 70 330
Weighted 70 360 560 320 120 350 420 2200
The STMicroelectronics LIS331HH scored the best in terms of the design criteria. Even though there was
a small margin between the LIS331HH and the Bosch BMA180, the LIS331HH was compatible with an
available gyroscope. The compatibility with the manufacturer’s devices meant that a single design for
communication is possible. The interface and addressing for a Bosch accelerometer is not similar to any
of the gyroscope alternatives.
4.1.1.5.3.2 Gyroscopes
The team found three 3-axis gyroscopes. They also found 2-axis and single axis gyroscopes. The lowest
cost for a dual axis gyroscope breakout board was $29.95. The lowest cost for a single axis gyroscope
breakout board was $19.95. Purchasing these two breakout boards would be $0.05 cheaper than the 3-axis
gyroscope breakout boards. However, as previously mentioned in the number of axis criteria in section
4.1.1.5.2 Implementation Criteria, a single 3-axis device is preferred because of the singular point of
reference for measurement. Also, the team only needs a single communication design if they use a 3-axis
device. The table on the following page shows the decision matrix for the gyroscopes based on the design
criteria mentioned in the previous section.
Team 3 Sim Escape Page 17 of 62
12 December 2011 Project Proposal and Feasibility Study
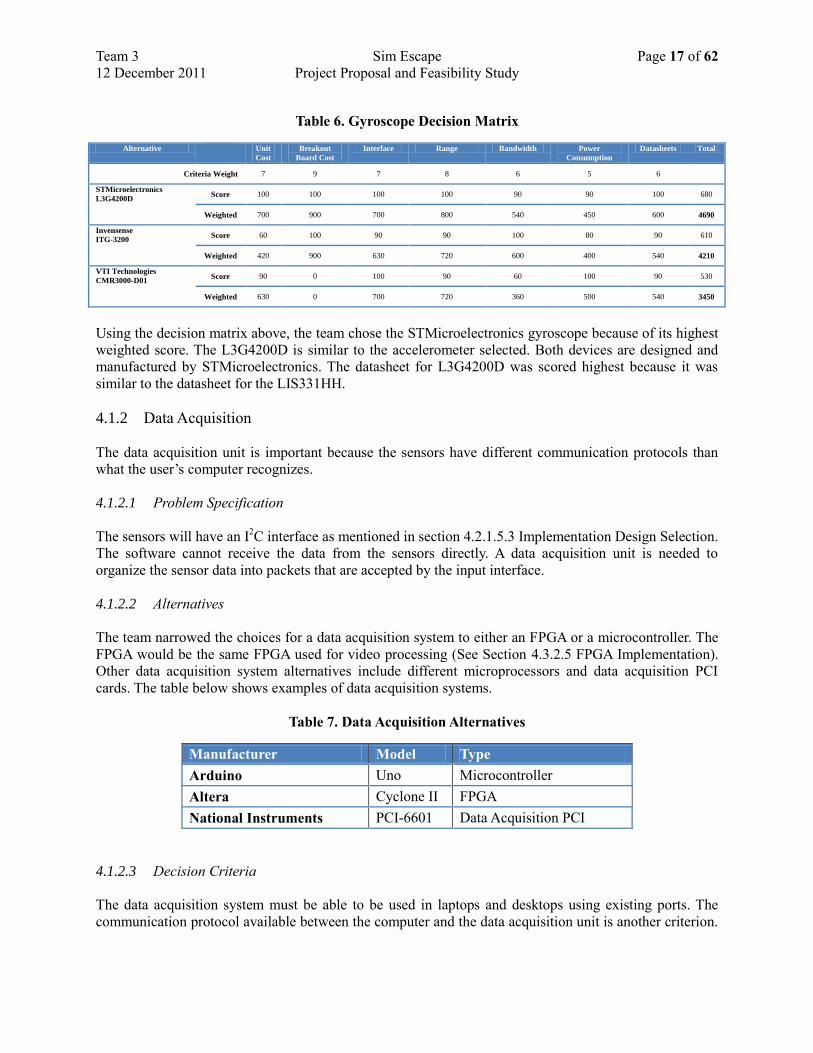
Table 6. Gyroscope Decision Matrix
Alternative Unit
Cost
Breakout
Board Cost
Interface Range Bandwidth Power
Consumption
Datasheets Total
Criteria Weight 7 9 7 8 6 5 6
STMicroelectronics
L3G4200D Score 100 100 100 100 90 90 100 680
Weighted 700 900 700 800 540 450 600 4690
Invensense
ITG-3200 Score 60 100 90 90 100 80 90 610
Weighted 420 900 630 720 600 400 540 4210
VTI Technologies
CMR3000-D01 Score 90 0 100 90 60 100 90 530
Weighted 630 0 700 720 360 500 540 3450
Using the decision matrix above, the team chose the STMicroelectronics gyroscope because of its highest
weighted score. The L3G4200D is similar to the accelerometer selected. Both devices are designed and
manufactured by STMicroelectronics. The datasheet for L3G4200D was scored highest because it was
similar to the datasheet for the LIS331HH.
4.1.2 Data Acquisition
The data acquisition unit is important because the sensors have different communication protocols than
what the user’s computer recognizes.
4.1.2.1 Problem Specification
The sensors will have an I2C interface as mentioned in section 4.2.1.5.3 Implementation Design Selection.
The software cannot receive the data from the sensors directly. A data acquisition unit is needed to
organize the sensor data into packets that are accepted by the input interface.
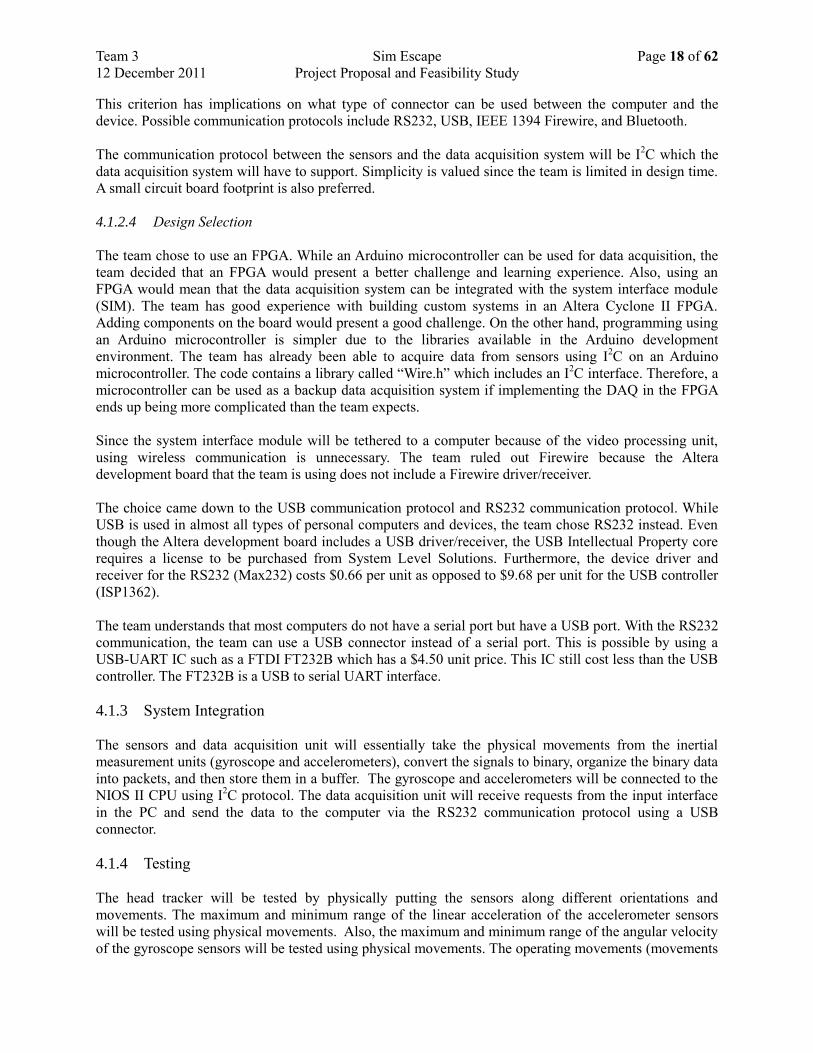
4.1.2.2 Alternatives
The team narrowed the choices for a data acquisition system to either an FPGA or a microcontroller. The
FPGA would be the same FPGA used for video processing (See Section 4.3.2.5 FPGA Implementation).
Other data acquisition system alternatives include different microprocessors and data acquisition PCI
cards. The table below shows examples of data acquisition systems.
Table 7. Data Acquisition Alternatives
Manufacturer Model Type
Arduino Uno Microcontroller
Altera Cyclone II FPGA
National Instruments PCI-6601 Data Acquisition PCI
4.1.2.3 Decision Criteria
The data acquisition system must be able to be used in laptops and desktops using existing ports. The
communication protocol available between the computer and the data acquisition unit is another criterion.
Team 3 Sim Escape Page 18 of 62
12 December 2011 Project Proposal and Feasibility Study
This criterion has implications on what type of connector can be used between the computer and the
device. Possible communication protocols include RS232, USB, IEEE 1394 Firewire, and Bluetooth.
The communication protocol between the sensors and the data acquisition system will be I2C which the
data acquisition system will have to support. Simplicity is valued since the team is limited in design time.
A small circuit board footprint is also preferred.
4.1.2.4 Design Selection
The team chose to use an FPGA. While an Arduino microcontroller can be used for data acquisition, the
team decided that an FPGA would present a better challenge and learning experience. Also, using an
FPGA would mean that the data acquisition system can be integrated with the system interface module
(SIM). The team has good experience with building custom systems in an Altera Cyclone II FPGA.
Adding components on the board would present a good challenge. On the other hand, programming using
an Arduino microcontroller is simpler due to the libraries available in the Arduino development
environment. The team has already been able to acquire data from sensors using I2C on an Arduino
microcontroller. The code contains a library called “Wire.h” which includes an I2C interface. Therefore, a
microcontroller can be used as a backup data acquisition system if implementing the DAQ in the FPGA
ends up being more complicated than the team expects.
Since the system interface module will be tethered to a computer because of the video processing unit,
using wireless communication is unnecessary. The team ruled out Firewire because the Altera
development board that the team is using does not include a Firewire driver/receiver.
The choice came down to the USB communication protocol and RS232 communication protocol. While
USB is used in almost all types of personal computers and devices, the team chose RS232 instead. Even
though the Altera development board includes a USB driver/receiver, the USB Intellectual Property core
requires a license to be purchased from System Level Solutions. Furthermore, the device driver and
receiver for the RS232 (Max232) costs $0.66 per unit as opposed to $9.68 per unit for the USB controller
(ISP1362).
The team understands that most computers do not have a serial port but have a USB port. With the RS232
communication, the team can use a USB connector instead of a serial port. This is possible by using a
USB-UART IC such as a FTDI FT232B which has a $4.50 unit price. This IC still cost less than the USB
controller. The FT232B is a USB to serial UART interface.
4.1.3 System Integration
The sensors and data acquisition unit will essentially take the physical movements from the inertial
measurement units (gyroscope and accelerometers), convert the signals to binary, organize the binary data
into packets, and then store them in a buffer. The gyroscope and accelerometers will be connected to the
NIOS II CPU using I2C protocol. The data acquisition unit will receive requests from the input interface
in the PC and send the data to the computer via the RS232 communication protocol using a USB
connector.
4.1.4 Testing
The head tracker will be tested by physically putting the sensors along different orientations and
movements. The maximum and minimum range of the linear acceleration of the accelerometer sensors
will be tested using physical movements. Also, the maximum and minimum range of the angular velocity
of the gyroscope sensors will be tested using physical movements. The operating movements (movements

Team 3 Sim Escape Page 19 of 62
12 December 2011 Project Proposal and Feasibility Study
of the human head) will also be tested for accuracy and precision. One important element of the devices
that should be tested and accounted for is the linearity of the data. The effect of the acceleration due to
gravity should also be accounted for.
4.2 Software
The architecture of the PC portion of the project is mainly broken into 3 subsystems: the input interface
software, the input mapping software, and the virtual environment software. Each of these systems must
work together to give a consistent flow of data from the user to the CPU and back to the user. This data
flow can be seen in Figure 5 below.
User Windows PC
OUTPUT VIDEO
Input Mapping
Software
Virtual
Environment
SimulatorInput Interface
Operating
System
(Microsoft
Windows)
ACTUAL
MOUSE
INTEGER DATA STREAM
MOUSE EMULATION
Win32 API
Win32 API MOUSE INPUT
USB SERIALTV-VIDEO NTSC
SUMMED
MOUSE
POSITION
Win32 API
640x480 GRAPHICSSERIAL DATA STREAM
+
USB
MOTION TRACKING DATA
Figure 5. Software Architecture Block Diagram
The CPU must run all three of these systems at the same time to give an accurate simulation, but must
also be able to run them separately for more functionality. If the 3D simulation helmet is used for non-
simulation applications such as video games, the user may want to disable the motion tracking in order to
get stereoscopic vision while using a traditional controller. Conversely, if the user needs to calibrate the
motion tracker with the pointer, they may want to turn off the stereoscopic aspect in order to better see the
2D desktop for alignment.
The input interface is an interface for acquiring the data that is collected in the data acquisition (DAQ)
portion of the system interface module (SIM). The SIM will be collecting and formatting the data from
the motion tracker and storing the data to its memory. The input interface will request data from the SIM
as to the position of the user’s head. The interface will interpret the data from the SIM and then give that
interpreted information to the input mapping software.
The input mapping software is used to take data regarding the position of the user’s head and to translate
that data into a format the environment software can understand. The base case for mapping is simple
pitch and yaw to vertical and horizontal mouse movements, respectively.
The virtual environment software includes both an intuitive graphical interface for designing a virtual
environment as well as a physics engine for realistic simulation. The simulation aspect is then controlled
by using the emulated mouse cursor movements to look around in 360 degrees. The inclusion of roll will
also allow for tilting of the head. The environment software continuously updates the view of the virtual
environment and outputs in a video data format to the video processing part of the SIM.
Team 3 Sim Escape Page 20 of 62
12 December 2011 Project Proposal and Feasibility Study
The main design decisions pertaining to the software were what should be written and what needed to be
acquired. This acquisition then broke down into what needed to be bought and what open-source
software could be utilized. Creating all three sections from scratch would have been a project beyond the
scope and aim of this project. It is beyond the aim because this would be more in the computer science
realm and beyond the scope because it would take significant time and effort to create. The virtual
environment software alone requires a graphical user interface (GUI) for designing virtual environments,
a rendering engine for creating the graphics, and a physics engine for allowing simulation. This would
take estimated 10,000-50,000 lines of code to implement and several months of man-hours to code.13
This does not count research and learning curve for these different applications of code. Therefore,
identifying which parts of the project could be bought or open-sourced successfully was the first key
design decision for the software. If the decision was made to write the code, then the following design
decisions were about what format that writing would be in and how we would implement the function of
that software. If it was decided that we would buy or utilize open-source, then the following design
decisions were about which software would be the best fit for the role for the cost. This method of design
steps can be applied to each of the three major portions of the software application.
4.2.1 Input Interface
The input interface includes the sending of requests to the SIM, the receiving of data packets from the
SIM, the interpretation of the data packets, and the sending of that data to the input mapping software.
The team will define a custom transfer protocol used to send and receive data to and from the SIM. The
sending of data to the input mapping software will involve passing the data internal to the personal
computer.
4.2.1.1 Problem Specification
The team could not acquire input interface software because it is specific to the hardware chosen in the
DAQ as well as the software to which it would pass the interpreted data. For this reason, the problem
became how we would implement this software rather than if we could acquire it.
4.2.1.2 Alternatives
The alternatives for this code are broken down into the programming language and the development
environment. The options identified for programming language are C, C++, and python. The possible
development environments are Eclipse and National Instruments’ LabWindows/CVI. The National
Instruments (NI) software development environment would be for developing C code and Eclipse would
be used for C++ or python code.
4.2.1.3 Decision Criteria
Criteria for the input interface have not yet been defined. No sufficient design decisions have been made
about the input interface. This is due to the dependency of the input interface function on the inputs that
have not yet been defined completely.
4.2.1.4 Design Selection
A design selection cannot be made until the criteria are better defined. We know that all of the members
have course work experience with C++. Additionally, Dan Bosscher has experience with Python, and
Walter Schnoor has some experience with the NI LabWindows/CVI tool. Walter also added that the NI

Team 3 Sim Escape Page 21 of 62
12 December 2011 Project Proposal and Feasibility Study
tool has some applicable libraries for RS232 communication. From this information, the team is has the
most confidence in the NI tool, but more information is needed before a design selection can be made.
4.2.1.5 System Integration
In order to integrate the input interface software, the inputs and outputs must be made to connect to the
software or hardware on either side of it. In the input interface software, the input is received data
packets from the SIM and this input will need to be interpreted and organized within the input interface.
The outputs of the program are requests for data to the SIM and organized and interpreted data to the
input mapping software. The interactions between the SIM and the input interface will occur via the
RS232 to USB interface. The software will also have to be integrated with the other software to make a
cohesive package by being included in the same installer and being able to be run with the other
components in a simple user interface
4.2.1.6 Testing
For this software, the testing plan will be formulated more as the definition of the software becomes more
defined. A preliminary breakdown shows that the functions for receiving and transmitting data will need
to be checked for consistency and also for accurate transmission. Also, the interpretation software must
be checked for accurate decoding through the range of values that may be output from the SIM.
4.2.2 Input Mapping
The input mapping software includes the receiving of organized and accelerometer data from the input
interface, comparing that data to previous data for changes in direction, and outputting that data in a way
that can be read by the virtual environment program. The received data will be organized into integers for
offset from the calibrated origin for pitch, yaw, and roll from the gyroscope circuit and x, y, and z
coordinates from the accelerometer circuit.
4.2.2.1 Problem Specification
The input mapping software could be designed by the team, bought, or utilized from available open
source code.
4.2.2.2 Alternatives
Creating software for the function of input mapping would involve having an in-depth knowledge of the
hardware level of the system in which the program was running. Emulating the hardware, on the other
hand, can be done using basic hardware inputs that most computers already have. This gives the program
more flexibility in order to perform on various platforms. Writing a hardware emulator was decided to be
beyond the scope of the project, so the team decided to utilize open source software for this piece of
software.
4.2.2.3 Decision Criteria
The criteria that were applied to the input mapping software decisions were derived from the
requirements. The software would need to fit the necessary functionality; however, it was simply cost
driven decision. This cost, however, also included any Intellectual Property (IP) rights and restrictions
that had to be addressed for distribution. The user friendliness criterion was not applied to the input
mapping software because it will be running underneath the user’s perception. It will only be accessible
as an advanced configuration function, but not a necessary user function to be interacted with directly.

Team 3 Sim Escape Page 22 of 62
12 December 2011 Project Proposal and Feasibility Study
4.2.2.4 Design Selection
The input mapping system that was chosen was the GlovePIE hardware emulation software. Several
other input mapping programs were found, but they all simply mapped the keyboard input to a mouse
input rather than giving a programming interface in which the developer chooses how to map inputs.
These other software packages failed to meet the design requirements and for this reason were not even
candidates for this software application. The setup of the GlovePIE program is still mainly that of a
developer’s tool to create executable files that will map actual inputs to virtual outputs. The only
drawback that the team encountered in this software was that it cannot be used in baseball simulations
because it has an exclusive deal with a baseball simulation company. Baseball simulation was not a part
of the team’s initial target market, however, and for that reason this restriction was found to be an
acceptable concession.
4.2.2.5 System Integration
For the input mapping software, the input is going to be pitch, yaw, and roll data from the input interface,
probably in an integer offset from a zero position. The output is a mouse type coordinate system with a
possible roll variable and will need to be emulated in order for the virtual environment software to take it
as an input. The software will also have to be integrated with the other software to make a cohesive
package by being included in the same installer and being able to be run with the other components in a
simple user interface.
4.2.2.6 Testing
For this software, the functions for computing the change in input direction will need to be checked
through the range of possible head motions. The proposed head motion is to have full range of 360
degrees in yaw, 90 degrees in both directions of pitch, and 45 degrees of roll. This test would include
checking for the data points at the extremes of the pitch and roll and the halfway points between them. It
will also test for the points around the circle of yaw every 45 degrees. This will be tested by rotating the
sensors to the desired position and comparing the values displayed in the program. Also, the sensitivity of
the output to input values will need to be checked for response time and jitter. These, however, are full
system tests and are included in section 6.
4.2.3 Virtual Environment Development and Simulation
The virtual environment software includes a graphical user interface and a physics engine. The graphical
user interface (GUI) is used for creating a virtual environment. A physics engine is used to simulate an
avatar for the user in the virtual environment. The physics engine is also used to output the user’s view in
the environment in a way that can be displayed in stereoscopic 3D. The physics engine should also
receive input that will move the user’s view, similar to mouse inputs.
4.2.3.1 Problem Specification
The creation of virtual environment creator and simulator would have been a massive project and would
have been well beyond the scope of our project. That is why it was decided that this portion of the design
needed to be bought or found in the form of open-source software. This created the new design decision
of which of the many available virtual environment development kits should be used.

Team 3 Sim Escape Page 23 of 62
12 December 2011 Project Proposal and Feasibility Study
4.2.3.2 Alternatives
The programs that were compared as possible candidates were the Steam Source Software Developer’s
Kit (SDK), the OGRE 3D Engine, the Cafu Engine, the Blender 3D Studio, the Panda3D Game Engine,
the Unity 3 Engine, the Truevision3D SDK, and the DX Studio 3D Engine.
4.2.3.3 Decision Criteria
The criteria that were applied to the virtual environment software decisions were derived from the
requirements. The software would need to fit the necessary functionality, which includes having
rendering and shading capability for designing a visually feasible virtual environment, having a physics
engine for simulating in a world with realistic responses, and having a simple graphical user interface so
that someone without programming knowledge can create a virtual environment. The virtual environment
development and simulation software also needed to be user friendly in running the simulation because
the user would be interacting with the program directly.
Rendering [7] – Rendering refers to the ability to use the computer’s resources in order to create a
realistic looking virtual world.
Ease of Use [9] – This refers to how intuitive the developer user interface is for creating virtual
environments. The learning curve required to proficiently use the software is included in the
criterion.
Physics Engine [8] – This refers to the functionality and realism of the physics representations in
the simulation. A score of zero indicates a program without a physics engine.
Cost [6] – This refers to the cost of a development license for the software as well as the cost of
implementing the software in a product.
4.2.3.4 Design Selection
The following table shows the decision matrix for the virtual environment software available based on the
design criteria mentioned in the previous section.
Table 8 Virtual Environment Software Decision Matrix
Rendering Ease of Use Physics Engine Cost Total
Weight 7 9 8 6 30
Development Kit
Steam Source 5 1 7 6 19
OGRE 3D Engine 7 5 0 6 18
Cafu Engine 6 8 0 6 20
Blender 3D Suite 7 4 7 6 24
Panda3D Engine 6 2 5 6 19
Unity 3 Engine 6 3 6 6 21
Truevision3D SDK 5 7 4 1 17
DX Studio 3D Engine 6 8 7 4 25
The initial hope was to use the Steam Source SDK (Software Developer’s Kit) because Dan Bosscher and
Dan Ziegler both had access to the software and it was used to develop a few games they were familiar
with. Upon working with the system further, it was found to be more programming language based than
initially considered and would be much less user friendly in the environment creation stages. The
software also came with re-distribution restrictions that would have made it impossible for the project to
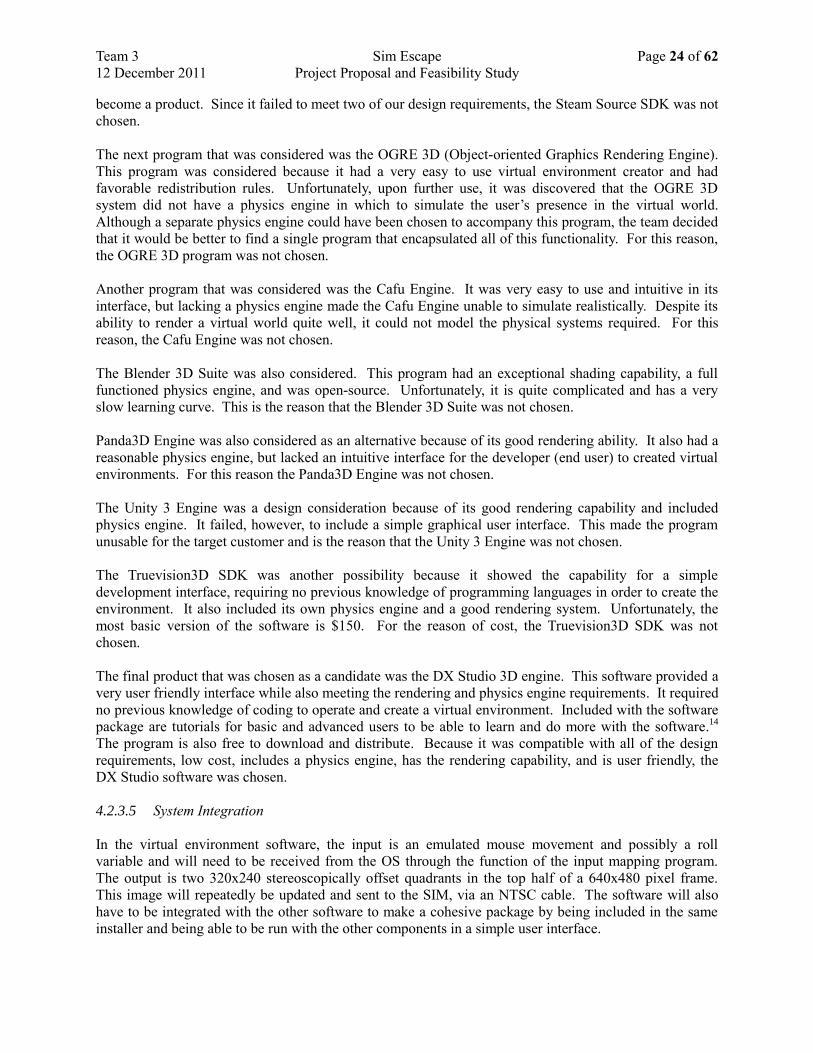
Team 3 Sim Escape Page 24 of 62
12 December 2011 Project Proposal and Feasibility Study
become a product. Since it failed to meet two of our design requirements, the Steam Source SDK was not
chosen.
The next program that was considered was the OGRE 3D (Object-oriented Graphics Rendering Engine).
This program was considered because it had a very easy to use virtual environment creator and had
favorable redistribution rules. Unfortunately, upon further use, it was discovered that the OGRE 3D
system did not have a physics engine in which to simulate the user’s presence in the virtual world.
Although a separate physics engine could have been chosen to accompany this program, the team decided
that it would be better to find a single program that encapsulated all of this functionality. For this reason,
the OGRE 3D program was not chosen.
Another program that was considered was the Cafu Engine. It was very easy to use and intuitive in its
interface, but lacking a physics engine made the Cafu Engine unable to simulate realistically. Despite its
ability to render a virtual world quite well, it could not model the physical systems required. For this
reason, the Cafu Engine was not chosen.
The Blender 3D Suite was also considered. This program had an exceptional shading capability, a full
functioned physics engine, and was open-source. Unfortunately, it is quite complicated and has a very
slow learning curve. This is the reason that the Blender 3D Suite was not chosen.
Panda3D Engine was also considered as an alternative because of its good rendering ability. It also had a
reasonable physics engine, but lacked an intuitive interface for the developer (end user) to created virtual
environments. For this reason the Panda3D Engine was not chosen.
The Unity 3 Engine was a design consideration because of its good rendering capability and included
physics engine. It failed, however, to include a simple graphical user interface. This made the program
unusable for the target customer and is the reason that the Unity 3 Engine was not chosen.
The Truevision3D SDK was another possibility because it showed the capability for a simple
development interface, requiring no previous knowledge of programming languages in order to create the
environment. It also included its own physics engine and a good rendering system. Unfortunately, the
most basic version of the software is $150. For the reason of cost, the Truevision3D SDK was not
chosen.
The final product that was chosen as a candidate was the DX Studio 3D engine. This software provided a
very user friendly interface while also meeting the rendering and physics engine requirements. It required
no previous knowledge of coding to operate and create a virtual environment. Included with the software
package are tutorials for basic and advanced users to be able to learn and do more with the software.14
The program is also free to download and distribute. Because it was compatible with all of the design
requirements, low cost, includes a physics engine, has the rendering capability, and is user friendly, the
DX Studio software was chosen.
4.2.3.5 System Integration
In the virtual environment software, the input is an emulated mouse movement and possibly a roll
variable and will need to be received from the OS through the function of the input mapping program.
The output is two 320x240 stereoscopically offset quadrants in the top half of a 640x480 pixel frame.
This image will repeatedly be updated and sent to the SIM, via an NTSC cable. The software will also
have to be integrated with the other software to make a cohesive package by being included in the same
installer and being able to be run with the other components in a simple user interface.
Team 3 Sim Escape Page 25 of 62
12 December 2011 Project Proposal and Feasibility Study
4.2.3.6 Testing
For this software, the tests will consist of qualitatively evaluating the inputs from the input mapping by
looking for lag and error in the simulation portion.
4.3 Display System
The display system will consist of an input decoder, a processing platform, video frame buffers, two LCD
screens, and a set of optics. The design decisions and alternatives for each of these systems are itemized
below. A block diagram of the proposed display system can be seen below in Figure 6.
ALTERA CYCLONE II FPGA
HARDWARE VIDEO PROCESSING MODULES
PIXEL BUFFER A
512MB SRAM8-Bit 3 Plane 320x240
PIXEL BUFFER B
512MB SRAM8-Bit 3 Plane 320x240
VIDEO DECODERTV-VIDEO NTSC
VIDEO
PROCESSING
MODULES
TV INPUT
MODULE
RIGHT LCD24-Bit Color
320x240
LEFT LCD24-Bit Color
320x240
DIGITAL VIDEO 8-BIT
AVALON-ST
DMA MODULE
AVALON-ST
XY BITSTREAM
CLOCKED VIDEO
OUT - LEFT
CLOCKED VIDEO
OUT - RIGHT
AVALON-ST
VIDEO
24-Bit
VIDEO
24-Bit
Figure 6. Display System Block Diagram
4.3.1 3D Display Method
The method of 3D video display determines the output format from the PC, the image processing method
in the FPGA, and the format of the display. This design decision is an architectural decision as well as an
implementation decision.
4.3.1.1 Problem Specification
The proposed project involves simulating a 3D environment for a user. To accomplish this, it is vital to
have an understanding of how people perceive depth. Depth perception is possible because of the offset
between two eyes. Each eye receives the image from a slightly different angle than that of the other eye
due to the offset between them. When the human mind receives these two images, it calculates the offset
and allows the images to be interpreted as a single image. The differences in the images get interpreted as
depth. This is why when a person closes an eye, they will lose depth perception. The mind doesn't have a
comparison image that it can use to give any meaningful sense of depth.
Based on the principle that differences between the images in each eye become interpreted as depth, one
can simulate a 3D environment if each eye is receiving a different image. This is known as stereoscopic
3D.

Team 3 Sim Escape Page 26 of 62
12 December 2011 Project Proposal and Feasibility Study
4.3.1.2 Alternatives
The alternative methods of stereoscopic 3D are side-by-side multiplexing, time-based multiplexing, and
dual video inputs. Each of these implementations involves a specific hardware setup.
4.3.1.2.1 Side-by-Side Multiplexing
Side-by-side multiplexing involves two output screens, one for each eye. This method takes one input
frame from the graphics card of the personal computer and splits it down the middle. The left side of the
frame is displayed on the left display and the right side of the frame is displayed on the right display.15
4.3.1.2.2 Time-Based Multiplexing
The time-based multiplexing method involves only one display screen. This method takes two video
inputs and combines them by filling successive frames with alternating right and left images. The screen
then outputs these successive right and left frames. The user sees the images in 3D because they are
refreshed above the persistence of vision.16
4.3.1.2.3 Dual Video Inputs
The dual video input method involves two display screens. The method takes two completely separate
outputs from two graphics cards on the personal computer and sends them directly to the two displays.17
4.3.1.3 Design Criteria
The main criteria for choosing a 3D display method are hardware cost, frame rate, and pixel density. The
hardware cost criterion is based on graphics card requirements and necessary display elements and do not
include processing. This is because it is assumed that video processing can be implemented for equal cost
in the system interface module. The frame rate is based on how fast the system can output the data to the
displays. The pixel density is based on the resolution and picture quality of the display.
4.3.1.4 Design Selection
The team chose side-by-side multiplexing for the 3D display method. The team chose this method
because the hardware cost only includes two display screens and because the required frame rate could be
achieved. The tradeoff was that the pixel density would have to be decreased to fit the data for two
displays in one frame. This was accepted because the small display size counteracts the loss of frame
resolution.
The method of dual inputs was eliminated from the design options because it required two graphics cards
in order to output the necessary data. Most personal computers do not include two graphics cards. The
cost of adding a second graphics card to the design would be roughly $250.18
The method of time-based multiplexing was eliminated because of frame rate issues. Our system has a
requirement of 30Hz frame rate in order to give enough time for software processing while still staying
above persistence of vision. If time-based multiplexing were implemented, it would bring the effective
frame rate of each of the two displays down to 15Hz. This would induce flicker because the 15Hz is
below the persistence of vision.

Team 3 Sim Escape Page 27 of 62
12 December 2011 Project Proposal and Feasibility Study
4.3.2 Video Processing Platform
The video processing platform will accept the side-by-side 3D input video stream from the PC software.
It must generate the left and right output video streams. The processor will generate the output by
cropping the left and right streams from the input and routing them to the left and right LCDs,
respectively.
4.3.2.1 Problem Specification
The central component in the display system is the video processor. The display system requires a video
processing subsystem to correctly configure and interpret the input video signal, separate that input video
signal into the left and right signals, control the frame buffers for the LCD outputs, and drive the LCDs.
4.3.2.2 Alternatives
The selected alternatives for video processing can be seen in Table 9. Software processing via a RISC
processor, dedicated digital signal processing, and hardware video processing were considered to solve
the video processing problem. Another alternative not considered was a graphics processing unit (GPU).
Table 9. Video Processing Alternatives
Alternative Example Execution Method Cost
RISC Processor TI ARM AM1705 Process video in software $10 - $15
Video DSP TI TMS320C647x Process video via digital signal
processor
$180 - $300
Hardware
Architecture
Altera Cyclone II
FPGA
Hardware video processing $100 - $200
4.3.2.2.1 RISC Processor
A reduced instruction set computer (RISC) processor would solve the video processing problem through
software. An instruction routine would have to be designed that would accept incoming digitized video
data from the input decoder (see section 4.3.3 Video Input Format), and separate the video streams to
drive the outputs. The Texas Instruments ARM AM1705 contains built-in external memory interfaces for
controlling video buffers. The TI ARM AM1705 also contains built-in serial peripheral interfaces. These
interfaces could allow the processor to serve double-duty, and provide data acquisition functionality for
the head tracker in addition to video processing. The processor supports Windows Embedded CE, Linux,
and Android operating systems, among others. The TI ARM AM1705 is capable of operating at
temperatures between 0 and 90 degrees Celsius. It is available in a low profile quad flat package (LQFP),
or a ball grid array (BGA).
4.3.2.2.2 Video DSP
A video digital signal processor (DSP) would solve the video processing problem through a dedicated
signal processor. The Texas Instruments TMS320C647x digital signal processor would fit this need.
Similar to the RISC processor, the DSP would be instruction-based; however it would be optimized for
video and would contain several parallel execution cores. An example block diagram for this DSP can be
seen in
Team 3 Sim Escape Page 28 of 62
12 December 2011 Project Proposal and Feasibility Study
Appendix B - Texas Instruments TMS320C647x Block Diagram.
This approach would simplify the video processing design, as there would not need to be a video
processing signal flow designed on a FPGA. However, digital signal processors are expensive, and do not
offer the flexibility of being repurposed and reprogrammed. If a DSP was used for video processing, it
would necessitate the use of a small microcontroller for the head tracking data acquisition component.
This approach of using separate components for the head tracking data acquisition and display system
video processing would require more power and introduce more complexity to the video processor.
The TI TMS320C647x would operate between 0 and 100 degrees Celsius, and is available in BGA
packages.
4.3.2.2.3 Hardware Architecture
A hardware architecture would consist of a logic design, for either an application-specific integrated
circuit (ASIC) or a field programmable gate array (FPGA). Programmable logic designs are very
flexible, as they can be programmed for a variety of tasks. There is a variety of intellectual property logic
“cores” available to logic designers.19
These cores include microprocessors, memory controllers, IO
controllers, video processing, and image processing. A custom logic design for an ASIC or FPGA would
require higher initial engineering effort, but would yield fewer required parts, if multiple pieces of
functionality can be combined onto one chip. FPGA design would be considered for manufacturing
volumes under 10,000 units, and ASIC design would be considered for volumes over 10,000. This is due
to the high development cost of an ASIC.20
The Altera Cyclone II FPGA is constructed on a 90-nm process and is designed for high-volume cost-
sensitive applications. The Altera design suite features a large intellectual property catalog that would be
sufficient for the video processing problem. In addition to being highly customizable in the design phase,
a FPGA would offer the ability for a product to be re-programmed after deployment. This would allow
for updates to customer hardware via a simple re-program. Altera’s benchmarks show their FPGA
solutions to have on average 10 times the DSP processing power per dollar than the industry’s standard
digital signal processors.
4.3.2.3 Decision Criteria
The decision criteria used in selecting a video processing platform were dictated by more than just the
display system. The system interface module (SIM) which will house the video processing hardware will
also house the data acquisition hardware. Therefore, if a solution for the video processing problem exists
that can also solve the data acquisition problem without degrading the performance of either, it would be
logical to select that solution.
For the system design to be aligned with the design norm of stewardship, the component should have low
power consumption.
The solution to be selected is required to operate at room temperatures (~27 degrees Celsius). If a device
has operational capability at temperatures outside of 0 to 40 degrees Celsius, this capability will not give
that solution any more weight, as the product is not intended to be used outside of this temperature range.
The platform shall also be selected based on the configuration complexity. The system should be
complex enough to allow for a learning experience and a highly configurable and custom design, but it
shall not be so complex that the team will not be able to configure the platform in the time frame given
for the project.

Team 3 Sim Escape Page 29 of 62
12 December 2011 Project Proposal and Feasibility Study
A platform should be selected that is readily available for a production volume of 10,000 units per year.
Video processing performance should be considered one of the most important factors in the selection of a
solution. The video processor at a minimum must be able to process the video resolutions specified by
the input and output formats (sections 4.3.3 and Error! Reference source not found., respectively).
ore video processing capabilities that are available on the solution and more customizable and scalable
features means better solution for the long-term viability of the hardware design.
4.3.2.4 Design Selection
The heart of the 3D simulation helmet is the system interface module. An FPGA was selected as the
solution to the video processor problem because of the programming flexibility it offers. An FPGA
device can be configured to represent a wide range of digital systems including video processing
components and soft-core processors. This allows for the consolidation of our systems onto one chip,
decreasing system complexity and increasing the adaptability of the system post-PCB construction.
The FPGA platform has several technical and financial drawbacks. First, FPGAs are expensive even in
bulk when compared with RISC processors. They can cost an order of magnitude more. In addition to
the hardware cost, there is a generally a more advanced design cost as well. However, FPGAs offer
significant DSP processing power even in low-complexity models. Also, they offer excellent video
processing performance and customization. FPGA packages from Altera and Xilinx (the two primary
competitors in the FPGA market) offer powerful video and image processing cores that can easily be
implemented. Video processing capability was the design criteria with the highest importance.
The 10-fold increase in hardware cost over a RISC processor solution can be justified by the ease of
design. A RISC processor would appear to be the preferred option as they are available at a lower cost
than an FPGA. However, there would be a significant engineering expense in developing a software
solution for the video processing problem. The FPGA manufacturers offer video processing “cores” than
can be implemented very cost effectively.
There is no hardware cost benefit to utilizing a DSP over an FPGA, as DSP components are priced
similarly to the FPGAs that would be considered for this design. Also, if a DSP was utilized for video, a
separate microprocessor would be required for the data processing function (this is not the case with
FPGA solutions, as a soft-core processor can be included in the design.) Also, while a RISC processor
solution would have the capability of performing video processing and data acquisition duties, it is likely
that the performance of each system would suffer in this scenario, as the processor instructions would be
divided between the video processing task and the data acquisition task. In an FPGA solution, the
hardware can contain a dedicated processor and dedicated video streaming system that would not interfere
with each other.
In terms of hardware complexity, a DSP IC can be obtained as a surface mount part (SMT), the FPGA
will require ball grid array (BGA) mounting. This mounting would need to be performed by an outside
company. Power consumption is also a drawback. On average, FPGA implementations will draw 7 times
as much dynamic power than a similar integrated circuit implemented as an ASIC.21
4.3.2.5 FPGA Implementation
The FPGA will implement the video processing functionality through direct hardware. In addition, it will
contain a soft-core processor to provide the data acquisition capability (See Section 4.1.2 Data
Acquisition).

Team 3 Sim Escape Page 30 of 62
12 December 2011 Project Proposal and Feasibility Study
4.3.2.5.1.1 FPGA Implementation Alternatives
Solution alternatives to the FPGA Implementation problem can be seen in Table 10. Candidates from
Altera Corporation and Xilinx Incorporated were considered. Altera and Xilinx represent over 80 percent
of the FPGA market, and were considered first. Manufacturers not included in this study due to their
more specialized applications (military or other) are Achronix, Actel, Lattice Semiconductor, and
SiliconBlue Technologies.
The prices listed in Table 10 are rough estimates that include shipping. The cost is for 1 unit (Suppliers
were not found to offer economies of scale for FPGA devices). The FPGA alternatives were considered
as families; no specific product is being identified here. The selection of the final FPGA will be left to the
spring semester of the course. It does not make sense at this time to select a specific product, as the
requirements of the product may change at the micro level. The goal of this selection is to compare
manufacturers and families of FPGAs and select the best product family for the design.
Table 10. FPGA Alternatives
Family Manufacturer Cost Support & Experience
Spartan-Series Xilinx $40-$200 None, no dev. kits
Cyclone-Series Altera $80-$250 High, have dev. kits
Arria-Series Altera $200+ Medium, no dev. kits
Virtex-Series Xilinx $400+ None, no dev. kits
Stratix-Series Altera $300+ Medium, no dev. kits
4.3.2.5.1.2 Spartan Series
The Spartan series of FPGAs produced by Xilinx Incorporated is a small to medium density FPGA
package. They are available with up to 150,000 logic cells, and 180 DSP slices. Xilinx supports and
provides video input and video adjustment cores for the Spartan. The Spartan is available in several
different trims and packages, depending on the required size, application, and budget.
4.3.2.5.1.3 Cyclone Series
The Cyclone series of FPGAs is produced by Altera Corporation. The Cyclone series was created by
Altera to address high volume cost sensitive situations. There are several iterations of the Cyclone,
ranging from Cyclone I through Cyclone V. Each new version implemented higher capacity with
decreased power consumption. Altera offers a Video and Image Processing library for working with
video signals. Cyclone IV FPGAs will support up to 150,000 logic elements and approximately 600 pins.
4.3.2.5.1.4 Arria Series
The Arria series of FPGAs is also produced by Altera Corporation, and is a step-up in their lineup from
the Cyclone family in terms of capability and cost. According to Altera, the Arria series is designed to
balance a medium-level cost and power with performance. The Arria series can support up to 250,000
logic elements, and up to approximately 600 pins.
4.3.2.5.1.5 Virtex Series
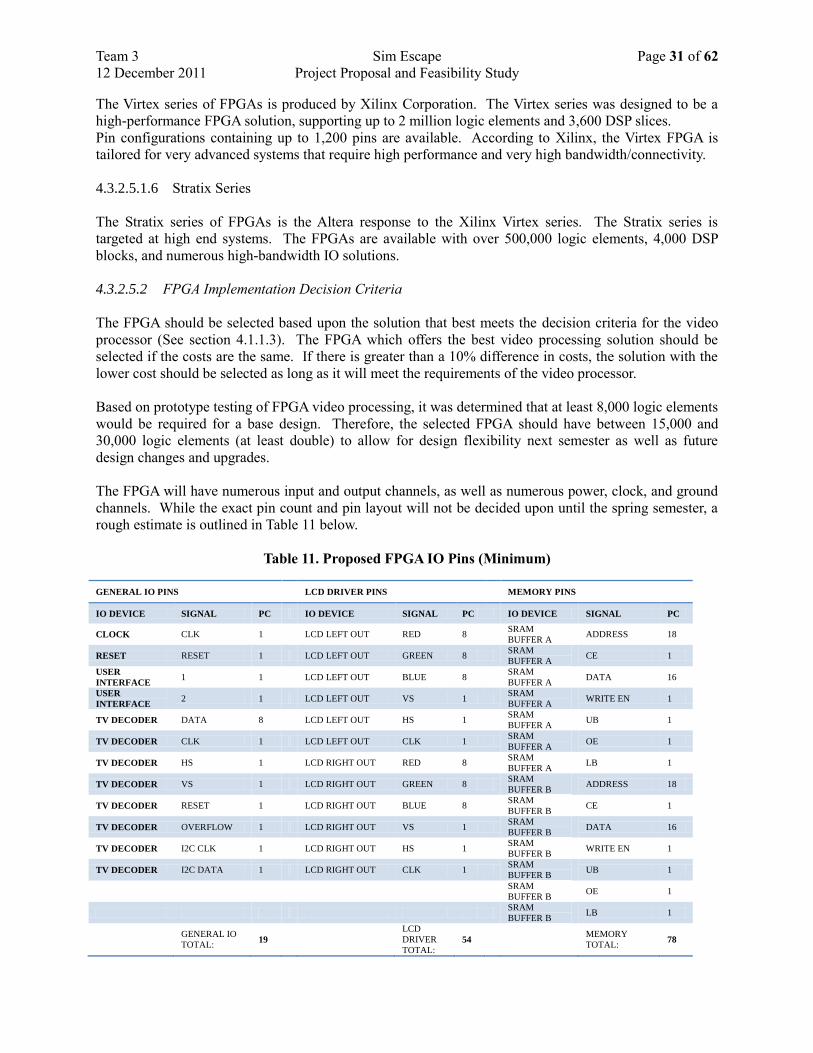
Team 3 Sim Escape Page 31 of 62
12 December 2011 Project Proposal and Feasibility Study
The Virtex series of FPGAs is produced by Xilinx Corporation. The Virtex series was designed to be a
high-performance FPGA solution, supporting up to 2 million logic elements and 3,600 DSP slices.
Pin configurations containing up to 1,200 pins are available. According to Xilinx, the Virtex FPGA is
tailored for very advanced systems that require high performance and very high bandwidth/connectivity.
4.3.2.5.1.6 Stratix Series
The Stratix series of FPGAs is the Altera response to the Xilinx Virtex series. The Stratix series is
targeted at high end systems. The FPGAs are available with over 500,000 logic elements, 4,000 DSP
blocks, and numerous high-bandwidth IO solutions.
4.3.2.5.2 FPGA Implementation Decision Criteria
The FPGA should be selected based upon the solution that best meets the decision criteria for the video
processor (See section 4.1.1.3). The FPGA which offers the best video processing solution should be
selected if the costs are the same. If there is greater than a 10% difference in costs, the solution with the
lower cost should be selected as long as it will meet the requirements of the video processor.
Based on prototype testing of FPGA video processing, it was determined that at least 8,000 logic elements
would be required for a base design. Therefore, the selected FPGA should have between 15,000 and
30,000 logic elements (at least double) to allow for design flexibility next semester as well as future
design changes and upgrades.
The FPGA will have numerous input and output channels, as well as numerous power, clock, and ground
channels. While the exact pin count and pin layout will not be decided upon until the spring semester, a
rough estimate is outlined in Table 11 below.
Table 11. Proposed FPGA IO Pins (Minimum)
GENERAL IO PINS
LCD DRIVER PINS
MEMORY PINS
IO DEVICE SIGNAL PC IO DEVICE SIGNAL PC IO DEVICE SIGNAL PC
CLOCK CLK 1 LCD LEFT OUT RED 8 SRAM
BUFFER A ADDRESS 18
RESET RESET 1 LCD LEFT OUT GREEN 8 SRAM
BUFFER A CE 1
USER
INTERFACE 1 1 LCD LEFT OUT BLUE 8
SRAM
BUFFER A DATA 16
USER
INTERFACE 2 1 LCD LEFT OUT VS 1
SRAM
BUFFER A WRITE EN 1
TV DECODER DATA 8 LCD LEFT OUT HS 1 SRAM
BUFFER A UB 1
TV DECODER CLK 1 LCD LEFT OUT CLK 1 SRAM
BUFFER A OE 1
TV DECODER HS 1 LCD RIGHT OUT RED 8 SRAM
BUFFER A LB 1
TV DECODER VS 1 LCD RIGHT OUT GREEN 8 SRAM
BUFFER B ADDRESS 18
TV DECODER RESET 1 LCD RIGHT OUT BLUE 8 SRAM
BUFFER B CE 1
TV DECODER OVERFLOW 1 LCD RIGHT OUT VS 1 SRAM
BUFFER B DATA 16
TV DECODER I2C CLK 1 LCD RIGHT OUT HS 1 SRAM
BUFFER B WRITE EN 1
TV DECODER I2C DATA 1 LCD RIGHT OUT CLK 1 SRAM
BUFFER B UB 1
SRAM
BUFFER B OE 1
SRAM
BUFFER B LB 1
GENERAL IO
TOTAL: 19
LCD
DRIVER
TOTAL:
54 MEMORY
TOTAL: 78

Team 3 Sim Escape Page 32 of 62
12 December 2011 Project Proposal and Feasibility Study
TOTAL IO PIN
COUNT: 151
4.3.2.5.3 FPGA Implementation Design Selection
An Altera Cyclone FPGA platform will be used for the video processor. Based upon the requirements
laid out in the decision criteria, a Cyclone part would be more than sufficient for the design in terms of IO
capability, video processing capability, and cost. Arria and Stratix family parts are simply not required for
the level of processing done in this project, and would carry a significant cost with them. The same is
true of the Xilinx Virtex family. The cost and capabilities associated with this product are far beyond the
required scope.
A Cyclone series part will be identified in the spring semester that meets the requirements of the final
design. The part will be selected based upon pin requirements, logic element requirements, memory cell
requirements, and phase lock loop (PLL) requirements. Large scale production availability will also be
considered, as the team does not wish to select a part that is being phased out or will increase in cost
significantly over time.
4.3.2.6 System Integration
The Altera Cyclone Series FPGA will function as the primary component in the video processor and the
data acquisition system. The video processor will execute the video manipulation functions in hardware
on the FPGA. The FPGA will also contain the hardware to drive the video buffer memories. The head
tracker will utilize a NIOS II soft-core processor on the FPGA to capture the current sensor status and
communicate with the computer. The details regarding the head tracker data acquisition can be found in
section 4.1.
4.3.2.7 Testing
The video processor will be tested for functionality through visual testing. It will be tested across a
variety of sources to determine if the video processor will accurately reproduce the input images on the
LCD screens. Table 12 outlines preliminary tests. The video processor will be tested for its functionality
while integrated into the rest of the display system, as it is dependent on the other display system
elements to operate.
Table 12. Video Processor Test Matrix
Test Independent Test
Variables
Dependent Test
Variables
Criterion for Success
Video Quadrant Stream
Split
Input resolution, input
device, input over scan,
input under scan, input
color format
Splitter accuracy- Did
the video processor
accurately split the
input side-by-side 3D
image to two screens?
Video output is clipped
at exactly the upper left
and right quadrants
along the vertical 320
pixel mark and the
horizontal 240 pixel
mark.
Clocked Video Output
Configuration
Accuracy and Sync
Input resolution, input
device, input over scan,
input under scan, input
color format
LCD output accuracy -
Do the two LCD
screens clock video
accurately in all
situations?
Video updates evenly
between the two screens;
i.e. one display does not
lag the other.

Team 3 Sim Escape Page 33 of 62
12 December 2011 Project Proposal and Feasibility Study
Color Representation Input resolution, input
device, input over scan,
input under scan, input
color format
LCD color accuracy –
Does the LCD
replicate the colors of
the input accurately?
The output video colors
are color-matched to the
test input pattern.
Stress Testing Time Does the video
processor accurately
drive the outputs for
long durations of
operation without
error?
The video processor will
successfully drive the
LCD for a 48 hour
period. Success is
defined as meeting all of
the above 3 criterion.
Environment Testing Ambient Temperature
and Humidity
Video Processor tests
being passed, device
temperature, device
integrity
Success is defined as all
of the video processor
system tests passing for
a period of exposure to
45 degrees Fahrenheit
for 30 minutes
Loose Cable Testing Cable Jiggles What is the effect of
connecting and
disconnecting the
input cable and/or
power cable?
The video processor will
re-sync with the video
input after being
disconnected and
reconnected. If power is
disconnected, the device
will power on reset and
resume normal
operation.
4.3.3 Video Input Format
The personal computer will be generating the 3D environment video graphics through the virtual
environment software (See Section 4.2 Software). The computer will have a graphics output that will
drive the display system. Several alternatives exist for computer graphics outputs. These options will be
analyzed and the optimum alternative will be selected for the project.
4.3.3.1 Problem Specification
The input video stream will be the start of the dataflow into the display system. An input format for this
stream needed to be selected. The input format determines the type of video decoder needed in the
display system, as well as the type of video output the personal computer must support. It also sets the
upper limit on the quality of the output video, as the output quality cannot be better than the input quality.
The input decoder will output a digital signal to be routed into the hardware video processor discussed
above in section 0.

Team 3 Sim Escape Page 34 of 62
12 December 2011 Project Proposal and Feasibility Study
4.3.3.2 Alternatives
Table 13. Video Input Format Alternatives
Alternative Data Format Color Planes Implementation
Complexity
Widespread/
Conventional?
Cost
TV-Video Analog 1 or 2 (C, Y/C) Low Yes $3 - $15
VGA Analog 3 (RGB) Medium Yes $100 -
$150
Component Analog 3 (YCbCr) Low No $10-$50
DVI Digital 3 High No $200
HDMI Digital 3 + Audio High Yes $300
4.3.3.2.1 TV-Video
TV-Video is the analog television broadcast standard. TV-Video generally comes in two flavors: NTSC
(National Television System Committee), and PAL (Phase Alternating Line). NTSC is the North
American television broadcast standard, and PAL is the European standard. NTSC TV-Video is
composed of interlaced frames at 29.97 frames per second, and is commonly known as standard definition
in format-speak. TV-Video encodes color data as analog data based on luminance and chrominance.
Luminance carries brightness information, and chrominance carries color. Both are carried via amplitude
modulation. TV-Video requires as little as a signal line and a ground line for transmission (composite
video), but it can also include two signal lines, one for chroma and one for luma (Y/C, or S-video).
TV-Video decoders extract the video as data and stream it over a data bus digitally. Analog Devices
Incorporated, NXP Semiconductor, Texas Instruments, and ST Microelectronics make these decoders.
They are available for as little as $3.
TV-Video has a low implementation complexity, a low cost, acceptable quality, and is somewhat
widespread among personal computers.
4.3.3.2.2 VGA
VGA stands for Video Graphics Array, and has been the primary display interface in personal computers
for over a decade. The VGA signal consists of red, green, and blue color channels, a vertical sync, and a
horizontal sync. VGA maintains high quality graphics for an analog medium; although the signal will
degrade with length (VGA cable runs should not exceed 50 feet without an amplifier). The format is
capable of carrying a variety of resolutions and refresh rates.
If VGA was selected as an input format, a VGA decoder would have to be designed. This would require
the use of a high-speed analog to digital converter for each color plane: red, green, and blue. It would
also require two high-speed comparators for vertical sync and horizontal sync. This kind of high-speed
ADC would be expensive, on the order of $35.00 each. This would drive the cost of the VGA decoder
alone to over $100.00.
VGA has a higher implementation complexity, a medium cost, a high quality, and is very widespread
among personal computers.

Team 3 Sim Escape Page 35 of 62
12 December 2011 Project Proposal and Feasibility Study
4.3.3.2.3 Component Video
Analog component video is similar to composite TV-video, with the exception that instead of combining
all of the color information on one signal line, the red, green, and blue color planes are extracted and
transmitted on separate cables (usually RCA cables.) Analog component video is common among DVD
players and modern televisions. Component video has the capacity to transmit HD video at 720p.
Component video has a low implementation complexity, a low cost, and a high quality, but is not found in
personal computers.
4.3.3.2.4 DVI
DVI, or Digital Video Interface, can be thought of as a digital transmission of the data found in a VGA
cable. DVI operates by transmitting multiple parallel serial signals. Also like VGA, DVI supports a wide
variety of resolutions. DVI is popular on performance personal computers and performance monitors.
Unlike TV-Video and VGA, if a personal computer is not equipped with a DVI port, the hardware to
convert its output to DVI would be quite expensive (in the $100+ range.)
DVI has a high implementation complexity, a high cost, the highest display quality, and is standard
amongst performance computers, and not found amongst consumer/personal computers.
4.3.3.2.5 HDMI
HDMI, or High Definition Multimedia Interconnect, follows the same protocol as DVI. The difference
between HDMI and DVI is that HDMI is intended for the home theater market. It includes the capability
of transmitting digital audio along with video. HDMI is common on HDTVs and BluRay players.
Although it was created for home theater, an increasing number of personal computers are being released
with HDMI interfaces.
DVI has a high implementation complexity, high cost, the highest display quality. It is rapidly becoming
more included in personal computers and laptops.
4.3.3.3 Decision Criteria
The decision criteria for the input video format include price, performance, and complexity, and
availability/acceptance.
The video input format should be cost-effective. The cost of the video input format includes the price of
the video decoder and its associated hardware.
In order to appeal to customers, the input format must be popular among consumer electronic devices,
personal computers, and laptops. If the input format is not widespread, then it should be simple to
convert from the computer’s format to the input format (via the use of a common video port adapter, such
as DVI to VGA or VGA to S-Video.)
If there are multiple solutions that are both readily available, mainstream, and price competitive, the
solution with the simplest implementation will be selected, as it will reduce PCB complexity for both
design and manufacturing.
Team 3 Sim Escape Page 36 of 62
12 December 2011 Project Proposal and Feasibility Study
4.3.3.4 Design Selection
TV-Video was selected as the video input format. TV-Video is extremely cost effective, as the input
decoder can be implemented with one integrated circuit that costs less than $20. This cost is far less than
that of a VGA decoder, which is over $100. Component video could be cost effective, but component
video is not a mainstream computer graphics output.
TV-Video produces the required display performance for this project. The team tested TV-Video
decoders on development boards, and successfully processed the input video. TV-Video has a simple
implementation. It requires only one data bus from the decoder to the video processor, as the image is
Luma/Chroma formatted- this is less than one third that of VGA. VGA would require three data busses
and two sync signals.
HDMI and DVI were eliminated due to cost. Interfacing hardware that cost greater than $200 would be
beyond the scope and budget of the product, as the market strategy for this product is to undercut the
competitors. If HDMI input hardware was cheaper, it would be the logical format, as HDMI is an all-
digital format that will not lose quality over transmission.
VGA (Computer graphics) was chosen as a secondary candidate because it is the most popular connector
for the intended devices. In addition, it has full color and sync signal separation, and is extremely flexible
with operating resolutions and refresh rates. VGA could be implemented for a reasonable price.
4.3.3.5 System Integration
The TV-Video input connector will be an RCA connector. This connector will be driven by the personal
computer running the virtual environment. This connector will link to a TV-Video decoder, which will
generate an 8-bit data bus, horizontal sync, vertical sync, and clock signal to send to the video processor.
4.3.3.5.1 Color Format
Just as the input video format determines the input video decoder, it also determines the initial color
format. TV-Video decoders pass digital video as 422-Chroma subsampling. 422 chroma sampling uses a
larger resolution for luma data than for chroma data, as the human eye is more sensitive to luminance.22
This 422-Chroma stream must be converted to RGB data to drive digital LCDs (this is a requirement for
small digital LCDs). The video can then be processed and buffered in different color resolutions. The
size of video data can be thought of as existing in three dimensions. There are the X and Y factors (the
pixel width and pixel height), and the resolution of the data at each pixel specified by X and Y (the Z
value). An increase in the size of the color resolution will increase the size of the video processor
components in a linear fashion.23
The color resolutions considered for this design were 16-bit RGB and 24-bit RGB. 32-bit RGB was not
considered, as few small LCDs support this color accuracy. 8-bit RGB was not considered because it
only offers 256 possible colors, and this would not provide the necessary fidelity. A visual example of the
difference between 16-bit and 24-bit RGB can be seen in Figure 7 on the following page.

Team 3 Sim Escape Page 37 of 62
12 December 2011 Project Proposal and Feasibility Study
Figure 7. 16-Bit and 24-Bit RGB Color Resolutions
4.3.3.5.1.1 16 Bit RGB
16-bit color is a concise color format that utilizes 5 red bits, 6 green bits, and 5 blue bits. The color green
is allocated one more bit than the red and blue because the human eye is more sensitive to green.
The 16-bit data block that will be used for each pixel will be mapped in memory either consecutively or
via X-Y coordinates. The data in the block can be seen in Table 14. The color format specified here is
commonly referred to as 16 bits per color and one color plane. 16-Bit RGB is advantageous because of
its small size per frame. However, color bands may appear blocky in 16-bit because of the small
resolution.
Table 14. 16-Bit Color Format
15 14 13 12 11 10 9 8 7 6 5 4 3 2 1 0
R R R R R G G G G G G B B B B B
4.3.3.5.1.2 24 Bit RGB
24-bit color, or “true color,” is a widely accepted standard for high color resolution graphics. It consists
of 8 bits each for red, green and blue. 24-bit color takes up a larger amount of space, whether it is
buffered in memory or moving around a bus. However, it is considered to be the resolution beyond which
the human eye cannot further differentiate between colors.
4.3.3.5.2 Color Format Selection
The team has done extensive testing of 16-bit and 24-bit color transmission. Operating at 24-bit color
increases the required size to buffer a frame 1.5 times. FPGA logic elements required for the video

Team 3 Sim Escape Page 38 of 62
12 December 2011 Project Proposal and Feasibility Study
processing cores also increases. However, the color format delivers a higher quality image at a very small
price (buffer sizes can be increased at a very low cost, and FPGA resources are also inexpensive).
Therefore, 24-bit color will be utilized in the display system.
4.3.3.6 Testing
The video input format will be tested for its functionality while integrated into the system, as it is
dependent on the other display system elements to operate. The testing for the video input format also
includes the supporting hardware that accompanies this format (TV Decoder). The test matrix can be
seen in Table 15.
Table 15. Input Format Test Matrix
Test Independent Test
Variables
Dependent
Test Variables
Criterion for Success
Video Input Frame
Perimeter
Input colors and
brightness
Video output
frame
The video input decoder did not
overscan or underscan the input video.
Video Input Refresh Motion sequences Video output The video input decoder refreshes
accurately and does not lag the input by
more than one frame (the buffer will
insert a one frame delay)
Environment
Testing
Ambient
Temperature and
Humidity
Video
Processor tests
being passed,
device
temperature,
device integrity
Success is defined as all of the video
processor system tests passing for a
period of exposure to 45 degrees
Fahrenheit for 30 minutes
Loose Cable Testing Cable Jiggles What is the
effect of
connecting and
disconnecting
the input cable
and/or power
cable?
The video processor will re-sync with
the video input after being disconnected
and reconnected. If power is
disconnected, the device will power on
reset and resume normal operation.
4.3.4 Video Buffers
In order to drive the two LCD display drivers, the system interface module will contain two video frame
buffers. Two buffers will be utilized, one for each output display, so that each streaming video path in the
Video Processor can be accessed by its own direct memory access (DMA) controller.
4.3.4.1 Problem Specification
There are several memory types available for use as frame buffers. SRAM, SSRAM, SDRAM, and
FPGA on-chip memory are the primary alternatives. The video processor clips the left and right upper
quadrants of the total input frame (640 pixels wide by 480 pixels tall). The two output frames will be 320
pixels wide by 240 pixels wide.

Team 3 Sim Escape Page 39 of 62
12 December 2011 Project Proposal and Feasibility Study
4.3.4.2 Alternatives
Table 16. Frame Buffer Alternatives
Alternative Access Speed Complex Price Available Size Power
Consumption
Example
SRAM 10ns – 45ns Low $1.00 -
$6.00
4kB – 64MB Low, higher
dynamic
ISSI
IS42S324
00E
SSRAM 3ns – 15ns, use
20ns
Low $6.00 -
$12.00
2MB – 64MB Low, higher
dynamic
ISSI
IS61C256
AL
SDRAM 6ns-10ns, use
20ns
High $3.00 -
$15.00
16MB – 1GB High ISSI
IS612LPS
FPGA On-
Chip RAM
20ns Low Included
in FPGA
1k – 16k Low, higher
dynamic
Cyclone
Memory
Cell
4.3.4.2.1 SRAM
Static random access memory modules allow for quick asynchronous access times and general simplicity.
They are also the cheapest form of memory. They carry the drawback of being generally limited in
capacity. Static memory cells retain their latched values as long as the module is powered, and do not
require any refreshing. They have very low power usage unless they are being frequently switched.
4.3.4.2.2 SSRAM
Synchronous static random access memory modules allow for fast memory access times (less than 10 ns).
This ability comes from their synchronous nature, as the outputs are clocked-in registers. They are
generally limited in capacity to below 64MB. They have very low power usage unless they are being
frequently switched.
4.3.4.2.3 SDRAM
Synchronous dynamic random access memory modules offer large memory sizes at a low cost. They
carry the drawback of requiring a dynamic refresh. The ISSI (Integrated Silicon Solution, Inc.) SDRAM
module analyzed above requires a refresh 4000 times every 64ms. This refresh causes SDRAM modules
to draw higher static power than SRAM modules.
4.3.4.2.4 FPGA On-Chip RAM
Altera and Xilinx FPGA modules offer on-chip random access memory and read-only memory. These
components can be mapped to soft-core processors or used for other purposes. While they are extremely
convenient because they do not require any support hardware outside of the FPGA, they are almost
always limited to low sizes (less than 32k) in small FPGAs.
4.3.4.3 Decision Criteria
The first criterion in buffer memory selection is buffer size. The memory alternative must support the
required size. The buffer must be large enough to completely buffer one frame of video. The output
Team 3 Sim Escape Page 40 of 62
12 December 2011 Project Proposal and Feasibility Study
resolution for a given individual output feed is 320 pixels wide by 240 pixels tall. At a color depth of 24
bits, the required size per frame can be calculated as follows.
𝐵𝑈𝐹𝐹𝑆𝐼𝑍𝐸𝑚𝑖𝑛 = 𝑝𝑖𝑥𝑒𝑙𝑟𝑜𝑤𝑠 ∗ 𝑝𝑖𝑥𝑒𝑙𝑐𝑜𝑙𝑢𝑚𝑛𝑠 ∗ 𝑏𝑖𝑡𝑠 𝑝𝑒𝑟 𝑝𝑖𝑥𝑒𝑙 = 240 ∗ 320 ∗ 24 = 1843200 bits = 230.4 kB
The memory technology selected should have a response time that is sufficient for the bandwidth
required. If one frame consumes 230.4 kB, and the video is set at a refresh rate of 29.97 Hz (NTSC given
standard), the required data bandwidth can be calculated as seen below.
𝐵𝑈𝐹𝐹𝐵𝐴𝑁𝐷𝑊𝐼𝐷𝑇𝐻 = 𝐵𝑈𝐹𝐹𝑆𝐼𝑍𝐸𝑚𝑖𝑛 ∗ 𝑃𝐼𝑋𝐸𝐿𝐶𝐿𝑂𝐶𝐾 = 1843200 ∗ 29.97 = 55240704 = 56𝑀𝑏𝑝𝑠
While it is a lesser concern than buffer size and bandwidth, a memory technology with lower power
consumption should be considered. As one of the design norms of this project is stewardship, lowering
the power consumption of the device is not only better for the user in terms of operating cost, but
environmentally responsible as well.
All other characteristics being equal, the memory selected should be as cost effective and as simple as
possible.
4.3.4.4 Design Selection
Static random access memory (SRAM) was selected as the memory of choice for the video frame buffers.
In the sizes that are required, a simple SRAM IC will be more cost effective in terms of price and
footprint than either synchronous static random access memory (SSRAM) or synchronous dynamic
random access memory (SDRAM). SRAM would not be clock-synched, whereas SSRAM latches the
memory data flow to a clock edge. This functionality is not required for a video frame buffer, and as such
would only include added cost and complexity.
The control complexity surrounding SDRAM and the associated speed loss that comes with that
complexity makes SDRAM unattractive. Also, the higher power demands of SDRAM (compared with
SRAM or SSRAM), eliminated SDRAM from being a viable alternative for the frame buffer memory.
It should also be noted that all of the memory systems supported the bandwidth requirement. All memory
technologies had refresh rates below 20ns, the system clock period. Therefore, if a 16-bit data field is
assumed, a DMA module could access data at 800Mbps if it read a memory value every clock tick.
4.3.4.5 System Integration
The pixel buffer memory is part of the display system. The memory modules will be situated close to the
FPGA on the SIM printed circuit board so as to eliminate any possible trace capacitances or clock skew.
The memory modules will be linked to the video processor through a direct memory access (DMA)
module.
4.3.4.6 Testing
The video buffer memory will be tested as an integrated component of the display system. The memory
will be directly mapped to the video processing cores on the FPGA and will not be accessed by software.
Therefore, the testing will be concurrent with the video processor testing. The test matrix for the video
buffer memory can be seen in Table 17.

Team 3 Sim Escape Page 41 of 62
12 December 2011 Project Proposal and Feasibility Study
Table 17. Video Buffer Memory Test Matrix
Test Independent Test
Variables
Dependent
Test Variables
Criterion for Success
Video Input Frame
Perimeter
Input colors and
brightness
Video output
frame
The video input decoder did not
overscan or underscan the input video.
Stress Testing Time Does the buffer
SRAM operate
without issue
over time?
The buffer SRAM will successfully
interface with the video processor for a
48 hour period. Success is declared if
the video processor passes all of its
system tests.
Environment
Testing
Ambient
Temperature and
Humidity
Video
Processor tests
being passed,
device
temperature,
device integrity
Success is defined as all of the video
processor system tests passing for a
period of exposure to 45 degrees
Fahrenheit for 30 minutes
Loose Cable Testing Cable Jiggles What is the
effect of
connecting and
disconnecting
the input cable
and/or power
cable?
The buffer SRAM will reset on a power
loss, and will immediately regain
functionality upon power-up.
4.3.5 Video Output Format (to the LCDs)
The output video will drive the LCDs from the FPGA. The LCDs will be thin-film-transistor (TFT)
displays with a pixel resolution of 320 pixels tall by 240 pixels wide. This resolution is extremely
common among LCD displays, allowing displays from several manufacturers such as Newhaven Display
International, Toshiba, and Parallax Incorporated to be considered.
4.3.5.1 Problem Specification
The team must select an output format that can interface to a LCD screen over a digital connection. This
output will, by default, need to be able to interface between the selected TFT LCDs and the video
processor.
4.3.5.2 Alternatives
One output display format alternative is an 8-bit wide data bus that will carry all color data. This offers a
low number of required signals, but requires a higher clock rate.
Another output display format alternative is a 24-bit wide data bus that will carry the color data across
three individual 8-bit busses. This allows for a lower clock rate, but increases the number of required
signals threefold over a single 8-bit data bus.
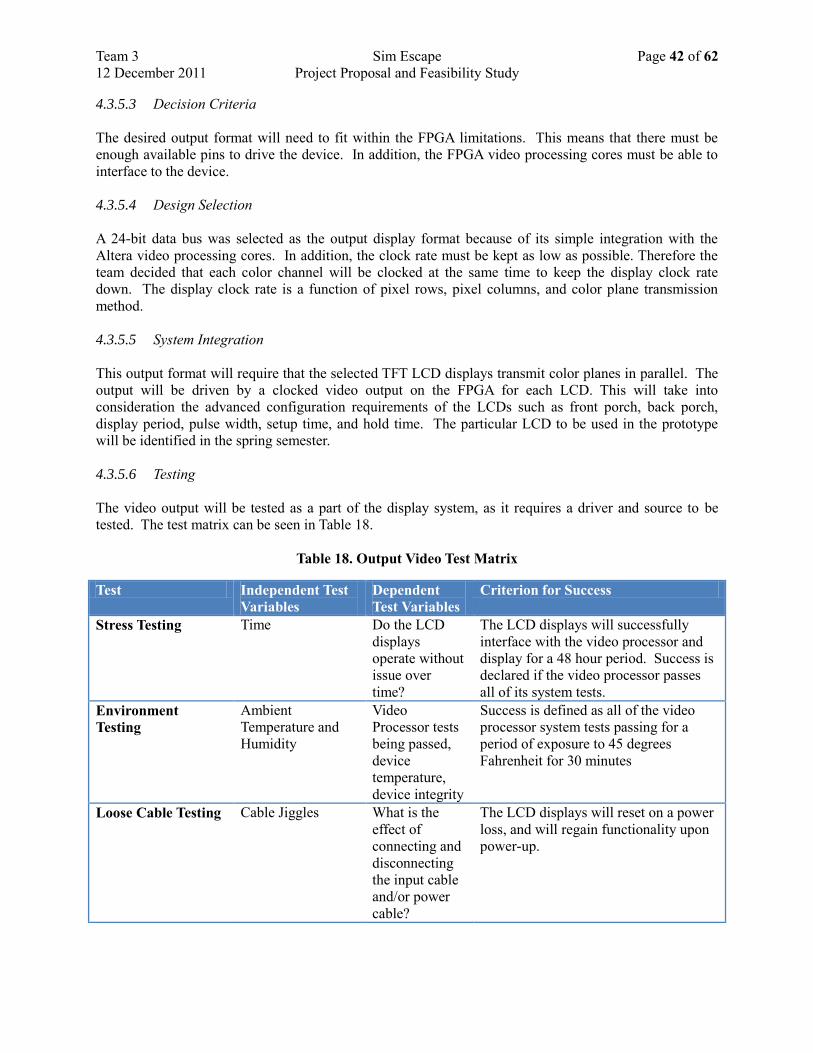
Team 3 Sim Escape Page 42 of 62
12 December 2011 Project Proposal and Feasibility Study
4.3.5.3 Decision Criteria
The desired output format will need to fit within the FPGA limitations. This means that there must be
enough available pins to drive the device. In addition, the FPGA video processing cores must be able to
interface to the device.
4.3.5.4 Design Selection
A 24-bit data bus was selected as the output display format because of its simple integration with the
Altera video processing cores. In addition, the clock rate must be kept as low as possible. Therefore the
team decided that each color channel will be clocked at the same time to keep the display clock rate
down. The display clock rate is a function of pixel rows, pixel columns, and color plane transmission
method.
4.3.5.5 System Integration
This output format will require that the selected TFT LCD displays transmit color planes in parallel. The
output will be driven by a clocked video output on the FPGA for each LCD. This will take into
consideration the advanced configuration requirements of the LCDs such as front porch, back porch,
display period, pulse width, setup time, and hold time. The particular LCD to be used in the prototype
will be identified in the spring semester.
4.3.5.6 Testing
The video output will be tested as a part of the display system, as it requires a driver and source to be
tested. The test matrix can be seen in Table 18.
Table 18. Output Video Test Matrix
Test Independent Test
Variables
Dependent
Test Variables
Criterion for Success
Stress Testing Time Do the LCD
displays
operate without
issue over
time?
The LCD displays will successfully
interface with the video processor and
display for a 48 hour period. Success is
declared if the video processor passes
all of its system tests.
Environment
Testing
Ambient
Temperature and
Humidity
Video
Processor tests
being passed,
device
temperature,
device integrity
Success is defined as all of the video
processor system tests passing for a
period of exposure to 45 degrees
Fahrenheit for 30 minutes
Loose Cable Testing Cable Jiggles What is the
effect of
connecting and
disconnecting
the input cable
and/or power
cable?
The LCD displays will reset on a power
loss, and will regain functionality upon
power-up.
Team 3 Sim Escape Page 43 of 62
12 December 2011 Project Proposal and Feasibility Study
5 Physical System Specifications
The physical design of the headgear will consist of three main parts: the helmet, the System Interconnect
Module (SIM) enclosure, and the wiring connections.
5.1 Helmet
For the prototype, a helmet will be purchased to mount the rest of the system. The specifications for the
helmet are not yet clearly defined. The team will provide weight and LCD mounting structure
specifications when the physical system is designed next spring. The stereoscopic LCD array and the
lenses will be mounted on the visor so that they hang down in front of the user's eyes. On either side of
the helmet, stretching from the front to the LCDs will be a form of light shielding material. This material
will shield against outside light, creating a more immersive experience for the user and making it easier to
focus on the display. The design will also provide a barrier between the two LCDs to increase the visual
isolation of the LCD screens.
For a production design, the helmet would be manufactured to be a single piece, with everything as a part
of the helmet. All electrical components would be encased within the helmet, as would the wiring to the
display. The LCD array and lenses would be mounted on a visor that would come down to the level of the
user's nose. The visor would also wrap around, preventing light from entering the helmet.
5.2 System Interface Module (SIM) Enclosure
The SIM is only significant in the prototype design. The components included in the SIM will be
enclosed inside the unit as part of the production design. The enclosure will contain the majority of the
electrical hardware for our project. This includes the data acquisition and video processing circuits. The
enclosure will sit close to its connection to the PC and will have a long tether connection to the helmet
portion of the design. The enclosure will be made out of plastic and will be a rectangular prism in shape.
It will be as large as is necessary to hold the PCB for the data acquisition and video processing circuits
and the power system.
5.3 Wiring and Interconnection
All of the wiring will be connected to the enclosure. The helmet will be tethered to the SIM by three
cables. The first of these cables would be to power the helmet, while the remaining two would convey
data from the accelerometer and gyroscope sensors continuously. The SIM will be tethered to the PC by
two cables and to a wall outlet with one cable. The cable to the wall outlet will be the power supply for
the unit. The two cables from the SIM to the PC will be one RS232 serial to USB cable for the motion
tracker data and one TV-Video to NTSC cable for sending the virtual world picture to the video
processing unit. Another connection is required to connect the video processing unit to the LCD array. See
section 4.1.4 for more details on the formatting for this connection.
5.4 Optics
Existing products on the marketplace that involve displays at close proximity to the eye utilize lenses to
focus the retina in the user’s eye to the screen.
A concern with the simulation helmet design is that the LCD array will be too close for the human eye to
focus on unaided. The lens of the human eye is a converging lens, allowing images to focus on the retina
so that they can be seen.24
As objects get closer to a converging lens (as the display in our design would),
Team 3 Sim Escape Page 44 of 62
12 December 2011 Project Proposal and Feasibility Study
the resulting image will converge farther from the lens behind the retina. The implication of this is that the
image will appear to be out of focus. In order to fix this, the lens would have to be modified to cause the
image to converge closer to the lens (bringing the image back to the retina). This can be achieved by
adding a convex lens between the eye and the LCD array. The extra lens will cause the image to begin
converging before it hits the eye. This will bring the point of convergence forward, back onto the retina,
resulting in a focused image for objects closer to the eye.
6 System Integration Testing
System testing will cover interconnect testing, latency testing, throughput testing, and any tests that apply
to the system as a whole. The testing will verify that all of the possible inputs are correctly interpreted
and handled by the system. If a user moves his or her head, the video should respond in an appropriate
manner.
6.1 Video Delay Testing
A long delay between motion input and video response can cause motion sickness. We will want to verify
that video responds quickly enough to avoid motion sickness. According to Lag in Multiprocessor Virtual
Reality by Matthias M. Wloka, if lag is greater than 300 milliseconds, users lose the feeling of immersion
because they notice the time difference between their movements and the expected movement.25
We will
need to test on a variety of users to account for variations in sensitivity.
6.2 Motion Sensitivity Testing
We want the video to respond on an appropriate scale to movements. If the system is too sensitive, small
motions will be picked up by the system causing a jittery video. If the system is not sensitive enough,
larger motions would be required to incite a response from the system. Either case would create a
negative user experience. To test for minimum sensitivity, the position of the avatar can be related to the
position of the user. The angular displacement of the avatar’s field of view should be the same as the
angular displacement of the user’s field of view. For example, if the user turns their head 90 degrees to
the right, the avatar should turn 90 degrees to the right.
6.3 Power Consumption Testing
We want to be certain that all components of our product will receive adequate power at all times. We
want to avoid current draw fluctuation that could damage the components of the system, either in over
current or under current situations. To test for these conditions we will use a digital multimeter to
measure the voltage and various test points.
7 Business Plan
7.1 Vision and Mission Statement
SimEscape’s vision is to build its product efficiently and decrease production cost. We want to keep
innovation as one of the driving factors to stay competitive in the market. This means that our engineers
will always be involved in ongoing research and development. The research and development will be
customer-driven and technology-rooted.

Team 3 Sim Escape Page 45 of 62
12 December 2011 Project Proposal and Feasibility Study
SimEscape values trust, integrity, and stewardship. The company wants the customers to trust that the
product can accurately represent a virtual environment. SimEscape also wants to accomplish this by
providing customers with high quality products. The company wants to show integrity by being
responsible for any flaws, which means providing warranty and customer support.
7.2 Industry Profile and Overview
The virtual reality industry has existed since the 1960s, but the greatest amount of development in the
industry has happened in the past 20 years. These developments have increased not only the quality of
virtual reality, but also the unit size. The industry has traditionally defined quality in terms of ergonomics,
field of view, resolution, level of immersion, and functionality. These are the aspects of the product that
the company will have to focus on in order to be competitive in this industry.
7.2.1 Major Customer Groups
The major customer groups for virtual reality HMDs are academic research, military training, emergency
response training, aviation training, architectural and engineering design, medical research and training,
and consumer media. Each of these customer groups presents its own expectations and restrictions. For
this reason, SimEscape must decide which groups to target as customers.
7.2.1.1 Academic Research
Academic research groups would be able to use the product for 3D modeling for applications such as
modeling proteins and molecules. This market does not contain a large number of customers. However,
these customers would be looking for higher quality, and most would have more funding to pay for the
higher quality (although this would vary based on the institution).
7.2.1.2 Military Training
The military would be able to use the product for training simulations. Military groups would have large
funds at their disposal to purchase the product. However, this group would present high demands on
quality, and have more restrictions than other customer groups would. It would be fairly easy to do
business with the US military, but the company might run into regulation issues if it tries to do business
with other countries.
7.2.1.3 Emergency Response Training
Emergency response groups would also use the product for training. These groups would include police,
firefighters, search and rescue, and hazardous materials response teams. There are many customers in this
group, but they would not have significant spending power. These groups are funded by local
governments, and generally have tighter budgets. However, the federal government could provide grants
to these organizations to purchase the product.
7.2.1.4 Aviation Training
Airline companies and the US Air Force would be able to use the product for flight training. Although
there are not that many customers in this category, they would have the resources to purchase a high-end
product. They would also want a faster product with no noticeable lag. Dealings with the USAF would
also mean providing for regulations for military specification.

Team 3 Sim Escape Page 46 of 62
12 December 2011 Project Proposal and Feasibility Study
7.2.1.5 Architectural and Engineering Design
There would be a limited number of architecture and engineering firms that would be able to use the
product for 3D design modeling. This group would be relatively small, and would desire a high precision
product. Also, these companies might not have the funds of other groups, and would most likely not be as
willing to pay a high price for the product.
7.2.1.6 Medical Research and Training
Hospitals would probably be interested in virtual reality for training and for 3D imaging of the body (for
diagnosis and medical examination). They would have mid-range funds, but would need to see a
significant improvement over current imaging techniques in order to make the move to the product. If the
product would be used for viewing images of inside the body the product would have to be very precise in
its measurement of head movements. There would also have to be a high level of display detail. This
market is fairly large, but will not be willing to spend as much.
7.2.1.7 Consumer Media
The product would also be able to be used for consumer media. This is mainly applicable to video games.
Although movies could be viewed on the product, they are more of a social event and hence less of an
application. Video game users would want a low cost product, and the quality would have to be
comparable to a standard display. There are a large number of potential users in this product, but many of
them would not be motivated to buy.
7.2.2 Regulations and Restrictions
For customer groups that would use the product for academic, architectural and engineering design, or
personal entertainment functionality, there are no known regulations for this sort of device. The medical
field has guidelines set up by the World Health Organization (WHO) for getting medical devices onto the
market. In the US these include getting either an approval letter (PMA) or marketing clearance (510K) to
clear the product for the market, as well registration with the medical device establishment. Additionally,
the US military has a number of standards that would apply to virtual reality systems. These include:
MIL-STD-202 regarding test methods for electrical parts, MIL-STD-461 regarding the control of
electromagnetic interference of equipment, MIL-STD-498 regarding software development, MIL-STD-
499 regarding systems engineering, MIL-STD-883 regarding test methods for microelectronics, and MIL-
PRF-38535 regarding integrated circuit manufacturing26
. This is not an exhaustive list of regulations, but
it provides a framework for the type of regulations that will be placed on the product.
7.2.3 Significant Trends
The current virtual reality market is moving away from consumer media and into high end simulation for
design and training. This suggests that, although the consumer media market appears large, the number of
people who would be willing to purchase it for personal use is lower than expected. However, users who
would use the product for high end simulation seem to be willing to pay high prices for similar devices,
so many competing companies are changing their focus to target these customers.
7.2.4 Growth Rate
The virtual reality and simulation market is growing at a significant rate, especially for higher cost
applications. A June 2004 report noted that anti-terrorism spending in this market increased by 75% from

Team 3 Sim Escape Page 47 of 62
12 December 2011 Project Proposal and Feasibility Study
October 2002. 27
This report is a little dated, but more recent reports are showing continued growth in
other areas as well. An article from this February shows that the market for health care applications in the
US between 2006 and 2010 has grown annually by more than 10%. Researchers are expecting even
greater growth in this area through the year 2015.28
Additionally, the oil and gas market for virtual reality
is expected to grow over the next ten years as well.29
7.2.5 Barriers to Entry
There are a number of barriers preventing new companies from entering this market. Since virtual reality
products run on the expensive side, economies of scale are important to lower cost per unit. The high
technology nature of the field increases the amount of design work required for the industry, preventing
new companies from entering. New companies will also be relatively unknown, and would take some
time to gain some credibility among consumers. Finally, there is a large start-up cost that would need to
be overcome to enter the market.
7.2.6 Key Success Factors in Industry
The key to success in the virtual reality industry is the ability to move in to high quality markets. This
means giving up low cost to offer the best available technology. It is understood that virtual reality for
personal use is not currently considered a profitable market, so larger entities such as the military and tech
corporations are targeted as the key to success. These groups will have higher requirements for quality,
but they will also be able to pay for the quality improvements.
7.2.7 Outlook for the Future
As time passes, this industry will offer more opportunities. Cost for parts will decrease, making lower
cost markets more feasible. Additionally, the technology in this field will continue to develop, allowing
customers to update to the most cutting edge systems.
7.3 Business Strategy
The desired image of the company is to create a quality product at a low cost while continuing to
innovate. The company desires to start as a lower cost alternative in the market and steadily increase
quality as market share is gained.
7.3.1 Company Goals and Objectives
The operational goal of the company is to design a product using the latest available technology. The
product should be designed in such a way to balance quality and low cost.
The financial goal of the company is to use the first generation design to make enough profit to repay
startup loan debt as well as reinvest in the company for future growth. The main focus will be to repay
debt in order to lower risk of the LLC’s members in the case of economic instability.
7.3.2 SWOT Analysis
SWOT analysis is an important step in determining how a new company fits into an already defined
market. By assessing the company’s strengths, SimEscape will know what features to focus on
marketing. By assessing its weaknesses, the company will know where not to compete with other
Team 3 Sim Escape Page 48 of 62
12 December 2011 Project Proposal and Feasibility Study
companies. Identifying opportunities defines SimEscape’s potential growth options and identifying
threats helps the company manage and mitigate risk.
7.3.2.1 Strengths
One of the main strengths of the company is that the product will be high quality while maintaining a low
cost. This creates a reputation in the marketplace of a well-engineered product. The product will also be
easy to set up and use, therefore reducing the complexities on the client side. Another strength is that the
company will be small, making it easier to adapt to the changes in the market.
7.3.2.2 Weaknesses
There are several weaknesses that must be addressed in marketing the product. One weakness is the
limited target market. Therefore, the company must aggressively market the product to become well
known and trusted. Another weakness is that the profit margin for the company is low, due to the low
selling cost. To overcome this, the product will continually be updated with low cost components.
7.3.2.3 Opportunities
The main opportunity of the company is growth in the virtual reality market for high end simulation and
training. As the technology becomes widely accepted, the number of companies looking for virtual reality
will increase. To take advantage of this opportunity, the company will aggressively promote the product.
7.3.2.4 Threats
The threat to the company is other similar companies lowering their cost, therefore reducing the profit
margin and forcing the company to sell at a lower cost. Another threat is other startup companies with
similar products. In order to reduce this threat, the company will sell the product as low as possible while
keeping a decent profit margin, therefore reducing the opportunity for other companies.
7.3.3 Competitive Strategy
The company is looking to create its own niche in the market, covering a price range that is not currently
covered by other companies. The main focus is cost leadership for existing quality standards. The
company is not looking to compete with the highest-quality systems already on the market, but is looking
to have comparable quality to mid-range competing products. However, the company is looking to
undercut competitor prices and offer the best value product on the market.
The focus of the company is to target specific markets. Rather than create mainstream products that are
compatible for many applications, SimEscape will design products that are specific for certain simulation
applications.
7.4 Marketing Strategy
The market strategy analyzes the target market, market size, market trends, advertising, and price. A brief
description of the customer motivation to purchase the product is included. Distribution strategy is also
outlined.

Team 3 Sim Escape Page 49 of 62
12 December 2011 Project Proposal and Feasibility Study
7.4.1 Target Market
SimEscape’s target market is the group of customers that require the use of virtual environments for the
use of training or education. SimEscape also aims to sell to companies that use 3D imaging for
development or design such as medical research companies or architecture firms.
The company’s product is not limited by gender, race, status, or location. The SimEscape product will,
however, be designed for adult users. Since SimEscape will mainly be selling to companies rather than
specific individuals, it is up to the customers to decide which of their employees, personnel, students, or
workers will be using the product.
The product’s end users may include military personnel, pilots, architects, doctors, emergency response
teams, and professors. The levels of technical understanding of the product will vary greatly in the
different user groups, so the product will have to appeal on different aspects to be viable in different
markets.
7.4.2 Customers' Motivation to Buy
The customer will buy our product in order to prepare users for various scenarios that they may encounter.
If the customer’s employees or personnel have been trained through realistic training exercises, their
response to situations will be better that that of untrained employees. This increase in situational
knowledge can reduce company risk, increase workplace safety, save money, or even save lives.
7.4.3 Market Size and Trends
Since SimEscape has multiple target markets, there will be variation in the market size depending on the
sector of the economy. Overall, the trend towards simulation technology is rising as companies
acknowledge the benefits it provides.
The following excerpt explains the situation of the Healthcare Virtual Reality market.
According to the report, in 2010, the U.S. market for VR applications in healthcare reached
approximately $670 million in sales. The market enjoyed a compound annual growth rate
(CAGR) of over 10% during the 2006-2010 period. Kalorama Information projects market
growth to continue at a greater rate through 2015 as equipment and technology spending
recovers among U.S. healthcare service providers.30
The oil and gas virtual reality simulation market in 2011 is worth $2.24 billion.31
Also, according to
Aviation today, the market size for pilot training in 2008 was $10 billion.32
All of these markets are
increasing. Military market statistics were not available for public access, but can be reasonably assumed
to be at least comparable to the other markets.
7.4.4 Advertising and promotion
Since the target market of the company does not include consumers, advertising strategies using popular
media such as TV advertisements or social media advertisements will not be appropriate. Instead, the
company will use publications or journals to notify customers about the product. Professional association
publications for the development communities such as IEEE or American Architectural Foundation will
inform the end users about the technology that our company provides. This also applies to the Medical

Team 3 Sim Escape Page 50 of 62
12 December 2011 Project Proposal and Feasibility Study
Healthcare companies and the other markets which would mean advertising in publications for healthcare
professionals. Advertising using newspapers and magazines would be the most appropriate form of
promotion.
SimEscape will have a website to promote the technology developed by the company. There will be a
demonstration page to show the applications for the product. Other ways to utilize the Internet include
using Google advertisements and posting video demonstrations accessible by the public. Another way to
inform companies of our product would be to start a marketing department in the company. This can be
combined with the sales department. However, since the startup company is small, the budget for sales
and marketing cost will be small relative to the cost of design and production. The best way to promote
our product is by getting positive reviews. As the company’s product gets good reviews, customers will
spread the product by word-of-mouth as more companies use our product.
7.4.5 Promotion Costs
Since the majority of the advertisement would rely on publications and magazines, a graphic design
contract would be a good investment. The cost of posting an advertisement in magazines or newspapers
varies with the size of the advertisement but will be more than a $1000 per issue. A website developer will
not be necessary since the team members have experience with designing a website. The cost of owning a
domain name can vary between $10 and $20 per year. Also, in the initial stages of the company, a
marketing department might not be feasible.
7.4.6 Pricing
SimEscape wants to be portrayed as a company that values trust, integrity, and stewardship. We also want
to show the customers and competitors that we can build a high quality product and sell it for a reasonable
price while having a good profit margin to be sustainable. Compared to other competitors, our price is
about 10% of our closest competitor’s price.
7.4.6.1 Discount Policy
Discounts offered will depend on the customer or the company’s earnings. The company will offer
discounts of up to 5% to customers that order in high volume, that is, over 100 units. Also, discounts will
be offered to customers who present a strong commitment to the company by continuing to buy and use
our product and communicating issues clearly. We want to maintain a good relationship with customers.
The company will also offer discounts when there is excess inventory.
7.4.6.2 Projected Gross Profit Margin
The projected gross profit margins for year one and year two are estimated at 45%. For year three, the
gross profit will increase to 46%.
7.4.7 Distribution Strategy
SimEscape will sell products mainly through the company’s online website. There will be an online store
page that shows the company’s products and possible optional accessories. There will also be a page that
describes the features of specific products and reviews. The company may also distribute products
through online retailers such as Amazon or make create limited listings on eBay stores.
The company will keep the inventory in a warehouse. The warehouse will be located near the western
coast of North America due to the fact that manufacturing will ship the finished products from locations

Team 3 Sim Escape Page 51 of 62
12 December 2011 Project Proposal and Feasibility Study
in Asia. Flextronics is headquartered in Singapore and has the majority of their manufacturing facilities
near their headquarters.
7.5 Competitor Analysis
The competition for this kind of head mounted display (HMD) product is varied and can be determined
by starting with manufacturers of HMDs and narrowing down by functionality. Then, the actual
competitors in the target market can be compared in terms of cost and quality. Our research of
competition in any market of HMD and simulation technology yielded the following list of companies: IO
Display, Virtual Research, Liteye HMD, Cybermind, Rockwell Optronics, Vuzix, Trivisio, NVIS, eMagin,
and Sensics. Our search also identified potential competition from Gentex Corporation.
Each of these competitors has different target markets and therefore different tradeoffs between the
factors of functionality, quality, and price. These tradeoffs define which of these competitors are directly
competing with our company. The tradeoffs also show their strengths and weaknesses in their business
model for their product. By analyzing these strengths and weaknesses our team can then devise a strategy
for market entry and market share acquisition.
A list of possible competitors based on companies that make HMD products is shown in Table 19 below.
A company can only make a product that is a viable competitor if it fulfills all of the required
functionality. Companies that do not have any of the functionality required make augmented reality (AR)
systems instead of virtual reality (VR) systems. AR systems display information onto see through
surfaces during real situations, and therefore cannot create immersive simulation environments for
training. Companies that are actual competitors are highlighted in blue. Companies that are future
potential competitors are highlighted in gray.
Table 19. Comparison of Competitor Product Functionality
Virtual
Reality
3-D Display Head
Tracking
Immersive
IO Display33
X X
Virtual Research X X X
Liteye HMD34
Cybermind X X X
Rockwell
Optronics
X X X X
Vuzix X X X
Trivisio X X X X
NVIS X X X X
eMagin X X X
Sensics X X X X
Gentex X
Fifth Dimension
Technologies
X X X X
7.5.1 Existing Competitors
Several competitors exist to the SimEscape product. This section outlines the competitors that are in the
target market currently.
Team 3 Sim Escape Page 52 of 62
12 December 2011 Project Proposal and Feasibility Study
7.5.1.1 Rockwell Optronics
Rockwell Optronics (formerly Kaiser Opto-Electronics) has HMD technology with the necessary
functionality to compete with our product. It does, however, require that head tracking hardware is sold
separately, increasing cost for the modularity aspect. The cost of the system is $27,500 per unit plus
another $500 for the head tracker. Our aim is to severely undercut this price while providing comparable
quality.35
7.5.1.2 Fifth Dimension Technologies
Fifth Dimension Technologies has the HMD technology to make a competitive product to the proposed
design. However, like many competitors, the cost is quite high. The base model without motion tracking
is $10,000, and including the motion tracking it is $10,700.36
Our goal is to provide a comparable or
better performance while undercutting their price.
7.5.1.3 Trivisio
Trivisio has the HMD technology to make a competitive product to our design. Trivisio has the potential
to be one of our biggest competitors because it has near the quality we propose and the competitive price
of $5,230 per unit. This price is without a motion tracking unit, but with the motion tracker it is still only
$5,750. We hope to still be able to provide the same or higher quality in our product while undercutting
this price by a significant amount.
7.5.1.4 NVIS
NVIS has a very high quality product with very good specifications. It will be higher quality than our
product, but comes at a very high cost. The base unit includes high resolution display, but starts at
$34,300. It also does not include motion tracking. The higher end models reach $44,500 and include
motion tracking. We hope to enter the NVIS market share by severely undercutting their price and not
trying to reach their level of quality.
7.5.1.5 Sensics
Sensics has a very high quality HMD product with very good specifications. Our goal is to not compete
on quality, but on price. The base unit includes high resolution display, motion tracking, and wireless
communication, but starts at $24,000. The higher end models reach $39,000 and include a much wider
field of vision. We hope to enter the Sensics market share by severely undercutting their price and not
trying to reach their level of quality in the same way we undercut NVIS.37
7.5.2 Potential Competitors
Potential competitors include the competitors that have either the capability to enter the market, the
interest to enter the market, or both.
7.5.2.1 Gentex
Gentex is considered a potential competitor because they recently acquired Intersense, a motion tracking
technologies firm, because they already make AR helmets for military, non-training use, and because it is
a large company with lots of engineering expertise. The reason we are not worried that Gentex will make

Team 3 Sim Escape Page 53 of 62
12 December 2011 Project Proposal and Feasibility Study
the jump into training and simulation is because it is a comparatively small market and they are probably
not interested.
7.5.2.2 Virtual Research
Virtual Research is considered a potential competitor because it needs only to implement a head tracking
unit.38
The reason we are not worried about this potential competitor is because its base price without
tracking systems is $15,900 and will only increase with added complexity.39
7.5.2.3 Cybermind
Cybermind is considered a potential competitor because it needs only to implement a head tracking unit.
The reason we are not worried about this potential competitor is because its base price without tracking
systems is $11,930 and will only increase with added complexity.40
7.5.2.4 eMagin
The company eMagin is considered a potential competitor because it has most of the necessary
technology to become a real competitor. The current product is a media and entertainment product that
costs $1,799 per unit. The company eMagin, unlike other potential competitors, would need to redesign
their system to a much higher quality standard in order to cater to the needs of the simulation target
market. This would be a redesign for a more immersive interface as well and creating a product with
higher quality components. This would definitely increase cost to similar costs to the market standard for
this quality.41
7.5.2.5 Vuzix
The company Vuzix is considered a potential competitor because it has a similar concept. Vuzix,
however, uses a lower quality approach that targets the consumer market looking to sell a cheaper product
to a larger audience. The device underprices the SimEscape product at $300, but it also does not provide
the immersive experience that our product will provide. The Vuzix Corporation could develop a product
at the level of the SimEscape product, but it would take time and money to produce this design and a
price increase to sell it.
7.6 Financial Forecasts
The financial forecast for SimEscape LLC is detailed in the Projected Financials in Appendix C.
7.6.1 Financial Forecast Description
This pro-forma statement of income and statement of cash flows outlines the predicted company financial
plan for the first 3 years including break even analysis, ratio analysis, debt repayment schedule, and
possible exit strategy.
7.6.2 Key Assumptions
Our financial forecast made several key assumptions about the way our business would function and the
financial model proposed. The first assumption was that the company would undergo constant growth.
For newly started small company, growth is usually very fast in the first few years and careful
management of that growth can keep it from getting out of control. The assumed growth rate was 20%
annually, a typical growth rate for small businesses in their first few years. The next assumptions made

Team 3 Sim Escape Page 54 of 62
12 December 2011 Project Proposal and Feasibility Study
were that sales and cost would be distributed evenly over each year. These assumptions were made to
simplify calculations. Another simplifying assumption was that inventory would be sold in the year that it
was produced. Also assumed was that contract manufacturing would be in fixed unit volume blocks of
10,000 per year. This is an estimate that fits the projected sales volume the company expects and would
incur a slightly higher per unit rate from the manufacturer for the low volume. This is included in the
company’s estimate of per unit cost. The next big assumption is that the company will be able to sell its
entire inventory yearly. If this is not possible, the break even analysis discusses how many units need to
be sold for profitability on a yearly basis. The next major assumption was that the members of the
company will be able to procure $900,000 capital investment and a startup loan of $3,506,000. This
assumption is based off of the ability to keep that investment in collateral in the form of finished product
from the contract manufacturer.
7.6.3 Financial Statements
The following financial statements show the feasibility of the company as a whole. This includes the
projected incomes, yearly balances, and cash flow statements.
7.6.3.1 Income Statement
The key points of the income statement are the price point, 3 year IRR, and net incomes over the first 3
years. The most profitable price point was calculated to be $500 per unit based on possible volume sold
and profit margins per unit. At this price point of $500 per unit, the 3 year IRR is 48%, 77% if we
successfully sell the company for 4x EBIDA at the end of year 3. Both of these measures are after tax.
The resulting net income after tax in year 1 is $286,000. Year 2 results in net income of $481,000 and
year 3 yields $700,000. More detailed information can be found in the projected financials in Appendix
C.
7.6.3.2 Balance Sheet
A balance sheet is not included in the financial analysis because the company is assuming no credit sales
or purchases. In this business model the company assets can simply be reduced to available cash and the
value of the investment in injection molds for the plastic parts of the design. Inventory on hand would
not be included because of the assumption that all inventory would be sold by year’s end. The company
debt is simply the bank debt at a 10% interest rate. The equity is only the invested capital from day 1, that
is, the original $900,000 invested in the company.
7.6.3.3 Cash Flow Statement
The most important points of the cash flow statement are the reinvestment plan and the plan for the excess
profits. The company has decided to only reinvest what is needed for working capital and to use the
excess profits to pay off company bank debt. This strategy was chosen because of the high level of initial
debt. More detailed information about company cash flows can be found in the projected financials in
Appendix C.
7.6.4 Break-Even Analysis
The break-even analysis is detailed in the projected financials in Appendix C. However, these numbers do
not detail calculations of the break-even price point through adjusting price point to the point of no net
income after tax in year 1. This break-even price point was calculated to be $455 per unit. At the ideal
price point of $500 per unit, the break-even unit sales volume is 8,731 of the 10,000 units produced.

Team 3 Sim Escape Page 55 of 62
12 December 2011 Project Proposal and Feasibility Study
7.6.5 Ratio Analysis
The key ratios for the financial projections of SimEscape LLC show the viability and projected
profitability of the company as a whole. The calculated gross margin of revenue is 46% each year. This
is a metric of the company’s profitability because significant revenue is made above the covering of cost.
The profit margin in year 1 is 6% and increases to 8% in year 2 and 9% in year 3. This trend of growth
indicates the company’s ability to pay off bank debt, invest in future growth, and return capital to the
owners. The net asset turnover in year 1 is 1.13 and increases to 1.48 in year 2 and 2.02 in year 3. This
number is a metric of the number of times the company can sell the company’s assets worth of inventory
in a year. These values are increasing, suggesting increasingly efficient inventory management. Finally,
the debt to equity ratio is 3.90 in year 1, 3.50 in year 2, and 2.96 in year 3. Our plan is to have the debt
reduced as quickly as possible to reduce the company’s risk in the debt repayment schedule.
7.7 Loan or Investment Proposal
The startup of SimEscape LLC will be quite costly. The idea is to start with full scale production as early
as possible to make a big impact on the market before competitors can react.
7.7.1 Amount Requested
The amount that the company calculated would be necessary for startup was a capital investment of
$900,000. This would be the company’s starting equity. The initial bank loan needed was calculated to
be $3,506,000. This would be the company’s starting debt.
7.7.2 Purpose of Uses of Funds
The purpose of the funds raised and loaned would be to purchase a contract with the contract
manufacturing company and to invest in the molds for the injection molding process. The contract
manufacturing contract would then cover the purchase and assembly of electronic parts and the assembly
of the mechanical systems.
7.7.3 Repayment Schedule
The investment repayment schedule is focused on paying back the debt as soon as possible. By using
excess profits to repay as much debt as possible, the company can be repaid by year 3. If the company
fails, the bank would be able to collateralize the inventory of finished product in order to repay debt. The
company has built in an exit strategy by year 3 using a 4 times EBIDA assessment of assets. This metric
places the company at a net value of $4,682,000 at the end of year 3, after tax.
7.7.4 Timetable for implementing plan and launching the business
The company plans to launch full scale production as soon as possible after attaining the necessary funds.
The financial plan assumes the manufacturing contract will be contingent on loan financing, and will only
take 2 weeks until the first production run.

Team 3 Sim Escape Page 56 of 62
12 December 2011 Project Proposal and Feasibility Study
8 Project Management
In order to accomplish the goals of the project the team has set up a structure for task
assignment, accountability, managing funds, planning and scheduling work, and communicating
and sharing information. The following sections outline details of the structure, organization, and
operating procedure of the team.
8.1 Team Organization
Organization is important for the team to keep working smoothly. The team has divided up the
work to be done, identified support personnel who can help them with certain tasks, and set up a
standard for getting work done at meetings and for storing files on the shared drive.
8.1.1 Division of Work
Since the project is divided into three main subsystems, one person has been assigned to each of these
subsystems. Walter has been assigned to manage the video processing subsystem, Dan Ziegler has been
assigned to the computer software that will be needed for the system, and Arnold has been assigned to
work on the motion sensors and data acquisition for the project. These assignments were made based on
the interest and experience of individual team members in each area. The remaining team member, Dan
Bosscher, will work on device power, optics, and PCB layout with Walter, and work with Dan Ziegler and
Arnold on hardware software interface with the motion sensors. Dan Ziegler and Arnold both felt it would
be beneficial to have Dan Bosscher help with this aspect of software because of the number of computer
science courses he has taken. Dan was also given the task of optics because of his contacts in the field.
Additionally, the team might need to use the machine shop to construct the prototype. Since Walter has
taken a machine shop course at Calvin, he will be the one to do the most work on constructing the
prototype.
8.1.2 Team Advisors and Support
The team is advised by primarily by Professor VanderLeest from Calvin College's Engineering
Department, but also by Tim Theriault acting as an industrial consultant from GE Aviation. Other course
instructors are Professors Nielsen, Wunder, and Wentzheimer, all from the Engineering department, and
Professor Medema who is teaching the concurrent Business Aspects for Engineers course. The team has
also received assistance from Michelle Krul, the Engineering Department Administrative Assistant; Bob
DeKraker, the Department Lab Manager; Chuck Holwerda, the Electronics Shop Technician; and Phil
Jasperse the Metal and Wood Shop Technician. Michelle has helped the teams by submitting posters to
printing services, and with organization and announcements for the class. Bob DeKraker orders parts for
the senior design teams. Chuck Holwerda and Phil Jasperse helped with electrical and wood and metal
assembly respectively.
8.1.3 Team Meetings
The team regularly meets on Sunday evenings to discuss coming deadlines and to make sure everyone is
aware of information pertinent to the whole team. The information discussed during meetings includes
dividing up work for upcoming tasks, and making decisions for consistency in the project (such as
naming convention or document formatting).

Team 3 Sim Escape Page 57 of 62
12 December 2011 Project Proposal and Feasibility Study
8.1.4 Storing Files
All documents for the team are being stored on Calvin College's shared drive in the senior design
directory (S://Engineering/Teams/Team03). This folder is divided into sub-folders to separate files by
type. These include Documents, Photos, Posters, and Presentations sub-folders. Additionally there is a
Designs sub-folder that includes software specific files such as Quartus Designs. The Documents folder is
further divided into sub-folders based on document type. This includes Business, Block Diagrams,
Management, PPFS, and Video sub-folders. There was a period of time where team members did not have
write access to this directory. During that time team members stored most information on the personal
machines, and used the Scratch drive (S://Engineering/Scratch/SimEscape Vision) to store documents that
would be needed by the entire group. The team is currently working on moving all documents into the
Team03 folder.
8.2 Schedule
The team has a schedule that they use to track when certain milestones need to be reached for the project,
as well as when they need to turn in material for the class. This schedule, which can be found in Appendix
E, helps to keep the project moving, and lets the team know which due dates are coming up.
8.2.1 Schedule Management
The schedule is maintained by Dan Bosscher who updates it every couple of weeks to take into account
changes in project direction and better understanding of the scope of the project. During the second
semester, the schedule will be updated weekly as major deliverables appear with an increased frequency.
As the team better understands the work that needs to be done for certain tasks, these tasks are then
broken down into more manageable sub-tasks. Sub-tasks are scheduled to take more time than the team
expects, to take into account unforeseen setbacks. The schedule is used to make sure that the highest
levels of tasks meet the set deadlines, and to determine if changes need to be made to meet these
deadlines. If scheduling issues arise, such as being unable to meet an important deadline, the team plans
to meet to discuss if resources can be reallocated to make sure the deadline is made.
8.2.2 Critical Path
The critical path for the project has been divided into two parallel courses, the physical design and the
electrical design. These two paths are shown in Table 20 below, with the top level tasks and due dates for
each section. Two paths are given because the nature of each path allows for a certain amount of
parallelism. The team believes that these are the two paths that hold that greatest amount of risk for them.
If the deadlines in these critical paths are not kept, the team feels that it will not be able finish the project.
At the end of the semester, the two paths will come together to produce a single product.
Table 20. Project Management Critical Paths
Physical Path Electrical Path
Task Due Date Task Due Date
Buy Helmet for
Prototype
01/10/12 Final System Design 01/31/12
Preliminary
Mounting/Optics
02/14/12 Master Schematic 02/14/12
Final Helmet 03/01/12 PCB Layout 03/01/12

Team 3 Sim Escape Page 58 of 62
12 December 2011 Project Proposal and Feasibility Study
Layout/Mounting
Build 03/10/12 Manufacture/Populate
Board
03/07/12
Integration Testing 04/12/12
Mount Electronics on
Helmet
04/25/12 Mount Electronics on
Helmet
04/25/12
8.2.3 Current Progress and Feasibility
The team has made good progress this semester but still has a lot to do. Based on the completion rate
given in the work breakdown schedule (45%) the team believes that it is about 40% done with the project,
taking into account that they have not decided on contingency plans for possible failed tests and expecting
that some tests will fail the first. The team has spent a collective 408.5 hours on the project this semester.
The team has been able to get many of their subsystems working, and they have even already
accomplished some tasks that they were expecting to do second semester. This has been to their
advantage, as the team originally underestimated the amount of work to be done. This means that the
team is not necessarily falling behind, but will have to do a lot of work to accommodate the increased
amount of expected work. Looking ahead at the work that still needs to be done, the team estimates that
they will have around 1000 hours of work to do next semester. Divided between the 16 weeks between
Christmas Break and Senior Design Night (not including Spring Break) this means the team will have to
work around 60 hours a week in order to finish the project on time. The team feels that although this is
more than they anticipated at the beginning of the project, it is still feasible and is looking forward to
presenting a working prototype next semester.
8.3 Budget
The team budget for the project is managed by Dan Ziegler and can be seen in Appendix D – Project
Prototype Budget. The team began the year with an estimate of anything that they would need to purchase
with the budget. With every item that they placed in the budget at the beginning of the year, they gave an
initial cost estimate. After working on the project for about a month, the team reevaluated the budget to
decide if their initial estimates were good, and necessary changes were made. Whenever a purchase is to
be made, the individual making the purchase checks the budget to verify if the purchase is less than or
equal to what was budgeted for it. If this is the case, the budget is updated with the actual amount paid.
Otherwise, if the purchase was not planned for or runs higher than was planned for the team will discuss
alternatives, decide if the purchase is necessary, and decide if money will have to be taken away from
other items in the budget to accommodate the changes.
8.4 Method of Approach
The team approached this project by dividing the entire system for the project into subsystems. For each
subsystem, the team has assigned a specific individual to manage and be held accountable for that
subsystem. That individual will do the majority of the work for the assigned subsystem, including any
research that is needed. All team members are making sure that other members are informed about the
design decisions that they make, especially if a decision made by one member will affect the decisions of
other members. Most of these design decisions are shared by the team during regular meetings.
The team has been using the principles of humility, understanding, trust, openness, and accountability in
their interactions with each other. The team understands that each member has a busy schedule this
semester, and that the work on this project has to be done while also fulfilling a number of other

Team 3 Sim Escape Page 59 of 62
12 December 2011 Project Proposal and Feasibility Study
responsibilities. The team trusts each member to pull his own weight, and to accomplish the tasks that
have been assigned to him. The team expects with humility that there might be delays in smaller sub-tasks
due to other responsibilities, and these delays have been accounted for in the schedule. However, the team
is also holding every member accountable by specifically stating which parts of the project he is
responsible for. To balance this trust and accountability, the team wishes to maintain openness about the
setbacks each member is experiencing, and working with each member to help him meet his deadlines.
9 Conclusions
9.1 Current Progress
The team has been able to effectively work independently and concurrently. Walter Schnoor has been
working on the display system. He has created a prototype of the video processing hardware on a
development board that receives an NTSC 640x480 resolution video input, splits the images, and outputs
a quadrant via VGA to a monitor. This was accomplished in 16 and 24 bit color. Dan Bosscher and
Arnold Aquino have been working on the head tracker unit. They acquired motion tracking sensors and
successfully connected them to a personal computer via a microcontroller. They then were able to read
data from the sensors using software on the microcontroller. Dan Ziegler has been working on
developing input software and utilizing the DX Studio virtual environment software. He has been able to
connect the Vuzix VR920 to control an avatar in DX Studio in stereoscopic 3D using head tracking.
9.1.1 Prototypes
The team has been able to put together working demonstrations of portions of the project. This section
summarizes the portions of the project that have been completed.
9.1.2 Experiments
The experiments performed by the team to demonstrate the feasibility of the design can be seen itemized
below.
9.1.2.1 Display System
Walter Schnoor has set up a NIOS system to take a composite video input and display it through VGA.
He has been able to split up the video into two different outputs by using another Altera DE2 development
board with a VGA output.
9.1.2.2 Software
Dan Ziegler has used DX Studio to build simple virtual environment. He has been mapping the video
output to a side-by-side format and outputting to a Vuzix 920VR through VGA. He has also used the
sensor output from the 920VR and mapped the output to a mouse driver to control the movement of the
cameras in the virtual environment.
9.1.2.3 Head Tracker
Arnold Aquino and Dan Bosscher have been able to wire a pair of sensor breakout boards to an Arduino
Deumilanove microcontroller. They soldered pins to the pin holes of the breakout boards and mounted the
breakout boards to a bread board. They wrote code using Arduino programming language to read and

Team 3 Sim Escape Page 60 of 62
12 December 2011 Project Proposal and Feasibility Study
write to the sensor registers. Arnold and Dan have also started on designing a NIOS II system that
includes an I2C module.
9.1.3 Setbacks
As mentioned in the Virtual Environment Design Selection, the programming language for the Steam
Source SDK was not as user friendly as expected. Dan Ziegler had to research other available software for
creating virtual environments.
Dan Bosscher had a contact for an optometrist who would have been helpful with the optics portion of the
project. However, the optometrist said that he cannot help the team pick out a lens for the optics. This
meant that the team would have to either contact other experts or research optics on their own.
For the sensor circuit, Arnold Aquino found multiple sensor units from Digikey. However, all of the
sensors were surface mount chips. The team will need to have access to equipment that allows for surface
mount population. The design will also include an FPGA with BGA mounting. This will require
sophisticated populating equipment that the team will have to contract out.
9.2 Remaining High Risk Obstacles
Since the team has not ordered all of the parts yet or started putting different portions together, there will
most likely be unforeseen obstacles. There are also defined obstacles that the team has not yet solved.
Two obstacles that the team has determined are high risk based on severity of problem, difficulty of
solution, placement in critical design path, or some combination of these factors are detailed below.
9.2.1 PCB Design
The PCB will be contained in the System Interface Module. Initial design estimates and feedback from
the industrial consultant indicate that the PCB will be a four to six layer board.
9.2.1.1 Problem Statement
The team will have to come up with a way to mount an FPGA to their own board. The team also plans to
design a multi-layer board, which will require research on board layout norms and considerations as well
as a significant amount of time and effort for creating the actual layout. In order to have this complex
board built and populated, the team will have to contract out process to a prototyping company or a PCB
manufacturer. This process will take significant lead time and will therefore need to be done as soon as
possible.
9.2.1.2 Response Strategy
Dan Bosscher works part time at Johnson Controls. Dan is currently talking to Johnson Controls to see if
the hardware group would be willing to advise the team in the design. The team is also trying to leverage
contacts at other local companies to offer services in terms of board creation or population.
9.2.2 Lenses and Lens Mounting
The lenses focus the user’s retina upon the display LCD.
9.2.2.1 Problem Statement

Team 3 Sim Escape Page 61 of 62
12 December 2011 Project Proposal and Feasibility Study
The team will need to come up with a way to mount lenses properly. The lenses will have to be oriented
in a way that gives the user the stereoscopic image effect as well as a clear picture that is easy to focus on.
The lenses would also need to be adjustable so that different users will be able to have the proper focus.
9.2.2.2 Response Strategy
The Vuzix 920VR has adjustable lenses. The team can disassemble the glasses and look at how the
adjustable mechanism works. The team can also approach mechanical engineering students and
professors for some design help. Walter Schnoor has taken shop class which he will apply in the physical
design of the head gear.
10 Credits and Acknowledgements
Team SimEscape would like to give special thanks to Calvin College engineering professor Randall
Brouwer for his assistance in video processing design and programmable logic design.
The team would like to thank Calvin College engineering professor Yoon Kim for giving an insight to the
head tracking portion of the project. Professor Kim recommended using breakout boards and talked about
his experience with sensors.
The team would also like to thank Calvin College engineering professor Steven VanderLeest for advising
the team and always holding the team to a high standard of excellence and professionalism.
The team would like to thank Chuck Holwerda for providing electrical hardware as well as design and
construction expertise.
The team would like to thank Phil Jasperse for teaching a course in metalwork, providing construction
assistance, and for his endless supply of candy in the machine shop.
The team would like to thank Bob DeKraker for his assistance in placing part orders and being a technical
resource.
The team would like to thank James VanDenBerg and Nathan Gelderloos for their contributions to the
formulation of the business strategy and financial predictions.
The team would like to thank Calvin College engineering professor Ned Nielsen for his contributions to
cost analysis.
The team would like to thank GE Aviation employee Tim Theriault for consulting with the team.

Team 3 Sim Escape Page 62 of 62
12 December 2011 Project Proposal and Feasibility Study
11 References 1 Gayle E. Ermer and Steven H. VanderLeest, "Using Design Norms to Teach Engineering Ethics," 2002, http://soa.asee.org/paper/conference/paper-view.cfm?id=16995 2 WiseGeek, What is G-Force?, http://www.wisegeek.com/what-is-g-force.htm 3 Net Market Share, Desktop Top Operating System Share Trend, http://www.netmarketshare.com/operating-system-market-share.aspx?qprid=9&qpcustomb=0 4“Quality of Experience in Virtual Environments”, http://www.neurovr.org/emerging/book4/4_08GAGGIOL.PDF 5 Microsoft, Window Management, http://msdn.microsoft.com/en-us/library/windows/desktop/aa511262.aspx 6D. E. du Toit, “Isokinetic Evaluation of Neck Strength”, http://www.ajol.info/index.php/sasma/article/viewFile/31864/23621 7 United States Department of Labor, How Electrical Current Affects the Human Body,
http://www.osha.gov/SLTC/etools/construction/electrical_incidents/eleccurrent.html 8 Avnet, http://avnet.com/home/ 9 Digikey, http://www.digikey.com/ 10 http://www.wisegeek.com/what-is-g-force.htm 11 Sparkfun, http://www.sparkfun.com/ 12 http://www.digikey.com/ 13 Gamedev.net. GameDev, 1999. Web. 6 Dec. 2011. <http://www.gamedev.net/topic/613786-your-game-engine/>. 14 DX Studio Guide. Ed. Chris S. N.p., 20 June 2010. Web. 14 Nov. 2011. <http://www.dxstudio.com/guide.aspx>. 15 Virtual Reality and Head-Mounted Displays, http://vrguy.blogspot.com/2011/03/side-by-side-3d-and-hmds.html 16 http://vrguy.blogspot.com/2011/03/side-by-side-3d-and-hmds.html 17 http://vrguy.blogspot.com/2011/03/side-by-side-3d-and-hmds.html 18 Average Selling Prices on Graphics Cards Continue to Drop, http://www.xbitlabs.com/news/graphics/display/20090828120338_Average_Selling_Prices_on_Graphics_Cards_Continue_to_Drop_Jon_Peddie_
Research.html 19 Altera Corporation. Video IP Cores for Altera DE Series Boards. July 2010. Tutorial. 20 Ashenden, Peter J. The Designer's Guide to VHDL. San Francisco, CA: Morgan Kaufmann, 1996. Print. 21 Kuon, I.; Rose, J. (2006). "Measuring the gap between FPGAs and ASICs". Proceedings of the internation symposium on Field programmable
gate arrays - FPGA'06. pp. 21. 22 S. Winkler, C. J. van den Branden Lambrecht, and M. Kunt (2001). "Vision and Video: Models and Applications". In Christian J. van den
Branden Lambrecht. Vision models and applications to image and video processing. Springer. p. 209. ISBN 9780792374220. 23 John Watkinson (2008). The art of digital video. Focal Press. p. 272. ISBN 9780240520056. 24 "Converging Lenses." PhysicsLAB. Ed. Catherine H. Colwell. Mainland High School, n.d. Web. 2 Nov. 2011. Path: Resource Lessons;
Geometric Optics; Converging Lenses. 25 Matthias M. Wloka, “Lag in Multiprocessor Virtual Reality”, http://www.google.com/url?sa=t&rct=j&q=&esrc=s&frm=1&source=web&cd=2&ved=0CCsQFjAB&url=http%3A%2F%2Fciteseerx.ist.psu.edu
%2Fviewdoc%2Fdownload%3Fdoi%3D10.1.1.51.8010%26rep%3Drep1%26type%3Dpdf&ei=vSbkTsStG43jggfE3IjhBQ&usg=AFQjCNFCzpH
DJZCjrdtpzJIYjFLOQWGBtA&sig2=UEb6yB7Fm_CBBaMXFKnQJQ 26 “Military Specifications and Standards”, http://www.ihs.com/products/industry-standards/solutions/military-specs.aspx 27The Market for Visual Simulation/Virtual Reality Systems, Sixth Edition, http://www.cyberedge.com/mkt_r_vr_vrmkt6_annc.html 28 Virtual Technologies in Healthcare in the U.S., http://www.kaloramainformation.com/about/editor.asp?id=70 29The Oil & Gas Virtual Reality (VR) Training and Simulation Market 2011-2021, http://www.prnewswire.com/news-releases/the-oil--gas-
virtual-reality-vr-training-and-simulation-market-2011-2021-134579763.html 30 http://www.giiresearch.com/report/kl164671-vr-healthcare.html 31 http://www.prnewswire.com/news-releases/the-oil--gas-virtual-reality-vr-training-and-simulation-market-2011-2021-134579763.html 32 http://www.aviationtoday.com/regions/usa/Pilot-Training-Vital-for-Market-Recovery_44198.html 33 i-Glasses Store. IO Display Systems, 2011. Web. 3 Dec. 2011. <http://www.i-glassesstore.com/i-3d.html>. 34 Liteye HMD. Liteye HMD, 2011. Web. 3 Dec. 2011. <http://www.liteye.com/products/display-products.html>. 35 VR Realities. Rockwell Optronics, 2011. Web. 3 Dec. 2011. <http://www.vrealities.com/sr80.html>. 36 5DT HMD 800 Series. Fifth Dimension Technologies, 2011. Web. 3 Dec. 2011. http://www.5dt.com/products/phmd.html 37 Sensics. Sensics, 2011. Web. 3 Dec. 2011. <http://sensics.com/products/page158/product-selector.php>. 38 Virtual Research Systems Inc.. Virtual Research, 2000. Web. 3 Dec. 2011. <http://www.virtualresearch.com/products/vr1280.htm>. 39 Tek Gear. Mars Hill Group, 2011. Web. 3 Dec. 2011. <http://www.tekgear.com/index.cfm?pageID=90&prodid=595§ion=83>. 40 Cybermind Interactive. Cybermind, 2011. Web. 3 Dec. 2011.
<http://www.cybermindnl.com/index.php?page=shop.product_details&flypage=shop.flypage&product_id=50&category_id=11&manufacturer_id
=0&option=com_virtuemart&Itemid=1>. 41 3D Visor. eMagin, 2011. Web. 3 Dec. 2011. <http://www.3dvisor.com/>.

I
12 Appendices
12.1 Appendix A – Angular Velocity Test Data
Angular Velocity Measurement
Usage Speed Time (s)
Speed (deg / s)
Max Speed Time (s)
Speed (deg / s)
Arnold Aquino 10.8 281.5 1.9 842.1
Dan Bosscher 14.2 214.1 2.0 800.0
Walter Schnoor 11.1 273.9 1.9 842.1
Dan Ziegler 11.9 255.5 2.0 800.0
Average 12.0 256.2 2.0 821.1
In order to calculate the average usage speed and the max speed, the team members took turns measuring
and emulating usage. The team measured the time it takes to pan 160 degrees. The time in the table is the
time it took to pan 10 times. One cycle is a total of 320 degrees.

II
12.2 Appendix B - Texas Instruments TMS320C647x Block Diagram
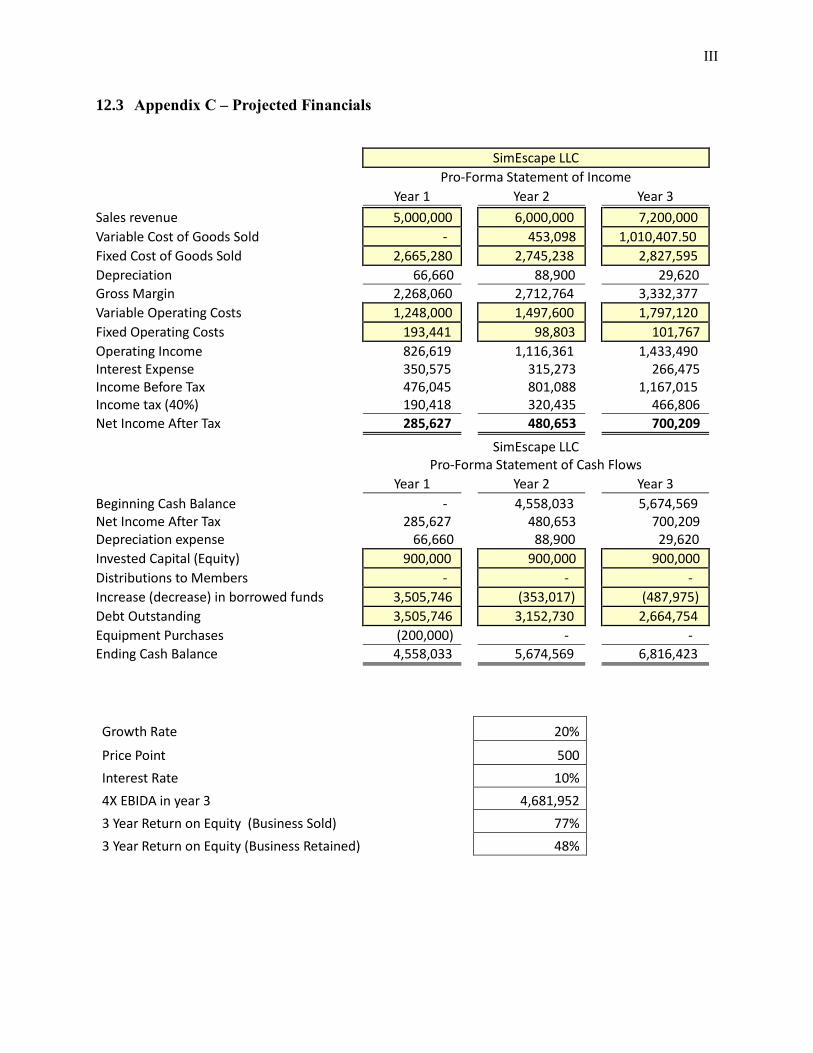
III
12.3 Appendix C – Projected Financials
SimEscape LLC
Pro-Forma Statement of Income
Year 1
Year 2
Year 3 Sales revenue 5,000,000
6,000,000
7,200,000
Variable Cost of Goods Sold -
453,098
1,010,407.50 Fixed Cost of Goods Sold 2,665,280
2,745,238
2,827,595
Depreciation 66,660
88,900
29,620 Gross Margin 2,268,060
2,712,764
3,332,377
Variable Operating Costs 1,248,000
1,497,600
1,797,120 Fixed Operating Costs 193,441
98,803
101,767
Operating Income 826,619
1,116,361
1,433,490 Interest Expense 350,575
315,273
266,475
Income Before Tax 476,045
801,088
1,167,015 Income tax (40%) 190,418
320,435
466,806
Net Income After Tax 285,627
480,653
700,209
SimEscape LLC
Pro-Forma Statement of Cash Flows
Year 1
Year 2
Year 3
Beginning Cash Balance -
4,558,033
5,674,569 Net Income After Tax 285,627
480,653
700,209
Depreciation expense 66,660
88,900
29,620 Invested Capital (Equity) 900,000
900,000
900,000
Distributions to Members -
-
- Increase (decrease) in borrowed funds 3,505,746
(353,017)
(487,975)
Debt Outstanding 3,505,746
3,152,730
2,664,754 Equipment Purchases (200,000)
-
-
Ending Cash Balance 4,558,033
5,674,569
6,816,423
Growth Rate 20%
Price Point 500
Interest Rate 10%
4X EBIDA in year 3 4,681,952
3 Year Return on Equity (Business Sold) 77%
3 Year Return on Equity (Business Retained) 48%
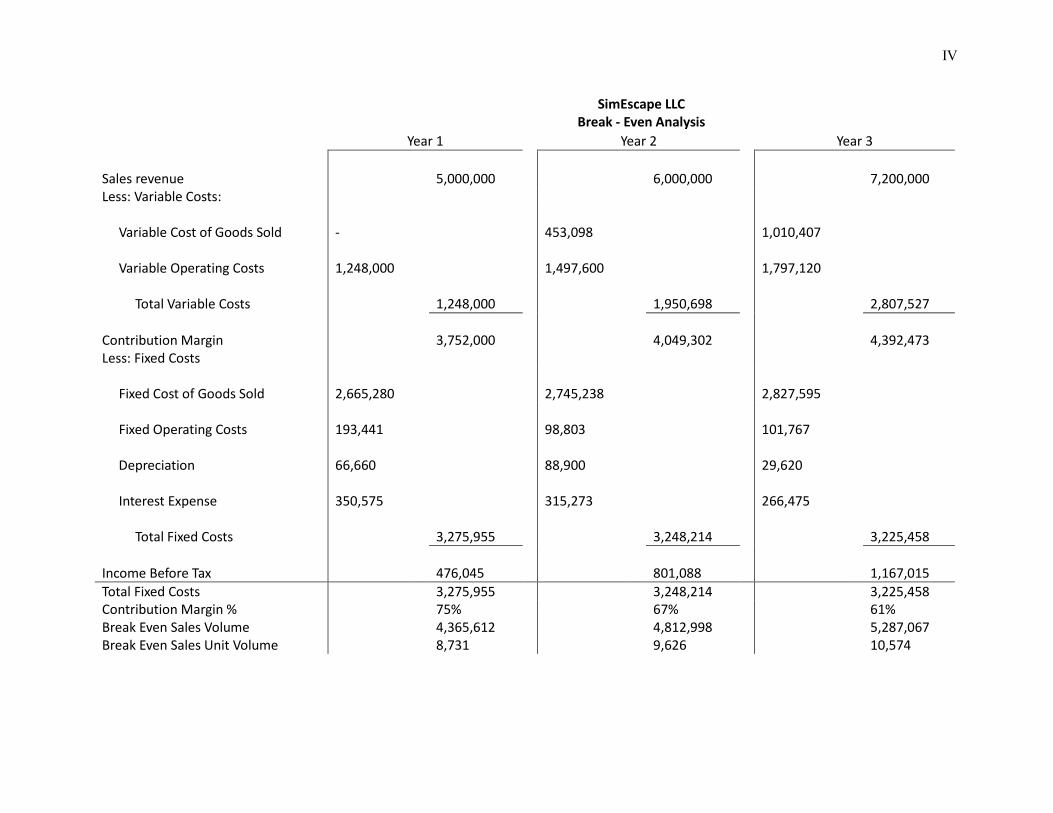
IV
SimEscape LLC
Break - Even Analysis
Year 1
Year 2
Year 3
Sales revenue
5,000,000
6,000,000
7,200,000
Less: Variable Costs:
Variable Cost of Goods Sold -
453,098
1,010,407
Variable Operating Costs
1,248,000
1,497,600
1,797,120
Total Variable Costs
1,248,000
1,950,698
2,807,527
Contribution Margin
3,752,000
4,049,302
4,392,473
Less: Fixed Costs
Fixed Cost of Goods Sold 2,665,280
2,745,238
2,827,595
Fixed Operating Costs
193,441
98,803
101,767
Depreciation
66,660
88,900
29,620
Interest Expense
350,575
315,273
266,475
Total Fixed Costs
3,275,955
3,248,214
3,225,458
Income Before Tax
476,045
801,088
1,167,015
Total Fixed Costs 3,275,955 3,248,214 3,225,458 Contribution Margin % 75% 67% 61% Break Even Sales Volume 4,365,612 4,812,998 5,287,067 Break Even Sales Unit Volume 8,731 9,626 10,574
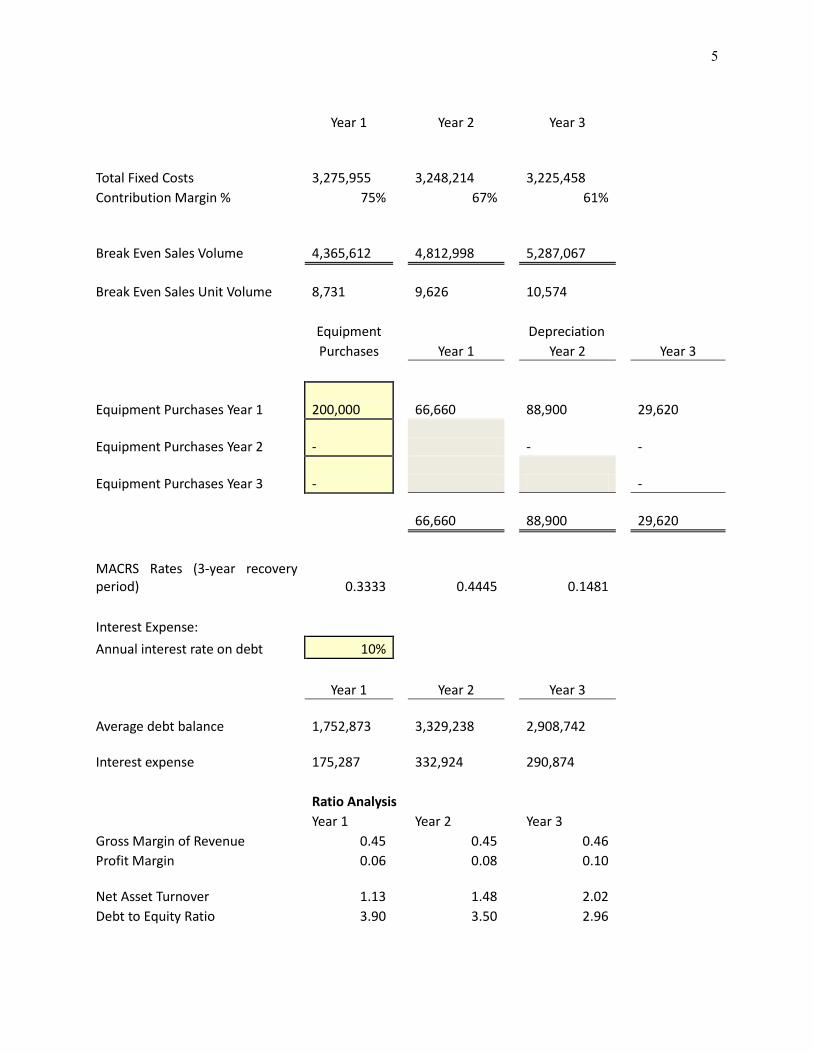
5
Year 1
Year 2
Year 3
Total Fixed Costs
3,275,955
3,248,214
3,225,458
Contribution Margin % 75%
67%
61%
Break Even Sales Volume
4,365,612
4,812,998
5,287,067
Break Even Sales Unit Volume 8,731
9,626
10,574
Equipment
Depreciation
Purchases
Year 1
Year 2
Year 3
Equipment Purchases Year 1 200,000
66,660
88,900
29,620
Equipment Purchases Year 2 -
-
-
Equipment Purchases Year 3 -
-
66,660
88,900
29,620
MACRS Rates (3-year recovery period) 0.3333
0.4445
0.1481
Interest Expense: Annual interest rate on debt 10%
Year 1
Year 2
Year 3
Average debt balance 1,752,873
3,329,238
2,908,742
Interest expense
175,287
332,924
290,874
Ratio Analysis
Year 1
Year 2
Year 3
Gross Margin of Revenue 0.45
0.45
0.46 Profit Margin 0.06
0.08
0.10
Net Asset Turnover
1.13
1.48
2.02
Debt to Equity Ratio 3.90
3.50
2.96

VI
12.4 Appendix D – Project Prototype Budget
Subsystem Purpose Signal Src Part Name MFG Supplier Est. Cost Qty Total Est.Cost
Head Tracking Tracking Sensor Digital Buy SparkFun $85.00 1 $85.00
Head Tracking Data Acquisition Digital Buy NIOS II Altera Digikey $0.00 1 $0.00
Video Processing Decode Input Mixed Buy Digikey $20.00 1 $20.00
Video Processing Controller Digital Buy Cyclone Altera Digikey $100.00 1 $100.00
Video Processing Displays Digital Buy Digikey $27.00 2 $54.00
Video Processing Development Kit Use DE2, DE2-70 Terasic Calvin College $0.00
Power Power Supply Analog Buy Digikey $50.00 1 $50.00
Power Controller Supply Analog Buy LM317, 7805 Calvin College $0.00 2 $0.00
Power Controller Supply Analog Buy Digikey $1.00 1 $1.00
Packaging Interconnect JCI $50.00 1 $50.00
Packaging Controller HW Build Calvin College $25.00 1 $25.00
Wiring Interconnect AD Buy Calvin College $25.00 1 $25.00
ESTIMATED TOTAL: $410.00
BUDGET: $500.00
REMAINDER: $90.00
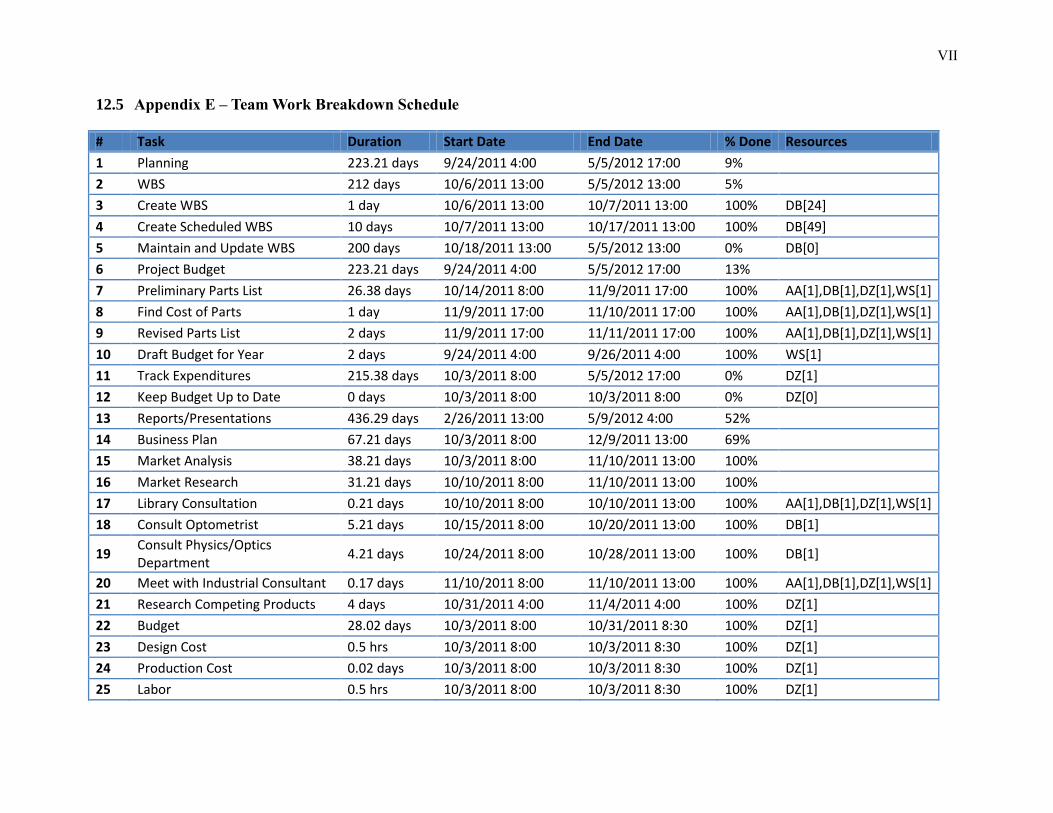
VII
12.5 Appendix E – Team Work Breakdown Schedule
# Task Duration Start Date End Date % Done Resources
1 Planning 223.21 days 9/24/2011 4:00 5/5/2012 17:00 9%
2 WBS 212 days 10/6/2011 13:00 5/5/2012 13:00 5%
3 Create WBS 1 day 10/6/2011 13:00 10/7/2011 13:00 100% DB[24]
4 Create Scheduled WBS 10 days 10/7/2011 13:00 10/17/2011 13:00 100% DB[49]
5 Maintain and Update WBS 200 days 10/18/2011 13:00 5/5/2012 13:00 0% DB[0]
6 Project Budget 223.21 days 9/24/2011 4:00 5/5/2012 17:00 13%
7 Preliminary Parts List 26.38 days 10/14/2011 8:00 11/9/2011 17:00 100% AA[1],DB[1],DZ[1],WS[1]
8 Find Cost of Parts 1 day 11/9/2011 17:00 11/10/2011 17:00 100% AA[1],DB[1],DZ[1],WS[1]
9 Revised Parts List 2 days 11/9/2011 17:00 11/11/2011 17:00 100% AA[1],DB[1],DZ[1],WS[1]
10 Draft Budget for Year 2 days 9/24/2011 4:00 9/26/2011 4:00 100% WS[1]
11 Track Expenditures 215.38 days 10/3/2011 8:00 5/5/2012 17:00 0% DZ[1]
12 Keep Budget Up to Date 0 days 10/3/2011 8:00 10/3/2011 8:00 0% DZ[0]
13 Reports/Presentations 436.29 days 2/26/2011 13:00 5/9/2012 4:00 52%
14 Business Plan 67.21 days 10/3/2011 8:00 12/9/2011 13:00 69%
15 Market Analysis 38.21 days 10/3/2011 8:00 11/10/2011 13:00 100%
16 Market Research 31.21 days 10/10/2011 8:00 11/10/2011 13:00 100%
17 Library Consultation 0.21 days 10/10/2011 8:00 10/10/2011 13:00 100% AA[1],DB[1],DZ[1],WS[1]
18 Consult Optometrist 5.21 days 10/15/2011 8:00 10/20/2011 13:00 100% DB[1]
19 Consult Physics/Optics Department
4.21 days 10/24/2011 8:00 10/28/2011 13:00 100% DB[1]
20 Meet with Industrial Consultant 0.17 days 11/10/2011 8:00 11/10/2011 13:00 100% AA[1],DB[1],DZ[1],WS[1]
21 Research Competing Products 4 days 10/31/2011 4:00 11/4/2011 4:00 100% DZ[1]
22 Budget 28.02 days 10/3/2011 8:00 10/31/2011 8:30 100% DZ[1]
23 Design Cost 0.5 hrs 10/3/2011 8:00 10/3/2011 8:30 100% DZ[1]
24 Production Cost 0.02 days 10/3/2011 8:00 10/3/2011 8:30 100% DZ[1]
25 Labor 0.5 hrs 10/3/2011 8:00 10/3/2011 8:30 100% DZ[1]

VIII
26 Materials 0.5 hrs 10/3/2011 8:00 10/3/2011 8:30 100% DZ[1]
27 Marketing 0.5 hrs 10/3/2011 8:00 10/3/2011 8:30 100% DZ[1]
28 Overhead 0.5 hrs 10/3/2011 8:00 10/3/2011 8:30 100% DZ[1]
29 Cost Estimate and Pricing 0.5 hrs 10/31/2011 8:00 10/31/2011 8:30 100% DZ[1]
30 Marketing 0.02 days 10/3/2011 8:00 10/3/2011 8:30 100% AA[1]
31 Identify Target Market 0.5 hrs 10/3/2011 8:00 10/3/2011 8:30 100% AA[1]
32 Define Marketing Strategy 0.5 hrs 10/3/2011 8:00 10/3/2011 8:30 100% AA[1]
33 Write Business Plan 18.21 days 11/21/2011 8:00 12/9/2011 13:00 15%
34 Draft Plan 1 wk 11/21/2011 8:00 11/27/2011 4:00 0% AA[1],DB[1],DZ[1],WS[1]
35 Edit Plan Draft 1 day 11/27/2011 4:00 11/28/2011 4:00 0% AA[1],DB[1],DZ[1],WS[1]
36 Final Draft 1.17 days 12/8/2011 1:00 12/9/2011 13:00 100% AA[1],DB[1],DZ[1],WS[1]
37 Class Presentation 1 day 12/11/2011 13:00 12/12/2011 13:00 0% AA[1],DB[1],DZ[1],WS[1]
38 PPFS 69.88 days 10/3/2011 8:00 12/12/2011 5:00 79%
39 Create Outline 0.33 days 10/3/2011 8:00 10/3/2011 16:00 0% WS[1]
40 Draft PPFS 41.88 days 10/3/2011 16:00 11/14/2011 13:00 99%
41 Title Page 1 day 11/12/2011 13:00 11/13/2011 13:00 100% WS[1]
42 Executive Summary 1 day 11/12/2011 13:00 11/13/2011 13:00 100% WS[1]
43 Project Introduction 40.88 days 10/3/2011 16:00 11/13/2011 13:00 100%
44 Project Definition 1 day 11/12/2011 13:00 11/13/2011 13:00 100% WS[1]
45 Course Overview 33 hrs 11/11/2011 4:00 11/13/2011 13:00 100% DB[2]
46 Stereoscopic Imaging Theory 1 day 10/3/2011 16:00 11/13/2011 13:00 100% DB[1]
47 Team Information 1 day 11/12/2011 13:00 11/13/2011 13:00 100%
48 Arnold Aquino 1 day 11/12/2011 13:00 11/13/2011 13:00 100% AA[1]
49 Dan Bosscher 1 day 11/12/2011 13:00 11/13/2011 13:00 100% DB[1]
50 Walter Schnoor 1 day 11/12/2011 13:00 11/13/2011 13:00 100% WS[1]
51 Dan Ziegler 1 day 11/12/2011 13:00 11/13/2011 13:00 100% DZ[1]
52 Requirements and Objectives 1.38 days 11/12/2011 4:00 11/13/2011 13:00 99%
53 Design Requirements 1 day 11/12/2011 13:00 11/13/2011 13:00 100%
54 Display System 1 day 11/12/2011 13:00 11/13/2011 13:00 100% WS[1]

IX
55 Head Tracker 1 day 11/12/2011 13:00 11/13/2011 13:00 100% AA[1]
56 Software 1 day 11/12/2011 13:00 11/13/2011 13:00 100% DZ[1]
57 Design Norms 1 day 11/12/2011 13:00 11/13/2011 13:00 100% DB[1]
58 Designing for Humility 1 day 11/12/2011 13:00 11/13/2011 13:00 100% DB[1]
59 Designing for Trust 1 day 11/12/2011 13:00 11/13/2011 13:00 100% DB[1]
60 Designing a Product of Integrity 1 day 11/12/2011 13:00 11/13/2011 13:00 100% DB[1]
61 Designing as Stewards 1 day 11/12/2011 13:00 11/13/2011 13:00 100% DB[1]
62 Physical Design 1 day 11/12/2011 13:00 11/13/2011 13:00 100% DB[1]
63 Product Weight 1 day 11/12/2011 13:00 11/13/2011 13:00 100% DB[1]
64 Product Size 1 day 11/12/2011 13:00 11/13/2011 13:00 100% DB[1]
65 Product Materials 1 day 11/12/2011 13:00 11/13/2011 13:00 100% DB[1]
66 Power Requirements 1 day 11/12/2011 13:00 11/13/2011 13:00 100% DB[1]
67 Safety 1 day 11/12/2011 13:00 11/13/2011 13:00 100% DB[1]
68 Electrical Safety 1 day 11/12/2011 13:00 11/13/2011 13:00 100% DB[1]
69 Physical Safety 1 day 11/12/2011 13:00 11/13/2011 13:00 100% DB[1]
70 Health Concerns 1 day 11/12/2011 13:00 11/13/2011 13:00 100% DB[1]
71 Project Management 1.38 days 11/12/2011 4:00 11/13/2011 13:00 99% DB[2]
72 Team Organization 1 day 11/12/2011 4:00 11/13/2011 4:00 100% DB[1]
73 Schedule 1 day 11/12/2011 4:00 11/13/2011 4:00 100% DB[1]
74 Budget 1 day 11/12/2011 13:00 11/13/2011 13:00 100% DB[1]
75 Method of Approach 1 day 11/12/2011 13:00 11/13/2011 13:00 100% DB[1]
76 System Architecture 1.38 days 11/12/2011 4:00 11/13/2011 13:00 100%
77 Overall System 1 day 11/12/2011 4:00 11/13/2011 13:00 100% WS[1]
78 Head Tracker 1 day 11/12/2011 4:00 11/13/2011 13:00 100% AA[1]
79 Display System 1 day 11/12/2011 4:00 11/13/2011 13:00 100% WS[1]
80 Software 1 day 11/12/2011 4:00 11/13/2011 13:00 100% DZ[1]
81 Electrical System Specifications 2.38 days 11/12/2011 4:00 11/14/2011 13:00 99%
82 Display System 2.38 days 11/12/2011 4:00 11/14/2011 13:00 99% WS[2]
83 Video Processing Platform 2.38 days 11/12/2011 4:00 11/14/2011 13:00 100% WS[1]
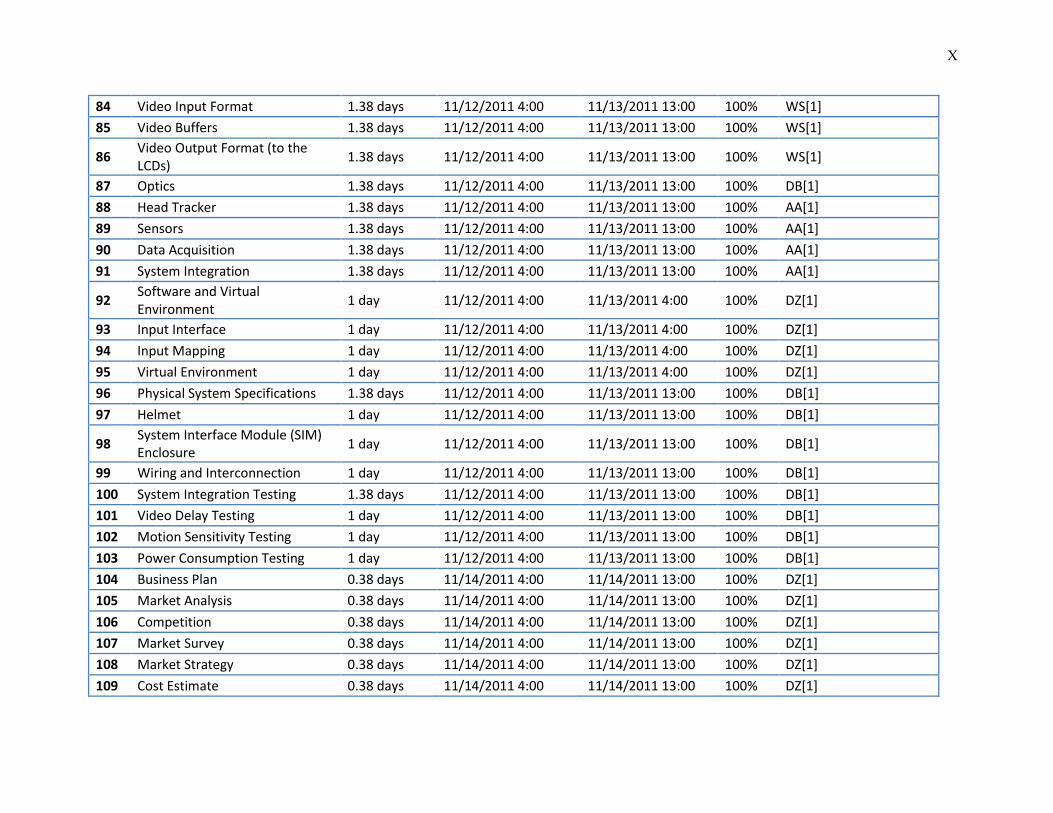
X
84 Video Input Format 1.38 days 11/12/2011 4:00 11/13/2011 13:00 100% WS[1]
85 Video Buffers 1.38 days 11/12/2011 4:00 11/13/2011 13:00 100% WS[1]
86 Video Output Format (to the LCDs)
1.38 days 11/12/2011 4:00 11/13/2011 13:00 100% WS[1]
87 Optics 1.38 days 11/12/2011 4:00 11/13/2011 13:00 100% DB[1]
88 Head Tracker 1.38 days 11/12/2011 4:00 11/13/2011 13:00 100% AA[1]
89 Sensors 1.38 days 11/12/2011 4:00 11/13/2011 13:00 100% AA[1]
90 Data Acquisition 1.38 days 11/12/2011 4:00 11/13/2011 13:00 100% AA[1]
91 System Integration 1.38 days 11/12/2011 4:00 11/13/2011 13:00 100% AA[1]
92 Software and Virtual Environment
1 day 11/12/2011 4:00 11/13/2011 4:00 100% DZ[1]
93 Input Interface 1 day 11/12/2011 4:00 11/13/2011 4:00 100% DZ[1]
94 Input Mapping 1 day 11/12/2011 4:00 11/13/2011 4:00 100% DZ[1]
95 Virtual Environment 1 day 11/12/2011 4:00 11/13/2011 4:00 100% DZ[1]
96 Physical System Specifications 1.38 days 11/12/2011 4:00 11/13/2011 13:00 100% DB[1]
97 Helmet 1 day 11/12/2011 4:00 11/13/2011 13:00 100% DB[1]
98 System Interface Module (SIM) Enclosure
1 day 11/12/2011 4:00 11/13/2011 13:00 100% DB[1]
99 Wiring and Interconnection 1 day 11/12/2011 4:00 11/13/2011 13:00 100% DB[1]
100 System Integration Testing 1.38 days 11/12/2011 4:00 11/13/2011 13:00 100% DB[1]
101 Video Delay Testing 1 day 11/12/2011 4:00 11/13/2011 13:00 100% DB[1]
102 Motion Sensitivity Testing 1 day 11/12/2011 4:00 11/13/2011 13:00 100% DB[1]
103 Power Consumption Testing 1 day 11/12/2011 4:00 11/13/2011 13:00 100% DB[1]
104 Business Plan 0.38 days 11/14/2011 4:00 11/14/2011 13:00 100% DZ[1]
105 Market Analysis 0.38 days 11/14/2011 4:00 11/14/2011 13:00 100% DZ[1]
106 Competition 0.38 days 11/14/2011 4:00 11/14/2011 13:00 100% DZ[1]
107 Market Survey 0.38 days 11/14/2011 4:00 11/14/2011 13:00 100% DZ[1]
108 Market Strategy 0.38 days 11/14/2011 4:00 11/14/2011 13:00 100% DZ[1]
109 Cost Estimate 0.38 days 11/14/2011 4:00 11/14/2011 13:00 100% DZ[1]
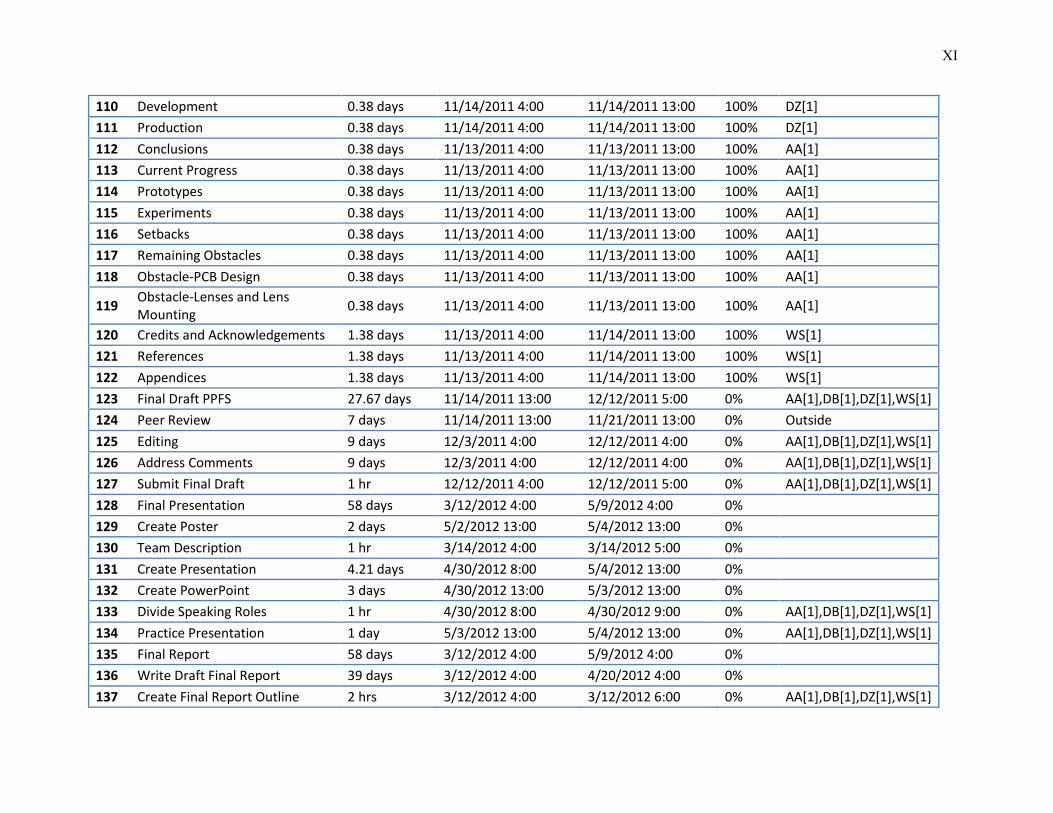
XI
110 Development 0.38 days 11/14/2011 4:00 11/14/2011 13:00 100% DZ[1]
111 Production 0.38 days 11/14/2011 4:00 11/14/2011 13:00 100% DZ[1]
112 Conclusions 0.38 days 11/13/2011 4:00 11/13/2011 13:00 100% AA[1]
113 Current Progress 0.38 days 11/13/2011 4:00 11/13/2011 13:00 100% AA[1]
114 Prototypes 0.38 days 11/13/2011 4:00 11/13/2011 13:00 100% AA[1]
115 Experiments 0.38 days 11/13/2011 4:00 11/13/2011 13:00 100% AA[1]
116 Setbacks 0.38 days 11/13/2011 4:00 11/13/2011 13:00 100% AA[1]
117 Remaining Obstacles 0.38 days 11/13/2011 4:00 11/13/2011 13:00 100% AA[1]
118 Obstacle-PCB Design 0.38 days 11/13/2011 4:00 11/13/2011 13:00 100% AA[1]
119 Obstacle-Lenses and Lens Mounting
0.38 days 11/13/2011 4:00 11/13/2011 13:00 100% AA[1]
120 Credits and Acknowledgements 1.38 days 11/13/2011 4:00 11/14/2011 13:00 100% WS[1]
121 References 1.38 days 11/13/2011 4:00 11/14/2011 13:00 100% WS[1]
122 Appendices 1.38 days 11/13/2011 4:00 11/14/2011 13:00 100% WS[1]
123 Final Draft PPFS 27.67 days 11/14/2011 13:00 12/12/2011 5:00 0% AA[1],DB[1],DZ[1],WS[1]
124 Peer Review 7 days 11/14/2011 13:00 11/21/2011 13:00 0% Outside
125 Editing 9 days 12/3/2011 4:00 12/12/2011 4:00 0% AA[1],DB[1],DZ[1],WS[1]
126 Address Comments 9 days 12/3/2011 4:00 12/12/2011 4:00 0% AA[1],DB[1],DZ[1],WS[1]
127 Submit Final Draft 1 hr 12/12/2011 4:00 12/12/2011 5:00 0% AA[1],DB[1],DZ[1],WS[1]
128 Final Presentation 58 days 3/12/2012 4:00 5/9/2012 4:00 0%
129 Create Poster 2 days 5/2/2012 13:00 5/4/2012 13:00 0%
130 Team Description 1 hr 3/14/2012 4:00 3/14/2012 5:00 0%
131 Create Presentation 4.21 days 4/30/2012 8:00 5/4/2012 13:00 0%
132 Create PowerPoint 3 days 4/30/2012 13:00 5/3/2012 13:00 0%
133 Divide Speaking Roles 1 hr 4/30/2012 8:00 4/30/2012 9:00 0% AA[1],DB[1],DZ[1],WS[1]
134 Practice Presentation 1 day 5/3/2012 13:00 5/4/2012 13:00 0% AA[1],DB[1],DZ[1],WS[1]
135 Final Report 58 days 3/12/2012 4:00 5/9/2012 4:00 0%
136 Write Draft Final Report 39 days 3/12/2012 4:00 4/20/2012 4:00 0%
137 Create Final Report Outline 2 hrs 3/12/2012 4:00 3/12/2012 6:00 0% AA[1],DB[1],DZ[1],WS[1]

XII
138 Divide Work 1 hr 3/12/2012 6:00 3/12/2012 7:00 0% AA[1],DB[1],DZ[1],WS[1]
139 Write Draft 37 days 3/12/2012 7:00 4/18/2012 7:00 0% AA[1],DB[1],DZ[1],WS[1]
140 Executive Summary 1 day 4/4/2012 4:00 4/5/2012 4:00 0%
141 Compile 1 day 4/19/2012 4:00 4/20/2012 4:00 0%
142 Edit Final Report 18 days 4/21/2012 4:00 5/9/2012 4:00 0%
143 Read and discuss comments 1 day 4/21/2012 4:00 4/22/2012 4:00 0% AA[1],DB[1],DZ[1],WS[1]
144 Address Comments 17 days 4/22/2012 4:00 5/9/2012 4:00 0% AA[1],DB[1],DZ[1],WS[1]
145 Website 163.83 days 10/17/2011 8:00 3/29/2012 4:00 96%
146 Post Website 56.21 days 10/17/2011 8:00 12/12/2011 13:00 100%
147 Home Page 5.33 days 10/17/2011 8:00 10/23/2011 8:00 100% DZ[128],WS[128]
148 Bios 5.33 days 10/17/2011 8:00 10/23/2011 8:00 100% DZ[128],WS[128]
149 Project Description 5.33 days 10/17/2011 8:00 10/23/2011 8:00 100% DZ[128],WS[128]
150 Current Progress 5.33 days 10/17/2011 8:00 10/23/2011 8:00 100% DZ[128],WS[128]
151 WBS 1 hr 12/12/2011 12:00 12/12/2011 13:00 100% WS[1]
152 Upgrade Website 1 day 3/28/2012 4:00 3/29/2012 4:00 0% WS[1]
153 Keep Website Updated 0 days 12/13/2011 4:00 12/13/2011 4:00 0% DZ[0],WS[0]
154 Presentations 378.67 days 4/13/2011 4:00 4/27/2012 4:00 59%
155 Presentation 1 5.38 days 10/16/2011 8:00 10/21/2011 17:00 100% DB[1],AA[1]
156 Presentation 2 13.29 days 11/25/2011 8:00 12/8/2011 16:00 100% DZ[1],WS[1]
157 Presentation 3 7.33 days 2/20/2012 4:00 2/27/2012 13:00 0%
158 Presentation 4 6 days 4/21/2012 4:00 4/27/2012 4:00 0%
159 Fridays Presentation 0.33 days 11/11/2011 4:00 11/11/2011 13:00 100% AA[1],DB[1],DZ[1],WS[1]
160 Fridays Presentation 2 1 hr 4/13/2011 4:00 4/13/2011 5:00 0% AA[1],DB[1],DZ[1],WS[1]
161 Updated Poster 2 days 11/7/2011 8:00 11/9/2011 8:00 0% WS[1]
162 Updated Poster 2 1 day 4/10/2011 4:00 4/11/2011 4:00 0%
163 Demos Ready 1 day 4/10/2011 4:00 4/11/2011 4:00 0%
164 Project Brief for Industrial Consultant
1 day 2/26/2011 13:00 2/27/2011 13:00 0%
165 Design 208.83 days? 10/3/2011 8:00 4/29/2012 4:00 45%

XIII
166 Critical Path 101.38 days 1/4/2012 4:00 4/14/2012 13:00 0%
167 Physical 62.67 days 1/9/2012 13:00 3/12/2012 5:00 0%
168 Buy Helmet for Prototype 1 day 1/9/2012 13:00 1/10/2012 13:00 0%
169 Preliminary Mounting and Optics
14.08 days 1/9/2012 13:00 1/23/2012 15:00 0%
170 Optics 8 days 1/9/2012 13:00 1/17/2012 13:00 0%
171 Identify Lenses 1 day 1/9/2012 13:00 1/10/2012 13:00 0%
172 Order Lenses 7 days 1/10/2012 13:00 1/17/2012 13:00 0%
173 Design & Testing 6.08 days 1/17/2012 13:00 1/23/2012 15:00 0%
174 Mock Mounting Setup 1 day 1/17/2012 13:00 1/18/2012 13:00 0%
175 Vision Focus Testing 5.08 days 1/18/2012 13:00 1/23/2012 15:00 0%
176 Define Test Method 4 days 1/18/2012 13:00 1/22/2012 13:00 0%
177 Perform Test 1 day 1/22/2012 13:00 1/23/2012 13:00 0%
178 Evaluate Results 2 hrs 1/23/2012 13:00 1/23/2012 15:00 0%
179 Adjust if Test Failed 0 days 1/23/2012 15:00 1/23/2012 15:00 0%
180 Comfort Testing 5.08 days 1/18/2012 13:00 1/23/2012 15:00 0%
181 Define Test Method 4 days 1/18/2012 13:00 1/22/2012 13:00 0%
182 Perform Test 1 day 1/22/2012 13:00 1/23/2012 13:00 0%
183 Evaluate Results 2 hrs 1/23/2012 13:00 1/23/2012 15:00 0%
184 Adjust if Test Failed 0 days 1/23/2012 15:00 1/23/2012 15:00 0%
185 Final Helmet Design 3 days 2/14/2012 4:00 2/17/2012 4:00 0%
186 Finalize Layout 1 day 2/14/2012 4:00 2/15/2012 4:00 0%
187 Finalize Mounting 1 day 2/15/2012 4:00 2/16/2012 4:00 0%
188 Finalize Routing 1 day 2/16/2012 4:00 2/17/2012 4:00 0%
189 Build 4.67 days 3/7/2012 13:00 3/12/2012 5:00 0%
190 Mount Lenses 1 day 3/7/2012 13:00 3/8/2012 13:00 0% WS[1]
191 Build Enclosure 4.04 days 3/8/2012 4:00 3/12/2012 5:00 0% WS[1]
192 Build Casing 4 days 3/8/2012 4:00 3/12/2012 4:00 0% WS[1]
193 Place PCB in Casing 1 hr 3/12/2012 4:00 3/12/2012 5:00 0%
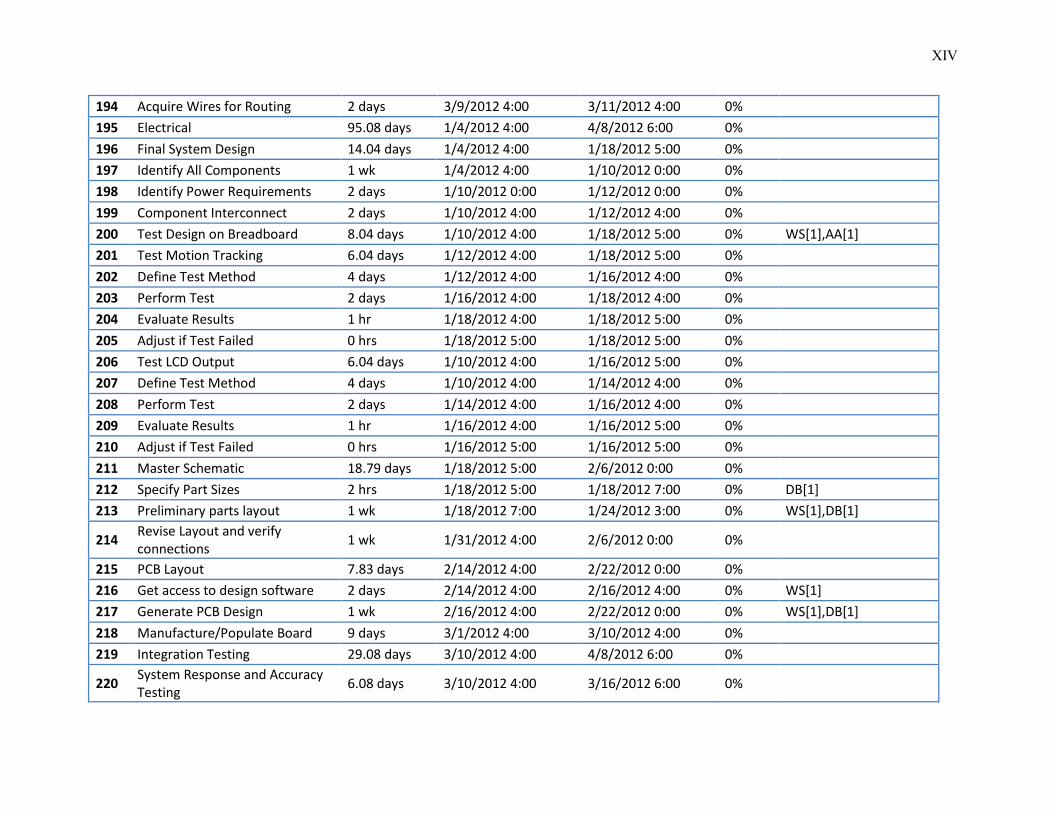
XIV
194 Acquire Wires for Routing 2 days 3/9/2012 4:00 3/11/2012 4:00 0%
195 Electrical 95.08 days 1/4/2012 4:00 4/8/2012 6:00 0%
196 Final System Design 14.04 days 1/4/2012 4:00 1/18/2012 5:00 0%
197 Identify All Components 1 wk 1/4/2012 4:00 1/10/2012 0:00 0%
198 Identify Power Requirements 2 days 1/10/2012 0:00 1/12/2012 0:00 0%
199 Component Interconnect 2 days 1/10/2012 4:00 1/12/2012 4:00 0%
200 Test Design on Breadboard 8.04 days 1/10/2012 4:00 1/18/2012 5:00 0% WS[1],AA[1]
201 Test Motion Tracking 6.04 days 1/12/2012 4:00 1/18/2012 5:00 0%
202 Define Test Method 4 days 1/12/2012 4:00 1/16/2012 4:00 0%
203 Perform Test 2 days 1/16/2012 4:00 1/18/2012 4:00 0%
204 Evaluate Results 1 hr 1/18/2012 4:00 1/18/2012 5:00 0%
205 Adjust if Test Failed 0 hrs 1/18/2012 5:00 1/18/2012 5:00 0%
206 Test LCD Output 6.04 days 1/10/2012 4:00 1/16/2012 5:00 0%
207 Define Test Method 4 days 1/10/2012 4:00 1/14/2012 4:00 0%
208 Perform Test 2 days 1/14/2012 4:00 1/16/2012 4:00 0%
209 Evaluate Results 1 hr 1/16/2012 4:00 1/16/2012 5:00 0%
210 Adjust if Test Failed 0 hrs 1/16/2012 5:00 1/16/2012 5:00 0%
211 Master Schematic 18.79 days 1/18/2012 5:00 2/6/2012 0:00 0%
212 Specify Part Sizes 2 hrs 1/18/2012 5:00 1/18/2012 7:00 0% DB[1]
213 Preliminary parts layout 1 wk 1/18/2012 7:00 1/24/2012 3:00 0% WS[1],DB[1]
214 Revise Layout and verify connections
1 wk 1/31/2012 4:00 2/6/2012 0:00 0%
215 PCB Layout 7.83 days 2/14/2012 4:00 2/22/2012 0:00 0%
216 Get access to design software 2 days 2/14/2012 4:00 2/16/2012 4:00 0% WS[1]
217 Generate PCB Design 1 wk 2/16/2012 4:00 2/22/2012 0:00 0% WS[1],DB[1]
218 Manufacture/Populate Board 9 days 3/1/2012 4:00 3/10/2012 4:00 0%
219 Integration Testing 29.08 days 3/10/2012 4:00 4/8/2012 6:00 0%
220 System Response and Accuracy Testing
6.08 days 3/10/2012 4:00 3/16/2012 6:00 0%
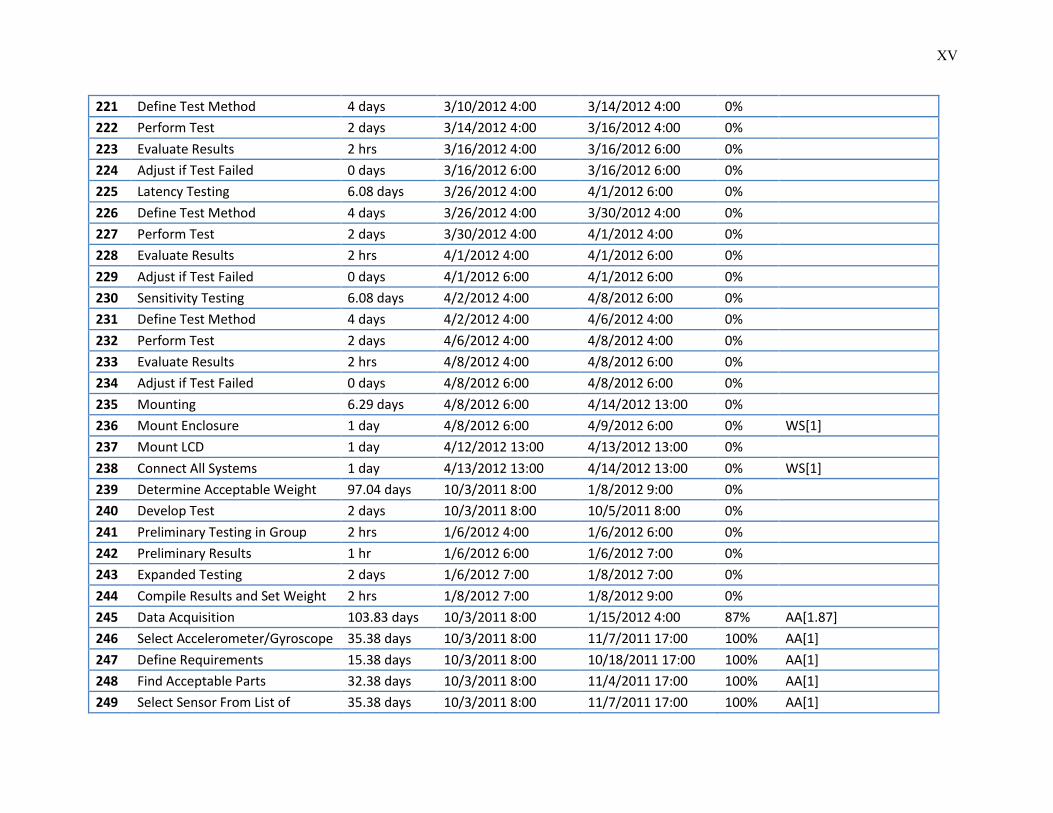
XV
221 Define Test Method 4 days 3/10/2012 4:00 3/14/2012 4:00 0%
222 Perform Test 2 days 3/14/2012 4:00 3/16/2012 4:00 0%
223 Evaluate Results 2 hrs 3/16/2012 4:00 3/16/2012 6:00 0%
224 Adjust if Test Failed 0 days 3/16/2012 6:00 3/16/2012 6:00 0%
225 Latency Testing 6.08 days 3/26/2012 4:00 4/1/2012 6:00 0%
226 Define Test Method 4 days 3/26/2012 4:00 3/30/2012 4:00 0%
227 Perform Test 2 days 3/30/2012 4:00 4/1/2012 4:00 0%
228 Evaluate Results 2 hrs 4/1/2012 4:00 4/1/2012 6:00 0%
229 Adjust if Test Failed 0 days 4/1/2012 6:00 4/1/2012 6:00 0%
230 Sensitivity Testing 6.08 days 4/2/2012 4:00 4/8/2012 6:00 0%
231 Define Test Method 4 days 4/2/2012 4:00 4/6/2012 4:00 0%
232 Perform Test 2 days 4/6/2012 4:00 4/8/2012 4:00 0%
233 Evaluate Results 2 hrs 4/8/2012 4:00 4/8/2012 6:00 0%
234 Adjust if Test Failed 0 days 4/8/2012 6:00 4/8/2012 6:00 0%
235 Mounting 6.29 days 4/8/2012 6:00 4/14/2012 13:00 0%
236 Mount Enclosure 1 day 4/8/2012 6:00 4/9/2012 6:00 0% WS[1]
237 Mount LCD 1 day 4/12/2012 13:00 4/13/2012 13:00 0%
238 Connect All Systems 1 day 4/13/2012 13:00 4/14/2012 13:00 0% WS[1]
239 Determine Acceptable Weight 97.04 days 10/3/2011 8:00 1/8/2012 9:00 0%
240 Develop Test 2 days 10/3/2011 8:00 10/5/2011 8:00 0%
241 Preliminary Testing in Group 2 hrs 1/6/2012 4:00 1/6/2012 6:00 0%
242 Preliminary Results 1 hr 1/6/2012 6:00 1/6/2012 7:00 0%
243 Expanded Testing 2 days 1/6/2012 7:00 1/8/2012 7:00 0%
244 Compile Results and Set Weight 2 hrs 1/8/2012 7:00 1/8/2012 9:00 0%
245 Data Acquisition 103.83 days 10/3/2011 8:00 1/15/2012 4:00 87% AA[1.87]
246 Select Accelerometer/Gyroscope 35.38 days 10/3/2011 8:00 11/7/2011 17:00 100% AA[1]
247 Define Requirements 15.38 days 10/3/2011 8:00 10/18/2011 17:00 100% AA[1]
248 Find Acceptable Parts 32.38 days 10/3/2011 8:00 11/4/2011 17:00 100% AA[1]
249 Select Sensor From List of 35.38 days 10/3/2011 8:00 11/7/2011 17:00 100% AA[1]

XVI
Acceptable Parts
250 Test Output of Motion Sensor 1 hr 11/23/2011 13:00 11/23/2011 14:00 100% AA[1]
251 Design Motion Tracking Circuit 72 days 11/4/2011 4:00 1/15/2012 4:00 32% AA[1]
252 Define Implementation Strategy 34 days 11/4/2011 4:00 12/8/2011 4:00 100% AA[1.97]
253 Determine Analog vs Digital 1 day 11/4/2011 4:00 11/5/2011 4:00 100% AA[1]
254 Determine I2C vs SPI 1 day 12/7/2011 4:00 12/8/2011 4:00 100% AA[1]
255 Determine Acceptable Noise Level
5.04 days 1/9/2012 4:00 1/14/2012 5:00 0%
256 Develop Test 5.04 days 1/9/2012 4:00 1/14/2012 5:00 0%
257 Develop Test Method 4 days 1/9/2012 4:00 1/13/2012 4:00 0%
258 Perform Test 1 day 1/13/2012 4:00 1/14/2012 4:00 0%
259 Evaluate Results and Define Acceptable Noise Level
1 hr 1/14/2012 4:00 1/14/2012 5:00 0%
260 Build on Breadboard 4 days 11/19/2011 4:00 11/23/2011 13:00 100% AA[1]
261 Design FPGA Module for DAQ 3 days 1/9/2012 4:00 1/12/2012 4:00 0% AA[1]
262 Design Sensors to be Implemented in PCB Design
3 days 1/12/2012 4:00 1/15/2012 4:00 0% AA[1]
263 Make Design Adjustments 2 days 1/12/2012 4:00 1/14/2012 4:00 0% AA[1]
264 Video Processing 85 days 10/17/2011 4:00 1/10/2012 4:00 40% WS[1]
265 Select LCDs 42.38 days 10/17/2011 4:00 11/28/2011 13:00 100% WS[1]
266 Define Requirements 1 day 10/17/2011 4:00 10/18/2011 4:00 100% WS[1]
267 Research Available Parts 2 days 10/18/2011 4:00 10/20/2011 4:00 100% WS[1]
268 Make Selection 1 day 11/27/2011 13:00 11/28/2011 13:00 100% WS[1]
269 ADC 3 days 1/4/2012 4:00 1/7/2012 4:00 0% WS[1]
270 Program FPGA 3 days 1/7/2012 4:00 1/10/2012 4:00 0% WS[1]
271 Software 208.83 days? 10/3/2011 8:00 4/29/2012 4:00 73% DZ[1]
272 Define Requirements 2 days 10/29/2011 4:00 10/31/2011 4:00 0% DZ[1]
273 Make Overall Software Design 2 days 11/1/2011 4:00 11/3/2011 4:00 0% DZ[1]
274 Select Graphics Engine 21.21 days 10/3/2011 8:00 10/24/2011 13:00 100% DZ[1]

XVII
275 Define Requirements 17.21 days 10/3/2011 8:00 10/20/2011 13:00 100% DZ[1]
276 Research Available Software 18.21 days 10/3/2011 8:00 10/21/2011 13:00 100% DZ[1]
277 Select Software Based on Needs 21.21 days 10/3/2011 8:00 10/24/2011 13:00 100% DZ[1]
278 Identify Video Output of Engine 1 day 11/10/2011 4:00 11/11/2011 4:00 100% DZ[1]
279 Use Engine to Generate Usable Output
1 hr 11/11/2011 13:00 11/11/2011 14:00 100% DZ[1]
280 Build Demonstration Environment
114 days 1/6/2012 4:00 4/29/2012 4:00 0% DZ[1]
281 Research Using Autodesk Models with Engine
1 day 1/6/2012 4:00 1/7/2012 4:00 0% DZ[1]
282 Define Process for Importing Autodesk Models
1 day 1/6/2012 4:00 1/7/2012 4:00 0% DZ[1]
283 Import Model 1 day 4/28/2012 4:00 4/29/2012 4:00 0% DZ[1]
284 Input Interface Software 14.67 days? 2/6/2012 8:00 2/21/2012 0:00 0% DZ[1]
285 Determine Method of Communication with Sensors
2 days 2/6/2012 8:00 2/8/2012 8:00 0% DZ[1],AA[1]
286 Define Program Behavior 3 days 2/8/2012 8:00 2/11/2012 8:00 0% DZ[1]
287 Develop Test Method to Verify Working Code
2 days 2/13/2012 4:00 2/15/2012 4:00 0% DZ[1]
288 Write Code 5.83 days? 2/15/2012 4:00 2/21/2012 0:00 0% DZ[1]
289 Write Code 0 days? 2/21/2012 0:00 2/21/2012 0:00 0%
290 Implement Software Noise Filters
1 day? 2/15/2012 4:00 2/16/2012 4:00 0%
291 Test Code 1 day 2/16/2012 4:00 2/17/2012 4:00 0% DZ[1]
292 Consolidate Software 1 wk 2/23/2012 0:00 2/28/2012 20:00 0%
293 Purchase Parts 34.38 days 11/12/2011 4:00 12/16/2011 13:00 0% AA[1],DB[1],DZ[1],WS[1]