Embed Size (px)
Citation preview

Project no.: 219123
Project acronym
REALISEGRID
Project title:
REseArch, methodoLogIes and technologieS for the effective development of pan-European key GRID infrastructures to support the
achievement of a reliable, competitive and sustainable electricity supply
Instrument: Collaborative project
Thematic priority: ENERGY.2007.7.3.4 Analysis and scenarios of energy infrastructure evolution
Start date of project: 01 September 2008 Duration: 30 months
D3.3.1 Possible criteria to assess technical-economic and strategic benefits of specific transmission projects
Final
Actual submission date: 2010-04-29
Organisation name of lead contractor for this deliverable: ERSE (ENEA – Ricerca sul Sistema Elettrico)
Dissemination Level
PU Public X PP Restricted to other programme participants (including the Commission Services) RE Restricted to a group specified by the consortium (including the Commission Services) CO Confidential , only for members of the consortium (including the Commission Services)


D3.3.1 Possible criteria to assess technical-economic and strategic benefits of specific transmission projects 3
Deliverable number: D3.3.1 Deliverable title: Possible criteria to assess technical-economic and strategic benefits of specific
transmission projects Work package: WP3.3 Implementation of a comprehensive framework to assess technical-economic
and strategic benefits of transmission expansions Lead contractor: ERSE (former CESI-RI)
Quality Assurance
Status of deliverable Action By Date Verified (WP-leader) Gianluigi Migliavacca, ERSE (former CESI RICERCA) 2010-04-29 Approved (Coordinator) Gianluigi Migliavacca, ERSE (former CESI RICERCA) 2010-04-29
Submitted
Author(s) Name Organisation E-mail Angelo L’Abbate ERSE (former CESI RICERCA) [email protected] Ilaria Losa ERSE (former CESI RICERCA) [email protected] Gianluigi Migliavacca ERSE (former CESI RICERCA) [email protected] Ana R. Ciupuliga TU Delft [email protected] Madeleine Gibescu TU Delft [email protected] Hans Auer TU Wien - EEG [email protected] Karl Zach TU Wien - EEG [email protected]
Abstract
The present report, after providing an updated overview of the research in the field of transmission expansion planning methods, describes and analyses in detail the criteria used for a quantitative assessment of the different benefits deriving from transmission expansion to the society as a whole. The final goal is then to present and propose a new approach for addressing transmission investment cost-benefit analyses via multi-criteria methodology in a systematic and structured way.


D3.3.1 Possible criteria to assess technical-economic and strategic benefits of specific transmission projects 5
TABLE OF CONTENTS
Page
ACRONYMS AND DEFINITIONS .............................................................................................. 7
1 EXECUTIVE SUMMARY .................................................................................................... 9
2 INTRODUCTION ................................................................................................................ 11 2.1 Objectives of this deliverable..................................................................................... 11 2.2 Expected outcome ...................................................................................................... 12 2.3 Approach.................................................................................................................... 14
3 TRANSMISSION EXPANSION PLANNING.................................................................... 16 3.1 Introduction................................................................................................................ 16 3.2 Literature review of transmission planning methods ................................................. 16
3.2.1 Overview and classification ........................................................................... 16 3.2.2 Regulated systems methods ........................................................................... 17 3.2.3 Restructured systems methods ....................................................................... 22
3.3 The transmission planning process ............................................................................ 24
4 THE BENEFITS OF TRANSMISSION EXPANSION....................................................... 27 4.1 Introduction................................................................................................................ 27 4.2 Improved system reliability........................................................................................ 28
4.2.1 Introduction .................................................................................................... 28 4.2.2 Innovative approaches to account for continuity of supply ........................... 28 4.2.3 Methodologies................................................................................................ 30 4.2.4 General approaches and methods ................................................................... 31 4.2.5 Computing procedures and techniques .......................................................... 32 4.2.6 Criteria-based approach: continuity indicators .............................................. 37
4.3 Market benefits .......................................................................................................... 38 4.3.1 Unlock of efficient power generation............................................................. 38 4.3.2 Enhanced competitiveness of electricity markets .......................................... 42
4.4 RES exploitation and sustainability benefits.............................................................. 50 4.4.1 Introduction .................................................................................................... 50 4.4.2 The sustainability benefits of transmission expansion................................... 52 4.4.3 Methodologies to investigate sustainability improvement............................. 55
4.5 Losses reduction......................................................................................................... 66 4.5.1 Introduction .................................................................................................... 66 4.5.2 Load factor, loss load factor and losses computation..................................... 67 4.5.3 The importance of minimising losses............................................................. 68
4.6 Facilitation of distributed generation integration by improved coordination of transmission and distribution planning (SmartGrids) ................................................ 68 4.6.1 Methodologies to investigate advantages from a smart infrastructure
development ................................................................................................... 70 4.6.2 Analytical approach for the economic trade-off analyses .............................. 72
4.7 Controllability of power flows (via FACTS and HVDC).......................................... 74 4.8 Summary on transmission expansion benefits ........................................................... 75

D3.3.1 Possible criteria to assess technical-economic and strategic benefits of specific transmission projects 6
5 APPROACH AND TOOL TO ASSESS BENEFITS OF TRANSMISSION EXPANSION........................................................................................................................ 76 5.1 A new methodology for the assessment of transmission expansion benefits ............ 76
5.1.1 Theory of multi-criteria cost-benefit analysis ................................................ 76 5.1.2 Proposal of a set of benefits ........................................................................... 79 5.1.3 A small example of methodology application................................................ 81 5.1.4 Calculation of the social welfare improvement.............................................. 82 5.1.5 Calculation of the impact on emissions.......................................................... 84 5.1.6 Ranking of solutions and sensitivity analysis ................................................ 84
5.2 Characteristics of the new tool................................................................................... 85 - it has to address the quantification of the benefits in a computationally
efficient way................................................................................................... 85 - it has to be suitable for power system (optimisation) and market studies,
especially for large size systems .................................................................... 85 - it has to be suitable for reliability studies (probabilistic criteria)................... 85 - it has to incorporate emission amount and cost calculations ......................... 85 - it has to be flexible, expandable and possibly linkable to other existing
tools ................................................................................................................ 85
6 CONCLUSIONS................................................................................................................... 88
7 REFERENCES...................................................................................................................... 91

D3.3.1 Possible criteria to assess technical-economic and strategic benefits of specific transmission projects 7
ACRONYMS AND DEFINITIONS AC: Alternating Current.
Adequacy: ability of the electric system to supply the aggregate electrical demand and meet energy requirements of the customers at all times, taking into account scheduled and unscheduled outages of system facilities (See also Reliability, Security).
ATSOI: previous association of the Irish transmission system operators (See also ENTSO-E).
BALTSO: previous association of the Baltic transmission system operators of Estonia, Latvia and Lithuania (See also ENTSO-E).
Control area: portion of the generation and transmission system controlled by a single TSO. It corresponds to a country’s area in most cases (See also TSO).
DC: Direct Current.
EC: European Commission.
EENS: Expected Energy Not Supplied.
EHV: Extra High Voltage.
EIA: Environmental Impact Assessment.
ETSO: European Transmission System Operators association (See also ENTSO-E).
ENTSO-E: European Network of Transmission System Operators for Electricity. It is a new organisation grouping 42 European Transmission System Operators established in late 2008 and operative from July 2009. Previous associations such as ETSO, UCTE, NORDEL, BALTSO, UKTSOA and ATSOI have been dissolved and their tasks and functions moved to the new organisation (See also ETSO, UCTE, NORDEL, BALTSO, UKTSOA and ATSOI).
EU: European Union.
EU27: 27 EU Member States (from 2007).
FACTS: Flexible Alternating Current Transmission System. FACTS are power electronics-based devices able to control different parameters (including voltage amplitude and angular difference, active and reactive power flow, impedance) in power systems.
HVAC: High Voltage Alternating Current.
HVDC: High Voltage Direct Current. An HVDC link consists of a cable or overhead line where current is transmitted in direct (instead of alternating) mode.
ISO: Independent System Operator. An ISO is responsible for the management of a transmission system, but does not own the transmission assets (See also TSO).
LOLE: Loss of Load Expectation. It is the expected amount of energy not served over some time frame.
LOLP: Loss of Load Probability. It is the probability over some period of time that the power system will fail to provide uninterrupted service to customers.
(n-1) [or (N-1)] criterion: rule according to which elements remaining in operation after failure of a single network element (such as transmission line / transformer or generating unit) must be
D3.3.1 Possible criteria to assess technical-economic and strategic benefits of specific transmission projects 8
capable of accommodating the change of flows in the network caused by that single failure, maintaining the required level of network security.
NORDEL: previous association of Nordic transmission system operators of Denmark, Finland, Iceland, Norway and Sweden (See also ENTSO-E).
NTC: Net Transfer Capacity. NTC is the maximum power exchange between two areas which is compatible with security standards applicable in both areas, taking into account technical uncertainties as to future network conditions. The NTC values represent technical constraints used in many transmission capacity allocation methods. Furthermore, non-binding NTC values are periodically published by ETSO. NTC=TTC-TRM (See also TTC and TRM).
PST: Phase Shifting Transformer. It is a mechanical device able to control active power flow in power systems by regulating voltage angular difference.
Reliability: it describes the degree of performance of the elements of the bulk electric system that results in electricity being delivered to customers within acceptable standards and in the amount desired. Reliability on the transmission level may be measured by the frequency, duration, and magnitude of adverse effects on the electric supply / transport / generation. Reliability is the sum of adequacy and security (See also Adequacy and Security).
RES: Renewable Energy Source.
SEA: Strategic Environmental Assessment.
Security: it is the ability of the electric system to withstand sudden disturbances, such as electric short circuits or unanticipated loss of system components. Another aspect of security is system integrity, which is the ability to maintain interconnected operations (See also Security of Supply).
Security of supply: it is the ability of the electric power system to provide electricity to end-users with a specified level of continuity and quality in a sustainable manner (See also Security).
Stability: it is the ability of an electrical system to withstand normal and abnormal system conditions or disturbances and to regain a state of equilibrium.
TEN-E: Trans-European Networks for Electricity.
TRM: Transmission Reliability Margin. It is a security margin to cope with uncertainties in the computed TTC arising from unintended deviations in physical flows, emergency exchanges or inaccuracies (See also TTC, NTC).
TSO: Transmission System Operator. It owns the transmission assets and is responsible for the management of the transmission system in its control area (See also Control area, ISO).
TTC: Total Transfer Capacity. It is the maximum exchange between two areas which is compatible with operational security standards applicable to both areas, where future network conditions, generation and load patterns are perfectly known in advance (See also NTC, TRM).
UCTE: Union for the Coordination of the Transport of Electricity. It is the previous association of the transmission system operators of continental Europe (See also ENTSO-E).
UK: United Kingdom.
UKTSOA: previous association of the British transmission system operators (See also ENTSO-E).
WAMS: Wide Area Measurement System.

D3.3.1 Possible criteria to assess technical-economic and strategic benefits of specific transmission projects 9
1 EXECUTIVE SUMMARY In Europe, drivers concerning security of energy supply, competitiveness and environmental sustainability – the three key targets set by the European Union (EU)’s energy policy – may have a significant impact on the design and the operation of the electric power system. This is particularly true for the backbone of the electric power system, the transmission system, which is already experiencing different issues. The transmission network expansion planning is a crucial and also very complex process and recent trends and challenges contribute to make it even more complicate. First, the restructuring of the electricity markets introduces further uncertainties within current transmission planning processes. In the past, before the electricity market liberalisation took place, the transmission network was expanded with the aim to minimise both generation and transmission costs, while meeting static and dynamic technical constraints, to ensure a secure and economically efficient operation. Today, in a competitive market, the TSO (Transmission System Operator), in charge of the sole transmission after the utilities’ unbundling, plans the expansion of its network by minimising transmission cost (investment and operation), overcoming bottlenecks and pursuing maximum social welfare, when requested by specific regulation, while meeting static and dynamic technical constraints to ensure a secure and economically efficient operation. Resolving then the trade-off between minimum transmission investment cost versus maximum social welfare is a complicated task. Moreover, the penetration of variable Renewable Energy Sources (RES) brings additional uncertainties posing further challenges to transmission planners: they have in fact to reliably integrate variable RES power plants into the grids and cope with rapid and less predictable flows changes so as to preserve an adequate level of security for the system. In this frame, transmission expansion planning criteria crucially need to be revised and expanded in order to design flexible, coordinated and secure transmission networks based on modern architectural schemes and including innovative technological solutions. More robust methodologies for transmission planning must be pursued to address the above challenges faced by transmission planners. A crucial stage of the transmission planning process is represented by the cost-benefit analysis of the different grid expansion options to be ranked towards the final planners decision-making. In this context, the present report, after illustrating the transmission planning methods available in the scientific literature, focuses on cost-benefit analysis, providing an in-depth investigation of the different possible benefits resulting from transmission expansion and their quantitative assessment criteria. This serves as a basis for introducing a new approach accounting for all these benefits evaluation criteria in a complete and structured way. This task, especially in a liberalised power system, generally represents a rather complicate stage as the evaluation strongly depends on the viewpoint taken for each considered benefit as well. The proposed methodology, instead, while considering the standpoints of the different players - TSOs, producers, customers - evaluates then the transmission expansion benefits from the society’s perspective: this is a systemic approach and is applied by a multi-criteria analysis. This type of methodology is needed to address different criteria for evaluating possible benefits of expansion alternatives. These criteria encompassing the factors that can be significant for a decision-maker must avoid double counting, which can occur when a criterion implicitly includes another one. Within this purpose, it can be useful to organize the criteria in a top-down tree starting with a general classification (e.g. economic criteria, environmental criteria) and branching down up to reach the leaves that represent fundamental, directly measurable criteria. The measurement of these criteria can be provided either by absolute measurements (indicators) or through a differential measurement with respect to a base case (impact). An evaluation matrix

D3.3.1 Possible criteria to assess technical-economic and strategic benefits of specific transmission projects 10
matching the criteria and the possible alternatives allows to combine all the criteria evaluations of a single alternative weighing them in order to provide a single ranking number. However, being every criterion measured by means of a (potentially) different unit, a straightforward weighed sum of criteria for each alternative is not meaningful. Additionally, even when a conversion of every criterion measurement into an economic parameter (e.g. €) is feasible, there could be the difficulty in summing up non consistent figures. Thus, all the criteria indicators measuring benefits - but also costs - for each alternative need to be converted into one only, possibly a-dimensional, utility value. This element expresses then the level of satisfaction or approval that a single value of the indicator has towards the different players – TSOs, producers, consumers – and the society as a whole. Typically, a utility value equal to zero expresses no satisfaction, whereas a figure equal to one expresses maximum satisfaction. The function performing this conversion is in general called a utility function. All the utility functions should have the same domain, so as to obtain mutually comparable values. Once all the indicators have been converted into one only utility parameter, all the indicators values relevant to a single alternative may be linearly combined so as to calculate one only ranking parameter attached to that alternative. In general, a weighed linear combination is calculated, making use of a weights vector. This vector incorporates the reciprocal importance (for the different players) of one criterion with respect to the others. The final goal is to provide the EU, the European stakeholders, TSOs and regulators with key elements, criteria and a new approach for systematically addressing cost-benefit analyses for ranking and selecting the most feasible option(s) among the possible reinforcement solutions of transmission expansion planning processes.

D3.3.1 Possible criteria to assess technical-economic and strategic benefits of specific transmission projects 11
2 INTRODUCTION 2.1 Objectives of this deliverable The goal of the present report is three-fold, as it aims at:
- providing an updated overview of the research in the field of transmission expansion planning methods;
- describing and analysing in detail the criteria used for a quantitative assessment of the different benefits deriving from transmission expansion to the society as a whole;
- proposing a new approach for addressing transmission investment cost-benefit analyses in a systematic and structured way.
In Europe, reference for this analysis, drivers concerning security of energy supply, competitiveness and environmental sustainability – the three key targets set by the European Union (EU)’s energy policy – may have a significant impact on the design and the operation of the electric power system. This is particularly true for the backbone of the electric power system, the transmission system, which is already experiencing different issues. The transmission network expansion planning is a crucial and also very complex process and recent trends and challenges contribute to make it even more complicate. First, the restructuring of the electricity markets introduces further uncertainties within current transmission planning processes. In the past, before the electricity market liberalisation took place, the transmission network was expanded with the aim to minimise both generation and transmission costs, while meeting static and dynamic technical constraints, to ensure a secure and economically efficient operation. Today, in a competitive market, the TSO (Transmission System Operator), in charge of the sole transmission after the utilities’ unbundling, plans the expansion of its network by minimising transmission cost (investment and operation), overcoming bottlenecks and pursuing maximum social welfare, when requested by specific regulation, while meeting static and dynamic technical constraints to ensure a secure and economically efficient operation. Resolving then the trade-off between minimum transmission investment cost versus maximum social welfare is a complicated task. Moreover, the penetration of variable Renewable Energy Sources (RES) brings additional uncertainties posing further challenges to transmission planners: they have in fact to reliably integrate variable RES power plants into the grids and cope with rapid and less predictable flows changes so as to preserve an adequate level of security for the system. In this frame, transmission expansion planning criteria crucially need to be revised and expanded in order to design flexible, coordinated and secure transmission networks based on modern architectural schemes and including innovative technological solutions. More robust methodologies for transmission planning must be pursued to address the above challenges faced by transmission planners. A crucial stage of the transmission planning process is represented by the cost-benefit analysis of the different grid expansion options to be ranked towards the final planners decision-making. In this context, the present report, after illustrating the transmission planning methods available in the scientific literature, focuses on cost-benefit analysis, providing an in-depth investigation of the different possible benefits resulting from transmission expansion and their quantitative assessment criteria. This serves as a basis for introducing a new approach accounting for all these benefits evaluation criteria in a complete and structured way. This task, especially in liberalised power systems, generally represents a rather complicate stage as the evaluation strongly depends also on the local situation and the viewpoint taken for each considered benefit. For this reason a new approach to address the different issues and applying multi-criteria analyses in a systemic and systematic way is needed.

D3.3.1 Possible criteria to assess technical-economic and strategic benefits of specific transmission projects 12
The final goal is to provide the EU, the European stakeholders, TSOs and regulators with key elements, criteria and a new approach for systematically addressing cost-benefit analyses for ranking and selecting the most feasible option(s) among the possible reinforcement solutions of transmission expansion planning processes. 2.2 Expected outcome In order to achieve the above described objectives, this report has been structured to address some crucial stages of the transmission planning process in a top-down approach (from general to particular). Chapter 3 investigates different aspects of the transmission expansion planning. First, it reviews the general scientific literature of transmission expansion planning methods. In the latest years, the research in this field has seen the extension of classic methods to address new issues ahead of transmission planners. These challenges have especially concerned the greater uncertainty levels introduced by the power sector liberalisation and the growing penetration of variable (RES) generation and load. The different planning methods currently available in the scientific literature are based on deterministic and non-deterministic approaches and can be also grouped according to their technique, timeframe horizon and power system structure. Then, Chapter 3 introduces the general transmission planning process with its scheme and stages. The basic tasks of transmission grid planners can be summarised as in the following: to forecast the power and energy flows on the transmission network, drawing upon a set of scenarios of generation/demand evolution for the targeted period; to check whether acceptable technical limits might be exceeded, in standard conditions as well as in contingency cases; to devise a set of possible strategies/solutions to overcome the criticalities and to select the option(s) having the best cost-benefit performance. Chapter 3 also bridges to the cost-benefit analysis as crucial stage of the transmission planning, aiming at ranking the different expansion options upon a comparative techno-economic and socio-environmental assessment. This leads then to the selection of the most promising solution(s) towards the final planners’ decision-making. Chapter 4 focuses on the detailed description of the possible benefits provided by transmission expansion and their quantitative evaluation for a complete cost-benefit analysis. These benefits can be grouped as: system reliability improvement; quality and security increase; system losses reduction; congestion reduction and market benefits; environmental sustainability benefits; avoidance/postponement of investments; more efficient reserve management and frequency regulation; facilitation of distributed generation integration by a closer coordination of transmission and distribution grids; improvement of the dynamic behaviour of the power system. Concerning the reliability increase evaluation, the traditionally used indices, under the so-called criteria-based approach, include EENS (Expected Energy Not Supplied), LOLP (Loss Of Load Probability), LOLE (Loss Of Load Expectation). In addition, new reliability indices, like VOLL (Value Of Lost Load), IEAR (Interruption Energy Assessment Rate) and WTP (Willingness To Pay), are currently utilised in order to more consistently assess the economic impact of system reliability (value-based approach). The reduction of network congestions is a key benefit possibly deriving from transmission expansion. This would then allow the exploitation of transmission corridors and the unlock of more efficient power generation (‘substitution effect’), both within one market and on a multi-national basis. Also, the increased market competitiveness with a consequent reduction of market power potentials of dominant players, where present, may lead to a market price reduction (‘strategic effect’). Both the strategic and the substitution effects can be correctly measured in terms of a Social Welfare (SW) increase. When planning the utilisation of fast power flow controllers such as

D3.3.1 Possible criteria to assess technical-economic and strategic benefits of specific transmission projects 13
FACTS (Flexible Alternating Current Transmission System) and HVDC (High Voltage Direct Current), an additional benefit is the power flows controllability increase granted by these technologies. The environmental sustainability benefits by transmission expansion imply: a better exploitation of a diversified generation mix, also including variable RES-E (e.g. wind); CO2, NOx, SO2 emissions-related costs savings, in presence of more efficient generation, including also RES-E; the reduction of fossil fuel generation external costs (externalities); the decrease of internal (fossil fuel) operating costs. Transmission upgrades may also bring some additional environmental benefits in terms of land use reduction, visual and noise impact abatement and electromagnetic fields (EMF) level decrease: these aspects will be addressed in further works. A transmission expansion may also contribute to the avoidance and/or postponement of other (network and mostly generation) capacity investments. Other benefits, which in the future may gain higher consideration, relate to the improved interaction of transmission and distribution grids. This refers to systems either experiencing high shares of distributed generation resources or even evolving towards so-called SmartGrids schemes by a considerable distributed generation deployment. A transmission reinforcement may indeed bring about a more effective exploitation of distributed generation resources, while also better coordinating them when installed in different distribution networks, multiplying then the trading opportunities. This would also reduce the necessity to invest in the distribution grids and/or local smart devices. The effects of the integration of distributed generation facilitated by transmission reinforcement may also consist in the reduction of system losses, congestions and environmental benefits. Chapter 5 serves as a basis for introducing a new approach accounting for the different evaluation criteria of transmission expansion benefits in a complete and structured way. This is needed for representing a degree of optimality of a single expansion project towards a whole cost-benefit analysis. In this way, different alternatives can be then compared, the highest ranked being the most suitable to be financed and realized. This task, especially in a liberalised power system, generally represents a rather complicate stage as the evaluation strongly depends on the viewpoint taken for each considered benefit as well. The proposed methodology, instead, while considering the standpoints of the different players - TSOs, producers, customers - evaluates then the transmission expansion benefits from the society’s perspective: this is a systemic approach and is applied by a multi-criteria analysis. This type of methodology is needed to address different criteria for evaluating possible benefits of expansion alternatives. These criteria encompassing the factors that can be significant for a decision-maker must avoid double counting, which can occur when a criterion implicitly includes another one. Within this purpose, it can be useful to organize the criteria in a top-down tree starting with a general classification (e.g. economic criteria, environmental criteria) and branching down up to reach the leaves that represent fundamental, directly measurable criteria (e.g. Social Welfare, fuel consumption, CO2 emissions, etc.). The measurement of these criteria can be provided either by absolute measurements (indicators) or through a differential measurement with respect to a base case (impact). An evaluation matrix matching the criteria and the possible alternatives allows to combine all the criteria evaluations of a single alternative weighing them in order to provide a single ranking number. However, being every criterion measured by means of a (potentially) different unit, a straightforward weighed sum of criteria for each alternative is not meaningful. Additionally, even when a conversion of every criterion measurement into an economic parameter (e.g. €) is feasible, there could be the difficulty in summing up non consistent figures. Thus, all the criteria indicators measuring benefits - but also costs - for each alternative need to be converted into one only, possibly a-dimensional, utility value.

D3.3.1 Possible criteria to assess technical-economic and strategic benefits of specific transmission projects 14
This element expresses then the level of satisfaction or approval that a single value of the indicator has towards the different players – TSOs, producers, consumers – and the society as a whole. Typically, a utility value equal to zero expresses no satisfaction, whereas a figure equal to one expresses maximum satisfaction. The function performing this conversion is in general called a utility function. All the utility functions should have the same domain, so as to obtain mutually comparable values. Once all the indicators have been converted into one only utility parameter, all the indicators values relevant to a single alternative may be linearly combined so as to calculate one only ranking parameter attached to that alternative. In general, a weighed linear combination is calculated, making use of a weights vector. This vector incorporates the reciprocal importance (for the different players) of one criterion with respect to the others. A simple case serves as a demonstrative example of how to apply the proposed methodology. Chapter 5 finally introduces the general features and characteristics of the power system simulation tool needed to quantitatively evaluate the different transmission expansion benefits. This tool has to: address the quantification of the different benefits in a computationally efficient way; be suitable for power system (optimisation) and market studies, especially for large size systems; be suitable for performing probabilistic analysis; be flexible, expandable and linkable to other existing tools. In the end, Chapter 6 summarises the main findings and projects the next steps. 2.3 Approach The preparation of this report has requested the investigation of a large technical and scientific literature available on transmission expansion planning methods as well as on cost-benefit analyses. Also, different public documents, sources and links to research projects and applications existing in Europe and worldwide as well have been consulted and compared in order to have a consistent picture on the topics treated in the report. All these sources are quoted within the References. The investigation related to the criteria for evaluating some transmission expansion benefits (such as the market and the sustainability benefits) has proved to be complex tasks, mostly due to a scarce availability of generally recognised methodologies dealing with those issues. Also, the need for consistently addressing the different transmission expansion benefits towards a new, systematic approach has led to the application and adaptation of multi-criteria methodologies for cost-benefit analyses: this has resulted in a wider complexity of the approach, due also to the introduction of utility functions and weight vectors. The present work plays a crucial role within REALISEGRID project activities and different interactions with other REALISEGRID Deliverables are ongoing or expected. It has to be stressed that, for the part treating the transmission planning process, the present REALISEGRID Deliverable D3.3.1 is closely interrelated with REALISEGRID Deliverable D3.1.1, focused on a review of transmission planning practices (particularly in presence of wind generation in a liberalised environment). The present Deliverable provides some inputs for REALISEGRID Deliverable D3.1.2, which is more deeply devoted to probabilistic analyses for planning. Also, the REALISEGRID Deliverable D1.2.1 regarding FACTS and HVDC, for the part related to the planning guidelines for integrating those innovative technologies in transmission systems, is consistently linked to this Deliverable. A strict relation exists also with REALISEGRID Deliverable D3.3.2 (focusing on technologies costs), which also is closely linked to other REALISEGRID Deliverables, D1.4.1 and D1.4.2, preparing a roadmap of innovative technologies for power transmission in Europe. The scope is to address cost-benefit analysis of transmission expansions, which is then carried out by the power system simulation tool developed and described in REALISEGRID Deliverable D3.3.3. Intersections exist also with REALISEGRID Deliverable

D3.3.1 Possible criteria to assess technical-economic and strategic benefits of specific transmission projects 15
D3.6.2 (dealing with regulatory aspects and incentive schemes for transmission investments) and with REALISEGRID Deliverable D3.2.2 (focusing on an integrated techno-economic approach to network expansion). The final complete approach to cost-benefit analysis of transmission reinforcements, including also an assessment of environmental barriers and local opposition to system expansion, will be then addressed by REALISEGRID Deliverables D3.7.1 and D3.7.2. The application of the developed methodology for cost-benefit analysis is also carried out on an important case, namely the group of transmission projects belonging to the Trans-European Network priority axis "EL.2. Borders of Italy with France, Austria, Slovenia and Switzerland". This application is the focus of REALISEGRID Deliverable D3.5.1. A steady interaction and information exchange with the other project partners, with the TSOs and other European institutional, industrial, academic and regulatory stakeholders has been fundamental to validate and consolidate the report outcomes.

D3.3.1 Possible criteria to assess technical-economic and strategic benefits of specific transmission projects 16
3 TRANSMISSION EXPANSION PLANNING 3.1 Introduction The transmission network expansion planning is a crucial and also very complex process and recent trends and challenges contribute to make it even more complicate. Indeed, the restructuring of the electricity markets introduces further uncertainties within current transmission planning processes. In the past, before the electricity market liberalisation took place, the transmission network was expanded with the aim to minimise both generation and transmission costs, while meeting static and dynamic technical constraints, to ensure a secure and economically efficient operation. Today, in a competitive market, the TSO (Transmission System Operator), in charge of the sole transmission after the utilities’ unbundling, plans the expansion of its network by minimising transmission cost (investment and operation) and pursuing maximum social welfare, while meeting static and dynamic technical constraints. Resolving then the trade-off between minimum transmission investment cost versus maximum social welfare is a complicated task. Moreover, the penetration of variable Renewable Energy Sources (RES) brings additional uncertainties posing further challenges to transmission planners: they have in fact to reliably integrate variable RES power plants into the grids and cope with rapid and less predictable flows changes so as to preserve an adequate level of security for the system. In the last years, in anticipation of the above issues emerging in the practical transmission planning carried out by TSOs, the research in the area of transmission expansion planning methods has also seen several developments. The present Chapter focuses first on a general literature review of transmission expansion planning methods, while transmission planning practices carried out by European TSOs has been investigated in REALISEGRID Deliverable D3.1.1 [1]. The general transmission planning process is then introduced with its basic scheme and stages. Focus is particularly on the cost-benefit analysis as crucial step of transmission planning aiming at ranking the different reinforcement options towards final decision-making of transmission planners. 3.2 Literature review of transmission planning methods 3.2.1 Overview and classification
A transmission planning method is a methodology utilised for investigating how a transmission system, given the different boundary conditions and constraints, should be optimally developed to reach certain targets. A transmission planning method is carried out by any calculation tool that, taking some input information as a starting point, combines by itself different predefined transmission expansion options in order to provide one or more quasi-optimal transmission plans. The implementation of these methods may request an interaction with the planner, but this is in general limited to settings adjustments. In the last years, as introduced in section 3.1, the research in the area of transmission expansion planning (TEP) methods has been anticipating the new challenges ahead of transmission planners. There has then been a broadening and an extension of classic transmission expansion planning methods to make them suitable to solve new issues. Indeed, a very large literature exists on transmission planning, mostly due to developments occurring in the past two decades, such as the research on new optimisation algorithms, the greater uncertainty levels introduced by the power
D3.3.1 Possible criteria to assess technical-economic and strategic benefits of specific transmission projects 17
sector deregulation and the growing penetration of variable (RES) generation and load and also the improvement of computer power availability [2]. The different transmission planning methods available in the scientific literature can be generally grouped according to specific features, such as: approach; timeframe horizon; power system structure. The classification can be then broken down as in the following [2]-[4]:
• Classification by approach 1. Deterministic methods 2. Non-deterministic methods
• Classification by timeframe horizon 1. Static methods 2. Dynamic methods
• Classification by power system structure 1. Regulated systems methods 2. Restructured systems methods
A further classification of TEP methods is based on the different techniques used. In the following, an overview of TEP methods is presented: for all details and a comprehensive view of TEP methods the interested reader is addressed to a large scientific literature, whose references are described and listed in [2]-[4]. 3.2.2 Regulated systems methods In a regulated environment, a vertically integrated utility has the obligation to serve its customers as economically as possible, while maintaining system reliability. Transmission expansion planning (TEP) has been traditionally centralized based on the forecasted load demand and coordinated with the generation expansion planning. TEP methods can be grouped based on the approach, deterministic and non-deterministic. In general, TEP can be further classified into static transmission expansion planning (STEP) and dynamic transmission expansion planning (DTEP) based on the planning horizon [2]-[4]. STEP is to determine where and which new facilities should be installed at the minimum cost for a given generation and load profile in a particular planning period. Additionally, DTEP also determines when the new facilities should be installed within the planning horizons. 3.2.2.1 Deterministic, static methods A large quantity of algorithms types exists in literature for solving the STEP problems in a regulated environment via deterministic approaches. These methods can be further classified into three subcategories according to the technique used: (1) mathematical optimisation, (2) heuristic and (3) meta-heuristic. (1) Mathematical optimisation methods The mathematical optimisation methods find an optimum expansion plan by using a calculation procedure that solves a mathematical formulation of the problem. Due to the impossibility of considering all aspects of the TEP problem, the plan obtained is the optimum only under large simplifications: it should then be technically, economically, and environmentally verified, among other examinations, before the planner makes a decision. The TEP is formulated as an optimisation problem with an objective function (a criterion to measure in the same way the goodness of each expansion option), which is typically a cost function

D3.3.1 Possible criteria to assess technical-economic and strategic benefits of specific transmission projects 18
to be minimized subject to a set of constraints. These constraints model most technical, economic, and reliability criteria imposed to the power system expansion. Reliability constraints are generally assessed by line outage security criteria. Several methods have been proposed to obtain the optimum solution for the TEP problem, mostly using classical optimisation techniques like linear programming (LP), dynamic programming, nonlinear programming (NLP), and mixed integer programming. Apart from classical optimisation techniques, mathematical decomposition techniques, such as Benders decomposition, have also been applied to solve TEP problem. Due to the non-convexity of TEP problem, a hierarchical decomposition approach has been also proposed to improve Benders decomposition method. The hierarchical decomposition first solves the operation sub-problem by using a simple transportation model and then switches to more accurate models when approaching final solution. Other optimisation algorithms, such as interior point method (IPM), which is efficient solver of LP and NLP, and “branch and bound” algorithm, which is based on hierarchical Benders decomposition, have been also used to solve TEP problem. In general, mathematical optimisation methods face computational speed problems for solving large scale TEP problems. The obtained optimal solution of the TEP problem, which is non-linear and non-convex in nature, is usually a local optimum due to the intrinsic limitation of the searching process. (2) Heuristic methods The heuristic methods are the current alternative to the mathematical optimisation methods: these are all those techniques that, instead of using a classical optimisation approach, go step-by-step generating, evaluating, and selecting expansion options, with or without the user’s help (interactive or non-interactive). To do this, the heuristic methods perform local searches with the guidance of logical or empirical rules and/or sensitivities (heuristic rules). These rules are used to generate and classify the options during the search. The heuristic process is carried out until the plan generation algorithm is not able to find anymore a better plan considering the assessment criteria that were settled down. These criteria usually include investment-operation costs, overloads, and unserved power. Computational performance and convergent rate of heuristic methods are better than pure mathematical optimisation methods. One of the first heuristic approaches proposed to solve the TEP problem introduced the “adjoin network” concept to produce the necessary continuous network admittance matrix (susceptance) change to minimize the investment cost. Another one of the first heuristic methods introduced fictitious “overload paths” to form “overload network”. The flow through this network is penalised using the “guide numbers,” to assure that the mathematical model uses all the real circuit capacity first. These procedures combine heuristic rules with mathematical optimisation algorithms (linear programming) to solve the TEP problem. They go forming step-by-step the transmission expansion plan, installing a single new circuit at a time. This new circuit is added in the corridor with the largest flow through the corresponding corridor of the overload network. Another heuristic method gains advantage of the natural decomposition of the TEP problem in the investment and the operation sub-problems. The investment sub-problem is solved using a heuristic search procedure. Another proposed method uses an optimal power flow (OPF) modeling algorithm which applies the primal-dual interior point techniques to solve the TEP problem. Sensitivity analysis is another heuristic approach for TEP, which aims to determine whether additional circuits are required to improve the quality of planning. The problem of heuristic methods is that they are not solid from the mathematical viewpoint and the results can be poor for large networks. This is because the local search procedures are usually terminated at local optimum. Besides, the logical rules or sensitivity indices are only interested in a

D3.3.1 Possible criteria to assess technical-economic and strategic benefits of specific transmission projects 19
particular feature of a circuit. Therefore, the heuristic methods loose some important elements of the global optimisation. (3) Meta-heuristic methods Meta-heuristic methods integrate the features of optimisation and heuristic methods. These methods usually yield high quality solutions for large transmission networks with short computational time. In recent years, non-convex optimization methods, such as genetic algorithms (GAs), simulated annealing (SA) and tabu search (TS) algorithms, have been widely used to solve TEP problems. GAs are initialized by a set of initial points, while SA and TS begin from single initial point. Therefore, GAs have the ability to solve multi-objective TEP problem. Other meta-heuristic methods, such as object-oriented models, game theory, expert systems, fuzzy set theory and greedy randomized adaptive search procedure (GRASP), have also been proposed to perform TEP. With the advancement of artificial intelligence (AI) and hybridization techniques, new AI-based and hybridization approaches have been recently adopted in TEP. 3.2.2.2 Deterministic, dynamic methods Differently from static planning, if multiple years are considered and an optimal expansion strategy is outlined along the whole planning period, the planning is classified as dynamic. In this case, the mathematical model has time restrictions to consider the coupling among the years so that the present value of all investment costs along the planning horizon is minimised subject to the different system constraints. The DTEP methods are currently still in a developing stage: they have excessive limitations concerning the system size and the system modeling complexity level. Indeed, the DTEP problem is very complex and very large because it must take into account not only sizing and placement, but also timing considerations. This results in a large number of variables and restrictions to be considered, and requires an enormous computational effort to get the optimal solution, especially in real power systems. Considering the size of the dynamic problem, it has to be simplified to achieve reasonable computational times. One of the ways to address this problem is solving a sequence of static sub-problems (pseudo-dynamic procedures). These methods can be further classified into three subcategories according to the technique used: (1) mathematical optimisation, (2) heuristic and (3) meta-heuristic. (1) Mathematical optimisation methods Several mathematical optimisation methods, based on linear programming (LP), dynamic programming, quadratic programming (QP) and nonlinear programming (NLP), have been proposed to deal with DTEP problems. However, as said, the huge computational effort due to the use of mathematical optimisation methods limits their applicability to DTEP problems. Few works about dynamic methods for real world transmission planning problems can be found in the technical literature (see references in [2][4]). (2) Heuristic methods Two heuristic methods are very natural to be applied to dynamic or pseudo-dynamic TEP problem. The first one is the “forward” procedure, that consists in solving the static expansion problems sequentially for all years (starting from the first one) considering in the following years the additions implemented in the past. The second natural way is the “backward” procedure that consists in solving the static planning problem for the last year first, and then trying to anticipate those additions to solve violations on intermediate years. If the additions for the last year do not eliminate all operational violations on intermediate years, the procedure seeks additional circuits
D3.3.1 Possible criteria to assess technical-economic and strategic benefits of specific transmission projects 20
from all options. Since the last year usually stresses most the network and it is solved first, the solutions produced by “backward” procedure are generally better than those ones produced by “forward” procedure. By taking as a starting point the above mentioned procedures, a “backward-forward” procedure has been also proposed to solve the multiyear transmission planning. This method consists in a systematic use of the “backward” and “forward” procedures to produce a more consistent and economic transmission plan. The basic idea is to subdivide the whole multiyear planning process in movements, on forward or backward directions, with comparison steps. As previously mentioned, the computational effort to solve the dynamic (or pseudo-dynamic) TEP problem is very large. Then, the use of meta-heuristic procedures seems to be the only way to obtain feasible solution for large-scale DTEP problems. (3) Meta-heuristic methods Meta-heuristic methods, such as those ones based on GAs, have been applied to solve DTEP problems because they have the ability to find high quality solutions in large scale complex systems. It has been also proposed to integrate GAs, TS and SA to solve DTEP problem. The use of TS in the reproduction stage of the GA prevents the result falling into local minima while the use of SA can ensure higher probability to get high quality solution. 3.2.2.3 Non-deterministic methods The limitation of deterministic methods for solving the TEP problem is that they consider only the worst cases of the system without considering the probability of occurrence or degree of importance of these cases. Non-deterministic methods consider many cases with assigning a probability of occurrence or a degree of importance to each of them and hence are able to model the past experience, future expectations and uncertainties. Non-deterministic methods developed so far are mostly static, i.e. they are generally most suitable for addressing the STEP problem. The main non-deterministic methods, which have been used for TEP in regulated power systems, can be further classified into three subcategories according to the technique used: (1) probabilistic, (2) scenario and (3) decision analysis. The uncertainties can be classified in two categories: random and non-random uncertainties. Probabilistic approaches are able to take into account random uncertainties, while scenario techniques and decision analysis address non-random uncertainties. (1) Probabilistic methods The Probabilistic Load Flow (PLF) method is similar to the deterministic load flow method except that it gets the probability density functions (PDFs) of loads as input and computes the PDFs of output variables using the Monte Carlo simulation. The PDFs of loads can be estimated based on the load prediction and uncertainty analysis. To reduce the computations, power flow equations are linearised around the expected value region and then convolution technique is used for computing the PDFs of outputs. The PLF for solving the TEP problem, after computing the reliability indices such as the probability of violating the line flow limits and voltage limits, suggests consequent expansion plans. Then, each of the suggested plans is added to the network separately, and the execution of the PLF allows to compute the reliability indices for each modified situation. Finally, the best plan based on the reliability indices and cost is selected. Another probabilistic method applies Probabilistic Reliability Criteria (PRC). After suggesting a number of transmission plans by analyzing the existing network, the PRC method considers each of the suggested plans adding it to the network separately. Then, Monte Carlo simulation is carried out to compute the reliability criteria, such as expected energy not supplied (EENS), expected number

D3.3.1 Possible criteria to assess technical-economic and strategic benefits of specific transmission projects 21
of load curtailment (ENLC), expected duration of load curtailments (EDLC), for each addressed plan. The final plan is at the end selected based on the reliability criteria and economic analysis. For a more thorough investigation of probabilistic methods for TEP, the interested reader is addressed to REALISEGRID Deliverable D3.1.2. (2) Scenario techniques methods Scenario techniques methods are more general than probabilistic methods and can be used for the planning of any system. The scenario techniques methods to address the TEP problem first determine a set of probable scenarios (futures). A scenario is a set of outcomes or realizations of all uncertainties. The scenarios must be defined to cover the uncertainties. A probability value or a degree of importance has to be assigned to each scenario (wk). Then, after determining the set of possible solutions (plans), a cost function to measure the goodness of each plan has to be specified. Next step is the selection of the final plan: different criteria can be used towards this goal. Among these, there is the expected cost criterion (probabilistic choice): the plan that minimizes the expected cost is selected as the final plan. The basic assumptions of this criterion are that the scenarios have to be repeatable and the laws governing the phenomena remain unchanged, so that the frequency of occurrence of each scenario tends to be close to the probability value assigned to it. Also, the probabilistic choice criterion may be blind to solutions that are interesting to be considered in an uncertain environment, while it may tend to recommend riskier decisions. Another approach is by using the minimax regret criterion (risk analysis). In risk analysis the best solution is determined by minimizing the regret. Regret is a measure of risk and is defined as the difference between the cost of the selected solution and the cost of an optimal solution that would have been selected if planners knew beforehand which one of the future scenarios would happen. In this criterion the plan that minimizes the maximum weighted regret over all futures is selected as the final plan. The risk analysis is an a posteriori evaluation i.e. the final solution is chosen after assessing the consequence of each solution in each given future scenario. Instead, the probabilistic choice provides an a priori evaluation i.e. the final solution is chosen before knowing which future scenario occurs. Other criteria consider the plan that minimizes the sum of costs over all scenarios or in alternative over extremely pessimist or optimist scenarios. Number of scenarios can be reduced by carrying out a sensitivity analysis in order to discard the uncertainties with little influence on the final result. For very important decisions, where surviving under an unlikely but catastrophic scenario is needed, using the minimax regret criterion as a further test could be needed. Scenario techniques methods can be applied also for addressing DTEP problem. In dynamic planning, scenario technique may however lead to incoherent successive decisions. Planners can reduce the risk of TEP by developing hedges. Hedging is a technique for reducing the risk by generating new alternatives. In fact, hedges reduce the risk by reducing the number, or the probability of occurrence of scenarios for which a plan is regrettable, or by reducing the regret of plans in adverse scenarios. (3) Decision analysis methods Decision analysis methods provide the planners with the possibility to find the most flexible plan. The flexibility is defined as the ability of adapting the system quickly and at reasonable cost to any change in the conditions which prevailed at the time it was planned. In these methods, the entire set of scenarios over the different periods of planning horizon is described by an event tree. This tree has two types of nodes: decision nodes and event nodes. The event tree starts with a decision node. Decisions are taken at decision nodes. The branches that emanate from each decision node show the feasible decisions that can be taken at this node. Each of these branches is associated with the cost

D3.3.1 Possible criteria to assess technical-economic and strategic benefits of specific transmission projects 22
of the corresponding decision and ended to an event node. The branches that emanate from each event node show the probable events that may occur and are associated with the probability of occurring. In fact, a scenario is a complete path between the tree root and a final node. The procedure of finding the optimal decision over the entire planning period uses a classical stochastic dynamic programming. Starting from the end of decision tree, computing the expected cost beyond each event node, selecting the minimum one and continuing until the initial node is reached. Decision analysis methods lead to the easiest adaptation to the future events. 3.2.3 Restructured systems methods The objective of TEP under deregulated environment is different from the one in the traditional, regulated power systems. Transmission network owners or investors are more interested in maximizing their own profit than the social welfare. This difference brings new challenges to the TEP problem. The main objective of TEP in deregulated power systems is to provide a non-discriminatory environment for the competition as profitable as possible, while maintaining power system reliability. Expansion planning affects the interest of market participants unequally and this should be considered in TEP. Therefore, some new transmission planning methods have been developed to meet new challenges. Deregulation has increased uncertainties in power systems. In regulated environment, the planners have full access to specific information, such as generation cost function, for transmission planning. On the contrary, transmission network owners or investors have only general information, such as load demand, in deregulated market. Apart from that, in deregulated environment, participants make their decision independently and strategically to maximise their own profit. When consumers are sensitive to electricity price, they adjust their electricity usages according to the change in price: this then increase uncertainties. Furthermore, the growing penetration of variable (RES) generation contributes to an higher uncertainty also on the generation side. Therefore, most TEP methods in restructured systems try to handle all the uncertainties towards robust plans for transmission network expansion. The TEP methods in restructured power systems can be deterministic and probabilistic and are mostly static, i.e. they are generally most suitable for addressing the STEP problem. 3.2.3.1 Deterministic methods Meta-heuristic methods based on optimisation approaches, such as GAs, chance constrained programming (CCP), expert system (ES), fuzzy-set theory, Pareto-based solution technique, SA and game theory (GT), have been proposed to solve TEP problems. The application of GAs has been proposed to solve multi-objective optimisation problems. The final expansion plan is selected by using minimax regret criterion (Risk Analysis). A mathematical and rule-based ES has been applied to expand transmission network in a competitive environment. The final expansion plan is solved by solution search strategy of the ES. A multiple objective fuzzy optimisation method has been also used to perform TEP. A multiple objective optimisation model, which is converted into a single objective one, is solved. It should be noted that this multiple objective optimisation method always gives all-round considerations for TEP. A multi-criteria optimisation algorithm has been also proposed for TEP by using Pareto-based solution technique to solve the optimisation problem. A plan is Pareto-optimum if it is not dominated by any other plan: for example, plan X is dominated by plan Y if its cost is higher than the cost of plan Y in each scenario. This solution is not always unique.

D3.3.1 Possible criteria to assess technical-economic and strategic benefits of specific transmission projects 23
In a deregulated environment, a cooperative game theory has been also applied to address TEP problem. A multi-agent system is developed to assist players to form coalition and cost allocation for electric utility industry. Another GT algorithm has explored a new strategy to respond to changes in power flow patterns. A number of market-driven power flow patterns have been generated for future transmission network expansion. An optimal transmission plan is selected to handle the changes in power flow by using a minimax regret scheme. Investment costs, operation costs and EENS have been modeled to address a multi-criteria DTEP problem. After applying SA, the solution reveals when and where to build transmission lines. Mixed deterministic and non-deterministic methods have been also used: this is the case of CCP used to solve TEP problem formulated as a stochastic optimisation for handling uncertainties in generation expansion and load growth. This approach is based on the Monte Carlo simulation and GAs. Mathematical optimisation methods, such as those ones based on Benders decomposition and “branch and bound” algorithms, are continuously used for TEP in deregulated environment. Benders decomposition techniques have been utilised to solve the expansion scheduling investment (master) problem and power-pool operational (slave) problem so as to upgrade the capacity of transmission line. The level of congestion in transmission network is used as an indicator for the need of additional transmission lines. A “branch and bound” method using a fuzzy set theory has been also proposed to solve the optimal transmission expansion plan utilizing a power flow approach and the maximum flow-minimum cut set theorem. Another “branch and bound” method presents deterministic and non-deterministic features. It selects transmission expansion plan by considering probabilistic reliability criterion. An integer programming (IP) is used to solve the optimal strategy via a probabilistic “branch and bound” method that again utilizes a power flow approach and the maximum flow-minimum cut set theorem. 3.2.3.2 Non-deterministic methods In deregulated market, market based approach is a widely used method. Market based planning concept is the integration of financial and engineering analysis that considers the economics as well as the physical laws of generation, load and transmission. To achieve a balanced expansion in both economic structures and system reliability, Monte Carlo simulation of generation and major transmission interface outage allows to investigate the reliability performance and the economic impact of TEP plans. In this view, transmission network will be expanded based on the reliability performance, which is indicated by expected energy not served (EENS) and loss of load expectation (LOLE), and economic impact, which is indicated by expected locational marginal price (LMP). Furthermore, different market based TEP approaches have been proposed applying probabilistic methods for modeling random uncertainties in a step-by-step procedure. The selection of the final expansion plan has been based on the stakeholders’ desires and/or using fuzzy risk assessment. Also, probabilistic approaches for solving the probability density functions of nodal prices have been used: the final expansion plan is selected by risk assessment.
D3.3.1 Possible criteria to assess technical-economic and strategic benefits of specific transmission projects 24
3.3 The transmission planning process After a literature review of transmission planning methodologies, focus is in this section on the practical stages of the transmission planning process. The transmission expansion planning process is a complex task in which the network planners need to handle several uncertainties and consider different risk situations. There are more fundamental reasons for these issues. First, changes in future system conditions can affect benefits from transmission expansion significantly. Historically, the relationship between transmission benefits and underlying system conditions was found many times to be nonlinear. Thus, evaluating a transmission project based only on assumptions of average future system conditions might greatly underestimate or overestimate the true benefit of the project and may lead to less than optimal decision-making. For this reason, transmission planners need to fully capture all impacts a project may have, examining then a wide range of possible system conditions. Second, historical evidence suggests that transmission upgrades have been particularly valuable during extreme conditions. Furthermore, it takes much longer to get a new transmission line approved and built (at least 5 years and in most cases more) than similar procedures for new generation facilities (e.g. gas fired power plants in only 2-3 years). Therefore, the development of the transmission grid always lags behind the development of generation. This can only be taken into account by using different situations and scenarios. Methodologies and criteria developed by TSOs focus on risk assessment and mitigation, building both on their past experience and scenarios to envisage future situations. They assess the resilience of the system in whatever situation it may have to face: high/low load, generation dispatch patterns, adverse climatic conditions (defined in the scenario phase), and/or contingencies, for example [75]. The transmission planning process with its basic scheme and stages is depicted in Figure 3.1. The first stage of planning concerns the power system projection (scenarios) over the analysed timeframe in terms of those elements which may impact on the transmission grid evolution over the years of observation. Such elements regard the projected trends of load demand, import/export and production (phasing in and out of respectively new and old generation), which also depend on economic, market, policy and regulatory drivers (like for example the EU 2020 targets). The development of system scenarios, related to the targeted time horizon, provides then the boundary conditions for planning the transmission expansion. In fact, within the frame of the developed scenarios for the specific area under study, transmission planners need to check whether their related network in unchanged conditions (without any expansion, ‘doing nothing’ alternative) is still reliable, that is secure and adequate. This analysis is carried out by applying static and dynamic security criteria, which in general are referred to as (n-1) criterion. The application of the (n-1) security criterion is a general practice implemented by transmission planners and is also known as device outage security criterion. It consists in verifying that, in presence of a single contingency (that is, outage of a single network component like line/transformer/generator/controlling device/cable), parameters like power flows, voltage and current amplitudes regarding the different network elements are all within the respective operational security limits (maximum acceptable values). The contingency analysis includes transient, dynamic and steady-state stability check for both frequency and voltage conditions. In some specific cases, more severe contingencies than those ones applied by the (n-1) criterion can be taken into account by transmission planners, like for example situations of double contingency ((n-2) security criterion), multiple contingencies, loss of

D3.3.1 Possible criteria to assess technical-economic and strategic benefits of specific transmission projects 25
busbar(s) [75]. Whereas these planning criteria are met, then the network can be considered secure and does not generally need an expansion to accommodate the evolution scenarios. On the other side, whereas the security (reliability) analysis regarding the unchanged network within the developed scenarios is not satisfied, a transmission reinforcement action must be taken into account by the planners. This stage aims then to specifically solve issue(s) and address need(s) in the system: these planners’ targets might be for example represented by achieving a transmission capacity enhancement or reaching a desired level of voltage amplitude(s). To address a specific problem in the system, different reinforcement solutions may be available, ranging from upgrading/uprating the existing assets to building new ones. The available options span from conventional technologies such as HVAC (High Voltage Alternating Current) overhead lines, transformers, cables to more innovative devices like HVDC (High Voltage Direct Current) and FACTS (Flexible Alternating Current Transmission System); also a combination of different solutions might be an option. After identifying a first, broad group of possible reinforcement solutions which address a specific problem in the system, task of transmission planners is to carry out a cost-benefit analysis of the different options: the aim is in fact to compare and rank them to select the most feasible one(s). The cost-benefit analysis of the expansion alternatives consists in a techno-economic assessment of each of them: all the benefits provided by every option need to be carefully and quantitatively evaluated against their respective investment and operating costs. This analysis nowadays takes more frequently account of environmental and social issues as well, considering the crucial role that such aspects play towards the expansion of a transmission system. Until a recent past, a socio-environmental assessment was a further (even optional) stage in the transmission planning process subsequent to the techno-economic assessment towards the final ranking of the different expansion options. Indeed, environmental constraints and social opposition have often obliged the transmission planners to reshape the rank of the investigated alternatives. For a modern transmission planning, it is nowadays of paramount importance to quantitatively evaluate socio-environmental aspects and consider them for a more complete and systematic cost-benefit analysis: final scope is the decision-making of the top-ranked option(s). In Figure 3.1 the part in red depicts the traditional approach to cost-benefit analysis, while the part in green displays a more extended approach, which also includes social and environmental aspects: the latter one is the approach proposed by REALISEGRID project. Chapter 4 pays particular, detailed attention to the different benefits provided by transmission system expansion and their respective criteria and methods for quantitative evaluation. Chapter 5 introduces a multi-criteria approach to cost-benefit analysis.

D3.3.1 Possible criteria to assess technical-economic and strategic benefits of specific transmission projects
Scenarios development
Security analysis
Security criteria
met?No expansion
Y
NIdentification of
first, broad group of solutions
Techno-economic
assessment
Environmental/ social
assessment
Final ranking of solutions
Identification of second, restricted group of solutions
Decision making
Cost-benefit analysis
Traditional approach
REALISEGRIDproposedapproach
Figure 3.1: Basic scheme of the transmission planning process
26

D3.3.1 Possible criteria to assess technical-economic and strategic benefits of specific transmission projects 27
4 THE BENEFITS OF TRANSMISSION EXPANSION 4.1 Introduction The power transmission system is the backbone of the electric power system: it plays a key role in the electricity supply to final customers and its development contributes then to the welfare of a country. The strategic importance of strengthening cross-border transmission networks in Europe towards the EU’s energy policy targets of sustainability, competitiveness and security of energy supply has been remarked by the EU Guidelines for Trans-European Networks for Electricity (TEN-E) [70]. In addition, the European Commission’s Green Paper on Networks has recently outlined that the development of adequate transmission infrastructures in Europe will be key to reach the EU 2020 targets [71]. The enhancement of transmission capacity is the general benefit provided by transmission expansion, which as said impacts on the sustainability, competitiveness and security of energy supply of the European power system. This general benefit can be further detailed in various particular benefits provided by transmission expansion. The assessment of these effects, especially in today’s liberalised power systems, generally represents a rather complicate stage as the evaluation strongly depends on the viewpoint of the different players - TSOs, producers, customers-for each considered benefit. Considering a systemic perspective, the different benefits deriving from transmission expansion to the society can be listed as in the following:
• System reliability, quality and security increase
• System congestions reduction and unlock of more efficient generation
• Market competitiveness increase
• Exploitation of energy mix (also in presence of RES)
• Emission savings (in presence of RES)
• System losses reduction • Power flows controllability increase (via FACTS/HVDC)
• External and internal costs reduction (in presence of RES)
• Avoidance/postponement of investments
• More efficient reserve management and frequency regulation • Facilitation of distributed generation integration (via SmartGrids)
• Improved dynamic behavior of power system

D3.3.1 Possible criteria to assess technical-economic and strategic benefits of specific transmission projects 28
All these particular benefits can be grouped according to their prevailing effect on the three EU energy policy targets of sustainability, competitiveness and security of energy supply. Some of these listed benefits may impact on two or three of the EU energy policy targets. The following paragraphs describe in detail the most important benefits from transmission expansion and their evaluation criteria. 4.2 Improved system reliability 4.2.1 Introduction Reliability refers to the ability of a power system to provide an adequate and secure supply of electrical energy at any point in time. In particular, adequacy is defined as the ability of a power system to supply the aggregate electrical demand and energy requirements of the customers at all times, taking into account scheduled and unscheduled outages of system facilities (definition from NARUC, the US National Association of Regulatory Utility Commissioners). In the following, focus is on continuity of supply. Despite of quality of supply, that is usually measured in terms of acceptable values of voltage and frequency, continuity of supply refers to uninterrupted electricity service. Continuity of supply is characterized by the number and duration of supply interruptions [5][6]. 4.2.2 Innovative approaches to account for continuity of supply Following the radical changes occurred in the institutional framework of electricity supply industry since early 90’s of the past century, it is nowadays widely recognised that investments related to the provision of electricity continuity of service must be carefully evaluated through an explicit cost-benefit analysis. Benefits are mostly related to the value of continuity in the consumer’s perspective and therefore such a cost-benefit analysis represents the basic element necessary to move from the well known “criteria-based” planning approach to a “value-based” planning approach that accounts for both utility’s and customer’s perspectives [5][7]. The former approach (“criteria-based”) is based on investment optimisation while meeting deterministic or probabilistic adequacy criteria (e.g. (n-1) or (n-2) security criteria and EENS (Expected Energy Not Supplied) ≤ E upper bound, respectively). The latter approach (“value-based”) explicitly accounts for costs and benefits (added value or, conversely, avoided costs) associated to the changes of adequacy (continuity) levels due to an investment decision. In a liberalised framework, decisions on investments must account for “consumer satisfaction”, one of the most important components of which is the perceived value of electricity continuity of supply. In fact, there is a discrepancy between the customers’ perception of continuity and indices measuring the system continuity level, whose optimisation should theoretically imply that the customers’ marginal benefits are optimised, too. Indeed, continuity level indices represent the average performance at system level or at large consumers aggregates, while if an interruption occurs, the individual consumer is only concerned with the inability to use his/her equipments and the possible damage to them [8]. Accordingly, the optimisation of the continuity level and of related investments can be based on the fact that, from the consumer's perspective, the total cost of the electric service consists on two components: cost of service received, proportional to the cost born by utility, and the cost of service
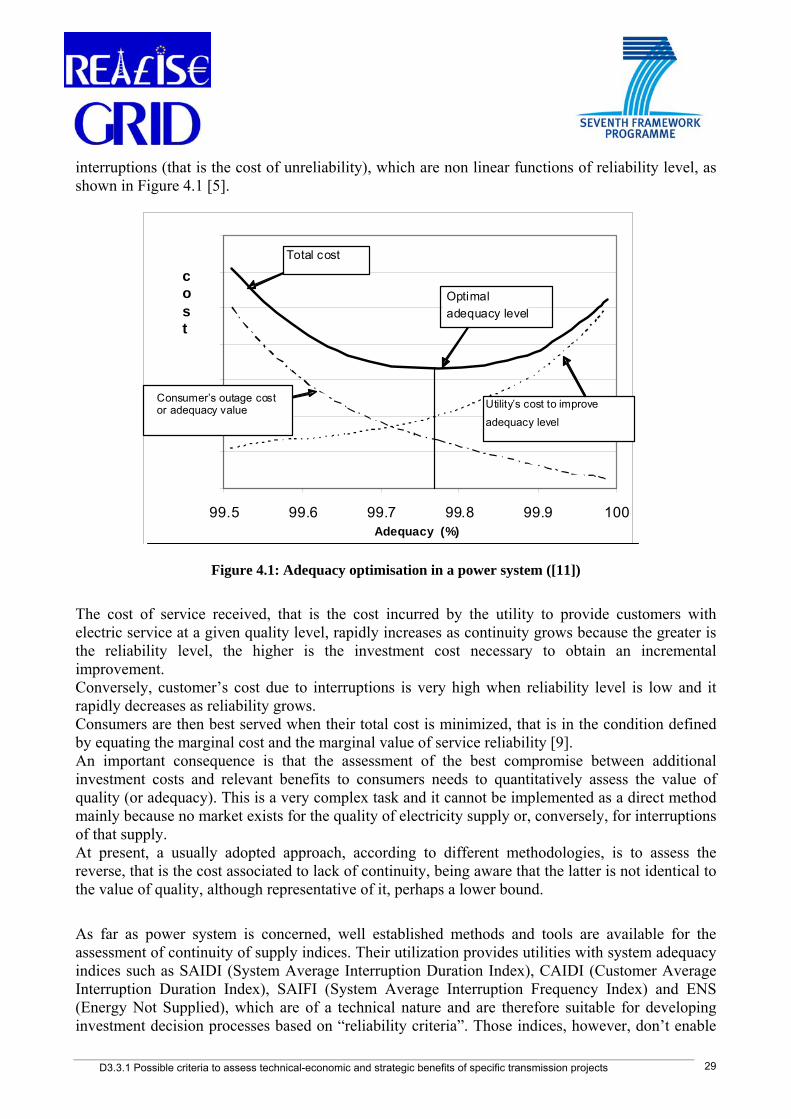
D3.3.1 Possible criteria to assess technical-economic and strategic benefits of specific transmission projects
interruptions (that is the cost of unreliability), which are non linear functions of reliability level, as shown in Figure 4.1 [5].
0
500
1000
1500
2000
2500
3000
3500
99.5 99.6 99.7 99.8 99.9 100 Adequacy (%)
Total cost
Utility’s cost to improve
adequacy level
Optimal adequacy levelffid bili à
c o s t
Consumer’s outage cost or adequacy value
Figure 4.1: Adequacy optimisation in a power system ([11])
The cost of service received, that is the cost incurred by the utility to provide customers with electric service at a given quality level, rapidly increases as continuity grows because the greater is the reliability level, the higher is the investment cost necessary to obtain an incremental improvement. Conversely, customer’s cost due to interruptions is very high when reliability level is low and it rapidly decreases as reliability grows. Consumers are then best served when their total cost is minimized, that is in the condition defined by equating the marginal cost and the marginal value of service reliability [9]. An important consequence is that the assessment of the best compromise between additional investment costs and relevant benefits to consumers needs to quantitatively assess the value of quality (or adequacy). This is a very complex task and it cannot be implemented as a direct method mainly because no market exists for the quality of electricity supply or, conversely, for interruptions of that supply. At present, a usually adopted approach, according to different methodologies, is to assess the reverse, that is the cost associated to lack of continuity, being aware that the latter is not identical to the value of quality, although representative of it, perhaps a lower bound.
As far as power system is concerned, well established methods and tools are available for the assessment of continuity of supply indices. Their utilization provides utilities with system adequacy indices such as SAIDI (System Average Interruption Duration Index), CAIDI (Customer Average Interruption Duration Index), SAIFI (System Average Interruption Frequency Index) and ENS (Energy Not Supplied), which are of a technical nature and are therefore suitable for developing investment decision processes based on “reliability criteria”. Those indices, however, don’t enable
29

D3.3.1 Possible criteria to assess technical-economic and strategic benefits of specific transmission projects 30
decision makers to develop “value based” planning procedures which require that reliability or unreliability levels of the concerned power system are quantitatively expressed through economic indicators. Usable cost parameters for the assessment of the economic value of reliability of supply or of economic losses due to interruptions must be expressed in terms of €/interruption, €/kW of peak load, €/kWh of annual energy consumed, €/kWh of energy not supplied [5][11]. Three indices are most frequently used and referenced in the literature: IEAR, VOLL, and WTP.
• IEAR (Interruption Energy Assessment Rate) is a system-wide interruption cost index. It is expressed in €/kWh and, therefore, in association with the adequacy index EENS (Expected Energy Not Supplied per year), it provides an estimation of the expected annual economic damage incurred on average by customers due to interruptions.
• VOLL (Value Of Lost Load) whose prevailing meaning in the literature corresponds to the
estimated total damage caused by interruptions divided by the amount of electricity not delivered in a given time period (usually an year). This is conceptually equivalent to IEAR and so it can be used to assess the damage suffered by the system due to interruptions of supply [11][12]. VOLL is also defined as the value (€/kWh) an average consumer puts on an unsupplied kWh of energy [8], rather than the cost of an unsupplied kWh, or as the customer’s willingness to pay (WTP) to avoid an additional period without power [13].
• WTP represents the customers’ willingness to pay to improve their continuity of supply, by
decreasing the frequency and/or the duration of interruptions and by avoiding specific types of incidents, e.g. those ones lasting more than a pre-defined upper limit. WTP may be expressed as €/kWh of consumed energy if it represents the propensity of customers to pay for an increase of their electricity bills in order to have a given quality improvement [14], or as €/event if the customer’s goal is to reduce or to avoid interruptions at all [15].
The values of the aforementioned indices can be assessed by using the methods and procedures described in the following section, enabling to account for macro and micro-economic parameters relevant to the utilisation of electricity as well as for the characteristics of power system outages and their impact on the consumers’ surplus. 4.2.3 Methodologies The value of interruption cost indices (e.g. VOLL) cannot be directly determined because no market exists where supply interruptions are explicitly traded. Therefore the indices that quantify the costs of supply interruptions for customers, at sectorial and at aggregate level, can be assessed through a complex process based on two distinct sets of activities. The first one is basically concerned with collection / observation of data relevant to:
• the general economic framework in which the power system and the electricity market are operated;
• the characteristics of electricity supply interruptions; • the customers’ perception of the value of continuity of power supply or of the costs incurred
due to power and energy curtailments.
The second one consists in computing interruption cost indices by means of suitable procedures and techniques which include:

D3.3.1 Possible criteria to assess technical-economic and strategic benefits of specific transmission projects 31
• processing collected data; • setting up customer interruption cost models; • computing power system interruption cost indices.
According to this activity classification and to a wide existing literature it is possible to distinguish between general approaches / methods and specific techniques / procedures suggested and adopted to assess interruption cost indicators. 4.2.4 General approaches and methods The various approaches and methods used to assess interruption cost indices can be grouped into three broad categories [11]:
1. indirect analytical evaluations; 2. case studies of blackouts; 3. customer surveys.
Recently, University of Bath (UK) [10] categorized methods in a more sophisticated way by introducing a fourth type of methodology based on the observation of market behaviour of electricity consumers. The proposed new classification includes:
1. proxy methods (including the production function approach), equivalent to indirect analytical evaluations;
2. case studies, such as the analyses of black-outs;
3. stated preferences, similar to above mentioned “customer surveys”;
4. revealed preferences (e.g. by observation of customers’ market behaviour).
The main characteristics, advantages and drawbacks of the above mentioned general approaches are summarized in the following sections. 4.2.4.1 Proxy methods Proxy or indirect analytical methods allow to evaluate interruption costs by inference from indices or variables that are closely related to the direct cost induced by power supply interruption, such as electricity supply rates, Gross National Product (GDP), wage rates, etc. In this context, in the industrial or tertiary sectors the costs of lost production may be quantified explicitly, as well as the costs resulting for example from overtime work, the costs associated with the restarting of machinery or with the generation of materials waste, or, in case of households, the costs deriving for example from a loss of leisure time, from spoiled goods and from stress. The proxy method, on the other hand, determines preferences as those of the average customer. An old and well known proxy approach implies taking the ratio of GDP to the total energy consumption (€/kWh) as an estimate of the unit Cost of Unsupplied Energy, or, conversely, of the Value of Service Reliability for the whole national power system. This estimate constitutes an upper bound for the overall interruption costs, while the ratio of the electricity bill and the total consumption of energy may be considered a reasonable lower bound. A similar approach has been used for applications to different customer categories, by considering detailed and specific supplementary data such as sales, employees and value-added data. The quantification of costs may not be trivial for households, because they do not produce market goods. However, it is possible to relate power interruptions to lost leisure time. Indeed electricity supply interruptions mean less free time and loss of leisure can be expressed in terms of the wage rate.
D3.3.1 Possible criteria to assess technical-economic and strategic benefits of specific transmission projects 32
4.2.4.2 Case study approach The case study approach consists in collecting as much information and data as possible immediately after the occurrence of a large-scale power supply interruption. Through these data, the costs of both generation and network outages can be quantified, directly or indirectly, and indices like €/kWh not supplied or €/kW lost during the interruption can be assessed for the whole concerned area as well as for different consumer categories, depending on the detail and accuracy of the study. Each type of interruption impact may be associated with the economic value of that category and all cost contributions can be summed up to obtain an aggregated value for the total interruption costs. Case studies may involve the consideration and listing of the different effects of a supply interruption in all fields of human activity. 4.2.4.3 Stated preferences This methodology is essentially based on customer surveys. Two approaches can be distinguished. The first one is the so called Contingent Evaluation Method (CVM), according to which customers are asked to estimate their costs or losses due to supply interruptions of varying duration and frequency at different time of the day and of the year. Alternatively, consumers have to indicate in a direct way how much money they are ready to pay for more reliability, i.e. their explicit willingness-to-pay (WTP), or how much money they want to receive in order to accept a lower reliability of supply, i.e. their explicit willingness-to-accept (WTA). The second approach is the so called Conjoint Analysis, where the consumers have to show their preferences with regard to both reliability and electricity prices, by providing in an indirect way a ranking between various combinations of such two factors. 4.2.4.4 Revealed preferences This methodology can be used to assess VOLL and similar indices for those consumers (generally medium and large firms) whose market behaviour can be directly or indirectly observed. Revealed preferences can be obtained from an inspection of (e.g. the extent to which firms are prepared to deploy back-up power), or through methods based on the analysis of consumers’ behaviour.
4.2.5 Computing procedures and techniques
In the literature several procedures and techniques are presented for the assessment of interruption cost indicators suitable for carrying out value-based comparisons among different power system expansion alternatives. Utility experiences and reports quoted in the literature confirm that:
1. when dealing with generation, transmission and high voltage distribution systems the most frequently used indicators are IEAR, VOLL and sometimes WTP;
2. since the customer survey approach is the most frequently used by utilities, the related procedures and techniques for the assessment of indicators in general include the following three computing steps:
• processing of raw collected data; • setting up customer interruption cost models; • computing of power system interruption cost indices.

D3.3.1 Possible criteria to assess technical-economic and strategic benefits of specific transmission projects
4.2.5.1 Processing of raw collected data It is widely recognised that end-users are less concerned with the energy not received during an interruption and its associated cost, but they are much more concerned with the costs associated with the inability of performing their day-by-day activities during the interruption. Therefore data collected through the customer survey approach are typically the cost per interruption (usually called CIC - Customer Interruption Cost) or WTP, both as a discrete function of selected interruption durations. In the literature it is possible to find several proposals for raw data processing methodologies and for procedures aimed at increasing the statistical power of the results of the analysis and their consistency with reality. Processing of collected raw data mainly consists in normalising individual customer data either by annual consumed energy (MWh) or by peak load demand (MW) in order to allow for the subsequent aggregation process into customers’ categories or sectors. 4.2.5.2 Customer interruption cost models These models are based on the so called Customer Damage Functions (CDF) whose most general formulation is:
}{ attributesalgeographicsticscharactericustomerattributesoutagelosseconomic FD ,,)( = The dependent variable (D) can be expressed as a loss in Euro per event, per kWh of energy not supplied, per kWh of annual energy consumption or per kW of annual peak demand. The equation predicts the economic loss as a function of factors that influence interruption costs. The outage attributes may include duration, season, time of day, advance notice and day of the week. The customer characteristics may include annual energy demand (kWh), power demand (kW), type of business, type of household, presence of various outage sensitive equipments, presence of backup equipments, etc. Finally, geographical attributes may include temperature, humidity, frequency of storms and other relevant geographical conditions [16]. Usually CDF represents the normalized Cost of Interruptions as a function of outage duration and parameterised according to consumer sectors (e.g. residential, industrial, commercial, etc.), season, day of the week, etc. CDFs can be formulated at three levels:
• Consumer level (CDF),
• Sector level (SCDF), by aggregating all consumers of the same sector and weighing the relevant CDFs,
• Composite Consumer level (CCDF), by weighing and combining the previously determined SCDFs.
SCDF is obtained through raw data statistical processing that may be problematic in presence of cross-sectional heterogeneity (multiple responses from each individual customer) or of a lot of zero issues, e.g. when dealing with surveys focused on WTP index. In these cases the adoption of Tobit regression model has been suggested in [15][16] to face the need of censoring some out of collected survey responses, thus making more consistent and powerful the results. Figure 4.2 gives an example of SCDFs, where damage (D) is expressed in $/incident [16].
33

D3.3.1 Possible criteria to assess technical-economic and strategic benefits of specific transmission projects
Duration of interruption (d)
Figure 4.2: Cost of interruption as a function of duration of interruption in different sectors ([16]) It has to be stressed that CDF, SCDF and CCDF, as previously defined, represent the cost, due to electricity interruptions, perceived by “individual”, “average sector” or “average system” customers, respectively. They are therefore system independent. 4.2.5.3 Computing of System Interruption Costs Indices
Computing of interruption costs indices like IEAR and VOLL requires the assessment of the expected total System Customer Outage Cost (SCOC), also called ECOST (Expected Customer Outage coST), that is the cost incurred by all the customers connected to a particular network or service area, by taking into account both the network performance data and the relevant loading information. Therefore ECOST is customer mix and system dependent. Indeed, when dealing in particular with transmission and HV distribution networks, ECOST can be assessed only if the frequency and duration of interruptions at system, service area and load point level, are available and they depend on network equipment failure and repair rates. Should an “ex post” outage cost investigation be developed, the system information on frequency and duration of interruptions as well as on the total energy not supplied due to outages of network components can be obtained from recording and processing of operation statistics. When, on the contrary, an “ex ante” outage cost investigation is required, as in the case of network expansion planning, power system interruption indices must be assessed by using suitable network modelling and computing procedures. More in general, for any system or part of it, the calculation of ECOST involves the convolution of the cost model, of the load model and of the system model [8]. This convolution process may be carried out according to various approaches and techniques.
34

D3.3.1 Possible criteria to assess technical-economic and strategic benefits of specific transmission projects
As far as the IEAR index is concerned, two techniques have been proposed to implement the convolution process [17]: the state enumeration method and the sequential Monte Carlo simulation. Accordingly, the basic formulas to calculate IEAR are as follows: IEAR Analytical state enumeration method:
( )€/kWinCCDF)(
heventloadof lossthiofdurationeventloadof lossthioffrequency
(kW)eventload of lossofmagnitudeyearpereventload of lossofnumber
(kWh/year)suppliednotenergyexpected(€/year)costoutagecustomerexpected
:
)/(€)(
1
1
=−=−=
====
==
∑
∑
=
=
i
i
i
i
NLE
iiii
NLE
iiii
dCdfmNLEEENSECOSTwhere
kWhdfm
dCfm
EENSECOSTIEAR
Monte Carlo sequential simulation:
ioninterruptiofcurtailedenergy(kW)ioninterruptiofload of loss
(€/kW)ddurationforcostoninterrupti)(oninterruptisampledthiofdurationsituationsoninterruptisampledtotalofnumber
:
)/(€)(
i
1
1
==
=−=
=
=
∑
∑
=
=
i
i
ii
i
N
ii
N
iiii
em
dcdnwhere
kWhe
mdcIEAR
It must be emphasized that by using the state enumeration approach the duration di is calculated as an average of all events having the same magnitude mi of lost load, while sequential Monte Carlo simulation allows to produce the actual distribution of such durations. Therefore, the Monte Carlo approach is preferable in order to avoid misleading results when the degree of non-linearity of CDFs with respect to interruption duration is high. As far as VOLL assessment is concerned a procedure has been proposed [8] that allows to take into account the distribution of interruption durations.
35

D3.3.1 Possible criteria to assess technical-economic and strategic benefits of specific transmission projects
VOLL as a function of interruption duration is directly derived from SCDFs (Sector Customer Damage Functions) or from CCDFs (Composite Customer Damage Functions) of the considered system or part of it, according to the following formula: VOLL
networkthetoconnectedconsumersoffactorloadaggregatedLFkWdurationdforCCDFofvaluedC
where
kWhLFd
dCdVOLL
ii
i
ii
==
=
)/(€)(:
)/(€*
)()(
Then the expected VOLL value is calculated as follows:
ii
ii
maxd
d
ddurationofoutageanofyprobabilitdpwhere
kWhdpdVOLLEVOLLi
i
=
= ∑=
)(:
)/(€)(*)(0
To implement the calculation of EVOLL a suitable and consistent distribution of interruption durations has to be determined beforehand. Simulation techniques might be useful to this aim. The values of VOLL available on the literature have been obtained through different approaches and computing methodologies. They are expressed in different currencies and referred to different years. Therefore, it is difficult to compare them each other. However, following general conclusions can be drawn: • VOLL tends to be higher for developed countries rather than for developing ones. This is due
to the fact that developed countries are featured by a ratio between electricity and total energy consumption that is typically higher than the values of developing countries.
• The differences illustrated above could be smoothed by expressing VOLL in PPP1 (Power Purchase Parity) rather than in US$ and current international exchange rates.
• It has been worldwide estimated that VOLL values (in €/kWh) could lie in the intervals 5 ÷ 25 and 2 ÷5 for developed and developing countries respectively, with 90% confidence limit.
• The spread in VOLL values in absolute terms, and thus the “risk” for a high value of VOLL, is higher for more developed countries than for developing ones, being median values closer to lower bound than to the upper bound of each relevant interval.
1 A Purchasing Power Parity estimate reflects the purchasing power of the inhabitants of a country and depends on market value. The effect of frequent currency fluctuations due to artificial reasons are eliminated in the PPP estimate. In the PPP approach the prices of goods and services are internationally arbitraged so that the cost of a standard market basket is the same in all countries when measured in terms of a common currency; therefore PPP can be used to convert the countries’ national expenditures to a common currency unit [11].
36
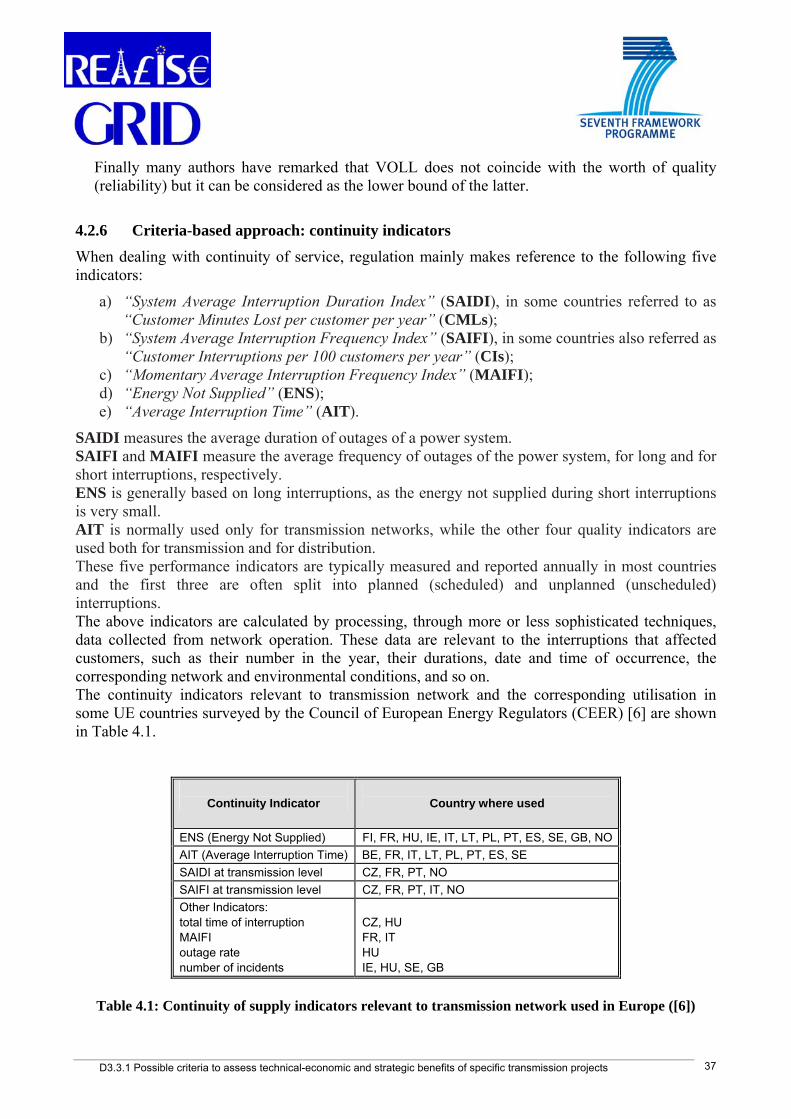
D3.3.1 Possible criteria to assess technical-economic and strategic benefits of specific transmission projects 37
Finally many authors have remarked that VOLL does not coincide with the worth of quality (reliability) but it can be considered as the lower bound of the latter.
4.2.6 Criteria-based approach: continuity indicators When dealing with continuity of service, regulation mainly makes reference to the following five indicators:
a) “System Average Interruption Duration Index” (SAIDI), in some countries referred to as “Customer Minutes Lost per customer per year” (CMLs);
b) “System Average Interruption Frequency Index” (SAIFI), in some countries also referred as “Customer Interruptions per 100 customers per year” (CIs);
c) “Momentary Average Interruption Frequency Index” (MAIFI); d) “Energy Not Supplied” (ENS); e) “Average Interruption Time” (AIT).
SAIDI measures the average duration of outages of a power system. SAIFI and MAIFI measure the average frequency of outages of the power system, for long and for short interruptions, respectively. ENS is generally based on long interruptions, as the energy not supplied during short interruptions is very small. AIT is normally used only for transmission networks, while the other four quality indicators are used both for transmission and for distribution. These five performance indicators are typically measured and reported annually in most countries and the first three are often split into planned (scheduled) and unplanned (unscheduled) interruptions. The above indicators are calculated by processing, through more or less sophisticated techniques, data collected from network operation. These data are relevant to the interruptions that affected customers, such as their number in the year, their durations, date and time of occurrence, the corresponding network and environmental conditions, and so on. The continuity indicators relevant to transmission network and the corresponding utilisation in some UE countries surveyed by the Council of European Energy Regulators (CEER) [6] are shown in Table 4.1.
Continuity Indicator
Country where used
ENS (Energy Not Supplied) FI, FR, HU, IE, IT, LT, PL, PT, ES, SE, GB, NO AIT (Average Interruption Time) BE, FR, IT, LT, PL, PT, ES, SE SAIDI at transmission level CZ, FR, PT, NO SAIFI at transmission level CZ, FR, PT, IT, NO Other Indicators: total time of interruption MAIFI outage rate number of incidents
CZ, HU FR, IT HU IE, HU, SE, GB
Table 4.1: Continuity of supply indicators relevant to transmission network used in Europe ([6])

D3.3.1 Possible criteria to assess technical-economic and strategic benefits of specific transmission projects
For most countries the information relates to transmission networks only, although there are some countries such as Italy, where the ENS and AIT information includes data from interruptions at distribution high voltage. Given that all other things being equal, a larger system would tend to record more energy not supplied than a smaller system, the information on ENS is presented as energy not supplied as a percentage of the total energy supplied by that system in a given year. 4.3 Market benefits 4.3.1 Unlock of efficient power generation
Transmission expansion by reducing network congestion can allow to dispatch more efficient power generation that was previously locked (‘substitution effect’). This benefit can be measured by an increase of the Social Welfare (SW). In a generic industrial sector the Social Welfare is defined as the sum of consumers surplus (CS) and producers surplus (PS). Consumers surplus is defined as the economic benefit of consumers by being able to purchase a product for a price cheaper than the price that they would be willing to pay. PS is the amount that producers benefit from selling their product at a market price higher than their marginal production costs2, which are the generation bid prices in a perfect competition (see also 4.3.2.2 ). In a mathematic formulation, the SW can be then expressed as
∑ ∑= =
−=NC
i
NG
joffGjGjoffCiCi PQPQSW
1 1
in which represents the electricity quantity offered by customer i at a price and analogously for offered by generator j at a price . and have to be within their respective minimum and maximum limits for electricity quantities. The first sum in the formula represents then the CS, i.e. the consumers willingness to pay for the electricity, while the second sum in the formula expresses the PS, i.e. the total producers benefit from selling electricity.
CiQ offCiP
GjQ offGjP CiQ GjQ
An industrial sector is designed in an efficient way if it can ensure that SW is maximised. By maximising the SW, generation and load demand can be appropriately scheduled. For each applicable period and market zone, a Market Clearing Price (MCP) can be calculated by the intersection of the aggregated sale and purchase curves, provided that no active bottlenecks exist. In presence of different market players, the merit order is used as a way of ranking available electricity generators, in order of their costs of production, so that the most efficient plants are more likely to be called to generate, rather than less efficient plants. This approach is then used to select the generators admitted to the market and remunerated at the MCP. Also in the electric industry, the economic benefits of transmission expansion in terms of overall efficiency of the electricity market can be assessed through the SW [21][22]. In order to better illustrate these concepts and their application to the electric system, a simple two-node electricity market system is considered, as illustrated in Figure 4.3.
38
2 Marginal production cost is the change in total electricity production cost that arises by producing an additional unit. It is the cost of producing one more unit of electricity [26].

D3.3.1 Possible criteria to assess technical-economic and strategic benefits of specific transmission projects
Figure 4.3: A simple bus system ([59])
In Figure 4.3 node 1 represents a generation node, while node 2 represents a consumption node. Figure 4.4 illustrates the SW for an electricity market that has the characteristics shown above in the two cases (without and with binding network constraints). Figure 4.4 (a) displays the unconstrained case: by crossing the non-increasing curve (representing the demand offer) with the non-decreasing curve (expressing the supply offer) the market clearing price and quantity can be graphically obtained. Figure 4.4 (a) shows also that the area below the demand curve and lower bound by the market price highlights the consumers surplus, while the area above the supply curve and upper bound by the market price represents the producers surplus. The sum of the two areas provides the SW. In presence of a binding network constraint, there is a limitation in power flow from generation to consumption: in this case, the congestion hindering the maximum flow prevents the formation of a single market price. In fact, being the flow lower than in the unconstrained case, it can be graphically observed (see Figure 4.4 (b)) that two different prices, an higher one for the consumers and a lower one for producers, are present. The area limited by the prices difference and the constrained flow (see grey area) expresses the so-called congestion revenue (or rent), also known as merchandise surplus. This represent a kind of income for the transmission owner/operator. It can be noticed that, in presence of active network constraints, SW includes the merchandise surplus. Transmission congestion can impact on SW leading to a loss of SW (see the small triangle area called dead-weight loss in Figure 4.4 (b)) which entails a loss of efficiency in the dispatching due to the effect of the system bottleneck. The loss comprises two components, one related to the loss of consumers surplus and another one related to the loss of producers surplus.
39

D3.3.1 Possible criteria to assess technical-economic and strategic benefits of specific transmission projects
Figure 4.4: Social welfare, consumers surplus and producers surplus, merchandise surplus and dead-
weight loss without (a) and with (b) active network constraints
Figure 4.5 shows the effect of transmission expansion towards congestion relief: it can be seen that the congestion cost can be reduced by the effect of a transmission expansion, i.e. the dead-weight loss area becomes smaller, and the merchandise surplus area also decreases (it becomes flatter). Substitution effect is the benefit that derives from the increased availability of more efficient generation capacity that in the previous system configuration was not available because it was constrained by network congestions. In order to measure the substitution component of SW increase, the situations with and without a given grid reinforcement have to be compared, assuming that generation firms sell electricity at a price equal to their marginal cost (i.e. with no price mark-ups3). The increase of SW calculated under these hypotheses can be considered to account for the substitution effect, i.e. the benefit that derives from the availability in importing areas of cheaper generation imported from other areas after transmission grid reinforcements. An approximated way of calculating the benefit of an increased import from an area at lower prices consists in expressing this revenue (CR) as
3 Price mark-up is the difference between the price at which the energy is offered in the market and the marginal (variable) production cost.
40

D3.3.1 Possible criteria to assess technical-economic and strategic benefits of specific transmission projects
CR = NTCh ΔΔλwhere Δλ is the electricity price differential between the importing and the exporting system, ΔNTC is the enhancement of transmission capacity available in secure conditions and granted by the reinforcement, and h represents the yearly utilisation hours of that link providing ΔNTC. The NTC (Net Transfer Capacity) can be defined as the maximum power transfer between two zones compatible with (n-1) security standards applicable in both zones and taking account of the technical uncertainties on future network conditions [69][72].
41
Figure 4.5: Effect of transmission capacity enhancement towards congestion relief ([18])
It has to be remarked that, when evaluating the transmission capacity enhancement between two zones or countries having an electricity price differential, the situation after the expansion might be the one represented in Figure 4.6. In fact, depending on the shape of the curve in the two zones, the price in the exporting zone (Figure 4.6, left) may (typically) increase or remain stable, while in the importing zone (Figure 4.6, right) the price may decrease or remain stable. As a consequence, the total cost paid by the consumers may either decrease or increase (in the example shown it actually increases), whereas the total SW is always increasing (difference between areas A and B), signaling a higher dispatching efficiency of the system due to the network expansion. In a systemic perspective the total SW shall be considered to measure the substitution effect, as it does not consider the viewpoint of a single player but incorporates all the viewpoints in an objective way.

D3.3.1 Possible criteria to assess technical-economic and strategic benefits of specific transmission projects
p2
A
p1
Export zone Import zone
Bp3
q q
p p
Figure 4.6: Effect of transmission expansion in price differentiated zones
4.3.2 Enhanced competitiveness of electricity markets
4.3.2.1 Introduction In the past, vertically integrated utilities based their transmission investment decisions with the goal of reducing production costs: hence, only the substitution effect was present. Nowadays, in a market environment, where suppliers usually aim at maximizing their revenues through bidding, this approach may lead to underestimate benefit evaluations, as transmission expansion may also increase market competitiveness leading to market price reduction (‘strategic effect’). The performance of a market is measured by the Social Welfare (SW). As previously described (see 4.3.1), the Social Welfare results by combining the total cost of the electricity and the total benefit of the electricity to society. If the demand for electricity is assumed to be independent of price, that is, if demand has zero price elasticity (demand curve is vertical without any change respect to price variation), then the Social Welfare is simply the negative of the total cost of electricity. It can be proved that a perfect market has the maximum level of Social Welfare, as producers bid at their respective marginal costs. Real markets generally operate at lower levels of Social Welfare. The difference in Social Welfare between a perfect market and a real market is a measure of the efficiency of the real market. The conditions required for the perfect competition are:
- presence of a large number of sellers (generators), each of them, while offering the same product and aiming at profit maximisation, is not able to influence either the output selling price or the inputs purchase price (i.e. each generator is a so-called price-taker);
- market prices knowledge by all generators; - costless transmissions.
In general none of these conditions is present in real electricity markets. The opposite situation respect to perfect competition is represented by the monopoly, in which one player dominates the market and is opposed by a multitude of consumers unable to bargain. Its production determines also the market price: price is then not any more an external variable and the firm is a so-called price-searcher or price-maker. An intermediate situation between perfect competition and monopoly is provided by the oligopoly, in which there are typically one or several price-makers plus, possibly, some price-takers. This is
42

D3.3.1 Possible criteria to assess technical-economic and strategic benefits of specific transmission projects 43
the most common case in an electrical market: a limited number of large producers (plus eventually a small number of price-takers) feed customers whose load demand is essentially rigid because of the scarce possibility to modulate consumption in function of price. In the following, theories and technical economic indices that are used to model the behavior of the different players of electricity markets and to eventually identify those generators’ behaviors that differ from perfect competition are first illustrated. This aims at quantifying the strategic effect deriving from network expansion. Then, game theory approaches targeted at modeling suppliers’ strategies are introduced. 4.3.2.2 Market power in the electricity sector Strategic effect is the benefit caused by a reduction of electricity price that derives from an increase of competition among different generation firms as a consequence of transmission network expansion. When a generator is a price-taker, the maximization of its profit implies bidding at its marginal costs. When a generator voluntarily offers at levels different from its marginal costs, in view of exploiting market imperfections and increasing profits, it behaves as a market player carrying out a so-called strategic bidding. This is typical of oligopolistic systems, in which the strategic choices of all the subjects are mutually dependent and the strategic behavior (human relations, negotiations, bluffing, etc.) becomes important. If a generator can successfully increase its profits by strategic bidding (or in any case by avoiding to lower its costs), it exercises market power. Market power is meant as the ability of a seller to profitably maintain prices above competitive levels for a significant period of time, which is measured in years (one or two years) according to the US DOJ (Department of Justice) and the Federal Trades Commission. Although this particular behavior can be attributed to single firm’s choices, it affects the market equilibrium. Market power leads to market inefficiency. There are many possible causes of market power, one of which is transmission congestion. The cost of market inefficiency due to congestion can be traded off against the cost of improving the transmission system and then serves as an economic signal for transmission reinforcement. 4.3.2.3 Practices of market power in the electricity sector A generation firm exercises market power when it adopts specific offer behaviors that cause market prices to be higher than prices resulting in case of perfect competition. These behaviors could be adopted either by the single firm (in case of dominant firm) or by a group of firms that operate without being coordinated (in case of oligopoly) or with illegal agreements (in case of cartel). Market power cannot exist in perfect competition, as the seller would loose market share without receiving additional profit. In particular, for a complex and organized sector like the electricity field, market power can be exercised in marginal markets4 mostly in two basic forms:
4 Marginal markets are those markets based on the merit order (the market price refers to the highest price of admitted generators) whereas in pay-as-bid markets generators are repaid according to their actual offer.
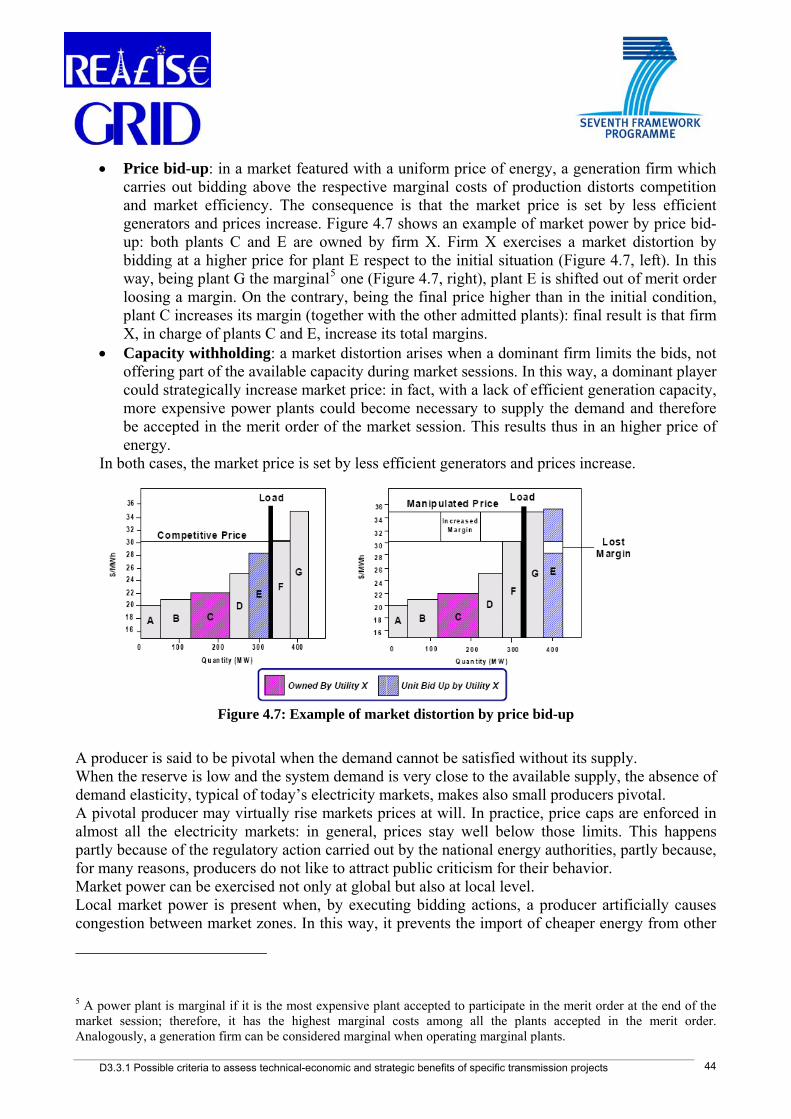
D3.3.1 Possible criteria to assess technical-economic and strategic benefits of specific transmission projects
• Price bid-up: in a market featured with a uniform price of energy, a generation firm which carries out bidding above the respective marginal costs of production distorts competition and market efficiency. The consequence is that the market price is set by less efficient generators and prices increase. Figure 4.7 shows an example of market power by price bid-up: both plants C and E are owned by firm X. Firm X exercises a market distortion by bidding at a higher price for plant E respect to the initial situation (Figure 4.7, left). In this way, being plant G the marginal5 one (Figure 4.7, right), plant E is shifted out of merit order loosing a margin. On the contrary, being the final price higher than in the initial condition, plant C increases its margin (together with the other admitted plants): final result is that firm X, in charge of plants C and E, increase its total margins.
• Capacity withholding: a market distortion arises when a dominant firm limits the bids, not offering part of the available capacity during market sessions. In this way, a dominant player could strategically increase market price: in fact, with a lack of efficient generation capacity, more expensive power plants could become necessary to supply the demand and therefore be accepted in the merit order of the market session. This results thus in an higher price of energy.
In both cases, the market price is set by less efficient generators and prices increase.
Figure 4.7: Example of market distortion by price bid-up
A producer is said to be pivotal when the demand cannot be satisfied without its supply. When the reserve is low and the system demand is very close to the available supply, the absence of demand elasticity, typical of today’s electricity markets, makes also small producers pivotal. A pivotal producer may virtually rise markets prices at will. In practice, price caps are enforced in almost all the electricity markets: in general, prices stay well below those limits. This happens partly because of the regulatory action carried out by the national energy authorities, partly because, for many reasons, producers do not like to attract public criticism for their behavior. Market power can be exercised not only at global but also at local level. Local market power is present when, by executing bidding actions, a producer artificially causes congestion between market zones. In this way, it prevents the import of cheaper energy from other
44
5 A power plant is marginal if it is the most expensive plant accepted to participate in the merit order at the end of the market session; therefore, it has the highest marginal costs among all the plants accepted in the merit order. Analogously, a generation firm can be considered marginal when operating marginal plants.

D3.3.1 Possible criteria to assess technical-economic and strategic benefits of specific transmission projects
zones and creates pivotality conditions for its own local generators in the importer zone. The action of creating congestion may be not profitable in itself, but the sum of this with the effect of market power exercised by local generators turns up to be very profitable for the producer [23].
4.3.2.4 Indices used to assess market power in the electricity sector Several approaches have been developed in literature to identify and classify the firms’ market power [24]. The different methods for detecting market power can be classified in: - ex-ante (structural indices to assess potential of market power) and ex-post techniques (behavioral indices to assess actual exercise of market power); - techniques to be applied over large time horizons and those applied close to real time; - techniques to be applied to the market as a whole, others at company level; - techniques looking at markets from a system-wide or local perspective. These methodologies adopt some indicators to synthetically explain the firms’ market power. Traditional tools for detecting the presence of market power have proven to be unreliable in the electricity market. The structure of this particular market requires to control the concentration of generation and to detect the presence of dominant players or the existence of oligopoly. Ex-ante indicators To assess potential of market power, structural indices are utilized for an ex-ante analysis. Among these indicators there are concentration indices, which are scalar metrics measuring the supplier concentration of a market. The most common are Market Share and HHI (Herfindal Hirschman Index). Market Share is the percentage of market share of the n (typically 3-4) largest companies and can be measured as
100*tot
ii
qqa =
in which ai, qi, qtot represent respectively the market share of firm i, the electricity quantity sold on the market by firm i and the total electricity sold on the market. The US FERC (Federal Electricity Regulatory Council) identifies a significant level of market power with ai > 20%. One of the most used indicators for analyzing market concentration is the Herfindal Hirschman Index (HHI), which can be calculated as
∑==
n
iiaHHI
1
2
in which n stands for the number of firms that operate in the market analysed and ai represents the related market share (in percentages). Higher values of HHI reveal that, in the market analysed, exist conditions that favour the exercise of market power. In fact, market featured with high HHI values are strongly oligopolistic or host one (or several) dominant player(s). Table 4.2 reports some values of HHI. Number of firms in the market Market share of each firm Value of HHI 10 10% 1000 5 20% 2000 1 100% 10000
Table 4.2 – Values of HHI index ([19])
45

D3.3.1 Possible criteria to assess technical-economic and strategic benefits of specific transmission projects
In a market, if a firm continuously increases its market share, HHI index significantly grows. FERC relies on HHI index to detect market power. Conventional FERC thresholds for HHI consider that:
- below a HHI value of 1000 the market is concentrated; - in a range between 1000 and 1800 for HHI the market is moderately concentrated; - above a HHI value of 1800 the market is highly concentrated.
An HHI higher than 2000 indicates, according to FERC, that suppliers have potential market power [20]. However, this indicator in the past (especially during California energy crisis that took place in 2000-2001) did not prove to be sufficient to reveal the true market power possessed by suppliers. In general, a criticism to market share and HHI is the following: even when the most dominant seller has a relatively small share (less than 10%), the exercise of market power may be significant. In fact, electricity market conditions change hour by hour and in peak hours system demand may be close to capacity, making suppliers become necessary (pivotal). Other ex-ante indicators are provided by Pivotal Supplier Indicator and the Pivotal Supply Index (PSI). The Pivotal Supplier Indicator examines whether a given generator is necessary (pivotal) in serving demand. It tests whether the difference between demand and maximum quantity that can be supplied by other generators is positive. The Pivotal Supply Index (PSI) is a binary hourly pivotality indicator that measures the percentage of time in which a producer is pivotal over one year. It has to be noted however that pivotality indicators provide a measure that only applies to peak hours and overlooks potential for coordinated interaction among generators. To overcome these difficulties the Department of Market Analysis (DMA) of the California Independent System Operator (CAISO) proposed an innovative index to account for the extent to which a player could be dominant in a market and has therefore the opportunity to affect market outcomes. The index proposed is Residual Supply Index (RSI), which for a company i measures the percentage of supply capacity remaining in the market to cover the demand after subtracting company i capacity of supply and is expressed as:
100*_
__DemandTotal
CapacityFirmCapacityTotalRSI ii
−=
When supplier i is pivotal its RSIi is lower than 100 and the potential for market power abuse is more serious. When supplier i is not pivotal its RSIi is higher than 100: this means that the other suppliers have enough capacity to meet market demand and company i has small influence on prices. However, there still may be oligopoly market power. RSI can be calculated for the whole market. In this case it is defined as the smallest company’s RSI (i.e. the one corresponding to the biggest supplier). The advantage of RSI over PSI is that RSI thresholds can be set up while PSI is a binary index. Ex-post indicators These indices typically examine actual conduct of companies and are then behavioral indicators, whereas structural indices look at potentialities for exercise of market power. Differently from HHI, they do not investigate potential market power but the actual exercise of it, basing on real market outcomes. In fact, in a competitive market firms behave as price takers and so they offer electricity at a price equal to their marginal costs (MC). Therefore, an important parameter to detect market power is to estimate the difference between the price offered by a firm
46

D3.3.1 Possible criteria to assess technical-economic and strategic benefits of specific transmission projects
and its marginal production cost (mark-up). The most used index in this category is the LI (Lerner Index), expressed as a percentage by
100*PMCPLI −
=
LI represents the Lerner Index calculated for the whole market, P stands for market (marginal) price, MC is the marginal cost (market price in perfect competition). Another indicator, the Price-Cost Marginal Index (PCMI), is very similar to the LI as it can be calculated as
100*MC
MCPPCMI −=
The competitivity threshold for both LI and PCMI is generally set at 5%. LI and PCMI may give a good indication of allocative efficiency of a specific market. However, high values of LI and PCMI do not necessarily imply abuse of market power: in fact, in a system marginal price market, equilibrium price could be higher than prices offered by single firms. Moreover, it is not possible to prove that a single firm or a group of firms is illicitly adulterating the market just relying on the analysis of mark-up indices (for example, in an oligopoly there could be a non coordinated interaction between two firms). It has to be remarked that some difficulties in the evaluation of LI and PCMI may arise related to how to calculate marginal production costs, whether they coincide with the ones calculated from variable fuel costs: in this case, some other cost components (like opportunity costs) would be not taken into account. The values of LI and PCMI are also highly fluctuating and do not consider zonal prices [23]. It can be generally said that both structural and behavioral indices proved to be inadequate to correctly analyse market power in electricity sector. In fact, they do not account for few specific aspects such as: magnitude of the relevant market (dimensions of an electrical market depends on geographical and technical limitations imposed by transport capacity that is not included in any index); dynamic definition of zones (separation of market into different zones is a dynamic process, therefore the dimensions of relevant market might change after every market session whereas indices are static); available capacity (for each firm the installed capacity is considered, whereas only capacity that is not already engaged with long term contract should be used to calculate those indices). An empirical research reported in [20] and based on actual data from the California wholesale electricity market showed a relationship between the price-cost mark-up and RSI. As a result, the following regression model between LI and RSI can be reached
eLoadcRSIbaPMCP
+++=− **
in which Load is measured in GW and e is the random error term. The inclusion of the load variable is necessary in order to recognize the fact that price–cost mark-up might be very different under general load conditions even when the RSI values are the same. In [20] the coefficients of regression model for 4 different sets of cases (winter peak, winter off-peak, summer peak, summer off-peak) during the period 1999-2000 are estimated. Figure 4.8 reports the correlation between RSI and LI for summer peak hours in year 2000 in the Californian market.
47

D3.3.1 Possible criteria to assess technical-economic and strategic benefits of specific transmission projects
Figure 4.8: RSI vs. LI for 2000 summer peak in Californian market ([20])
However, a correct assessment of market power potentials for a given system can be carried out only by resorting to game theory approaches [68]. 4.3.2.5 Game theory for market power analysis Game theory finds application in the modeling of many aspects of economics. In particular, it is a suitable way to deal with those fields in which the strategic choices of all the subjects are mutually dependent, where the strategic behaviour (human relations, negotiations, bluffing, etc.) becomes important. This is the case of oligopolistic electricity markets. In an oligopoly, each subject maximizes its own objective function (profit, market share, etc.), that is, in general, different from the one of the others. Each decision maker may have an imperfect knowledge of objectives and constraints of the others, as well as an imperfect knowledge of the external environment. Oligopolies may be modelled as a multi-decisor, multi-objective system, i.e. as a game. The most important historical contribution came from: John von Neumann and Oskar Morgenstern, who first formalized the subject and found a solution for the class of zero-sum games; John Nash, who gave an important contribution by formulating the concept of equilibrium carrying his name; Reinhard Selten for dynamic games and John Harsanyi for incomplete information. Recently, game theory based models of electricity markets have been formulated in numerous ways. The reasons for these developments are: - electricity markets are in general structurally oligopolistic, both due to reasons tied to scale economies and because they have been created by selling portions of the old integrated state-owned monopolistic societies; - some characteristics, like the impossibility to store electricity and the transit limitations on transmission lines, enhance the possibilities to behave strategically and make these market subject to significant price oscillations. Simulation may help to individuate criticities, in particular where historical series are lacking.
48

D3.3.1 Possible criteria to assess technical-economic and strategic benefits of specific transmission projects
Comparing optimization and game theory approaches, optimization models are simpler and more flexible, while game theory is (at least conceptually) closer to real world. Game theory is particularly concerned with finding equilibrium points, defined as this set of strategies, one for each decision maker, from which no player finds convenient to deviate. A player’s strategy is strongly dominant if it generates a profit higher than the others do, whichever the strategy chosen by the other players. A player’s strategy is weakly dominant if it generates a profit lower or equal to what the others do, whichever the strategy chosen by the other players. Figure 4.9 shows an example of strongly and weakly dominant strategies (1 and 2). If all the players dispose of a dominant strategy, this is also the solution of the game. This rarely happens.
Figure 4.9: Example of strongly and weakly dominant strategies
A given strategy of player i is a best response to a vector of strategies S-i of the other players if it weakly dominates all the strategies of i, provided that the others play S-i. It is the best strategy i can play if it knows the other players’ strategies. A vector of strategies is defined to be at Nash’s equilibrium if each decision-maker is playing a best response to any other player’s strategy. Thus, players have unilaterally no incentive to modify their strategies. This does not mean that if two or more players modify contemporarily their strategies, they could (maybe) achieve an equilibrium that is better for all. However, this would require the formation of coalitions (cartels) instead of a separate optimization of each player. The explications on how a Nash’s equilibrium may be reached are only qualitative (“parables”). One of the most common ones sees Nash’s equilibrium as the final point of a trial and error process in which each player modifies in turn its strategy until a point is reached where no-one finds it convenient to modify its strategy any longer. This explication, yet intuitive, does not prove that the iterative process is stable (i.e. tends to an equilibrium). Given a player (or more players) with pure strategies, a mixed strategy is defined by means of a vector of probabilities, one for each pure strategy. The payoff of a mixed strategy is evaluated as an average of the payoff achieved with all pure strategies weighed with the probabilities. There may exist mixed strategies that are not dominated by any pure strategy. There is an existence theorem (Nash’s theorem) but no uniqueness theorem. Nash’s theorem states that all the games with a finite number of pure strategies for each player admit at least one Nash’s equilibrium, provided that mixed strategies are accounted for too. Considering the simulation of electricity markets via game theory, the final product (electricity) is indistinguishable whoever is the producer: the only strategic variables are then price and quantity. A review of the literature of simulators of electricity markets via game theory shows that most simulators are oriented to the short term, while a few have a mid-time horizon. Long-term
49

D3.3.1 Possible criteria to assess technical-economic and strategic benefits of specific transmission projects 50
simulators are very rare and usually have a hierarchical structure (with a long term external game repeatedly calling a short term internal game). Regarding the modeling approach, discretisation allows to explore all the equilibria and to easily extend analysis to mixed solutions. However, the choice of sampling interval is critical. Furthermore, it is very difficult to take into account technical constraints (that are provided in form of functions). Thus, the continuous (iterative) approach is usually preferred, even if with this approach it is difficult to explore all the equilibria and take into account mixed solutions. Within the modeling approach the effect of price-takers is eliminated: for each price level, the quantities each price-taker would produce if it could produce each unit of power whose marginal cost is lower than the current price level are subtracted from the market demand curve. The resulting demand is the one that firms compete to satisfy. The equilibrium point can be calculated iteratively: the first producer decides the power production level maximising profits supposing the other firms produce zero power; each firm recalculates in turn its power on the basis of the decisions taken by the other firms; this process continues until no firm finds it convenient to modify the produced power. This point individuates the equilibrium point. Representing inter-zonal constraints is the only way to make a market simulator capable to assess the possibility to exercise local market power. However, the resulting model is far more difficult to solve for different reasons. First, the solution of the electricity market cannot be represented as a sheer intersection of demand and offer, but must be represented as an optimization problem in which the parameter Social Welfare is maximized. This problem is somehow “nested” inside the optimization of each player, who maximizes its surplus. Treating this “nesting” is not trivial [68]. Second, a “pure” optimal strategy that solves the game for each player does not always exist: mixed strategies must be taken into account, that randomize a range of values for the strategic variable (e.g. price bid-up) on the basis of given probability values. In a study case [73] featuring a single connector connecting two areas A and B, having each a different producer, if the tie line has zero capacity, A and B are two monopolies. If it has high capacity, the system is a duopoly. In an intermediate range, only a mixed strategies solution exists. Last but not least, the problem is not convex and subject to local optima. The game theory approach, yet better than optimisation approaches for modeling strategies, has to cope with some critical limitations, such as:
- difficulty to characterise true behaviours of dominant players (not just profit maximizers) - difficulty to cope with local optima due to non-convexity
4.4 RES exploitation and sustainability benefits 4.4.1 Introduction Due to improved interconnections within Europe and a proper development of the internal grids, the general usage of wind power could be increased and conventional power plants (especially fossil-fuel based) would decrease their production share [37]. As a direct consequence a greater amount of fossil-fuel plants’ emissions could be avoided and the fossil-fuel consumption with its related costs would also decrease. According to the European Commission’s Green Paper [33], sustainability is one of the main principles on which the European Union bases its energy policy. Moreover in the Communication of the European Council “20-20-20 by 2020 – Europe’s climate change opportunity” [34], two

D3.3.1 Possible criteria to assess technical-economic and strategic benefits of specific transmission projects 51
targets were set for the year 2020, specifically a reduction of at least 20% in greenhouse gases and a 20% share of renewable energies in EU energy consumption. These actions will increase the security of energy supply in the European Union by reducing the EU dependence on imports of oil and gas. In addition, the current Emissions Trading Scheme (ETS) will be enhanced and amongst the changes to be made, a full auctioning system for the CO2 emissions produced by power sector should be available from 2013. The ETS appeared as a result of the European Commission’s initiative to quantify and give a monetary value to the externalities of different processes including the ones in the power sector. In the ExternE project founded by the EC [55] a thorough methodology for calculating the (negative) externalities of energy was proposed and at present it is widely accepted by the scientific community and it represents the world reference in the field. By using this methodology, it was proven in [31] that by increasing the wind utilization in the EU the negative external effects of the energy sector can be diminished with the emissions reduction. The large-scale integration of RES plants in today’s and future European power systems is a problem of great concern for all member countries which should be solved at EU level. The major problems related to maintaining a stable and reliable electricity supply while integrating large amounts of RES refer to changed approaches in power system operation and planning i.e. extension and modification of the generation and transmission infrastructure, including connection requirements for RES plants. More cross-border links – interconnectors – will enable collection of RES power from resourceful areas and transmitting it to consumer centres. This can be achieved provided that institutional and legal barriers to increased RES penetration are solved [27]. Wind energy represents the most exploited renewable resource in Europe and it has the greatest potential for a large-scale integration. From the European Commission’s point of view [33]-[35], the electricity grid and the structure of the power sector are the main barriers to effective competition in the European electricity markets. The liberalisation process has also resulted in an increase of cross-border and inter-zonal power transfers. This in turn reduces the cost of integrating wind power on a large scale due to the “geographic spread” effect. The direct benefit of geographical aggregation of wind power output is the increased amount of reliable electricity which can be used to replace conventional generation. This is possible only if the underlying transmission network is reliable and well dimensioned. Removing grid bottlenecks enlarges the geographic area in which wind power is averaged, diminishing the overall intermittent effect and allowing the wind backup reserve to be retrieved and shared on a wider area. Therefore balancing costs and reserve requirements can be reduced. By considering all the above mentioned the main benefits of pan-European transmission expansion in terms of sustainability improvement due to wind energy exploitation are the ones illustrated in Figure 4-10 and will be further detailed.
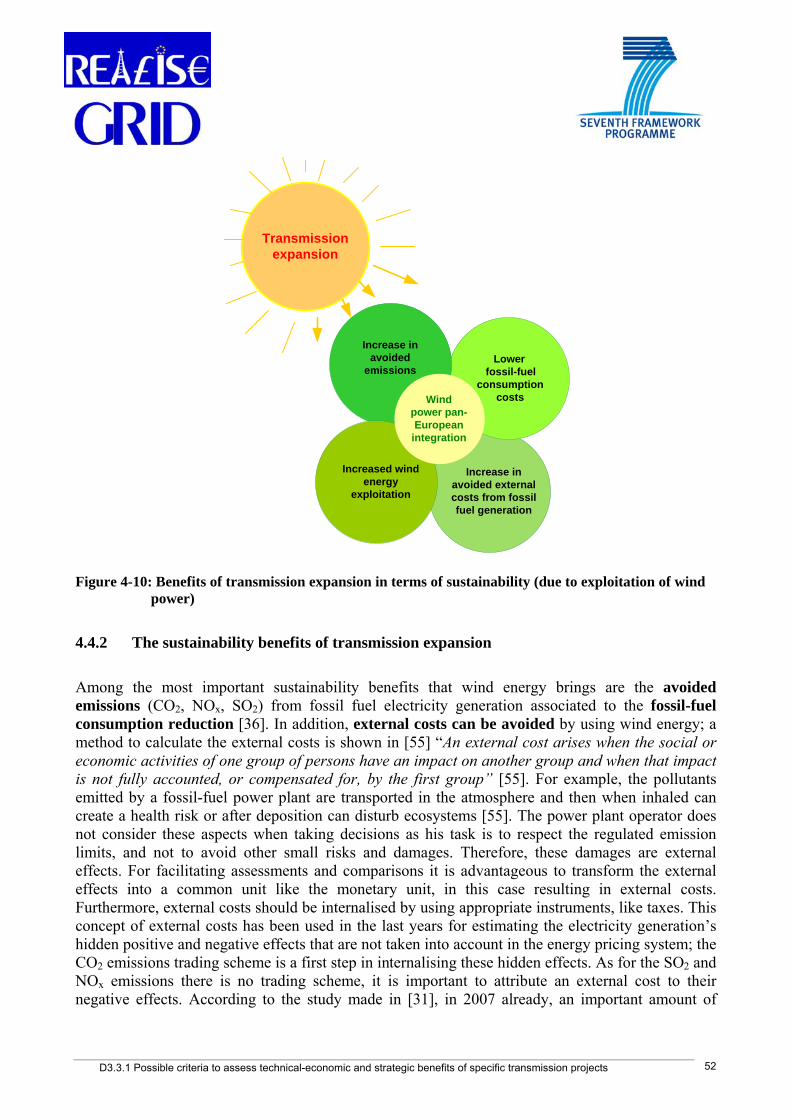
D3.3.1 Possible criteria to assess technical-economic and strategic benefits of specific transmission projects
Increase in avoided external costs from fossil fuel generation
Lower fossil-fuel
consumption costs
Increase in avoided
emissions
Increased wind energy
exploitation
Wind power pan-European
integration
Transmission expansion
Figure 4-10: Benefits of transmission expansion in terms of sustainability (due to exploitation of wind power)
4.4.2 The sustainability benefits of transmission expansion
Among the most important sustainability benefits that wind energy brings are the avoided emissions (CO2, NOx, SO2) from fossil fuel electricity generation associated to the fossil-fuel consumption reduction [36]. In addition, external costs can be avoided by using wind energy; a method to calculate the external costs is shown in [55] “An external cost arises when the social or economic activities of one group of persons have an impact on another group and when that impact is not fully accounted, or compensated for, by the first group” [55]. For example, the pollutants emitted by a fossil-fuel power plant are transported in the atmosphere and then when inhaled can create a health risk or after deposition can disturb ecosystems [55]. The power plant operator does not consider these aspects when taking decisions as his task is to respect the regulated emission limits, and not to avoid other small risks and damages. Therefore, these damages are external effects. For facilitating assessments and comparisons it is advantageous to transform the external effects into a common unit like the monetary unit, in this case resulting in external costs. Furthermore, external costs should be internalised by using appropriate instruments, like taxes. This concept of external costs has been used in the last years for estimating the electricity generation’s hidden positive and negative effects that are not taken into account in the energy pricing system; the CO2 emissions trading scheme is a first step in internalising these hidden effects. As for the SO2 and NOx emissions there is no trading scheme, it is important to attribute an external cost to their negative effects. According to the study made in [31], in 2007 already, an important amount of
52

D3.3.1 Possible criteria to assess technical-economic and strategic benefits of specific transmission projects
emissions (Figure 4-11) and external costs (Figure 4-12) have been avoided by wind energy at the EU-27 level.
Total Emissions Avoided by Wind in the EU27 in 2007
0
3000
6000
9000
12000
15000
18000
21000
24000
27000
Belg
ium
Bulg
aria
Cze
ch R
ep.
Den
mar
k
Ger
man
y
Esto
nia
Irlea
nd
Gre
ece
Spai
n
Fran
ce
Italy
Cyp
rus
Latv
ia
Lith
uani
a
Luxe
mbo
urg
Hun
gary
Mal
ta
Net
herla
nds
Aust
ria
Pola
nd
Portu
gal
Rom
ania
Slov
enia
Slov
akia
Finl
and
Swed
en UK
CO
2 [kt
/yr]
0
20
40
60
80
100
120
140
SO2,
NO
x [kt
/yr]
CO2SO2NOX
Figure 4-11: Total emissions (CO2, SO2, NOx) from fossil-fuel based electricity generation already
avoided by wind energy in the EU27 Member States in 2007 [31]
Avoided External Costs (Average Values) by Wind Generationin each of the EU7 Member States in 2007
Germany; 3027 €m2007/yr
France; 316 €m2007/yr
Italy; 377 €m2007/yr
Netherlands; 172 €m2007/yr
Spain; 3968 €m2007/yr Greece; 400 €m2007/yr
Estonia; 21 €m2007/yr
Ireland; 157 €m2007/yr
Denmark; 518 €m2007/yrCzech Rep; 12 €m2007/yr
Malta; 0 €m2007/yr
Hungary; 43 €m2007/yr
Portugal; 388 €m2007/yr
Poland; 65 €m2007/yr
UK; 472 €m2007/yrSweden; 86 €m2007/yrFinland; 11 €m2007/yrSlovakia; 1 €m2007/yr
Luxembourg; 2 €m2007/yrLithuania; 0 €m2007/yr
Cyprus; 0 €m2007/yr
Austria; 124 €m2007/yr
Latvia; 2 €m2007/yr
Belgium; 51 €m2007/yrBulgaria; 4 €m2007/yr
Romania; 0 €m2007/yr
Slovenia; 0 €m2007/yr
Figure 4-12: Distribution of Avoided External Costs (Average Values in €m2007/yr) by Wind
Generation between the EU27 Member States in 2007 [31]
It is indicated [31] that a further important increase in the share of wind deployment in the next years and decades is crucial for obtaining more environmental benefits. This increase relies on an
53

D3.3.1 Possible criteria to assess technical-economic and strategic benefits of specific transmission projects 54
appropriate integration of wind power in the European system, i.e. on an appropriate development of the transmission grid. When talking about wind power integration an important notion is the capacity credit. An often used definition of capacity credit/value is “the amount of firm conventional generation capacity that can be replaced with wind generation capacity, while maintaining the existing levels of security of supply” [28]. In the TradeWind project [28] the capacity credit is augmented by grouping the wind energy production from several countries, and the more countries are “clustered” (hence a larger geographical spread) the bigger the increase. The increase in capacity credit assumes a better exploitation of wind power by using efficiently the interconnection lines between European countries. As shown in [39] and [40], calculating capacity credit is usually based on power system reliability analysis methods. Criteria as loss of load expectation (LOLE), loss of load probability (LOLP), effective load carrying capability (ELCC) can be calculated. The reliability methods can be chronological or probabilistic, both requiring historical load time series for the study period, wind data (chronological or probabilistic), a complete inventory of conventional generation units with their forced outage rates and the target reliability level. When computing capacity credit, transmission constraints are disregarded, therefore whatever the international market wants to achieve in terms of imports/exports of electricity is possible. Hence capacity credit is not a proper concept for studying effects of transmission capacity enhancement. A parameter more adequate for evaluating transmission planning options is an increased exploitation of wind energy. This is related on the one hand to less wasted wind energy and changes in the generation mix production output, and on the other hand to an increased capacity of the grid to host additional installed wind capacity while retiring or not conventional generation. Wasted wind is given by the difference between the available wind power and the actual produced wind power. Curtailing wind power is possible only in the case of dispatchable wind power plants, but in the future this ability will be compulsory for all large wind power plants. Figure 4-13 illustrates the wasted wind energy in the Netherlands for various wind power penetrations and flexible international exchanges, which are scheduled almost until the moment of operation (1 hour ahead, market gate closure time) [37]. In this example the wasted wind energy appears due to the inflexibility of the power system and fixed transmission capacities to other countries. Moreover, the generation mix participating at covering the load curve has direct influences on fuel consumption and produced emissions.

D3.3.1 Possible criteria to assess technical-economic and strategic benefits of specific transmission projects
0
5
10
15
20
25
30
35
40
45
50
00GW 02GW 04GW 06GW 08GW 10GW 12GW
Was
ted
Win
d E
nerg
y (T
Wh/
year
)
Unused wind energyUsed wind energy Available wind energy
TWh
Figure 4-13: Wasted wind energy in the Netherlands for 0-12 GW of installed wind power and flexible
international exchange [37]
The methodologies able to account for the four benefits described above and illustrated in Figure 4-10 will be analysed in section 4.4.3. 4.4.3 Methodologies to investigate sustainability improvement
The purpose of this section is to derive methodologies and criteria for the assessment of the sustainability related benefits. Sustainability assessment methods are very important as they are the ones providing valuable information for guiding the decision and policy makers in adopting the right measures. There are various methods for assessing sustainability and they can range from single indicators to complex multi-disciplinary indicators. These indicators can refer to the whole system or to certain parts of the concerned system. In the multi-disciplinary case, indicators for the social, environmental and economic spheres are simultaneously assessed. In [42] it is stated that four important aspects should be considered in the process of developing criteria for assessing an energy system’s sustainability: resource, environment, social aspects and economic aspects. Sustainability improvement due to transmission expansion represents a recent study direction, as more interest has been shown in comparing sustainability benefits of generation expansion. In the DENA Grid study [57] the planning of wind energy grid integration within Germany is analysed. While the first part of the project (that was completed in 2005) did not tackle the environmental benefits of transmission expansion, the DENA II study might consider them. The influence of wind power development on the conventional generation park development was studied considering different scenarios. LEETS [58] uses a life-cycle based methodology to carry out an environmental and economic analysis of transmission projects. Visual impact, noise sensitivity, and other local environmental impacts are assessed and in addition, at global level, the CO2 emissions related to system losses are
55

D3.3.1 Possible criteria to assess technical-economic and strategic benefits of specific transmission projects 56
quantified. This tool is very useful where local environmental impact variations may be significant between different projects. The methodology proposed in this section, is based on the simultaneous computation of four main criteria related to the environment, resources, social and economic aspects:
1. Increase in wind energy exploitation; 2. Emissions savings (CO2, NOx, SO2); 3. Increase in avoided external costs; 4. Total operating fossil-fuel cost reduction of electrical power systems.
In order to assess the four defined benefits, simulations of power system operation including RES have to be run. For providing the necessary information to apply these criteria, a scenario analysis needs to be performed. Solving a specific transmission planning problem implies to search for the best solution among several project proposals. A reference period for the scenario analysis needs to be chosen varying from 6 to 12 months according to data availability, to which all the scenario parameters, such as system load, composition of conventional generation park, installed wind power capacity, are referred. In order to capture the variation of wind, load and generation profiles most accurately, a 1 year period is recommended and we shall refer to it. Furthermore, for the study year, simulations of how an ideal electricity market with different scenarios for closure of energy markets would function should be performed via dedicated tools. The tools should be able to calculate both unit commitment and economic dispatch. The internal generation output in each area of the network and the market prices are determined, taking into account at least the inter-zonal transmission capacity constraints. In order to consider also internal transmission constraints, an optimal power flow program can be used that allows re-dispatch for relieving the network constraints. For solving the unit commitment and economic dispatch problem, wind and load profiles for the study area are needed as an input together with data on fuel efficiencies and capabilities of conventional plants. The social welfare is maximized within the boundary conditions of serving system load and local heat demands, and maximum integration of wind power. To that purpose, the bid price of wind power is set to zero. In this problem formulation we assume a perfect market and inelastic demand, therefore social welfare maximization is equivalent to operating cost minimization. Unit commitment and dispatch can be optimized considering sequential time steps, with the purpose of obtaining the minimum operating cost at the system level while all technical constraints are met at all times. Table 4-3 summarizes various existent tools for power systems operation simulation [36], [59]. Table 4-3: Different existing tools for power systems operation analysis and their characteristics
Tool Optimisation type Balmorel Linear Programming EnergyPLAN Linear Programming MTSIM Linear zonal optimization with heuristic UC PowrSym3 Heuristic/Dynamic Programming REMARK Linear Programming (DC OPF) SIVAEL Dynamic Programming WILMAR Linear Programming

D3.3.1 Possible criteria to assess technical-economic and strategic benefits of specific transmission projects 57
The REMARK tool performs a DC optimal power flow starting from a predetermined unit commitment and considers therefore also the internal transmission constraints within different zones, re-dispatching the energy production accordingly. As an alternative a program as PowrSym3 [45], [46] could be used for performing the UC-ED while respecting only inter-zonal network constraints and afterwards a power flow analysis tool could be used for doing a re-dispatch until all the network violations are eliminated. Two wind years (high and low wind) can be considered for carrying out a sensitivity analysis on the benefits related to wind resources usage. Our approach adopts a typical sensitivity analysis, by comparing the differences between a base case and a study case. Study cases are created for individual inter-zonal and cross-border transmission projects. Sustainability increase is compared between different projects proposals by the means of indicators values and graphical representation. The parameters and benefits to be compared are illustrated in Table 4-4. Table 4-4: Parameters and benefits to be compared between projects
Parameter Benefit Additional installed wind power [MW]
Increase in installed wind power in [%] of the base case installed wind power value
Wasted wind energy [TWh/yr] only for countries where wind power can be curtailed
Decrease in wasted wind energy in [%] of the base case wasted wind energy value
Emissions-related operating costs [Euro/yr]
Decrease in emissions related operating costs in [%] relative to the base case emissions-related operating costs
Fossil-fuel generation external costs [Euro/yr]
Increase in avoided fossil fuel generation external costs in [%] of the base case fossil-fuel generation external costs
Operating costs due to fossil fuel consumption [Euro/yr]
Decrease in fossil-fuel related operating costs in [%] of the base case fossil-fuel operating cost value
Such graphics should be made for both low wind and high wind years. Moreover, a comparison between the low wind and the high wind year can be made. Unit Commitment (UC) and Economic Dispatch (ED) The unit commitment problem consists of the economical determination of a switch-on/switch-off schedule for all the generation units which will be used to cover the forecasted demand while respecting the operating constraints such as spinning reserve requirements, ramp rates, minimum up and down times of conventional units, fuel and emission constraints over a short time horizon. In a non-deregulated environment, the economic dispatch is solved together with the unit commitment and refers to how to distribute system load between the operating units for minimizing the total operating cost. By contrast, in deregulated markets, the unit commitment results from decentralized bidding decisions carried out by the generation companies (GenCos). These decisions are typically based on estimates of market prices and load share [36]. Few markets [60], [61] allow “multi-part” bids which are equivalent to Unit Commitment – Economic Dispatch (UC-ED), and include e.g.: the plants’ flexibility (min up/down times, ramp rates), start-up costs, operating limits. In the ideal

D3.3.1 Possible criteria to assess technical-economic and strategic benefits of specific transmission projects
hypothesis that a sum of several decentralized decisions leads to calculate unit commitment and dispatching patterns more or less similar to the ones obtained by the traditional centralized generation scheduling, the classical UC-ED cost based optimization is still applicable nowadays [36], [62]. As stated in [36], whereas the solution of the UC-ED problems traditionally takes into account mainly controllable sources such as conventional generation units, the transition to the future power systems is driven by two important factors: the integration of RES, and especially wind, and the sustainable development; the latter refers to efficient fuel utilization, decrease in emissions and in total fuel consumption. In addition, the integration of wind power and the liberalization of electricity markets bring more uncertainties in the UC-ED optimization problem. As UC is a complex problem, substantial research has been done in the unit commitment optimisation field during the last decades. Various techniques that can be utilised for an optimal UC can be found in [47]. A more thorough approach is the transmission security constrained unit commitment (SCUC) [48],[49] which considers in addition to the normal problem reliability indices for transmission network components, transmission limits for power flows, voltage constraints etc. However, due to the increased amount of necessary data and increased problem complexity, the transmission SCUC method is not easy to be utilised and no commercial computer tools based on it have been elaborated yet. Table 4-5 sums up the definition of all the symbols used in the following sections. Table 4-5: Symbols used in the methodologies and their definitions
Symbol Definition Wasted wind energy in the base case for wind year type k, country i k
i BWWE
Wasted wind energy in the study case for wind year type k, country i kiWWE
Decrease in wasted wind energy for wind year type k, country i kiDWWE
Additional installed wind power due to a project for wind year type k, country i kiAIWP
Installed wind power for a project in a wind year type k, country i kiIWP
Installed wind power for the base case, country i iBIWP
Annual emissions type j in the base case for a wind year type k kjBE
Annual emissions type j in the study case for a wind year type k kjE
Decrease in annual emissions type j for a wind year type k kjDE
CO2 emissions related operating cost in the base case for a wind year type k 2
kCOBECost
CO2 emissions related operating cost in the study case for a wind year type k 2
kCOECost
Decrease in CO2 emissions related operating cost for a wind year type k 2
kCODECost
External costs of conventional generation in the base case for a wind year type k kBExt kExt External costs of conventional generation in the study case for a wind year type k
58

D3.3.1 Possible criteria to assess technical-economic and strategic benefits of specific transmission projects
Symbol Definition Increase in avoided external costs for a wind year type k kIExt Annual fossil-fuel j consumption in the base case for a wind year type k k
jBFCons
Annual fossil-fuel j consumption in the study case for a wind year type k kjFCons
Total fossil-fuel related operating costs in the base case for a wind year type k kBFCost Total fossil-fuel related operating costs in the study case for a wind year type k kFCost Fossil-fuel j annual consumption reduction in the base case for a wind year type kk
jDFCons
Annual fossil-fuel related operating costs reduction for a wind year type k kDFCost 4.4.3.1 Increase in wind energy exploitation The increase in wind energy exploitation is related to:
• a higher contribution of wind power in covering the load curve; this is a consequence of transmission system expansion or reinforcement, while maintaining the same installed conventional generating capacities. Hence, the conventional power plants reduce their contribution (the generation output mix changes) and as more wind power is harnessed, the wasted wind energy reduces;
• more installed wind capacity that can be hosted by the grid; by strengthening the transmission grid, it becomes possible to install more wind power .
Due to the differences between countries’ Grid Codes, there are countries where wind power can be curtailed (countries type A) and countries where curtailing the wind power is feasible only in case of force majeure (countries type B). This difference affects how to assess the advantages in terms of a potential increase in wind energy exploitation. The study can proceed as shown in Figure 4-14. A base case is run first considering an initial, predicted generation park and initial transmission grid. Then, transmission expansion projects for inter-zonal or cross-border lines are introduced starting from the base case and an iterative process is started while maintaining the generation adequacy above the initial adequacy level, with two options:
• Maintain conventional generation park constant and increment uniformly the installed wind power;
• Decrease conventional generation park and increment uniformly the installed wind power. This process stops for each project whenever either the generation adequacy results lower than in the base case or the wasted wind energy is higher than in the base case or the first wind power curtailment appears (countries of type B). The previous step before the iterations were stopped is the one showing the maximum additional installed wind power.
59
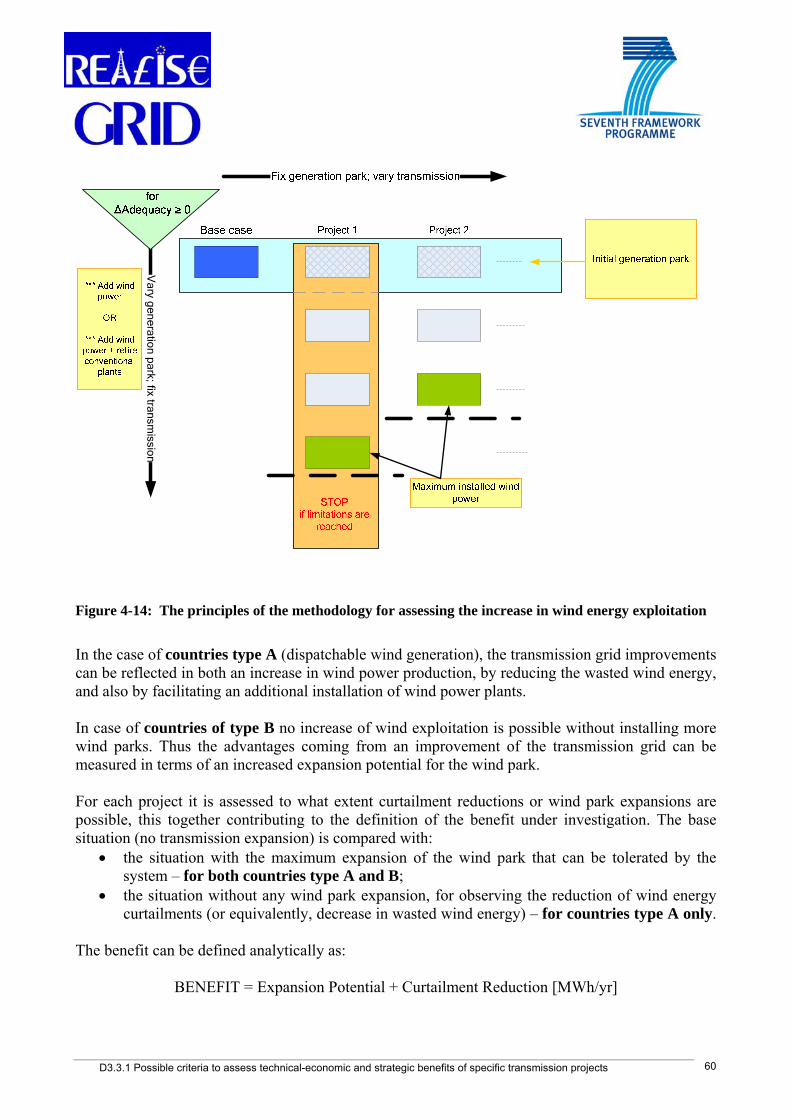
D3.3.1 Possible criteria to assess technical-economic and strategic benefits of specific transmission projects
Vary generation park; fix transm
ission
Figure 4-14: The principles of the methodology for assessing the increase in wind energy exploitation
In the case of countries type A (dispatchable wind generation), the transmission grid improvements can be reflected in both an increase in wind power production, by reducing the wasted wind energy, and also by facilitating an additional installation of wind power plants. In case of countries of type B no increase of wind exploitation is possible without installing more wind parks. Thus the advantages coming from an improvement of the transmission grid can be measured in terms of an increased expansion potential for the wind park. For each project it is assessed to what extent curtailment reductions or wind park expansions are possible, this together contributing to the definition of the benefit under investigation. The base situation (no transmission expansion) is compared with:
• the situation with the maximum expansion of the wind park that can be tolerated by the system – for both countries type A and B;
• the situation without any wind park expansion, for observing the reduction of wind energy curtailments (or equivalently, decrease in wasted wind energy) – for countries type A only.
The benefit can be defined analytically as:
BENEFIT = Expansion Potential + Curtailment Reduction [MWh/yr]
60

D3.3.1 Possible criteria to assess technical-economic and strategic benefits of specific transmission projects
Expansion Potential For both types of countries, the addition of wind power in comparison to the base case can be computed at country level as the difference between the installed capacities in the study case and in the base case.
{ } [MW], high wind year; low wind year 1
[MWh/yr] [MW] [h] [%]
k ki i i
ki i
AIWP IWP BIWP k ,i ,n
Expansion Potential AIWP StudyYear AvailabilityFactor
= − ∈ =
= ⋅ ⋅ k
At regional level, the additional installed wind power that can be accommodated by the grid is given by the sum of additional wind power in all the countries within the region. The availability factor is a weighted average of the availability factors of the new wind farms. Curtailment reduction The curtailment reduction is equivalent to a decrease in wasted wind which is given by the difference between the wasted wind in the base case and the wasted wind in the study case for a country i within the n countries in the region:
{ } [MWh/yr], high wind year; low wind year 1
[MWh/yr] =
k k ki i i
ki i
DWWE BWWE WWE k ,i ,n
Curtailment Re duction DWWE
= − ∈ =
The total decrease in wasted wind in the region would be given by the sum of all wasted wind at country level. This formula is only applicable to countries type A. For countries type B wasted wind energy is zero, as no additional wind power plants are built if at any moment during the year simulations reveal the existence of technical constraints that may result in wind being dispatched down. One of the ways of quantifying the economic impacts of a transmission project, related to a better integration of wind power, is to monitor the utilization factors of conventional generation units and of wind generation [36]. The total electricity produced [TWh/yr] per conventional generation technology (nuclear, coal, gas turbine (GT), combined cycle gas turbine (CCGT), combined heat and power (CHP), distributed generation (DG) etc.) and for wind power is monitored for the base case and for the study cases considering the initial generation park and for the study cases with maximum additional installed wind power. The computation is performed twice, one for a low wind, and again for a high wind year. The change in annual electricity output between different generation technologies can be shown in the studied region with different project variants, for each country and for the whole region. Also the differences in the case of changes in the generation park should be noted. The differences should be illustrated by graphics similar to the one in Figure 4-15, and can be illustrated for different installed generation capacities, for different projects. This figure shows the generation output mix changes in the Netherlands (country type A) with different installed wind power capacities and without retiring conventional generation, with no international exchange [36]. Such graphical representations should be made for low wind and for high wind years based on the output of the base case UC-ED simulations. In addition, a comparison between the low wind and high wind year situations can be made for each transmission expansion project.
61
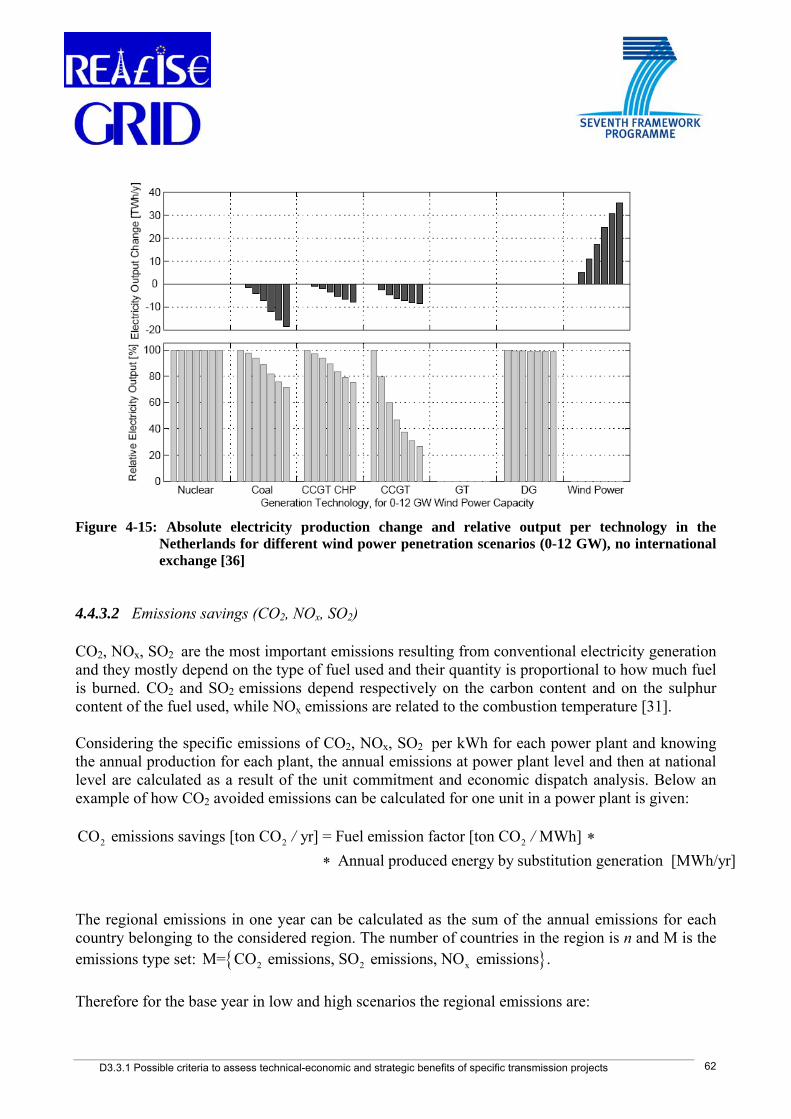
D3.3.1 Possible criteria to assess technical-economic and strategic benefits of specific transmission projects
Figure 4-15: Absolute electricity production change and relative output per technology in the
Netherlands for different wind power penetration scenarios (0-12 GW), no international exchange [36]
4.4.3.2 Emissions savings (CO2, NOx, SO2) CO2, NOx, SO2 are the most important emissions resulting from conventional electricity generation and they mostly depend on the type of fuel used and their quantity is proportional to how much fuel is burned. CO2 and SO2 emissions depend respectively on the carbon content and on the sulphur content of the fuel used, while NOx emissions are related to the combustion temperature [31]. Considering the specific emissions of CO2, NOx, SO2 per kWh for each power plant and knowing the annual production for each plant, the annual emissions at power plant level and then at national level are calculated as a result of the unit commitment and economic dispatch analysis. Below an example of how CO2 avoided emissions can be calculated for one unit in a power plant is given:
2 2 2CO emissions savings [ton CO yr] = Fuel emission factor [ton CO MWh] Annual produced energy by substitution generation [MWh/yr]
/ / ∗∗
The regional emissions in one year can be calculated as the sum of the annual emissions for each country belonging to the considered region. The number of countries in the region is n and M is the emissions type set: { }2 2 xM= CO emissions, SO emissions, NO emissions . Therefore for the base year in low and high scenarios the regional emissions are:
62

D3.3.1 Possible criteria to assess technical-economic and strategic benefits of specific transmission projects
( )1
Annual j emissions in country i [t/yr], j M,n
kj
i
BE=
= ∈∑
{ } high wind year; low wind yeark∈
The regional emissions in the study year after implementing one project are:
( )1
Annual j emissions in country i [t/yr], j M,n
kj
i
E=
= ∈∑
{ } high wind year; low wind yeark∈ The annual emissions reduction indicator is given by the difference between the regional emissions in the base case and the ones in the study case – when the project is implemented:
[ ] { } t/yr , j M, high wind year; low wind yeark k kj j jDE BE E k= − ∈ ∈
It is important to mention that emission costs [euro/ton] can be assigned to each type of emissions produced by a unit. At present however, only CO2 emission costs are a constitutive part of the unit’s operating cost and therefore they are a part of the objective function of the UC-ED optimisation. In the current Emission Trading Scheme (ETS) there are still free allowances given to the power plants, but their number is reduced every year. Starting from 2013 it is desired to fully auction all emission allowances [34], [51]. As transmission expansion planning looks at the future, in the model a full auctioning of CO2 emissions allowances is considered and this is reflected in the operating costs of conventional power plants. Fuel unit emission factors are defined as fixed coefficients on a fuel energy content base [ton/GJ]. As the total operating costs of the power system are affected by the quantity of CO2 emissions, the share of emissions-related operating costs can be expressed. The emissions-related operating costs in the region for the base case are:
{ }2
n
2i=1
costs for CO emissions in country i [euro/yr],
high wind year; low wind year
kCOBECost
k
=
∈
∑
For the study case, the emissions-related operating costs are:
{ }2
n
2i=1
costs for CO emissions in country i [euro/yr],
high wind year; low wind year
kCOECost
k
=
∈
∑
The decrease in CO2 emissions-related operating costs is given by the expression:
{ }2 2 2
[euro/yr], high wind year; low wind yeark k kCO CO CODECost BECost ECost k= − ∈
63

D3.3.1 Possible criteria to assess technical-economic and strategic benefits of specific transmission projects
4.4.3.3 Reduction of external costs of conventional generation One of the most elaborated tools for calculating the external costs associated to conventional generation is the EcoSense tool. This computer model was developed within the ExternE project [55] which was funded by the European Commission. The ExternE methodology is an impact pathway approach (Figure 4-1) that tries to determine the effects and spatial dispersion of the fuel chain burdens in order to discover what their final impact on health and the surrounding environment is. The last step is to assign a cost to each damage. Consequently EcoSense is an important tool for assessing the environmental impacts and the associated external costs of electricity generating technologies and for providing the necessary information for the ground deposition of pollutants integrated impact assessment [55]. As stated in [56] the impact pathway approach can be divided in four important steps: calculation of emissions of CO2, SO2 and NOx per kWh from a specific power plant, dispersion modeling, impact analysis and monetization of costs. This last step monetizes the impacts per kWh caused by a specific power plant. Due to the complexity of the problem, our approach will be simpler. The emissions produced by the plants are already known for the whole year from the power system operation simulation. From the EcoSense an average specific external cost will be estimated for each country for both SO2 and NOx emissions. The total external costs for each emission can be easily computed by multiplying the quantity of emissions with their specific external cost.
External cost [Euro/year] = Emission [t/year] * Emission specific external cost [Euro/t]
Figure 4-1: Impacts pathway approach (ExternE [55])
For avoiding confusion, it should be mentioned that the CO2 emissions-related operating costs calculated at 4.4.3.2 are not included in the external costs calculated here. Hence external costs of CO2 emissions will not be computed as at present they are internalized due to the CO2 emissions trading scheme. Only SO2 and NOx emissions will be considered. The indicator for increase in avoided external costs can be calculated. The regional external costs in the base year will then be:
64

D3.3.1 Possible criteria to assess technical-economic and strategic benefits of specific transmission projects
{ }1
fossil_fuel_generation external_costs [euro/yr],
high wind year; low wind year
nk
iBExt _
k=
=
∈
∑
where n is the number of countries belonging to the region. The external costs of conventional generation in the study year after implementing one project are:
{ }1
fossil_fuel_generation external_costs [euro/yr],
high wind year; low wind year
nk
iExt _
k=
=
∈
∑
The indicator for increase in avoided annual external costs in the region is given by the external costs of fossil fuel generation in the base case and the ones when the project is implemented:
[ ] { } euro/yr , high wind year; low wind yeark k kIExt BExt Ext k= − ∈
4.4.3.4 Total operating fossil-fuel cost reduction of electrical power systems The usage of fossil-fuels for electricity generation leads to the depletion of these resources. Therefore reducing the fossil-fuel consumption is an important sustainability criterion to be considered, and it can be expressed in monetary value by its related operating costs. The fossil fuels used in electricity generation are: hard coal, lignite, fuel oil, natural and derived gas. Let F be the set comprising the fossil-fuels and n the number of countries in the region. In the base case, the annual fossil-fuel consumption at regional level per fuel type is:
( )
{ }
3
1consumption of fossil-fuel j in country i m /yr 1 j F
high wind year; low wind year
nkj
iBFCons , i ,n,
k=
⎡ ⎤= =⎣ ⎦
∈
∑ ∈
and the total fossil-fuel consumption related operating costs are:
( ) [ ]
{ }1
fossil-fuel j operating costs in country i euro/yr 1 j F
high wind year; low wind year
nk
j F i
BFCost , i ,n,
k∈ =
= =
∈
∑∑ ∈
For the study case, the annual-fossil-fuels consumption and related costs are determined in the same way.
( ) 3
1
consumption of fossil-fuel j in country i m /yr 1 j F,n
kj
i
FCons , i ,n,=
⎡ ⎤= =⎣ ⎦∑ ∈
65

D3.3.1 Possible criteria to assess technical-economic and strategic benefits of specific transmission projects
( ) [ ]
{ }1
fossil-fuel j operating costs in country i euro/yr 1
high wind year; low wind year
nk
j F iFCost , i ,n,
k∈ =
= =
∈
∑∑
The annual fossil fuel consumption reduction indicator is given by the difference between the regional consumption in the base year and the one in the study year.
{ }3m /yr , j F, high wind year; low wind yeark k kj j jDFCons BFCons FCons k⎡ ⎤= − ∈ ∈⎣ ⎦
And the operating cost reduction due to fossil fuel consumption reduction is:
[ ] { }euro/yr , high wind year; low wind year k k kDFCost BFCost FCost k= − ∈
4.5 Losses reduction 4.5.1 Introduction Technical losses in the electric power system are an inevitable consequence of the science of distributing electricity and of transforming from one voltage to another. The main components are:
− ‘Variable’ or Copper (Cu) losses, which are due to electrical resistance of conductors and hence have a quadratic relationship with the current passing through the conductor as
L = I2*R
− ‘Fixed’ or Iron (Fe) losses (also known as ‘no load’ losses), which are incurred as a result of the magnetising forces involved in transforming electricity. The main component is the hysteresis loss which can be thought of as the energy involved in continuously magnetising and demagnetising the transformer core (100 times per second for a 50 Hz AC system). The losses are ‘fixed’ in the sense that, unlike variable losses, the losses are not a function of the load current passing through the conductor (i.e. transformer windings); they are present and virtually constant so long as the transformer is energised, even when supplying no load.
Other less significant forms of technical losses include: corona6, skin effect7, cable sheath and dielectric leakage losses (i.e. in conductors and insulators), ‘stray’ losses which relate to flux leakage from the intended magnetic path within the transformer core and eddy current8 losses (i.e. in transformer cores and windings).
6 Corona losses are generally significant only in the case of EHV (Extra High Voltage) overhead line conductors. They result from break down in the air (insulation) surrounding the conductor due to very high voltage gradients. 7 Skin effect describes the tendency of an alternating current to distribute itself within a conductor so that the current density near the surface of the conductor is greater than that at its core. The impact is to increase the effective resistance of the conductor giving rise to higher variable losses. Being a function of AC frequency the impact will be greater if harmonic currents are present. 8 Eddy current losses are a function of variable losses in a transformer but also vary with the square of the frequency. Hence the presence of harmonics in the transformer windings will have a proportionally greater impact on the eddy current loss component.
66

D3.3.1 Possible criteria to assess technical-economic and strategic benefits of specific transmission projects
Focus is here on variable (copper) losses over the transmission system: expanding the network can bring the technical benefit of reducing system losses.
4.5.2 Load factor, loss load factor and losses computation Given that variable losses vary with the square of the current, it follows that ‘peaky’ loads will give rise to a higher overall level of variable losses than will ‘flat’ load profiles for a given quantum of energy distributed.
Load factor is defined as the ratio of the average load to the peak load over a defined period whereas loss load factor is defined as average losses / peak losses over a defined period. However, whilst (for example) reasonable estimates of load factor at high voltage levels can be derived from archived half-hourly averaged load readings taken from enquiry systems, loss load factor is a difficult parameter to estimate with confidence since the quadratic relationship between variable losses and load means that relatively short duration peaks in demand (which would not be visible within half-hourly averaged load readings) would have a relatively large impact on loss load factor.
In mathematical terms, loss load factor (LLF) over n samples is the ratio of average losses over maximum losses in the system. For simple I2*R losses sampled periodically, LLF is derived from the equation9:
2max
0
2
* in
iLLF
n
n∑=
where n is the number of samples, and in is the average current within the n-th sample period, while imax is the maximum value of in . The accuracy of the computation increases with the frequency of samples to the point where the equation becomes a continuous integral:
∫=T
dtiiT
LLF0
22max*
1
where T is the total sample period.
From the computational point of view, the losses can be calculated by power system simulation tools applying AC load flow studies. In the case of DC load flow applications, it is also possible to calculate network losses: an interesting methodology for this scope is described in [74]. The benefit of losses reduction can be then calculated by first considering the difference of losses (in absolute terms) in presence and in absence of the network reinforcement under investigation, and then by multiplying it by the power market price in order to generally assess the monetary value of the network losses, that is,
[abs(Lwith - Lwithout)] * P
9 In practice, however, since there is currently little facility for ‘real-time’ monitoring of load currents, in terms of current ability to actually calculate losses reliably and accurately, the shown equations are to some extent academic.
67

D3.3.1 Possible criteria to assess technical-economic and strategic benefits of specific transmission projects 68
where Lwith and Lwithout represent the network losses (in MW) in presence (with) and in absence (without) of the investigated network reinforcement, while P is the power market price (in €/MW). In some cases, depending on local policies and market design conditions, losses charges (tariffs) are used to monetise losses reduction benefit. 4.5.3 The importance of minimising losses It has long been recognised that minimising network technical losses is integral to good engineering practice. Minimising losses has the following utility and wider societal benefits:
− it maximises the available capacity of plant and equipment to deliver useful energy (i.e. rather than supplying losses);
− it also minimises the amount of generation required purely to supply network losses. In the case of variable losses, due to their quadratic relationship with current, it follows that a disproportionate level of ‘inefficient’ generation will be called upon to supply losses at times of peak demand. Reducing carbon emissions from fossil-fuelled power stations has a direct ‘carbon benefit’;
− it leads to lower levels of capital and operational expenditure incurred in providing, maintaining and reinforcing generation, transmission and distribution assets (there is also a carbon-cost benefit in terms of avoided material extraction, manufacturing and transportation costs);
− it gives maximising revenue-earning opportunities arising from the regulatory incentive if any.
4.6 Facilitation of distributed generation integration by improved
coordination of transmission and distribution planning (SmartGrids) Compared to past planning and operation philosophies of electricity grids, where the distribution grids have been planned and operated in an entirely passive modality, in the future there is a need for a better coordination and improved interaction of transmission and distribution grids (see e.g. [67]). Against the background of expected higher shares of dispersed/distributed generation (DG) in future electricity systems, this means in particular that both grid systems need to be further developed, not necessarily only in terms of carrying capacity but also and mostly in a first step in terms of new information, communication, control and data management systems and devices: • On the one hand, transmission systems strongly need clear interfaces with the downstream
distribution systems, e.g. in order to be able to optimally manage, avoid or at least reduce upstream effects of increasing shares of firm, variable or intermittent DG penetration.
• On the other hand, distribution grid planning and operation practices in the future – unlike those of transmission grids – may be subject to fundamental changes in terms of system design, development and network operation philosophy (see e.g. [67]).
Such innovations on distribution grid level, however, are expected to be gradual. But with increasing shares of expected DG penetration in the future, the more it is likely that distribution networks evolve towards architectures like transmission grids. In detail, the gradual transition process of distribution systems towards transmission-like schemes may require some intermediate steps being characterised by differences in complexity (and finally also cost):

D3.3.1 Possible criteria to assess technical-economic and strategic benefits of specific transmission projects 69
• In a first group of steps,10 in the near future the implementation of new and advanced information, communication, control and data management systems is supposed to be a precondition to move from the traditional approach of DG connection (`fit and forget’) to more “active” distribution network operation supporting e.g. the implementation of micro-grid concepts and/or virtual power plants. Both of these concepts may need the utilization of advanced solutions such as information and communication technology (ICT) and/or flexible controlling devices (FACTS).
• A next group of steps (see Figure 4-18 in detail) describes the implementation of corresponding devices enabling the management of bidirectional load flows also on distribution grid level, especially where penetration of DG generation has reached certain levels and cannot be neglected any more. Unlike transmission grids, distribution grids have not been designed so far to operate in the presence of power injection. Significant shares of DG injection on distribution grid level must also be accompanied by further upgrades of protection devices and also the implementation of new software (ICT) and hardware (i.e. power electronics-based) technologies for more flexible system control.
• The final group of steps (see Figure 4-18 in detail) represents a fully active, smart and intelligent operation of distribution grids. A concept like that may rely on fully autonomous “cells” on distribution grid level. This means that the distribution system may be subdivided in more subsystems by islanding procedures. Each subsystem has to be eventually able to balance supply and demand effectively (i.e. be self-sufficient) for a twofold reason:11 (i) to be able to disconnect from the interconnected system and continue running in case of large and widespread disruptions and (ii) to reduce the burden (in terms of control actions (e.g. active and reactive power control) as well as losses) on the upstream systems. In a fully autonomous cell concept like that also comprehensive “communication” between the transmission and distribution grid is essential for requesting the cell to provide black-start capability support and restore the service after a fault.
Despite the need for a better coordination of and improved interaction between transmission and distribution grids in future electricity systems introduced above, the ultimate question will be the economic trade-off between investments into the transmission grids versus distribution grids to be able to manage a certain level of DG penetration on distribution grid level. More precisely, this means whether or not it is more effective and efficient to reduce upstream effects of DG generation by investments into transmission grid expansion or by investments into new information, communication, control and data management devices on distribution grid level enabling more intelligent and active distribution grid operation. Moreover, investments into transmission grid expansion can also be interpreted as avoided investments on distribution grid level alternatively being necessary to mitigate upstream effects of firm, variable and intermittent DG generation. In general, transmission grid expansion also induces an extension of control and balancing zones of electricity systems and, subsequently, provides access to more diverse portfolios of flexible and competitive technology options (i.e. power plants,
10 This is also the least costly option compared to those in subsequent bullet points (see also Figure 4-17 and Figure 4-18). It has to
be noted further that one step in Figure 4-18 represents specific “smart” technologies or components to be implemented on distribution grid level. The steps (i.e. “smart” technologies or components) are ranked in least-cost order.
11 See e.g. the “Cell Pilot Project” of Energinet.dk (TSO) and Sydvest Energi Net (DSO) in Denmark [66].

D3.3.1 Possible criteria to assess technical-economic and strategic benefits of specific transmission projects
load response, etc.) contributing to competitive price determination in the different market places (e.g. wholesale, balancing, and ancillary service markets). Taking into account several aspects mentioned above, the methodology presented below outlines the interdependences of the key parameters and drivers for the trade-off analyses of the economics of transmission grid expansion versus modernisation of distribution grids for increasing shares of DG penetration in future electricity systems. 4.6.1 Methodologies to investigate advantages from a smart infrastructure development The methodology of the trade-off analyses for the investigation of the economics of smart grid infrastructure development on both transmission and distribution grid level is based on the investigation of the interdependences of the following three dimensions: • future share of DG penetration in an electricity system, • investments into new and “smart” technologies and components to be implemented on
distribution grid level to enable a more intelligent and active distribution grid management, • varying investments into transmission grid expansion. Figure 4-17 presents the basic principles of the link between the different dimensions in qualitative terms.
70
Figure 4-17: Basic principles: cost of “smart” technologies and components to be implemented on
distribution grid level depending on DG penetration in an electricity system (varying parameter: investments into transmission grid expansion)
Cost of “smart” technologies and components to be implemented on distribution grid level [€ / MWDGinst]
DG penetration in an electricity system [MWDGinst]
Example 1: Share of DG in a system
Status quo of transmission grid
Moderate transmission grid expansion
Transmission grid expansion
Significant transmission grid expansion
Towards fully active and smart distribution grid
Example 2: Share of DG in a system

D3.3.1 Possible criteria to assess technical-economic and strategic benefits of specific transmission projects 71
In order to reach a certain share of DG penetration in an electricity system, different amounts and complexities of smart technologies and components have to be implemented on distribution grid level, depending on the situation on the transmission grid. Referring to the situation on the transmission grid, this means in particular whether or not there exists access to “complementary technologies (like pumped hydro storage power plants and/or load response options of industrial customers) outside a “DG region” supporting the mitigation of DG-related aspects like intermittency/variability (and other side effects of DG generation) with minimal overall system cost. In case of no further transmission grid expansion (most convex curve in Figure 4-17) it is more costly to be able to operate a certain future share of DG generation in an electricity system (see Examples 1 and 2 in Figure 4-17) compared to the situation where the transmission grid is expanded. Moreover, in case of no further transmission grid expansion a variety of expensive new and smart technologies and components have to be implemented on distribution grid level in order to be able to manage supply and demand on DG-level and to mitigate upstream effects of DG generation to higher voltage levels. The total additional cost for the new and smart technologies having to be implemented on distribution grid level to enable a fully active and smart operation of the distribution grid can also be significantly higher compared to an investment into transmission grid expansions enabling the same share and functionality of DG penetration in an electricity systems (see least convex curve in Figure 4-17). Before describing the analytical trade-off criterion of the economics of both alternative investments (see 4.6.2), the qualitative relationship and interdependences of the key parameters and drivers shown in Figure 4-17 have to be broken down to “technology-level” as a precondition to enable an empirical trade-off analysis. This means in practise, that the different convex cost functions on smart technologies and components in Figure 4-17 have to be represented by discrete, stepped cost functions (see Figure 4-18). Each step in Figure 4-18 describes a single implemented smart technology and/or component12 on distribution grid level as a function of DG penetration in the system: • The least costly technology and/or component steps describe new information, communication,
control and data management systems and devices having to be implemented on distribution grid level in order to enable a more active operation of previously passive and uncontrolled distribution grids.
• More costly steps describe further new/smart technologies and components allowing fully bilateral load flows also on distribution grid level accompanied with more complex and intelligent distribution grid operation.
• The most expensive smart technology and component steps towards fully active, smart and intelligent operation of distribution grids describe the implementation of full autonomy into the distribution grid system (see e.g. Cell Pilot Project in Denmark [66]). This means in particular, that e.g. in case of an emergency situation reaching the point of no return the cell on distribution grid level disconnects itself from the high voltage grid and transfers to controlled island operation. Or, in a less ambitious case, the cell on distribution grid level at least is able to black-start itself to a state of controlled island operation after a total system collapse. In addition, the functionality of fully autonomous distribution grid systems includes also the provision of the
12 By the parameter couple: potential to increase DG penetration and cost of the smart technology/component on distribution grid level.

D3.3.1 Possible criteria to assess technical-economic and strategic benefits of specific transmission projects
entire portfolio of system services needed (e.g. monitoring, controlling and activating local resources like active power, reactive power, reserves, regulating power, etc.).
72
Figure 4-18: Practical approach for economic trade-off analyses: cost of “smart” technologies and
components to be implemented on distribution grid level depending on DG penetration in an electricity system (varying parameter: investments into transmission grid expansion)
DG penetration in an electricity system [MWDGinst]
Towards fully active and smart distribution grid
Status quo of transmission grid
Moderate transmission grid expansion
Significant transmission grid expansion
Cost of “smart” technologies and components to be implemented on distribution grid level [€ / MWDGinst]
Figure 4-17 and Figure 4-18 have demonstrated so far that there exist two alternatives to enable the implementation of a certain future share of DG penetration in an electricity system: (i) transmission grid expansion or (ii) implementation of new functionalities and technologies on distribution grid level. 4.6.2 Analytical approach for the economic trade-off analyses
Below it is now briefly outlined how to conduct the economic trade-off analyses evaluating the economics of the two alternative investments: • Transmission grid expansion: in general, investments into transmission grid expansion
immediately provide access to “complementary” technologies in the centralised electricity system (like pumped hydro storage power plants and/or load response options of industrial
Transmission grid expansion
Fully autonomous and intelligent “cells” on distribution grid level
Bidirectional load flow management devices
New information, communication, control and data management systems

D3.3.1 Possible criteria to assess technical-economic and strategic benefits of specific transmission projects
customers) outside a “DG region” managing and mitigating upstream effects of distributed generation (e.g. like variability/intermittency, etc.).
• Implementation of new functionalities, technologies and components on distribution grid level: a fully active, smart, intelligent and autonomous distribution grid finally enables to randomly influence the generation and load profiles on DG level. Even though technological solutions are supposed to be available in the future where no or minimal upstream effects of DG generation towards higher voltage levels will be apparent, the corresponding costs are supposed to be also accordingly high.
Therefore, from the point-of-view of transmission grid expansion the analytical approach for the economic trade-off analyses for a certain share of DG generation in the electricity system finally is as follows:
∑=
≤n
iCC
1DG of Share|gridon distributii,nology Smart techDG of Share|expansionon Transmissi min min
where: CTransmission expansion represents the investment into transmission grid expansion; CSmart technology i, distribution grid provides the investment into a smart technology i and/or component i on distribution grid level. For practical applications, the formula of the economic trade-off criterion presented above has to be interpreted as follows: unless the investment needs into transmission grid expansion for a certain share of DG generation in the electricity system are smaller than the sum of investment needs into smart technologies and/or smart components on distribution grid level to reach the same share of DG penetration, transmission grid expansion is the favourable/superior strategy to be implemented. Moreover, in practise investments into transmission grid expansion in many cases are supposed to be the least costly solution (in terms of total electricity system costs) for increasing future shares of DG generation because it is possible to immediately manage and mitigate upstream effects of DG generation through access to corresponding flexible technologies needed in the centralised electricity system. This means that an investment into transmission grid expansion might be more economic compared to the investments needed for the sum of smart technologies and components needed on distribution grid level to reach the same functionality of system operation. Finally, it is important to note that the empirical part of transmission grid expansion is a case specific task. This means that empirical scaling is possible only when analyzing a specific case in an intra-TSO region (expansion within the footprint of a single TSO) and/or inter-TSO region (expansion between the footprints of at least two TSOs). The extent of transmission grid expansion also determines the convexity/slope of the corresponding “transmission curves” in Figure 4-17 and Figure 4-18 and, subsequently, also the possible share of DG penetration in a region with minimal total electricity system costs. More precisely, with increasing transmission grid expansion the convexity/slope of the “transmission curves” is decreasing, which means that the possible share of DG penetration in a region is increasing at minimal total electricity system costs.
73

D3.3.1 Possible criteria to assess technical-economic and strategic benefits of specific transmission projects
4.7 Controllability of power flows (via FACTS and HVDC) Advanced technologies, such as FACTS (Flexible Alternating Current Transmission System) and HVDC (High Voltage Direct Current), may play a crucial role in the development of the European transmission system (see also REALISEGRID Deliverable D1.2.1 [76]). These power electronics-based devices represent innovative power transmission technologies, which may help the European TSOs solving current system issues and planning the grid of the future. In fact, modern devices like FACTS and HVDC may provide transmission planners with effective solutions to the several issues they encounter nowadays. These technologies offer the possibility to increase transmission network capacity and flexibility and generally enhance system reliability, security and controllability with a limited environmental impact. These properties are especially important in a deregulated environment, where, in presence of more frequent and severe corridor congestions, fast-reacting FACTS and HVDC elements can efficiently avoid or relieve network constraints. This can then lead to a reduced need for building new HVAC (High Voltage Alternating Current) lines with consequent environmental and economic benefits. Moreover, the deployment of FACTS and HVDC can allow a further, smoother integration of variable RES (Renewable Energy Sources) power plants into the European power system. The increase of net transfer capacity between two zones or countries achieved via FACTS or HVDC is a benefit that, like for the congestions reduction leading to the substitution effect (see 4.3.1), can be measured by an increase of the total Social Welfare (SW). By approximation, the revenue from the additional energy exchange secured by fast power flow control devices like FACTS and HVDC and monetized in terms of increased cheaper energy imported by a zone or country with a higher electricity wholesale price can be expressed in this case in a simple way as
NTChNTChCR ⋅Δ⋅⋅Δ⋅= λλ -
where: Δλ and λΔ represent the electricity price differential between the importing and the exporting system before and after the interconnection installation, respectively; NTC and NTC express the transmission capacity available in secure conditions and granted by the new link before and after the interconnection installation, respectively; h and h represent the yearly utilisation hours of that link providing NTC and NTC before and after the interconnection installation, respectively. The NTC (Net Transfer Capacity) can be defined as the maximum power transfer between two zones compatible with (n-1) security standards applicable in both zones and taking into account the technical uncertainties on future network conditions. The NTC differs from the Total Transfer Capacity (TTC) by a security margin, the Transmission Reliability Margin (TRM) [77]. By keeping constant (before and after the interconnection installation) the amount of yearly utilisation hours of the link, assuming that the electricity price differential does not vary much before and after the installation, it can be derived
NTChCR Δ⋅Δ⋅≅ λ
where ΔNTC represents the transmission capacity enhancement available in secure conditions and granted by the new link [69].
FACTS and HVDC can also lead to losses reduction, power quality and reliability increase, voltage and reactive power control.
74

D3.3.1 Possible criteria to assess technical-economic and strategic benefits of specific transmission projects 75
Modern HVDC and FACTS based on VSCs (Voltage Source Converters) can offer the possibility for a further increased amount of exchanged energy, making available an additional quota of electricity produced by variable renewable sources, quickly reacting to rapid generation variations (e.g. by wind and hydro power generation). These technologies can then facilitate variable RES integration. Fast FACTS and HVDC controllers can also improve the dynamic behaviour of the system. Finally, FACTS devices may give the possibility to avoid/postpone the construction of new lines in a short-mid term. 4.8 Summary on transmission expansion benefits Table 4-6 summarises the main transmission expansion benefits with the corresponding key indicators necessary to quantify the respective impact assessment of each benefit. The calculation of such elements requires an appropriate power system and market simulation tool. In Table 4-6 the subscripts ‘with’ and ‘without’ refer to the situations in presence and in absence of the investigated transmission expansion reinforcement, respectively. The apex ‘strategies’ takes into account the bid-up strategies of market players, while for the classic cost-based analysis (in absence of competition) the apex ‘costs’ is used. The correspondence of symbols in Table 4-6 is as in the following: L stands for the network losses; UF and AIWP respectively refer to the utilisation factor of concerned wind power plants which would decrease the wind energy curtailment and the additional installed wind power capacity being integrated by the system (in absence and in presence of the transmission reinforcement); E takes into account the emissions; Fcost and Ext correspond to the fossil fuel generation costs (internal costs) and fossil fuel generation external costs (externalities), respectively.
Table 4-6: Main transmission expansion benefits and related indicators
Expansion benefit Key Indicator Impact assessment
Reliability increase VOLL abs(VOLLwith - VOLLwithout) Congestion reduction (substitution effect) SW (SWcosts
with – SWcostswithout)
Market competitiveness increase (strategic effect)
SW (SWstrategieswith – SWcosts
with)
System losses reduction L abs(Lwith - Lwithout) Increased exploitation of wind generation UF
AIWP (UFwith - UFwithout)
(AIWPwith - AIWPwithout) Emission savings E abs(Ewith - Ewithout)
External costs reduction Ext abs(Extwith - Extwithout) Fossil fuel costs reduction Fcost abs(Fcostwith - Fcostwithout)

D3.3.1 Possible criteria to assess technical-economic and strategic benefits of specific transmission projects 76
5 APPROACH AND TOOL TO ASSESS BENEFITS OF TRANSMISSION EXPANSION
5.1 A new methodology for the assessment of transmission expansion benefits Chapter 4 has provided the reader with a panoramic view of the benefits that transmission expansion may achieve and how these benefits can be measured. Each benefit provides only a single viewpoint of a far more complex picture that can be reconstructed only by putting them altogether. The present section aims at providing a criterion to globally consider all the evaluations carried out so far separately for each single benefit condensing them into one single value: this is needed for representing a degree of optimality of a single expansion project. In this way, different alternatives can be compared, the highest ranked being the most suitable to be financed and realized. In order to understand how this ranking mechanism can be devised, it can be useful to recall basic elements of multi-criteria analysis. 5.1.1 Theory of multi-criteria cost-benefit analysis Alternatives are defined as all the reinforcement projects that could be implemented as options to realize a given goal. For instance, provided that the aim is a given additional import capability, a TSO could decide that there are a few viable alternatives. These alternatives are all technically feasible and compatible with the existing electrical system (also considering possible voltage problems, reactive power production, etc.) and should be ranked from a technical-economic point of view in order to assess which one is the most cost-benefit convenient (i.e. the most suitable to be realized). One single alternative to be evaluated may imply the realization/refurbishment of one or several new connectors, while considering one single of them may not be a viable alternative (e.g. a bottleneck may be only shifted from one network section to another one without solving the global problem). A particular alternative is usually tagged as zero-alternative and considers the natural evolution of the system up to the target year without the realization of any further reinforcement alternative. This evolution implies, therefore, that the exogenous variables (i.e. those that are not in the hands of the transmission network planner, like the generation park) evolve following some predetermined patterns (scenario hypotheses) but none of the considered alternatives is realized. Naturally, the zero-alternative may be itself viable or not. For instance, if the no-expansion scenario is not compatible with the suitable evolution of the generation park, the zero-alternative is not realistic, but can only be considered as a benchmark for the system. Once the viable alternatives to be tested and ranked are clearly defined, the second choice should concern the criteria to be used to compare them. A criterion is defined as a single aspect that can be used to classify different alternatives. These criteria must encompass all the factors that can be significant for a decision-maker, avoiding double counting. Double counting can occur when a criterion implicitly includes another (e.g. loss of value of houses near an airport and noise level in the surrounding area). Double counting should be accurately avoided because it hiddenly affects the weighing of one criterion with respect to the others. In order to define what are the most important criteria and avoid double counting, it can be useful to organize the criteria in a top-down tree (see Figure 5-1) starting with a rough classification (e.g. economic criteria, environmental criteria) and branching down up to reach the leaves that represent fundamental, directly measurable criteria (e.g. Social Welfare, fuel consumption, CO2 emissions, etc.).
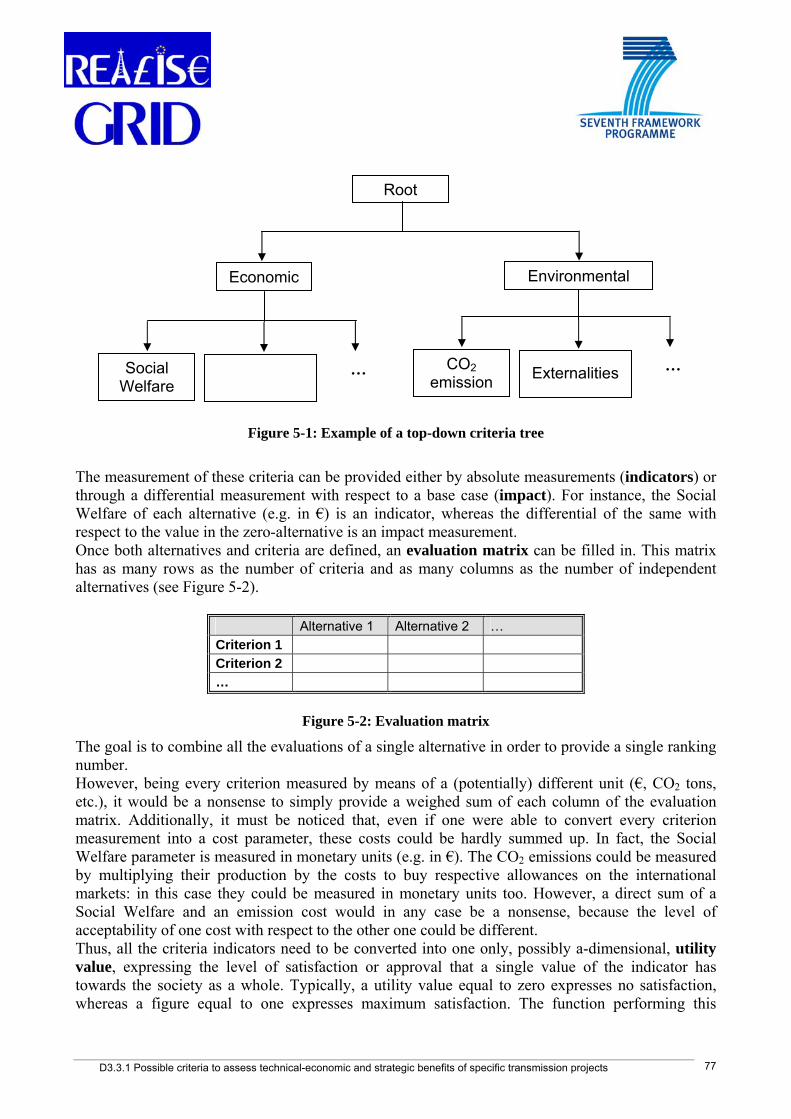
D3.3.1 Possible criteria to assess technical-economic and strategic benefits of specific transmission projects
Root
Economic Environmental
Social Welfare
… CO2 emission Externalities …
Figure 5-1: Example of a top-down criteria tree
The measurement of these criteria can be provided either by absolute measurements (indicators) or through a differential measurement with respect to a base case (impact). For instance, the Social Welfare of each alternative (e.g. in €) is an indicator, whereas the differential of the same with respect to the value in the zero-alternative is an impact measurement. Once both alternatives and criteria are defined, an evaluation matrix can be filled in. This matrix has as many rows as the number of criteria and as many columns as the number of independent alternatives (see Figure 5-2).
Alternative 1 Alternative 2 … Criterion 1 Criterion 2 …
Figure 5-2: Evaluation matrix
The goal is to combine all the evaluations of a single alternative in order to provide a single ranking number. However, being every criterion measured by means of a (potentially) different unit (€, CO2 tons, etc.), it would be a nonsense to simply provide a weighed sum of each column of the evaluation matrix. Additionally, it must be noticed that, even if one were able to convert every criterion measurement into a cost parameter, these costs could be hardly summed up. In fact, the Social Welfare parameter is measured in monetary units (e.g. in €). The CO2 emissions could be measured by multiplying their production by the costs to buy respective allowances on the international markets: in this case they could be measured in monetary units too. However, a direct sum of a Social Welfare and an emission cost would in any case be a nonsense, because the level of acceptability of one cost with respect to the other one could be different. Thus, all the criteria indicators need to be converted into one only, possibly a-dimensional, utility value, expressing the level of satisfaction or approval that a single value of the indicator has towards the society as a whole. Typically, a utility value equal to zero expresses no satisfaction, whereas a figure equal to one expresses maximum satisfaction. The function performing this
77
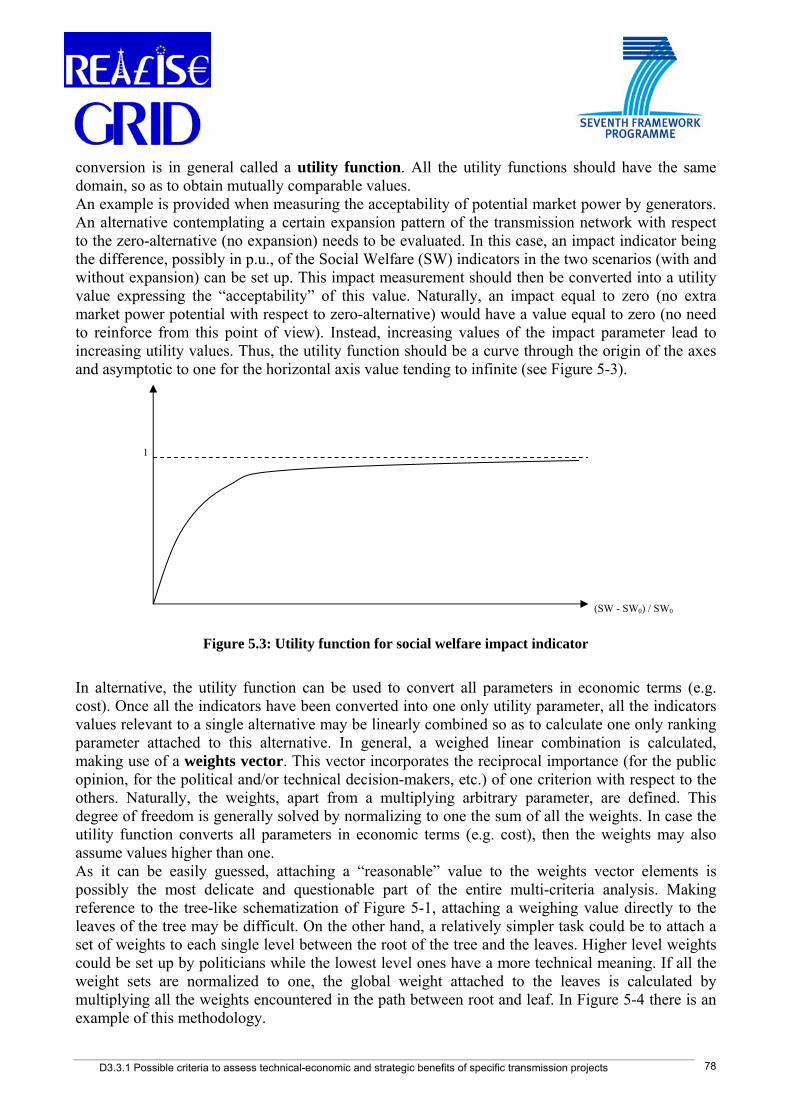
D3.3.1 Possible criteria to assess technical-economic and strategic benefits of specific transmission projects
conversion is in general called a utility function. All the utility functions should have the same domain, so as to obtain mutually comparable values. An example is provided when measuring the acceptability of potential market power by generators. An alternative contemplating a certain expansion pattern of the transmission network with respect to the zero-alternative (no expansion) needs to be evaluated. In this case, an impact indicator being the difference, possibly in p.u., of the Social Welfare (SW) indicators in the two scenarios (with and without expansion) can be set up. This impact measurement should then be converted into a utility value expressing the “acceptability” of this value. Naturally, an impact equal to zero (no extra market power potential with respect to zero-alternative) would have a value equal to zero (no need to reinforce from this point of view). Instead, increasing values of the impact parameter lead to increasing utility values. Thus, the utility function should be a curve through the origin of the axes and asymptotic to one for the horizontal axis value tending to infinite (see Figure 5-3).
1
(SW - SW0) / SW0
Figure 5.3: Utility function for social welfare impact indicator
In alternative, the utility function can be used to convert all parameters in economic terms (e.g. cost). Once all the indicators have been converted into one only utility parameter, all the indicators values relevant to a single alternative may be linearly combined so as to calculate one only ranking parameter attached to this alternative. In general, a weighed linear combination is calculated, making use of a weights vector. This vector incorporates the reciprocal importance (for the public opinion, for the political and/or technical decision-makers, etc.) of one criterion with respect to the others. Naturally, the weights, apart from a multiplying arbitrary parameter, are defined. This degree of freedom is generally solved by normalizing to one the sum of all the weights. In case the utility function converts all parameters in economic terms (e.g. cost), then the weights may also assume values higher than one. As it can be easily guessed, attaching a “reasonable” value to the weights vector elements is possibly the most delicate and questionable part of the entire multi-criteria analysis. Making reference to the tree-like schematization of Figure 5-1, attaching a weighing value directly to the leaves of the tree may be difficult. On the other hand, a relatively simpler task could be to attach a set of weights to each single level between the root of the tree and the leaves. Higher level weights could be set up by politicians while the lowest level ones have a more technical meaning. If all the weight sets are normalized to one, the global weight attached to the leaves is calculated by multiplying all the weights encountered in the path between root and leaf. In Figure 5-4 there is an example of this methodology.
78

D3.3.1 Possible criteria to assess technical-economic and strategic benefits of specific transmission projects
Root
Economic Environmental
Social Welfare
VOLL … CO2 emission Externalities …
0.6 0.4
0.8 0.30.70.2
Figure 5-4: Top-down tree with weights attached to each level (WSocial Welfare = 0.6 * 0.8 = 0.48)
Defining the values for the weighing vector is both a crucial and a possibly controversial task. Once the values have been set up and, using them, a ranking has been calculated between all the considered reinforcement alternatives, a sensitivity analysis should be carried out to complete the study. Aim of this analysis is possibly to single out the stability region for the resulting ranking, i.e. the variation that the most uncertain values of the weighing vector should endure before we have any rank reversal, in particular between the first and the second score position. The sensitivity analysis can be carried out by several techniques (solution recalculation, Monte Carlo methods, specific analytical methodologies). 5.1.2 Proposal of a set of benefits
Figure 5-5 shows an evolution of the tree in Figure 5-4 with some possible benefits as seen from the different players.
Root
Economic Environmental
TSOs GenCos
Extra wind
power
Customers Society
Emissions related costs
External costs
Investment costs
Producer surplus
Fuel costs
VOLL
Security of supply
Efficient dispatching
Reduced market power
Quality of service
Producer surplus
Consumers Surplus
GenCos Society
SmartGrids
HVDC, FACTS...
Figure 5-5: Example of top-down tree with benefits and players
79

D3.3.1 Possible criteria to assess technical-economic and strategic benefits of specific transmission projects
Concerning the benefits, the situation is much more complicated and there is a strong double-counting risk. It can be useful to group some benefits by reference players such as TSOs, GenCos (generating companies), customers and society as a whole: - the society as a whole cares about security of supply (here meant as security in fuel supply, diversification of sources, etc.) and getting the most economical dispatch. Concerning the first point, its formulation and measurement is tied to general politics goal (e.g. reducing dependence on natural gas because the supplying source is limited to few countries). Concerning the most economical dispatching, it coincides with the Social Welfare (SW). An improvement in the transmission network is efficient if it gets a better SW (substitution effect, measured with the SW difference with respect to the zero-alternative) and/or reduces the market power capabilities by removing bottlenecks and increasing the market liquidity (strategic effect, measured by means of a SW difference with and without bid-ups). - TSOs care about quality of service while trying to keep investment costs as low as possible. However, the quality of service is measured by quantifying the substitution and strategic effects (already accounted for in the society sub-tree). - GenCos care about their surplus (already accounted for by the SW) and fuel costs. - customers care about their surplus (already accounted for by the SW) and quality of delivery (measured by the parameter Value of Lost Load, VOLL). Another option can consider the three EU’s energy policy targets as general benefits, under which the detailed transmission expansion benefits can be grouped according to the respective prevailing aspect. Figure 5-6 presents this case from the sole society’s perspective (systemic approach).
Transmission expansion benefits
Competitiveness
RES exploitation
Emissions savings
External costs reduction
Fossil fuel costs reduction
Reliability increase
Congestions reduction
Market competitiveness increase
Losses reduction
Security of energy supply
Environmental sustainability
Figure 5-6: Example of top-down tree with main transmission expansion benefits (systemic approach)
It is worth mentioning that, instead of using an utility function, whose value, like for the environmental analyses, is an adimensional number comprised between 0 and 1, it results to be more convenient to utilise a monetary utility function. The reasons are that this kind of function is more immediate to be understood by decision-makers and contains less subjective elements, even if it could be less flexible. Also, it is possible to algebraically sum the costs and the benefits of the different options, by putting the weights equal to 1. The ranking domains can then be realised by applying sensitivity analyses. Moreover, the time variable has to be considered for the evaluation of
80

D3.3.1 Possible criteria to assess technical-economic and strategic benefits of specific transmission projects
the benefits (via the Net Present Value, NPV): this is illustrated by a small example in the following section. 5.1.3 A small example of methodology application This section shows a small-scale application of the multi-criteria cost-benefit methodology previously proposed. What is shown here is not a real application, that will be later developed in the framework of the WP3.5 of REALISEGRID, but only a very simple test case, such that it can be analyzed without resorting to simulation tools, built upon a set of data allowing to easily draw interesting conclusions. Also the costs/benefits criteria set is deliberately reduced for simplicity. The test case features (see Figure 5.7) three possible price areas13 (A, B, C). A and B are connected by a line allowing a maximum transit 80 MW from A to B.
A B
C
Max 80
Max 40
G1 G2
G3
C1 C2 100
50
Figure 5.7: The test case
The generators G1 (in A) and G2 (in B) compete to feed a 100 MW load located in B. The zone C is isolated and G3 feeds a local 50 MW load. G2 is characterized by high (marginal) production costs, G1 by intermediate costs, G3 by low costs. By contrast, G3 has the highest emissivity. Table 5.1 defines the main characteristics of the three generators.
Generator Rated power [MW] Marginal generation cost [€/MWh] Emissivity [tCO2/MWh] G1 100 80 0.4 G2 100 100 0.9 G3 150 20 0.9
Table 5.1: Generators data It is supposed here that the TSO has already located two alternatives for the expansion of the grid: 13 These areas could be either three nodes in a nodal market, three zones in a zonal market or three coupled markets in an over-national perspective.
81

D3.3.1 Possible criteria to assess technical-economic and strategic benefits of specific transmission projects 82
• C1: HVAC cable – cost 2000x103 €/km. Supposing 30 km length, the total investment cost is: 60x106 €. We suppose that this cable is able to host a power transit higher than the system can request, so that no transit limitation is attached to it.
• C2: HVAC overhead line – cost 500x103 €/km. Supposing 100 km length, the total investment cost is: 50x106 €. We suppose that, due to the characteristics of the connection, only 40 MW can transit from C to B.
Aim of the cost-benefit analysis is to decide: • if at least one of the two expansion alternatives has a cost-benefit characteristics that advise its
realisation; • in case of a positive answer, what is the best alternative (C1 or C2). The criteria set that we are going to consider (and compare with the relevant investment cost) is the following: • social welfare improvement – this allows to take into account the economical aspects in a
system perspective; • emissions reduction – representing the environmental aspect. Note that from a first glance to the
problem, the economic and the environmental aspect are in mutual contrast, because whatsoever expansion will partially substitute G1 with G3, that is the most economically efficient generator but is characterized by a high emissivity factor.
We assume to devise the utility functions so as to transform all the benefits in monetary terms. This facilitates the subsequent set-up of a weighing set to sum up all the effects. In fact, if benefits are put in terms of costs, all of them could be simply algebraically added up (together and with costs) and the resulting scoring factor would still be meaningful. This would imply all the weights set to one. As we will see later, a subsequent sensitivity analysis will allow us to calculate what range of variability of the weights ensures that the solution getting the best score stays the same.
5.1.4 Calculation of the social welfare improvement
For simplicity, we suppose that the loads are perfectly inelastic to price, i.e. the load does not depend on market price14. In this case, the terms of the social welfare parameter that have to do with the load become constant and, since we are interested to compare two situations (with and without a given connector), can be omitted. The resulting indicator is equal to the total dispatching cost paid to generators, changed by sign. Here is the calculation of the hourly dispatching cost (Hcost) for the three cases: Base case (without expansion): G1 (cheaper than G2) provides 80 MW to the load in zone B. The remaining 20 MW have to be provided by the local generator (more expensive). The saturation between A and B creates two different price zones. Zone C is independent, fed by G3. HCost = q1 p1 + q2 p2 + q3 p3 = 80 * 80 + 20 * 100 + 50 * 20 = 9400 €
14 This assumption is very realistic in the present situation of the electrical markets. This could change in a future in which demand responsiveness gains momentum. In any case, even if the inelasticity assumption were not taken, the methodology would not become conceptually more complicated.

D3.3.1 Possible criteria to assess technical-economic and strategic benefits of specific transmission projects
Building C1: G3 is enabled to feed also the load in zone B, replacing G1 (more expensive). A and C have the same price (no bottleneck in-between), whereas B has a different price, due to the saturation AB: HCost = q2 p2 + q3 p3 = 20 * 100 + (50+80) * 20 = 4600 € Building C2: G3 is again able to replace G1, but only up to 40 MW, because of the limitation on the interconnector CA. G1 still feeds the load in B that is not fed by G3, that, being equal to 100 – 40 = 60MW (i.e. less than 80 MW) doesn’t saturate the interconnector AB. As a result, C is a zone price separated by A-B, that form an only price zone. HCost = q1 p1 + q3 p3 = (100 – 40) * 80 + (40 + 50) * 20 = 6600 € In order to calculate the total cost over the time horizon we consider for the cost-benefit analysis we assume: • that the total time horizon in which the investment costs in a new infrastructure has to be
recovered is 20 years; • that the hour considered above is representative of all the hours within this time horizon15. Hence, the costs can be actualized to the investment time (supposed lumped at hour zero) in the following way:
( ) ( )( )( ) ⎟⎟
⎠
⎞⎜⎜⎝
⎛
+−+
=⎟⎟⎠
⎞⎜⎜⎝
⎛
+=⎟⎟
⎠
⎞⎜⎜⎝
⎛
+= ∑∑
==20
2020
1
20
1 111
11
1
rrrHCostNHours
rHCostNHours
rHCostNHoursCost
yy
yy
where:
• y is the year index (going from 1 to the 20 years of the horizon) • NHours is number of year hours, assumed equal to 8760 • HCost is the hourly dispatching cost calculated above • r is the actualization parameter, that we assume equal to 0.1.
The effect on cost for the two alternative grid expansions can be calculated as:
( )( )
HCostrr
rNHoursCostCosthCostTotDispatc ansionwithoutansionwith Δ⎟⎟⎠
⎞⎜⎜⎝
⎛
+−+
=−=Δ 20
20
exp exp 111
The resulting values for the two cases are: ΔTotDispatchCost (C1) = -358 x 106 € ΔTot DispatchCost (C2) = -209 x 106 €
15 This is a over-simplifying hypothesis that we introduce in order to be able to treat analytically the problem. In real cases, simulation tools have to be used to calculate the dispatching cost for the different hours.
83

D3.3.1 Possible criteria to assess technical-economic and strategic benefits of specific transmission projects
5.1.5 Calculation of the impact on emissions Assuming to associate a price to CO2 emissions (PCO2) equal to 15 €/tCO2, the hourly emission cost (CO2Cost) associated to the three cases can be calculated as follows: Base case (without expansion): Co2Cost = PCO2 (e1 q1 + e2 q2+ e3 q3) = 15 * (0.4 * 80 + 0.9 * 20 + 0.9 * 50) = 1425 x 106 € Building C1: Co2Cost = PCO2 (e2 q2+ e3 q3) = 15 * (0.9 * 20 + 0.9 * (50+80)) = 2025 x 106 € Building C2: Co2Cost = PCO2 (e1 q1 + e3 q3) = 15 * (0.4 * (100 – 40) + 0.9 * (40 + 50)) = 1575 x 106 € The total cost on the 20 years time horizon can be calculated in the same way as for the dispatching costs:
( ) ( )( )( ) ⎟⎟
⎠
⎞⎜⎜⎝
⎛
+−+
=⎟⎟⎠
⎞⎜⎜⎝
⎛
+=⎟⎟
⎠
⎞⎜⎜⎝
⎛
+= ∑∑
==20
2020
1
20
1 1112
112
12 2
rrrCostCONHours
rCostCONHours
rCostCONHoursCostTotCO
yy
yy
The effect on cost for the two alternative grid expansions can be calculated as:
( )( )
CostTotCOrr
rNHoursCostTotCOCostTotCOCostTotCO ansionwithoutansionwith 21
11 222 20
20
exp exp Δ⎟⎟⎠
⎞⎜⎜⎝
⎛
+−+
=−=Δ
The resulting values for the two cases are: ΔTotCO2Cost (C1) = 45 x 106 € ΔTot CO2Cost (C2) = 11 x 106 € 5.1.6 Ranking of solutions and sensitivity analysis Now that all the elements have been calculated, the ranking factor for the two alternatives can be obtained by means of a weighed sum of all the costs: Ranking (C1) = Investment(C1) + w1 * ΔTot DispatchCost (C1) + w2 * ΔTotCo2Cost (C1) = = 60 x 106 + w1 * -358 x 106 + w2 * 45 x 106
Ranking (C2) = Investment(C2) + w1 * ΔTot DispatchCost (C2) + w2 * ΔTotCo2Cost (C2) = = 50 x 106 + w1 * -209 x 106 + w2 * 11 x 106
84

D3.3.1 Possible criteria to assess technical-economic and strategic benefits of specific transmission projects 85
Supposing initially all the weights equal to one, it yields: Ranking (C1) = -253 x 106 € Ranking (C2) = -148 x 106 € We can note that: • the result is negative: both the solutions benefit the system: C1 more than C2; • the term related to dispatching benefits is by far prevailing on the environmental term. Therefore, as the grid expansion allows to replace one generator (G1) with another (G3) that is cheaper but characterized by a higher emissivity, if all the weights are kept equal to one the disadvantage from the environmental point of view is by far overcome by the economic impact. This could motivate a sensitivity analysis to assess for what value of the weight w2 (and keeping w1 fixed to one) the solution C2, that has a more limited negative impact from the environmental point of view, could become more appealing than C1. In analytical terms, we want to assess for which values of w2 it happens that: 60 x 106 -358 x 106 + w2 * 45 x 106 > 50 x 106 -209 x 106 + w2 * 11 x 106
This is true for w2 > 4. This means that if we assume w2 > 4, the solution C2 becomes preferable. At this point, considerations on the reciprocal importance between the economic and the environmental benefits should lead to the final decision on the ranking. 5.2 Characteristics of the new tool In order to assess the transmission expansion benefits described in Chapter 4 a power system simulation tool needs to be developed and adopted. This new tool should possess the following features:
- it has to address the quantification of the benefits in a computationally efficient way
- it has to be suitable for power system (optimisation) and market studies, especially for large size systems
- it has to be suitable for reliability studies (probabilistic criteria)
- it has to incorporate emission amount and cost calculations
- it has to be flexible, expandable and possibly linkable to other existing tools
General features of the new tool under development for cost-benefit analysis are presented in the following. REALISEGRID Deliverable D3.3.3 will provide a more complete, detailed description of it. The new tool represents a new methodology proposed for the transmission planning process. The purpose of this innovative tool is to conduct analysis of static reliability (or adequacy) of complex electric systems that operate in a liberalised market context and are divided in areas. This might then be a situation typical of European regional markets. In comparison to conventional planning tools, the new tool quantifies both indices generally used to assess reliability of electric systems and indices aimed at innovatively assessing from the economic point of view the effects and the eventual criticalities caused by the market structure on the transmission system evolution.

D3.3.1 Possible criteria to assess technical-economic and strategic benefits of specific transmission projects 86
Main features of this tool are: • full network representation adopting the simplified direct current model; • an Optimal Power Flow (OPF) algorithm; • probabilistic simulation of one year of operation of the power system using a non-sequential
Monte Carlo method; • quantitative assessment of the reliability benefits; • quantitative assessment of the “economic” benefits (both substitution and strategic effect).
The optimisation aims at the maximisation of the Social Welfare (SW), calculated as the sum of consumer surplus (CS) and producer surplus (PS). The optimisation simulates the intersection of the supply and demand curves and the re-dispatching and load curtailment actions needed for the fulfilment of the network constraints. The model adopted to represent the transmission network is the simplified direct current model: however, all links (transformers and lines) are fully represented and all power transits are always subject to the imposed technical constraints. The OPF operates in a probabilistic environment in order to verify the system reliability taking into account also the probability of outages of each component and also to account for the different weather conditions. In fact, the OPF is framed into a non-sequential Monte Carlo Methodology that aims at accounting for the uncertainties of a significant sample of system configurations. Those configurations are described with combinations of load profiles and outages typical of a planned maintenance of different system components. The reference year is analysed through a significant number (e.g. in the order of 1000-10000) of possible system configurations randomly extracted. Each configuration is randomly associated to a weekly load profile. Users can define the features of the selected load profile. For each selected profile a complete OPF is calculated. The adopted OPF consists of four different stages. Each stage corresponds to a more detailed representation of the transmission system under study, in order to identify additional costs (for example, for re-dispatch or for load shedding) in presence of a zonal market and depending on the structure of the transmission grid. During the first stage the optimal dispatch is calculated assuming a simplified network model. The simplified model does not account for network and market constraints. In this stage, the tool identifies inadequacies, if present, of the existing generation system that is assessed using the EENS index (Expected Energy Not Supplied) that accounts for the load shedding caused by lack of power generation: the corresponding index is the Lack Of Power (LOP). During the second stage, the tool calculates the optimal dispatch taking into account only network constraints between market zones. Market operation is simulated matching curves of aggregated power supply bids and curves representing the aggregated demand in every market zone. In this process, the Net Transfer Capacity (NTC) between two zones is also considered. The tool, based on EENS index, identifies the need to shed loads because of scarcity of NTC between two market areas: this is carried out by the calculation of the LOI index (Lack of Interconnection). The difference between system costs calculated in stage 2 and stage 1 represents the “cost of the market”. During the third stage, the optimal dispatch is calculated, considering also network constraints that occur also within a single zone. The effects of these constraints are calculated using the LOI index. The difference between costs calculated in stage 3 and costs calculated in stage 2 are due to network constraints and represents the “cost of interconnections”. Finally, in the fourth stage the optimal dispatch is calculated taking into account network constraints between market zones, transmission constraints on each transmission line within each zone and between different zones of the system. In this way, the optimal dispatch that complies with market outputs is calculated. In this stage, the tool calculates the corresponding EENS index that

D3.3.1 Possible criteria to assess technical-economic and strategic benefits of specific transmission projects 87
accounts for the necessity to shed loads because of the physical constraints present on a multi-area transmission system. The difference between the costs calculated in stage 4 and the costs in stage 3 is due to the re-dispatch caused by constraints on the transmission corridors within market zones and represents the “cost of the network”. In stage 4, for each node of the grid, the values of Locational Marginal Prices (LMP) are calculated. These values represent the incremental costs of the load at each node: the geographical distribution of LMP is used to identify the critical zones in the system. Moreover, in stage 3 and 4 those corridors that operate close to their transmission limits, therefore representing the bottlenecks of the system, are identified. For each of them, the tool calculates the duration of the operation of such corridors in those congestion conditions and the corresponding Lagrange Multipliers, representing the incremental cost of the transmission. Duration and cost allow the identification of the most critical network portions. The new tool can assess benefits of transmission expansions for each market zone, in addition to the overall social perspective (systemic approach), as well as separately for consumers, producers and TSOs. Also, this new tool incorporates modeling of wind power plants as well as of PST (Phase Shifting Transformer) and HVDC (High Voltage Direct Current) links. In addition, fuel costs and emissions are also calculated by the new tool.

D3.3.1 Possible criteria to assess technical-economic and strategic benefits of specific transmission projects 88
6 CONCLUSIONS The present report focuses on the cost-benefit analysis as crucial stage of the transmission expansion planning process. It provides an in-depth investigation of the different benefits for the society resulting from transmission expansion and their quantitative assessment criteria and methods. This serves as a basis for introducing a new approach accounting for evaluating all benefits in a complete and structured way. After the Introduction (Chapter 2), the transmission expansion planning process is introduced in Chapter 3 with its basic scheme and stages. In Europe, reference for this analysis, the challenges faced nowadays from transmission planners relate to the key targets set by the EU’s policy, that is, system competitiveness, environmental sustainability and security of energy supply. These challenges especially concern the greater uncertainty levels introduced by the power sector deregulation and the growing penetration of variable (RES) generation and load. In this frame, transmission planning approaches need to evolve: the research in this field has seen the extension of classic methods to address new issues ahead of transmission planners. From the review of the general scientific literature of transmission expansion planning (Chapter 3), it clearly emerges that the different planning methods can be classified according to the use of deterministic and non-deterministic approaches. They can be also grouped according to their technique, timeframe horizon and power system structure. A crucial stage of the transmission planning is the cost-benefit analysis, aiming at ranking the different expansion options upon a comparative techno-economic and socio-environmental assessment. This leads then to the selection of the most promising solution(s) towards the final planners’ decision-making. Towards this goal, the possible benefits provided by transmission expansion to the society need to be quantitatively evaluated (Chapter 4). These benefits can be grouped according to the three EU policy targets and can be listed as: system reliability improvement; quality and security increase; system losses reduction; congestion reduction and market benefits; environmental sustainability benefits; avoidance/postponement of investments; more efficient reserve management and frequency regulation; facilitation of distributed generation integration by a closer coordination of transmission and distribution grids; improvement of the dynamic behaviour of the power system. Concerning the reliability increase, the indices traditionally used to evaluate this benefit, under the so-called criteria-based approach, include EENS (Expected Energy Not Supplied), LOLP (Loss Of Load Probability), LOLE (Loss Of Load Expectation). In addition, new reliability indices, like VOLL (Value Of Lost Load), IEAR (Interruption Energy Assessment Rate) and WTP (Willingness To Pay), are currently utilised in order to more consistently assess the economic impact of system reliability (value-based approach). The reduction of network congestions is a key benefit possibly deriving from transmission expansion. This would then allow the exploitation of transmission corridors and the unlock of more efficient power generation (‘substitution effect’), both within one market and on a multi-national basis. This benefit can be measured by an increase of the Social Welfare (SW); other indicators are Consumers Surplus (CS) and Producers Surplus (PS). Also, the increased market competitiveness with a consequent reduction of market power potentials of dominant players, where present, may lead to a market price reduction (‘strategic effect’). Key indicators to evaluate this benefit are in primis the Social Welfare (SW), but also the Market Share, the Herfindal Hirschman Index (HHI), the Residual Supply Index (RSI) (ex-ante analysis) and the Lerner Index (LI), the Price-Cost Marginal Index (PCMI) (ex-post analysis). When planning the utilisation of fast power flow controllers such as FACTS (Flexible Alternating Current

D3.3.1 Possible criteria to assess technical-economic and strategic benefits of specific transmission projects 89
Transmission System) and HVDC (High Voltage Direct Current), an additional benefit is the power flows controllability increase granted by these technologies. The environmental sustainability benefits by transmission expansion imply: a better exploitation of a diversified generation mix, also including variable RES (e.g. wind); CO2, NOx, SO2 emissions-related costs savings, in presence of more efficient generation, including also RES; the reduction of fossil fuel generation external costs (externalities); the decrease of internal (fossil fuel) operating costs. Transmission upgrades may also bring some additional environmental benefits in terms of land use reduction, visual and noise impact abatement and electromagnetic fields (EMF) level decrease. The benefit of an increased wind energy exploitation is related to a higher contribution of wind power in covering the load curve, while maintaining the same installed conventional generating capacity, with the consequent generation output mix changes. Key indicators for evaluating this benefit are the utilisation factors of the different power plants, the additional wind power installed capacity and the wasted wind energy (where wind power plants are dispatchable, i.e. wind generation curtailment is an option). The benefit of savings of CO2, NOx, SO2 emissions from conventional generation in presence of RES strongly depends on the type and quantity of fuel used as well as on the ETS (Emission Trading Scheme) allowances (for CO2). Key indicators for assessing this benefit are the CO2, NOx, SO2 emissions, the fuel emission factors, the level of substituted generation, the CO2 penalty factors and the emission-related operating costs. The externalities reduction concerns the decrease of external costs of conventional generation in presence of RES. It refers to the impact of NOx, SO2 emissions and dusts on environment and health. Key indicators for evaluating this benefit are the external costs of fossil fuel generation. Fossil fuel generation costs decrease concerns the reduced consumption of fossil fuel for power generation in presence of RES. Key indicators for assessing this benefit are the fossil fuel consumption and the fossil fuel related operating costs. Other benefits which in the future may gain higher consideration relate to the improved interaction of transmission and distribution grids. This refers to systems either experiencing high shares of distributed generation resources or even evolving towards so-called SmartGrids schemes by a considerable distributed generation deployment. A transmission reinforcement may indeed bring about a more effective exploitation of distributed generation resources, while also better coordinating them when installed in different distribution networks, multiplying then the trading opportunities. This would also reduce the necessity to invest in the distribution grids and/or local smart devices. In order to account for the different evaluation criteria of transmission expansion benefits in a complete and structured way, a new approach is introduced (in Chapter 5). This is needed for representing a degree of optimality of a single expansion project towards a whole cost-benefit analysis. In this way, different alternatives can be then compared, the highest ranked being the most suitable to be financed and realized. The proposed methodology evaluates the transmission expansion benefits from the society’s perspective: this is a systemic approach and is applied by a multi-criteria analysis, in order to address different criteria for evaluating possible benefits of expansion alternatives. These criteria encompassing the factors that can be significant for a decision-maker must avoid double counting, which can occur when a criterion implicitly includes another one. Within this purpose, it can be useful to organize the criteria in a top-down tree starting with a general classification (e.g. economic criteria, environmental criteria) and branching down up to reach the leaves that represent fundamental, directly measurable criteria.

D3.3.1 Possible criteria to assess technical-economic and strategic benefits of specific transmission projects 90
The measurement of these criteria can be provided either by absolute measurements (indicators) or through a differential measurement with respect to a base case (impact). An evaluation matrix matching the criteria and the possible alternatives allows to combine all the criteria evaluations of a single alternative weighing them in order to provide a single ranking number. However, being every criterion measured by means of a (potentially) different unit, a straightforward weighed sum of criteria for each alternative is not meaningful. Additionally, even when a conversion of every criterion measurement into an economic parameter (e.g. €) is feasible, there could be the difficulty in summing up non consistent figures. Thus, all the criteria indicators measuring benefits - but also costs - for each alternative need to be converted into one only, possibly a-dimensional, utility value. This element expresses then the level of satisfaction or approval that a single value of the indicator has towards the different players and the society as a whole. The function performing this conversion is in general called a utility function. All the utility functions should have the same domain, so as to obtain mutually comparable values. Once all the indicators have been converted into one only utility parameter, all the indicators values relevant to a single alternative may be linearly combined so as to calculate one only ranking parameter attached to that alternative. In general, a weighed linear combination is calculated, making use of a weights vector. This vector incorporates the reciprocal importance of one criterion with respect to the others. A simple case serves as a demonstrative example of how to apply the proposed methodology. The general features and characteristics of the power system simulation tool needed to quantitatively evaluate the different transmission expansion benefits are finally introduced. This tool has to: address the quantification of the different benefits in a computationally efficient way; be suitable for power system (optimisation) and market studies, especially for large size systems; be suitable for reliability studies (probabilistic criteria); incorporate emission amount and cost calculations; be flexible, expandable and linkable to other existing tools. Next steps, upon bringing also the cost elements in the picture, concern the application of the multi-criteria based cost-benefit analysis to a real case in the European power system: the TEN-E priority axis EL.2 interconnection lines. A further extension of the methodology could refer to the inclusion into the multi-criteria approach of those environmental aspects (like EMF, visual and noise impact, land occupation) that are difficultly translated into economical terms. The final goal is to provide the EU, the European stakeholders and TSOs with key elements, criteria and a new approach for systematically addressing cost-benefit analyses for ranking and selecting the most feasible option(s) among the possible reinforcement solutions of transmission expansion planning processes. The methodological framework proposed by REALISEGRID may serve to support the European Commission in the ongoing revision process of the Trans-European Networks development guidelines.
D3.3.1 Possible criteria to assess technical-economic and strategic benefits of specific transmission projects 91
7 REFERENCES [1] Fulli, G.; Ciupuliga, A.R.; L’Abbate, A.; Gibescu, M.: Review of existing methods for
transmission planning and for grid connection of wind power plants, REALISEGRID Project, Deliverable D3.1.1, July 2009, http://realisegrid.erse-web.it .
[2] Latorre, G.; Cruz, R.D.; Areiza, J.M.; Villegas, A.: Classification of Publications and Models on Transmission Expansion Planning, IEEE Transactions on Power Systems, Vol. 18, No. 2, May 2003, pp. 938-946.
[3] Oloomi Buygi, M.; Shanechi, H.M.; Balzer, G.; Shahidehpour, M.: Transmission Planning Approaches in Restructured Power Systems, Proc. of IEEE PowerTech 2003, Bologna, Italy, June 23-26, 2003.
[4] Lee, C.W.; Ng, S.K.K.; Zhong, J.; Wu, F.F.: Transmission Expansion Planning from Past to Future, Proc. of IEEE PSCE 2006, Atlanta, USA, 2006.
[5] Losa, I.; Bertoldi, O.: Regulation of continuity of supply in the electricity sector and cost of energy not supplied, International Energy Workshop 2009, Venice, Italy, June 17-19, 2009.
[6] Council of Energy Economic Regulators (CEER): 3rd Benchmarking report on quality of electricity supply, December 2005.
[7] Sanghvi, A.P.: Measurement of customer interruption cost/value of service for cost-benefit reliability evaluation: some commonly raised issues, IEEE Transactions on Power Systems, Vol. 5, No. 4, pp. 1333-1344, November 1990.
[8] Kariuki, K.K.; Allan, R.N.: Evaluation of reliability worth and value of lost load, IEE Proc. Gener. Transm. Distrib., Vol. 143, No. 2, March 1996.
[9] EURELECTRIC: EURELECTRIC’s views on quality of electricity distribution network services, December 2006.
[10] University of Bath (UK): WP5 Report on national and EU level estimates of energy supply externalities, CASES (Cost Assessment of Sustainable Energy Systems) Project, Deliverable D5.1., December 2007.
[11] CIGRE Task Force 38.06.01: Methods to consider customer interruption costs in power system analysis, CIGRE Task Force 38.06.01, Technical Brochure, August 2001.
[12] Energy Research Institute: Electricity outage cost study, Chulalongkorn University, Thailand, 2001.
[13] Tol, R.S.J.: The value of Loss of Load, ESRI-Ireland, working paper 214, October 2007. [14] Goett, A.A.; Hudson, K.; Train, K.E.: Customer’s choice among retail energy suppliers: the
Willingness-To-Pay for service attributes, Energy Journal, Vol. 21 (4), pp. 1-28, 2000. [15] Carlsson, F.; Martinson, P.: Willingness to pay among Swedish households to avoid power
outages: a Random Tobit Model approach, Elforsk report 05:04, February 2005. [16] Lawton, L.; Sullivan, M.; Van Liere, K.; Katz, A.; Eto, J.: A framework and review of
customer outage costs: integration and analysis of electric utility outage cost surveys, University of California - Lawrence Berkeley National Laboratory, paper LBNL 54365, November 2003.
[17] Billinton, R.; Oteng-Adjei, J.; Ghaiar, R.: Comparison of two alternate methods to establish an Interrupted Energy Assessment Rate IEEE Transactions on Power Systems, Vol. 2, No. 3, August 1987.
[18] Gallanti, M.; Migliavacca, G.: How simulators can be useful in scenario analyses assessing the impact of network constraints on market prices, Workshop ‘Electricity market performance under physical constraints’, Moncalieri, Italy, September, 25th 2007.

D3.3.1 Possible criteria to assess technical-economic and strategic benefits of specific transmission projects 92
[19] Fumagalli, E.; Garrone, P.; Grilli, L.: Service quality in the electricity industry: the role of privatisation and managerial behaviour Energy Policy, Vol. 35, pp. 6212-6224, 2007.
[20] Sheffrin, A.; Chen, J.; Hobbs, B.: Watching Watts to prevent abuse of power, IEEE Power & Energy magazine, Vol. 2, No. 4, July/August 2004, pp. 59-65.
[21] Borenstein, S.; Bushnell, J.; Stoft, S.: The competitive effect of transmission capacity in a deregulated electricity industry, Rand Journal of Economics, Vol. 31, No. 2, pp. 294-325, Summer 2000.
[22] Léautier, T.: Transmission constraints and imperfect market for power, Journal of Regulatory Economics, Vol. 19, No. 1, pp. 27-54, January 2001.
[23] Migliavacca, G.: Fundamentals of market monitoring, EES-UETP course, Milan, Italy, Sept. 25-27, 2006.
[24] Newbery, D.; Green, R.; Neuhoff, K.; Twomey, P.: A review of the monitoring of market power: The possible roles of TSOs in monitoring for market power issues in congested transmission systems, ETSO Paper, Nov. 2004.
[25] Calisti, R.; Cazzol, M.V.; Gatti, A.; Provenzano, D.: Identification, development and validation of social welfare and market power indices for transmission planning in competitive electric systems, 2005 (in Italian).
[26] O’Sullivan, A.; Sheffrin, S.M.: Economics: Principles in action, Pearson Prentice Hall, 2004, pp. 90.
[27] EWEA: Large scale integration of wind energy in the European power supply: analysis, issues and recommendations.
[28] TRADEWIND: D5.1: Effects of increasing wind power penetration on the power flows in European grids.
[29] TradeWind final report: Integrating Wind Developing Europe’s power market for the large-scale integration of wind power, February 2009.
[30] Wind Energy – The Facts: Volume 4 Environment, 2004. [31] Wind Energy – The Facts: Volume 5 Environment, 2009. [32] Van Werven, M.J.N; Van Oostvoorn, F.: Barriers and drivers of new interconnections
between EU and non-EU Electricity systems. ECN, May 2006. [33] European Commission: Green Paper: A European Strategy for Sustainable, Competitive
and Secure Energy. Brussels 8.3.2006. [34] European Commission: Communication From The Commission To The European
Parliament, The Council, The European Economic And Social Committee And The Committee Of The Regions, 20 20 by 2020 – Europe’s climate change opportunity, Brussels, 23.1.2008.
[35] http://www.smartgrids.eu/ [36] Ummels, B.C.: Power System Operation with Large-Scale Wind Power in Liberalised
Environments, 2008. [37] Ntotas, K., Gibescu, M., Kling, W.L, Ummels, B.C., Pelgrum, E.: Flexible International
Exchanges: a Possible Solution for Large – Scale Wind Power Integration, 2009 IEEE Bucharest Power Tech Conference.
[38] Ummels, B.C.; Gibescu, M.; Pelgrum, E.; Kling, W.L.: System Integration of Large-Scale Wind Power in the Netherlands, IEEE 2006.
[39] Ensslin, C.; Milligan, M.: Current Methods to Calculate Capacity Credit of Wind Power, IEA Collaboration, PES General Meeting - Conversion and Delivery of Electrical Energy in the 21st Century, 2008 IEEE.

D3.3.1 Possible criteria to assess technical-economic and strategic benefits of specific transmission projects 93
[40] Milligan, M.; Porter, K.: The Capacity Value of Wind in the United States: Methods and Implementation, The Electricity Journal Volume 19, Issue 2, March 2006, Pages 91-99, Elsevier.
[41] Graymore, M.L.M.; Sipe, N.G.; Rickson, R.E.: Regional sustainability: How useful are current tools of sustainability assessment at the regional scale?, Elsevier - Ecological Economics, 2008.
[42] Afgan, N.M.; Carvalho, M.G.; Hovanov, N.V: Energy system assessment with sustainability indicators, Elsevier – Energy Policy, 2000.
[43] Spangenberg, J.H.: Environmental space and the prism of sustainability: frameworks for indicators measuring sustainable development, Elsevier – Ecological Indicators, 2002.
[44] Dincer, I.: Renewable energy and sustainable development: a crucial review, Elsevier – Renewable and Sustainable Energy Reviews, 2000.
[45] Operation Simulation Associates, Inc. PowrSym3 User’s Manual v361d2. Technical report, OSA.
[46] Operation Simulation Associates, Inc., Description of the PowrSym3 computer model. [47] Padhy, M.P.: Unit Commitment – A Bibliographical Survey, IEEE Transactions on Power
Systems, 19(2): 1196 – 1205, May 2004. [48] Wu, L.; Shahidehpour, M.; Li, T.: Stochastic Security-Constrained Unit Commitment,
IEEE Transactions on Power Systems, vol. 22, no. 2, May 2007. [49] Ma, H.; Shahidehpour, S.M.: Unit Commitment With Transmission Security and Voltage
Constraints, IEEE Transactions on Power Systems, vol. 14, no. 2, May 1999. [50] ETSO. Net Transfer Capacities Matrix. Available online at: http://www.etso-net.org (now
http://www.entsoe.eu ) . [51] Nuclear Energy Agency, International Energy Agency, Organisation For Economic Co-
operation And Development: Projected Costs of Generating Electricity, 2005 Update. [52] Bernow, S; Biewald, B; Singh, D.: Modelling renewable electric resources: a case study of
wind reliability. Presented at NARUC-DOE National conference on renewable energy. Savannah, Georgia; October 1993.
[53] ESB National Grid. Impact of wind power generation in Ireland on the operation of conventional plant and the economic implications; 2004.
[54] Karki, R.; Billinton, R.: Cost-effective wind energy utilization for reliable power supply. [55] ExternE project, http://www.externe.info . [56] Mora, D.; Hohmeyer, O.: External cost of electricity generation systems, Final Report, EU-
Altener Project Re-xpansion, Brussels, 2005. [57] DENA Grid study – Summary of the Essential Results of the Study, Berlin, 2005,
http://www.dena.de . [58] Stevens, G.C.; Philpot, B.; et al: LEETS, A Tool for the Environmental And Economic
Analysis of Transmission Systems, paper B4-209, CIGRE 2006 [59] Vaiani, A.; Bresesti, P.; Vailati, R.: A Method to Assess Benefits of Transmission
Expansions in the Italian Electricity Market, IEEE PES General Meeting 2007. [60] http://www.pjm.com/ [61] http://www.nyiso.com [62] Carrion, M.; Arroyo, J.M.: A Computationally Efficient Mixed-Integer Linear Formulation
for the Thermal Unit Commitment Problem, IEEE Transactions on Power Systems, 21(3):1371-1378, August 2006.
[63] IMPROGRES: “Improvement of the Social Optimal Outcome of Market Integration of DG/RES in European Electricity Markets, IEE Project, ongoing, http://www.improgres.org
[64] US: IntelliGrid (EPRI: http://www.epri.com), GRIDWISE (DOE: http://www.gridwise.org)

D3.3.1 Possible criteria to assess technical-economic and strategic benefits of specific transmission projects 94
[65] EU: Technology Platform for the Electricity Networks of the Future (SmartGrids: www.smartgrids.eu)
[66] Denmark: Energinet.dk (TSO) and Sydvest Energi Net (DSO): “Cell Pilot Project”: http://www.energinet.dk , http://www.sydenergi.dk .
[67] L'Abbate, A.; Fulli, G.; Starr, F.; Peteves, S.D.: Distributed Power Generation in Europe: technical issues for further integration, JRC Scientific and Technical Report EUR 23234 EN, JRC – European Commission, Institute for Energy, 2008.
[68] Migliavacca, G.: SREMS: a short-medium run electricity market simulator based on game theory and incorporating network constraints, Proc. of IEEE PowerTech 2007, Lausanne, Switzerland, July 1-5, 2007.
[69] L’Abbate, A.; Fulli, G.: Targeted HVDC Deployment for a Sustainable European Transmission System Development, Proc. of PSCC 2008 Conference, Glasgow, UK, July 14-18, 2008.
[70] European Parliament and European Council: Decision 1364/2006/EC of the European Parliament and of the Council of 6 September 2006 laying down guidelines for trans-European energy networks and repealing Decision 96/391/EC and Decision 1229/2003/EC, Official Journal of the European Communities No. L 262, 22.09.2006 P. 0001-0023.
[71] European Commission: COM(2008) 782 final, Green Paper "Towards a secure, sustainable and competitive European energy network", Brussels, 13 November 2008.
[72] Carlini, E.M.; Pericolo, P.P.; Di Cicco, P.: Valutazioni tecniche ed economiche delle infrastrutture della RTN, L’Energia Elettrica, November-December 2008, pp. 1-6 (in Italian).
[73] Stoft, S.: The effect of transmission grid on market power, Berkeley University, May 1997. [74] Bertoldi, O.; Innorta, M.; Demartini, G.; Salvaderi, L.; Marannino, P.: New issues in bulk
power system planning, Paper 37-106, CIGRE Session, Paris, August 1996. [75] ENTSO-E, Ten-Year Network Development Plan (TYNDP) 2010-2020, March 2010 (in
consultation), http://www.entsoe.eu . [76] Rüberg, S.; Ferreira, H.; L’Abbate, A.; Häger, U.; Fulli, G.; Li, Y.; Schwippe, J.: Improving
network controllability by Flexible Alternating Current Transmission System (FACTS) and by High Voltage Direct Current (HVDC) transmission systems, REALISEGRID Project, Deliverable D1.2.1, March 2010, http://realisegrid.erse-web.it .
[77] UCTE (Union for the Coordination of Transmission of Electricity) website http://www.ucte.org/ (now: http://www.entsoe.eu).