Embed Size (px)
Citation preview

ACT Project Number: 271498
Project acronym:
ELEGANCY
Project full title: Enabling a Low-Carbon Economy via Hydrogen and CCS
ERA-Net ACT project
Starting date: 2017-08-31 Duration: 36 months
D5.2.1 Report describing the current industrial cluster in Rotterdam
with its socio-economic contribution, CO2 emissions and target setting for emission reduction
Date: 2018-04-06
Organization name of lead participant for this deliverable: TNO
Project co-funded by the European Commission within Horizon2020
Dissemination Level
PU Public X
CO Confidential , only for members of the consortium (including the Commission Services)


Page iii
Deliverable number: D5.2.1
Deliverable title: Report describing the current industrial cluster in Rotterdam with its socio-economic contribution, CO2 emissions and target setting for emission reduction
Work package: WP5 Case Studies
Lead participant: TNO
Authors
Name Organisation E-mail
Robert de Kler TNO [email protected]
Rajat Bhardwaj TNO [email protected]
*Lead author
Keywords
Port Rotterdam CO2 emissions target, industrial cluster
Abstract
The socio-economic contribution of the current industrial cluster in Rotterdam is significant. The Port of Rotterdam is the largest seaport in Europe with an annual throughput of around 465 Mtonnes in 2015. The Rotterdam's strong position as a port, is not only important for the regional economy, but also for that of the Netherlands and even of Europe as a whole. The port’s industrial cluster is made up to a great extent of companies operating in the energy and CO2-intensive sectors of oil refining, (petro)chemical manufacturing and power and steam generation. The CO2 emissions reduction target for 2030 is set at 49% CO2 reduction versus the emission levels of 1990. This is very challenging and requires a radical shift towards CO2 neutral industry. The following five generic processes in the energy intensive industry are the main contributors for the large CO2 emissions: (1) Coal fired power plants, (2) Combined cycle power plants, (3) High-temperature heating, (4) Medium-temperature heating, (5) Direct chemical co-products. These generic processes are potentially capable to use hydrogen as an alternative feedstock. The total potential CO2 emission reduction would amount approximately 30 Mtonnes per annum. As such, it is obvious that hydrogen can play a crucial role, accelerating the reduction of CO2 emission in the Port of Rotterdam. Hydrogen can play a crucial role in reducing the CO2 emission on the short term. Conservatively 4 up to 6 Mtonnes per annum of CO2 emission reduction might be a realistic target setting for 2030 by using hydrogen as an energy feedstock and to equip existing SMR units with CO2 capture technology.


Page v
ACT ELEGANCY, Project No 271498, has received funding from DETEC (CH), FZJ/PtJ (DE), RVO (NL), Gassnova (NO), BEIS (UK) and Gassco AS, and is cofunded by the European Commission under the Horizon 2020 programme, ACT Grant Agreement No 691712.
TABLE OF CONTENTS
Page
1 INTRODUCTION ..........................................................................................................1
2 SOCIO-ECONOMIC CONTRIBUTION INDUSTRIAL CLUSTER OF PORT OF
ROTTERDAM ...............................................................................................................4 2.1 The petrochemical industry .................................................................................4
2.2 Power generation .................................................................................................5 2.3 Impact by the Port of Rotterdam .........................................................................5
3 PROCESSES IN HIC AND THEIR CO2 EMISSIONS ................................................6
4 CO2 EMISSION REDUCTION TARGET SETTINGS ................................................7 4.1 Power generation .................................................................................................7 4.2 Oil-refining and Petrochemical industry .............................................................7
4.3 Other industrial sectors ........................................................................................8 4.4 Overview of the current estimated CO2 footprint of the industry .....................10
5 CONCLUSION ............................................................................................................11


Page 1
ACT ELEGANCY, Project No 271498, has received funding from DETEC (CH), FZJ/PtJ (DE), RVO (NL), Gassnova (NO), BEIS (UK) and Gassco AS, and is cofunded by the European Commission under the Horizon 2020 programme, ACT Grant Agreement No 691712.
1 INTRODUCTION
The aim of ELEGANCY project is to fast-track European CCS in the 2020s. As such ELEGANCY
will then apply all its research findings, technologies and tools to five national case studies in
order to identify cost-effective opportunities for H2-CCS for each country represented in the
consortium. This includes the Netherlands: decarbonizing industry by specifying a comprehensive
H2-CCUS value chain in the Rotterdam region.
The EU has formally announced that the Rotterdam Region has to reduce in 2030 its CO2 emission
level already by 14 MTonnes CO2/year compared to today emission level. In its recent Declaration
of Intent (Oct 10, 2017) of the newly formed Dutch Government, it is indicating a 2030 target of
49% CO2 reduction versus the emission levels of 1990, which is even tougher then the EU levels.
To realize these CO2 emission reductions, a radical transformation of the Rotterdam industry is
required, away from cheap conventional fuels that is mainly responsible for the CO2 emissions.
The Wuppertal Institute has provided the Port of Rotterdam with three possible Roadmaps
suggesting pathways to a low carbon economy by 2050, see figure 1.1. Nevertheless, converting
the 200+ Billion Euro capital assets in Rotterdam associated with power, (petro) chemical and oil-
refining business along any of these pathways will take time and is capital intensive, well beyond
2040. But the year 2030 and its CO2 emission reduction targets are real and have to be addressed
comprehensively and fast.
The Port of Rotterdam is the largest seaport in Europe with an annual throughput of around
465 Mtonnes in 2015.The port area includes about 6,000 ha of industrial sites. Overall, more than
90,000 people are employed in the port area, about 20,000 of those in the port’s industrial cluster.
(Port of Rotterdam Authority 2016)
The port’s industrial cluster is made up to a great extent of companies operating in the energy and
CO2-intensive sectors of oil refining, (petro)chemical manufacturing and power and steam
generation.
Chapter 1 will provide a short overview of the Rotterdam industrial cluster, Chapter 2 discuss the
socio-economic contribution of the Industrial Cluster of Rotterdam, Chapter 3 review the current
CO2 emission levels in the Rotterdam region and in Chapter 4 are the emission reduction potential
assessed and based on generic process applications.

Page 2
ACT ELEGANCY, Project No 271498, has received funding from DETEC (CH), FZJ/PtJ (DE), RVO (NL), Gassnova (NO), BEIS (UK) and Gassco AS, and is cofunded by the European Commission under the Horizon 2020 programme, ACT Grant Agreement No 691712.
Figure 1.1: Port of Rotterdam infographic on the energy transition pathways 2017, see website
voortgangsrapportage 2017, haven visie 2030.

Page 3
ACT ELEGANCY, Project No 271498, has received funding from DETEC (CH), FZJ/PtJ (DE), RVO (NL), Gassnova (NO), BEIS (UK) and Gassco AS, and is cofunded by the European Commission under the Horizon 2020 programme, ACT Grant Agreement No 691712.
The Rotterdam industrial cluster
The Port of Rotterdam entails 120 industrial companies consisting of 45 chemical companies, five
oil refineries, four palm oil refineries, five biofuel producers, two biochemical factories and
various power. The port of Rotterdam covers an industrial area, from the City of Rotterdam to the
Maasvlakte 2 area, including the port of Moerdijk Area and Dordrecht Area, see figure 1.2.
Figure 1.2 Port of Rotterdam
The port of Rotterdam has a diverse chemical industry. Major petrochemical multinationals
include Shell, AkzoNobel, DSM, LyondellBasell and ExxonMobil. The large number of chemical
companies and refineries in the port area of Rotterdam means a large socio-economic impact in
the region. Next to this the Port of Rotterdam is very well integrated making optimal use of
utilities and ensure clever business integration and collaborations. For example, the oil refineries
producing feedstock to the chemical industry while various chemical companies in turn supply
semi-finished products to other parties. Collaboration and system integration also take place in
tank storage, industrial gases, heat, steam, waste water treatment and electricity. This synergy
ensures a highly efficient and profitable business climate for all chemical companies operating in
the Port of Rotterdam. Besides the cluster within the port, the port of Rotterdam facilitates a strong
cluster with the petrochemical industry in the Netherlands, Belgium and Germany. This is the so-
called ARRRA cluster (Antwerp-Rotterdam-Rhine-Ruhr-Area) with integrated pipeline
connections is good for 40 per cent of the petrochemical production in the European Union.

Page 4
ACT ELEGANCY, Project No 271498, has received funding from DETEC (CH), FZJ/PtJ (DE), RVO (NL), Gassnova (NO), BEIS (UK) and Gassco AS, and is cofunded by the European Commission under the Horizon 2020 programme, ACT Grant Agreement No 691712.
2 SOCIO-ECONOMIC CONTRIBUTION INDUSTRIAL CLUSTER
OF PORT OF ROTTERDAM
Ports are the gateways, linking its transport corridors to the rest of the world. Approximately 70%
of goods entering or leaving Europe go by sea. As such ports play an equally important role to
support the exchange of goods within the internal market and in linking peripheral and island areas
with the mainland of Europe. Ports are not only great for moving goods around, they are also a
place for the energy hubs for conventional, renewable energies and storage. Port of Rotterdam is
mainly located in the city or Rotterdam. Rotterdam is the second largest city of the Netherlands
after Amsterdam with a population of approximately 624 thousand. The Port of Rotterdam is
particularly appreciated for its significant economic and social value for the Netherlands and the
Rijnmond region.
The key characteristics of the Port of Rotterdam:
River/coastal port: Coast and river
Ownership: Municipality & state/ Autonomous company
Total revenue (M€): 660 (this accounts only for the Port authority)
Total cargo (kTonnes): 465000
Dominant cargo: -Containers
-Dry bulk
-Liquid bulk
Dominant industry: -Petrochemical
-Power generation
2.1 The petrochemical industry
The Port of Rotterdam is an important crude oil hub and entails the highest capacities in crude oil
refining in Europe. The refineries deliver fuels and feedstock to diverse markets.
The first market to consider is the market which can be supplied easily by road tankers (because
of short distances) and an existing pipeline for petroleum products. This market comprises
geographically the Netherlands, Luxemburg and a large part of Germany. The product pipeline
from Rotterdam to southern Germany delivers crude oil, fuels and naphtha to the fuel market, to
inland refineries (in the Western German Rhine-Ruhr area) and to inland petrochemical sites
(Rhine-Ruhr, Frankfurt and Ludwigshafen).
The second market to consider is the market for bunker fuels at the port itself. Sea as well
as inland waterway vessels bunker their transportation fuel there.
The third market for oil products is offshore export. Currently there is a surplus in gasoline and a
a shortage of middle distillate capacities, resulting in a lot of export of gasoline from the EU to
the U.S. and East Asia.

Page 5
ACT ELEGANCY, Project No 271498, has received funding from DETEC (CH), FZJ/PtJ (DE), RVO (NL), Gassnova (NO), BEIS (UK) and Gassco AS, and is cofunded by the European Commission under the Horizon 2020 programme, ACT Grant Agreement No 691712.
Another market for refinery products is the downstream petrochemical industry cluster at the port
itself relates mainly to Naphtha or other crude products by cracking the molecules into platform
chemicals. Process units are mainly steam crackers and fluidized-bed crackers (FCC). The
platform chemicals ethylene, propylene and aromatics are the connection between refineries and
the petrochemical industry.
Most of the oil refining companies operates their own petrochemical plants at the port and a lot of
other global players are part of the petrochemical value chain within the port area.
2.2 Power generation
In the Port of Rotterdam a large portfolio of cogeneration of electricity and steam is installed. The
petrochemical industry operates its own cogeneration plants. Furthermore, the Rotterdam port area
is the most important site for coal handling and shipping to hinterland. Recently two brand new
high efficient coal-fired power plants are in commercial operation with a total capacity of 1,870
MWe and will replace two older units with a combined capacity of 1,000 MWe, which have been
decommissioned in 2017.
Most of the electricity produced at the port is supplied, not for the demand of the port area itself,
but for the Dutch (and European) electricity market. This has a strong impact on the territorial
GHG balance of the port area: coal-fired power units are the largest single emitters of CO2 at the
port.
2.3 Impact by the Port of Rotterdam
The Rotterdam seaport is an essential link in international transport chain and is the linking point
between continents. The Port of Rotterdam contribution to the Dutch economy as a whole is
considerable. More than half of Port of Rotterdam added value was earned in the transport, storage
and transfer of cargo. The Rotterdam's strong position as a port, is not only important for the
regional economy, but also for that of the Netherlands and even of Europe as a whole.
Nevertheless, the oil-refining sector is under pressure by demand shortfalls and increasing
competitive pressure from abroad. Recent developments of the implementation of stringent
environmental measures and has already a strong impact on the economics of the petrochemical
industry and competitive position.

Page 6
ACT ELEGANCY, Project No 271498, has received funding from DETEC (CH), FZJ/PtJ (DE), RVO (NL), Gassnova (NO), BEIS (UK) and Gassco AS, and is cofunded by the European Commission under the Horizon 2020 programme, ACT Grant Agreement No 691712.
3 PROCESSES IN HIC AND THEIR CO2 EMISSIONS
In 2015, the the level of CO2 emissions by the Rotterdam “Harbour and Industry Complex” (HIC)
is approximately 31 Mtonnes per year and made up 18% of the Netherlands’ total CO2 emissions.
Crude oil refining and processing as well as hydrogen production and steam cracking are
responsible for the bulk of direct CO2 emissions of the petrochemical industry at the port. There
are other downstream production lines which are energy intensive and lead to indirect CO2
emissions in the electricity or heat supply sector. The most energy intensive of these are considered
together with the main processes from the refineries.
Table 3 Overview of the main CO2 emissions in Harbour and Industry Complex (HIC) of
Rotterdam.
See also appendix A for a more detailed overview of the current CO2 emissions.
Processes Carbon footprint (Mt/yr)
Company Characteristics Remarks
Power generation 15.8 Uniper/
Engie
Eneco
Coal fired power plant
Combined heat and power
plants
Oil - refining 8.2 Shell/
Exxon/
Gunvor/
BP/Koch
Distillation, reforming,
desulphurization, others.
Steam cracker
heating
1.4 Shell
Moerdijk
Very high temperature heat
(850°C)
High exergy value
Industrial gas
production
1.4 Air
Liquide,
Air
Products,
Linde
Mainly hydrogen
production
Chlorine
production
(for PVC, MDI,
polycarbonate)
1.2
Akzo
Nobel
All electricity 2nd biggest
chlorine factory in
Europe.
Other 3.1
Total 31,1

Page 7
ACT ELEGANCY, Project No 271498, has received funding from DETEC (CH), FZJ/PtJ (DE), RVO (NL), Gassnova (NO), BEIS (UK) and Gassco AS, and is cofunded by the European Commission under the Horizon 2020 programme, ACT Grant Agreement No 691712.
4 CO2 EMISSION REDUCTION TARGET SETTINGS
The Port of Rotterdam has announced recently the ambition to develop the port into “the place”
where the energy transition takes shape. As such the Port of Rotterdam intends to play a pioneering
role and make the port an inspiring example for the global energy transition. The Port of Rotterdam
ambition is to be CO2 neutral by 2050. However, achieving these climate targets will require an
almost complete decarbonization by 2050 and will therefore require significant reductions of CO2
emissions, including in all industrial processes, possibly reaching zero by the middle of the century
or soon thereafter.
A radical change is needed and hydrogen might be used as the main source of energy for power
and heat generation.
4.1 Power generation
The potential CO2 reduction for power generation is theoretically very straightforward by just
substitution of the fossil based feedstock Coal and or Natural Gas in power plants. Combustion of
hydrogen in boilers and combustion turbines might be a proven technology step, yet it requires
dedicated burners and modification in the fuel feedstock system. It is most likely that hybrid
combustors will be used and the hydrogen capacity progressively will be increased.
By 2030 coal fired units are not anymore allowed to be operated with its corresponding CO2
emissions. Therefore, the CO2 emission reduction targets for power generation might be a result
of closing of the coal fired units, which corresponds to a total 14 Mtonnes per annum. Continued
operations on hydrogen might be an option for these units.
4.2 Oil-refining and Petrochemical industry
The CO2 emission reduction target for oil-refining will be empowered by the ETS scheme, product
requirements (Fuel Quality Directive) and the Renewable Energy Directive.
To reduce greenhouse gas emissions, Europe has the emissions trading system (EU ETS) in place.
The total amount of greenhouse gases that can be emitted are maximized. Emission allowances
are bought (or received) by companies. These emission allowances can be traded, and because of
this trade the CO2 gets a certain price.
Refineries are part of the ETS system. Currently, refineries buy around 23% of their allocations,
which based on the assumption that carbon costs €10 per tonne, translates into a fee of 6 cents per
barrel for refineries.
For the oil-refining and petrochemical sector, high temperature heating might be a sweet spot for
hydrogen. The use of hydrogen will substitute refinery associated gas or fuels which will be in
most cases resulting in a surplus of these products which needs to be sold or converted into other
valuable products. Therefor the application of hydrogen in high temperature heating system is not
simple and requires much more debottlenecking of existing equipment and new process units.
Page 8
ACT ELEGANCY, Project No 271498, has received funding from DETEC (CH), FZJ/PtJ (DE), RVO (NL), Gassnova (NO), BEIS (UK) and Gassco AS, and is cofunded by the European Commission under the Horizon 2020 programme, ACT Grant Agreement No 691712.
In case hydrogen is used as a zero carbon feedstock, the current Renewable Energy Directive does
not make clear how this can be counted as renewable energy for transport. The current situation is
such that hydrogen does not qualify as “biofuel” under RED since it is not an “end product” as it
is used in the production process. Furthermore, FQD does also only recognize emission reductions
downstream (focusing on end products) or upstream (before the refining process). As defined in
that directive only those emission reduction options are recognized as upstream which are
following the crude oil pathway. Since hydrogen is substituting fossil based fuels it falls not under
that definition and is therefore regarded as midstream. However, midstream emission reductions
are not regulated and do therefore not count against the quotas. Therefore, the legal definition of
upstream and the missing regulation of midstream emission reduction lead to the odd result that
emission reductions via hydrogen used for high temperature heating do not count against the
quotas.
However, it is obvious that blue hydrogen can play a crucial role in reducing the CO2 emission.
Conservatively 4 Mtonnes per annum of CO2 emission reduction might be a realistic target setting
for 2030, subject to the further development of regulations. It is worth noting that the existing
hydrogen production units already counts for 2 Mtonnes per annum of CO2 emissions, which are
the low hanging fruit options that can be equipped with CO2 capture units.
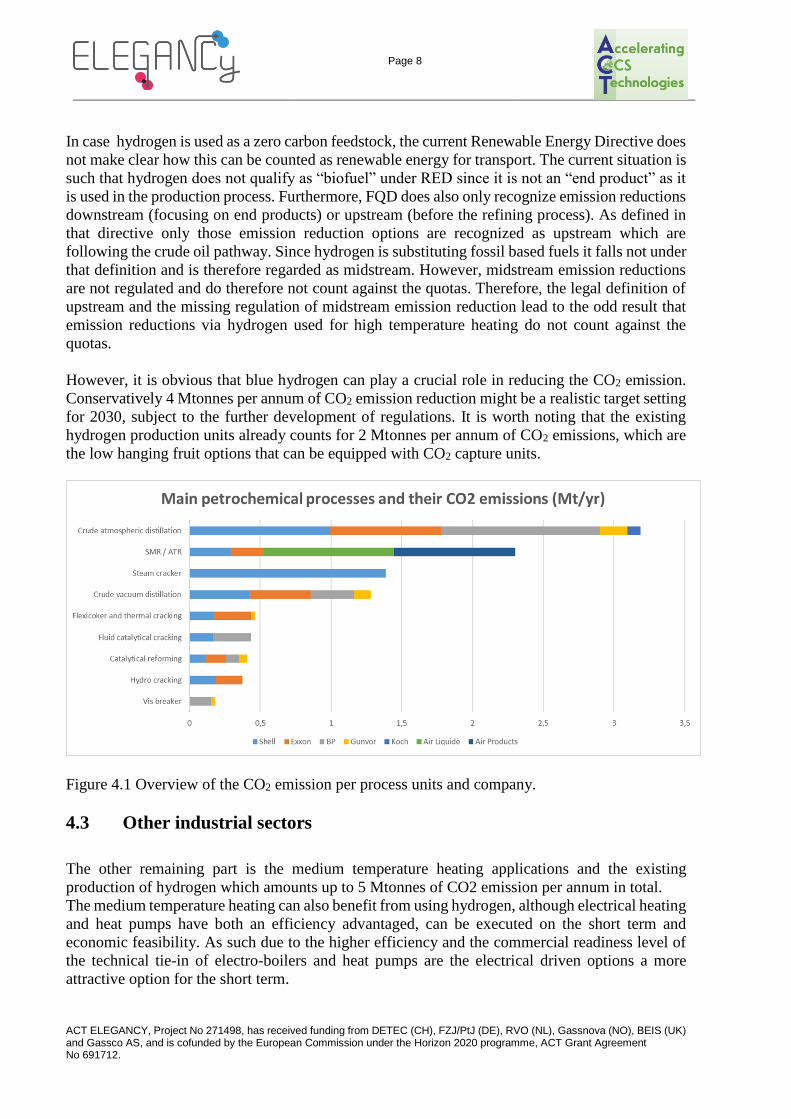
Figure 4.1 Overview of the CO2 emission per process units and company.
4.3 Other industrial sectors
The other remaining part is the medium temperature heating applications and the existing
production of hydrogen which amounts up to 5 Mtonnes of CO2 emission per annum in total.
The medium temperature heating can also benefit from using hydrogen, although electrical heating
and heat pumps have both an efficiency advantaged, can be executed on the short term and
economic feasibility. As such due to the higher efficiency and the commercial readiness level of
the technical tie-in of electro-boilers and heat pumps are the electrical driven options a more
attractive option for the short term.

Page 9
ACT ELEGANCY, Project No 271498, has received funding from DETEC (CH), FZJ/PtJ (DE), RVO (NL), Gassnova (NO), BEIS (UK) and Gassco AS, and is cofunded by the European Commission under the Horizon 2020 programme, ACT Grant Agreement No 691712.
The existing hydrogen SMR units are low hanging fruit options that can be equipment with proven
pre-combustion capture technology. The total CO2 reduction at the existing hydrogen production
capacity in the Rotterdam HIC is approx. 2 Mtonnes per annum. The existing SMR units are top
ranked operational units and AirLiquide, one of the operating companies, owns a large Hydrogen
pipeline infrastructure (more than 800 km).
Figure 4.2 AirLiquide Hydrogen pipeline infrastructure (see pipelines in Red).

Page 10
ACT ELEGANCY, Project No 271498, has received funding from DETEC (CH), FZJ/PtJ (DE), RVO (NL), Gassnova (NO), BEIS (UK) and Gassco AS, and is cofunded by the European Commission under the Horizon 2020 programme, ACT Grant Agreement No 691712.
4.4 Overview of the current estimated CO2 footprint of the industry
The CO2 is emitted from many different processes. However, they fall into a few categories that
can be addressed with a generic hydrogen substitution strategy. Hence the CO2 reduction target
setting might be focused on these view categories in the rest of the study for the Dutch case in
particularly for Port of Rotterdam.
Table 4 Estimation of the CO2 footprint of the process categories that can be addressed with a
hydrogen substitution strategy.
Description Characterization Technology Applications Estimated CO2 footprint in HIC
Coal fired power plants
Ultra-supercritical steam boilers
Hydrogen burners,
Power generation
14 Mtonnes
Combined cycle power plants
Combined Cycle heat and power
Hydrogen combustors
Power generation
3 Mtonnes
High-temperature heating
Heat transfer by radiation for temperatures >350°C
Direct heating of radiating surface by combustion of hydrocarbon
Steam cracking, atmospheric and vacuum distillation
9 Mtonnes
Medium-temperature heating
Heat transfer for temperatures <350°C
Medium- and high-pressure steam heating
All kinds of heating
3 Mtonnes
Direct chemical coproducts
CO2 generated as a coproduct of desired products
Hydrogen by methane reforming
2 Mtonnes
Total
31 Mtonnes
Page 11
ACT ELEGANCY, Project No 271498, has received funding from DETEC (CH), FZJ/PtJ (DE), RVO (NL), Gassnova (NO), BEIS (UK) and Gassco AS, and is cofunded by the European Commission under the Horizon 2020 programme, ACT Grant Agreement No 691712.
5 CONCLUSION
The socio-economic contribution of the current industrial cluster in Rotterdam is significant in
terms of local employment, production, logistics (connected sea port with the hinterland) and as
the largest seaport in Europe with an annual throughput of around 465 Mtonnes in 2015.
The port’s industrial cluster is made up to a great extent of companies operating in the energy and
CO2-intensive sectors of oil refining, (petro)chemical manufacturing and power and steam
generation. The CO2 emissions reduction target for 2030 is set at 49% CO2 reduction versus the
emission levels of 1990. This very challenging and requires a radical shift towards CO2 neutral
industry.
The following five generic processes in the energy intensive industry are the main contributors for
the large CO2 emissions: (1) Coal fired power plants, (2) Combined cycle power plants, (3) High-
temperature heating, (4) Medium-temperature heating, (5) Direct chemical co-products. All of
these generic process applications are potentially capable to use hydrogen as an alternative
feedstock. The total potential CO2 emission reduction would amount approximately 30 Mtonnes
per annum. However, it is obvious that hydrogen can play a crucial role in reducing the CO2
emission.
Hydrogen can play a crucial role in reducing the CO2 emission on the short term. Conservatively
4 up to 6 Mtonnes per annum of CO2 emission reduction might be a realistic target setting for
2030 by using hydrogen as an energy feedstock for high temperature heating applications and to
equipped existing SMR units with CO2 capture technology.

Page 12
ACT ELEGANCY, Project No 271498, has received funding from DETEC (CH), FZJ/PtJ (DE), RVO (NL), Gassnova (NO), BEIS (UK) and Gassco AS, and is cofunded by the European Commission under the Horizon 2020 programme, ACT Grant Agreement No 691712.
Appendix A: overview of the current CO2 emissions in the Port of Rotterdam
CO2 in kton/year
Category Location Component 2007 2008 2009 2010 2011 2012 2013 2014 2015 2016
CO2 Energie en Utilities CO2 11008 12101 12259 13490 13684 12770 12958 14466 16795 18899
CO2 Chemie CO2 2258 2136 2024 2381 2414 2320 2367 2425 2404 1870
CO2 Raffinaderijen CO2 10304 10208 9461 9746 9285 9128 8821 9386 9594 9563
CO2 Afvalverbranding CO2 1425 1416 1549 1760 1546 1576 1501 1513 1433 1631
CO2 Natte bulk CO2 86 66 83 83 87 104 101 89 98 104
CO2 Droge bulk CO2 11 11 9 11 11 11 14 15 11 11
Totaal CO2 CO2 25091 25938 25384 27470 27027 25907 25762 27894 30335 32078
CO2 Energie en Utilities (main ones) Location Component 2007 2008 2009 2010 2011 2012 2013 2014 2015 2016 MAX
Air Liquide Nederland B.V. CO2 0 27 37 53 130 283 918 781 673 472 918
Air Products Hyco4 Botlek CO2 555 635 518 619 472 606 546 616 606 631 635
Air Products Nederland B.V. locatie Botlek Botlek CO2 374 360 361 403 310 314 312 278 289 277 403
E.On Galileïstraat CO2 339 479 480 482 428 420 407 105 0 0 482
Uniper Maasvlakte Maasvlakte CO2 6337 6983 6176 6681 6757 6997 7227 6698 9171 10864 10864
Uniper RoCa CO2 700 681 715 671 608 443 469 462 316 304 715
Enecal Energy V.O.F. CO2 232 223 235 204 190 100 37 9 35 140 235
ENECOGEN V.O.F. CO2 0 0 0 0 422 439 400 893 908 1309 1309
Eurogen Cv CO2 467 460 406 465 425 466 521 507 482 290 521
ENGIE Energie NL N.V. CO2 0 0 0 0 0 0 200 2173 2792 3202 3202
Indorama Ventures Europe B.V. Europoort CO2 112 103 117 111 159 182 157 125 114 103 182
MaasStroom Energie C.V. CO2 0 0 0 640 598 270 242 191 161 63 640
Pergen V.O.F. Pernis CO2 0 581 1312 1375 1316 1270 1292 1197 1232 1229 1375
Rijnmond Energie CV CO2 1890 1568 1892 1782 1850 961 211 394 0 0 1892
Others CO2 1 2 12 6 21 18 21 36 16 16 36
Totaal CO2 CO2 11008 12101 12259 13490 13684 12770 12958 14466 16795 18899
CO2 Chemistry (main ones) Location Component 2007 2008 2009 2010 2011 2012 2013 2014 2015 2016 MAX
Abengoa Bioenergy Netherlands B.V. Europoort CO2 0 0 0 279 418 316 400 594 528 362 594
Akzo Nobel Chemicals B.V. CO2 201 207 186 181 165 140 147 130 152 133 207
Akzo Nobel Industrial Chemicals B.V. Europoort CO2 0 16 0 0 0 0 0 0 0 0 16
Aluminium en Chemie Rotterdam B.V. CO2 248 251 193 260 220 205 209 169 154 84 260
Archer Daniels Midland Europoort B.V. CO2 188 200 223 204 197 188 175 163 156 151 223
Cabot B.V. Botlek CO2 232 209 195 228 239 241 223 222 236 247 247
Exxonmobil Chemical Holland B.V. Rap CO2 427 334 406 411 442 458 427 390 445 0 458
Lyondell Chemie Nederland B.V. CO2 135 119 118 133 105 126 130 122 160 295 295
Shell Nederland Raffinaderij B.V. CO2 32 35 38 33 33 51 42 46 29 26 51
Shin-Etsu PVC B.V. Locatie Botlek Botlek CO2 87 87 86 101 102 102 101 87 96 108 108
Tronox Pigments (Holland) B.V. CO2 89 77 89 95 97 79 92 90 90 91 97
Lyondell Chemie Maasvlakte Maasvlakte CO2 10 13 10 12 10 10 12 10 11 12 13
Others CO2 608 589 478 444 387 404 411 402 348 361 608
Totaal CO2 CO2 2258 2136 2024 2381 2414 2320 2367 2425 2404 1870
% others 27% 28% 24% 19% 16% 17% 17% 17% 14% 19%
CO2 Refineries Location Component 2007 2008 2009 2010 2011 2012 2013 2014 2015 2016 MAX
BP Raffinaderij Rotterdam B.V. CO2 1999 2130 2025 2774 2146 2113 1944 2313 2338 2292 2774
Esso Nederland B.V. (Raffinaderij Rotterdam) CO2 2081 2312 2349 2200 2377 2288 2023 2236 2331 2496 2496
Koch Hc Partnership B.V. CO2 99 95 97 106 109 118 91 72 116 74 118
Gunvor Petroleum Rotterdam BV CO2 579 518 527 531 541 514 429 540 554 418 579
Shell Nederland Raffinaderij B.V. CO2 5547 5152 4463 4135 4113 4095 4335 4225 4255 4283 5547
Totaal CO2 CO2 10304 10208 9461 9746 9285 9128 8821 9386 9594 9563 10304
Refineries
All data comes from: http://www.dcmr.nl/binaries/content/assets/bestanden/over-de-dcmr/publicaties/inventarisatie_en_vergelijking_jaaremissies_rijnmond_2007-2016.pdf
Report from DCMR from september 2017, emissions to air from large businesses
Overview emissions per category
Energy and Utilities
Chemistry