Embed Size (px)
Citation preview

Reach our students with exceptional teaching and caring support,
Challenge them to achieve their potential, and
Prepare them for success in a global society.
Progress Report #28 – Volume IMaryland’s Reform Plan
Bridge to Excellence in Public Schools
2016 Master Plan Annual UpdateNovember 18, 2016
Frederick county Public SchoolS
Frederick County Public Schools
Maryland’s Reform Plan Bridge to Excellence in Public Schools
2016 Annual Update
November 2016
Submitted to:
Maryland State Department of Education Division of Student, Family, and School Support
Division of Academic Policy and Innovation Office of Finance
Submitted by:
Dr. Theresa Alban, Superintendent

TABLE OF CONTENTS
Frederick County Public Schools—2016 Bridge to Excellence Master Plan Maryland’s Bridge to Excellence Master Plan ............................................................................. 1
Introduction ........................................................................................................................... 1
Submission Cover Page: 2016 Master Plan Annual Update ........................................................ 2
Board of Education of Frederick County ...................................................................................... 3
2016 BTE Master Plan Local Planning Team .............................................................................. 4
Executive Summary .................................................................................................................... 5
Introduction ........................................................................................................................... 5
About Frederick County Public Schools ................................................................................. 5
Progress Summary ............................................................................................................... 6 (Clarifying Responses to Master Plan Review Included in Section)
FCPS Strategic Plan and Measurable Goals .......................................................................10
Continuous Strategic Improvement ..................................................................................... 12
Budget Narrative ................................................................................................................. 15 (Clarifying Responses to Master Plan Review Included in Section) Master Plan Reporting ......................................................................................................... 16
Finance Section ........................................................................................................................ 17
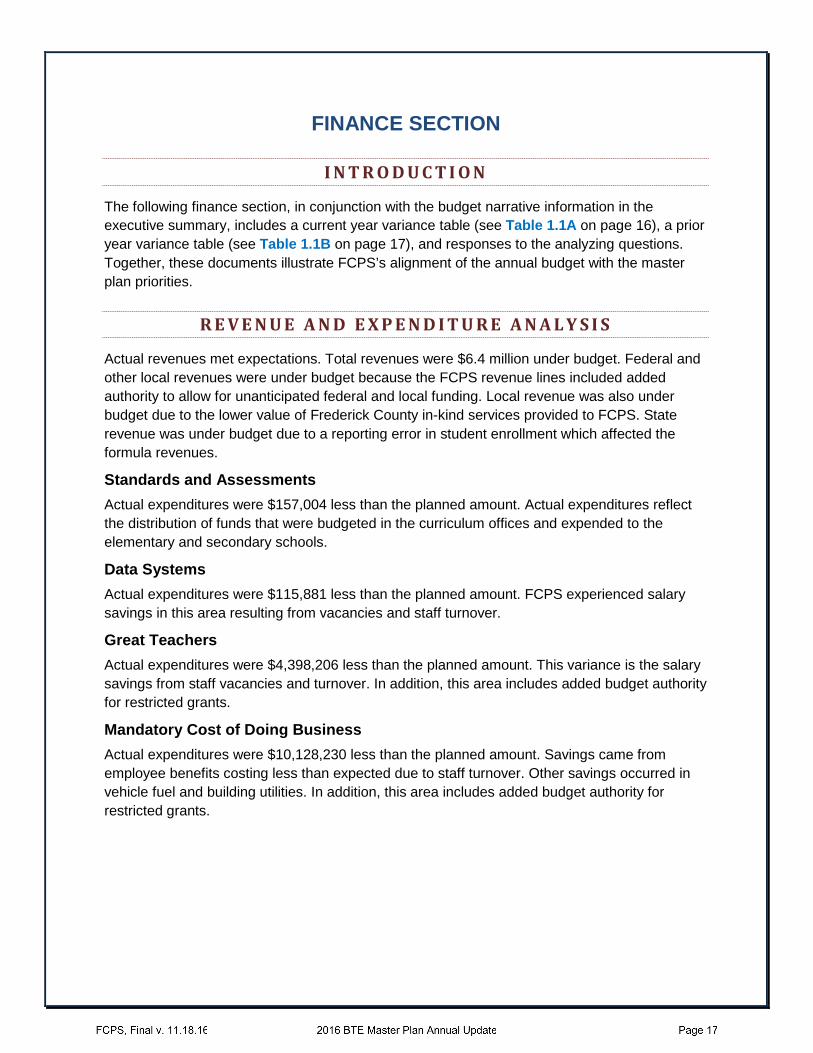
Introduction ......................................................................................................................... 17
Revenue and Expenditure Analysis ..................................................................................... 17
Data Tables 1.1A-2.23 .............................................................................................................. 18
Maryland’s Goals, Objectives, and Strategies ........................................................................... 35
Preface................................................................................................................................ 35
Introduction ......................................................................................................................... 35
Special Education ............................................................................................................... 36
Limited English Proficiency.................................................................................................. 40
Monitoring/Measuring Progress ...........................................................................................44 (Clarifying Responses to Master Plan Review Included in Section) PARCC English Language Arts Literacy, Grades 3-5 .......................................................... 45
PARCC English Language Arts Literacy, Grades 6-8 .......................................................... 52
PARCC English, Grade 10 .................................................................................................. 58
PARCC English, Grade 11 .................................................................................................. 61
PARCC Mathematics, Grades 3-5 ....................................................................................... 61
PARCC Mathematics, Grades 6-8 ....................................................................................... 68
PARCC Algebra I ................................................................................................................ 72

PARCC Algebra II ............................................................................................................... 76 (Clarifying Responses to Master Plan Review Included in Section)
PARCC Geometry ............................................................................................................... 80
MSA Science, Grade 5 ........................................................................................................ 80
MSA Science, Grade 8 ........................................................................................................ 83 (Clarifying Responses to Master Plan Review Included in Section)
HSA Biology ........................................................................................................................ 86
HSA Government ................................................................................................................ 89
Multi-State Alternate Assessment ........................................................................................ 95
2016 Bridge to Excellence Master Plan Assessment Requirements ..........................................96
Appendix A: House Bills 999 and 412 ..................................................................................... 106
House Bill 999 ................................................................................................................... 106
House Bill 412 and Section 7.203.3 ................................................................................... 107
Figures and TablesFigure 1: Aspirational goals and priorities for Frederick County Public Schools ...................... 11
Figure 2: Key focus areas for the long-term professional learning plan for Frederick County Public Schools ......................................................................................................... 12
Figure 3: Key focus areas for equity work for Frederick County Public Schools ...................... 13
Figure 4: FCPS’s System Accountability & School Improvement department logo .................. 13
Figure 5: FCPS’s Accelerating Achievement & Equity department logo .................................. 14
Table A: PARCC English Performance Band 3-5, 2016 Results—State vs FCPS .................... 7
Table B: PARCC Math Performance Band 3-5, 2016 Results—State vs FCPS ....................... 7
Table C: PARCC English Language Arts Performance Band 3-5, 2015 and 2016 Results ....... 8
Table D: PARCC Math Performance Band 3-5, 2015 and 2016 Results .................................. 8
Table E: Achievement Gaps—Identified Student Group Compared to All Students, Based on 2015 and 2016 PARCC Results, Performance Band 3-5 .........................................10
Table F: Three-Year ELL Achievement Plan and Resource Allocations ................................. 42
Table G: ELL Students—MSDE Criteria and Targets for AMAO 1 .......................................... 43
Table H: ELL Students—MSDE Criteria and Targets for AMAO 2 .......................................... 44
Table I: ELL Students—Progress on Reading and Math AMO Targets ................................. 44
Table J: Elementary Math—Curricular Work Teams .............................................................. 66
Table K: Elementary Math—Additional Strategies and Resources ......................................... 67
Table L: Elementary Math—Resource Allocations ................................................................. 67
Table M: 2016 Multi-State Alternate Assessment Results ...................................................... 95

Table N: Frederick County Public School Assessment Requirements .................................... 96
Table 1.1A: Current Year Variance Table .................................................................................. 18
Table 1.1B: Prior Year Variance Table ...................................................................................... 19
Table 2.1a: PARCC Assessment Performance Results—English Language Arts/Literacy for Grades 3-5 (All Students) ....................................................................................... 20
Table 2.1b: PARCC Assessment Performance Results—English Language Arts/Literacy for Grades 3-5 (Male Students) ................................................................................... 20
Table 2.1c: PARCC Assessment Performance Results—English Language Arts/Literacy for Grades 3-5 (Female Students) ............................................................................... 20
Table 2.2a: PARCC Assessment Performance Results—English Language Arts/Literacy for Grades 6-8 (All Students) ....................................................................................... 21
Table 2.2b: PARCC Assessment Performance Results—English Language Arts/Literacy for Grades 6-8 (Male Students) ................................................................................... 21
Table 2.2c: PARCC Assessment Performance Results—English Language Arts/Literacy for Grades 6-8 (Female Students) ............................................................................... 21
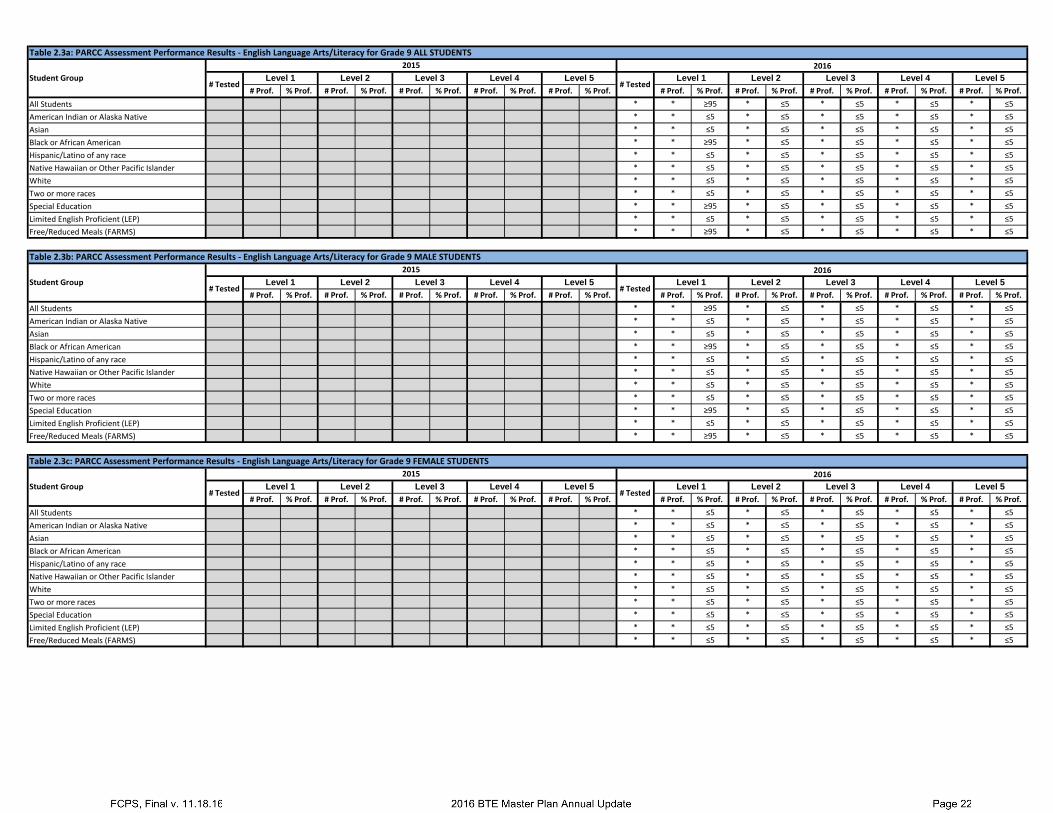
Table 2.3a: PARCC Assessment Performance Results—English Language Arts/Literacy for Grade 9 (All Students) Not Applicable to FCPS ...................................................... 22
Table 2.3b: PARCC Assessment Performance Results—English Language Arts/Literacy for Grade 9 (Male Students) Not Applicable to FCPS .................................................. 22
Table 2.3c: PARCC Assessment Performance Results—English Language Arts/Literacy for Grade 9 (Female Students) Not Applicable to FCPS .............................................. 22
Table 2.4a: PARCC Assessment Performance Results—English Language Arts/Literacy for Grade 10 (All Students) .......................................................................................... 23
Table 2.4b: PARCC Assessment Performance Results—English Language Arts/Literacy for Grade 10 (Male Students) ...................................................................................... 23
Table 2.4c: PARCC Assessment Performance Results—English Language Arts/Literacy for Grade 10 (Female Students) .................................................................................. 23
Table 2.5a: PARCC Assessment Performance Results—English Language Arts/Literacy for Grade 11 (All Students) .......................................................................................... 24
Table 2.5b: PARCC Assessment Performance Results—English Language Arts/Literacy for Grade 11 (Male Students) ......................................................................................24
Table 2.5c: PARCC Assessment Performance Results—English Language Arts/Literacy for Grade 11 (Female Students) .................................................................................. 24
Table 2.6a: PARCC Assessment Performance Results—Mathematics for Grades 3-5 (All Students).......................................................................................................... 25
Table 2.6b: PARCC Assessment Performance Results—Mathematics for Grades 3-5 (Male Students) ...................................................................................................... 25
Table 2.6c: PARCC Assessment Performance Results—Mathematics for Grades 3-5 (Female Students) .................................................................................................. 25

Table 2.7a: PARCC Assessment Performance Results—Mathematics for Grades 6-8 (All Students).......................................................................................................... 26
Table 2.7b: PARCC Assessment Performance Results—Mathematics for Grades 6-8 (Male Students) ...................................................................................................... 26
Table 2.7c: PARCC Assessment Performance Results—Mathematics for Grades 6-8 (Female Students) .................................................................................................. 26
Table 2.8a: PARCC Assessment Performance Results—Algebra I (All Students) ..................... 27
Table 2.8b: PARCC Assessment Performance Results—Algebra I (Male Students) ................. 27
Table 2.8c: PARCC Assessment Performance Results—Algebra I (Female Students) ............. 27
Table 2.9a: PARCC Assessment Performance Results—Algebra II (All Students) ....................28
Table 2.9b: PARCC Assessment Performance Results—Algebra II (Male Students) ................ 28
Table 2.9c: PARCC Assessment Performance Results—Algebra II (Female Students) ............ 28
Table 2.10a: PARCC Assessment Performance Results—Geometry (All Students) ................. 29
Table 2.10b: PARCC Assessment Performance Results—Geometry (Male Students) .............. 29
Table 2.10c: PARCC Assessment Performance Results—Geometry (Female Students) .......... 29
Table 2.11: Maryland School Assessment Performance Results—Science for Grade 5 ............ 30
Table 2.12: Maryland School Assessment Performance Results—Science for Grade 8 ............ 30
Table 2.13: Alternate Maryland School Assessment Performance Results— Science for Grade 5 ...............................................................................................31
Table 2.14: Alternate Maryland School Assessment Performance Results— Science for Grade 8 ............................................................................................... 31
Table 2.15: Alternate Maryland School Assessment Performance Results— Science for Grade 10 ............................................................................................. 31
Table 2.16: Maryland High School Assessment Performance Results—Biology (All Administrations) ............................................................................................... 32
Table 2.17: Maryland High School Assessment Performance Results—Government (All Administrations) ............................................................................................... 32
Table 2.18: Multi-State Alternate Assessment—English Language Arts/Literacy for Grades 3-5 ........................................................................................................ 33
Table 2.19: Multi-State Alternate Assessment—English Language Arts/Literacy for Grades 6-8 ........................................................................................................ 33
Table 2.20: Multi-State Alternate Assessment—English Language Arts/Literacy for Grade 11 ........................................................................................................... 33
Table 2.21: Multi-State Alternate Assessment—Mathematics for Grades 3-5 ........................... 34
Table 2.22: Multi-State Alternate Assessment—Mathematics for Grades 6-8 ........................... 34
Table 2.23: Multi-State Alternate Assessment—Mathematics for Grade 11 .............................. 34

Maryland’s Bridge to Excellence Master Plan
I NT RODUCTI ON Authorization The 2016 Bridge to Excellence (BTE) Master Plan Annual Update is authorized by the following:
• Section 5-401, Comprehensive Master Plans, Education Article of the Annotated Code ofMaryland;
• Public Law 111-5, American Recovery and Reinvestment Act of 2009;
• 2016 Maryland General Assembly Legislation House Bill 999, Commission on Innovationand Excellence in Education, Chapter 702;
• 2016 Maryland General Assembly Legislation House Bill 412, Assessment Administrationand Provision of Information, Chapter 264; and
• Section 7-203.3, Education Article of the Annotated Code of Maryland, as enacted bySenate Bill 533/House Bill 412 of the General Assembly of 2016.
Background In 2002, the Maryland General Assembly enacted the Bridge to Excellence in Public Schools Act. This legislation provides a powerful framework for all 24 local education agencies (LEAs) to increase student achievement for all students and to close the achievement gap. The BTE legislation significantly increased state aid to public education and required each LEA to develop a comprehensive master plan, to be updated annually. Each LEA is required to develop and implement a comprehensive master plan that describes the goals, objectives, and strategies that will be used to improve student achievement in each segment of the student population. Additionally, each annual update will include detailed summaries of the alignment between the LEA’s current year approved budget, prior year actual budget, and the master plan goals and objectives.
In 2016, the Maryland General Assembly passed House Bill 999, the Commission on Innovation and Excellence in Education, and House Bill 412, Assessment Administration and Provision of Information. House Bill 999 outlines the reporting structure of the 2016 and 2017 master plan annual updates, which limits specified requirements to be reported in the master plan for these two years. House Bill 412 outlines assessment reporting details specified in the new Education Article Section 7-203.3 for each assessment administered in each LEA, and the information that shall be provided for each administrated assessment.
Additional details on House Bill 999, House Bill 412 and Section 7-203.3 revisions that must be included in the 2016 and 2017 master plan annual updates are provided in Appendix A.


BOARD OF EDUCATION
Frederick County Public Schools
Brad W. Young, President
Liz Barrett, Vice President
Zakir Bengali
Colleen Cusimano
Kathryn B. Groth
April Fleming Miller
Joy Schaefer
Carter Gipson, Student Member
Superintendent of Schools
Theresa Alban
191 South East Street ● Frederick, Maryland 21701

2016 BTE Master Plan Local Planning Team
Name FCPS Department and Title
Michael Markoe Deputy Superintendent
System Accountability and School Improvement (SASI) Department
Jamie Aliveto Director of SASI
Natalie Gay Coordinator of Data Analysis and Research
Deborah Gilmartin Supervisor of State Assessment and Accountability
Eric Rhodes Coordinator for Local Assessment and Intervention
Fiscal Services Department
Leslie Pellegrino Chief Financial Officer of Fiscal Services
Robert Reilly Director of Budget and Finance
Curriculum, Instruction, and Innovation (CII) Department
Kevin Cuppett Executive Director of CII
Colleen Beall Secondary Curriculum Specialist for Science
Colleen Bernard Secondary Curriculum Specialist for Social Studies
Peter Cincotta Secondary Curriculum Specialist for Mathematics
Chris Horne Elementary Curriculum Specialist for Science
Karen McGaha Elementary Curriculum Specialist for Language Arts/English
Debra Myers Elementary Curriculum Specialist for Mathematics
Sue Ann Nogle Secondary Curriculum Specialist for Language Arts/English
Accelerating Achievement and Equity (AAE) Department
Keith Harris Executive Director of AAE
Michelle Concepcion Director of Special Education Instruction and Student Performance
Margaret Lee Supervisor of Advanced Academics
Daniel Martz Director of Special Education Compliance and Student Support
Eric Phillips Supervisor of Cultural Proficiency
Larry Steinly Supervisor of English Language Learning (ELL)

EXECUTIVE SUMMARY
I N T R O D U C T I O N
Since 2002, when the Maryland General Assembly enacted the Bridge to Excellence (BTE) in Public Schools Act, school systems have been required to develop a comprehensive master plan, to be updated annually. Local education agencies (LEAs) have consistently described goals, objectives, and strategies that are used to improve student achievement for all students and to close the achievement gap.
For the 2016 and next year’s 2017 annual update, the format of the master plan has been modified. House Bill 999, the Commission on Innovation and Excellence in Education, and House Bill 412, Assessment Administration and Provision of Information, are guiding the modifications and requirements. A significant focus of the plan pertains to goals and strategies relating to the performance of students receiving special education services and students with limited English proficiency (i.e., English language learners). School systems must address students failing to make progress towards meeting state performance standards. Budgetary influence as tied to the goals continues to be a critical focus in the plan. Finally, school systems must detail all assessments mandated by local, state, and/or federal authority.
ABOUT FREDE RI CK C OU NTY P UBLIC SC HOOLS
• Over 40,000 students were enrolled in Frederick County Public Schools (FCPS) during the 2015-2016 school year. The racial/ethnic composition of the student body is: 63.5% white; 14.3% Hispanic/Latino; 11.4% black/African American; 5.2% Asian; 4.9% two or more races; 0.5% American Indian/Alaskan Native; and 0.2% Native Hawaiian/Other Pacific Islander.
• FCPS serves students with varying needs, including 4,065 students with disabilities (10%), 2,159 English language learners (ELL) (5.3%), and more than 10,000 receiving free and/or reduced meals (FARM) (26.9%).
• Frederick County is home to 67 schools, including 37 elementary schools, 13 middle schools, 10 high schools, three public charter schools, an alternative school, a special education school, the FCPS County Virtual School, and the Career and Technology Center (CTE). Plans are underway to add two more elementary schools in the next three years.
• FCPS balances top-rate academics with the personal caring and individual attention that would be expected in a small town community. FCPS understands that the children it

educates today will be the adults caring for the community's health, homes, businesses, and neighborhoods tomorrow. Frederick County's investment in public education is an investment in its future. The FCPS operating budget for Fiscal Year (FY) 2017 is $555,825,9711 and nearly 47% of its funding comes from its local county government.
• Of 5,690 employees (full-time equivalent), approximately 2,900 are teachers, 148 are principals and assistant principals, 140 are counselors or psychologists, and 900 are instructional assistants. The remainder are bus drivers, food service workers, custodians, office staff, and other central office support and administrative staff.
P ROG RES S S UMM ARY
FCPS is an outstanding school system in the State of Maryland, and nationally:
• FCPS students consistently outpace their state and national peers in academic achievement measures, such as the SAT and ACT college-entrance exams.
• FCPS students at all grade levels outscored their state peers on both administrations of the Partnership for Assessment of Readiness for College and Careers (PARCC) exams.
• Indeed, all Frederick County high schools rank in the nation’s top 10% for encouraging students to take challenging Advanced Placement (AP) or International Baccalaureate (IB) tests, according to The Washington Post's 2016 Challenge Index.
• Students in FCPS’s Class of 2016 received $44.6 million in scholarship offers. (Not all were accepted, as some students received more than one offer.)
• FCPS’s graduation rate is at a high of 93.5%, while the dropout rate is 3.5% (i.e., Maryland's second lowest dropout rate).
• Critically, 99% of more than 1,000 employers surveyed indicated that FCPS students met or exceeded workplace readiness standards.
• Central leaders, school-based administrators and staff, and students alike routinely garner national, state, and local recognition and awards.
FCPS demonstrates excellence as it reaches, challenges, and prepares each student based on multiple measures. The master plan primarily focuses on one measure, state assessments. The plan highlights FCPS’s strengths but also the persistent challenges that it meets with critical reflection and courage.
1 Includes state contribution to teacher pension fund.

As shown in Tables A and B, FCPS consistently performs well above the state in English language arts (ELA) and math. Not only does FCPS outperform the state, consistent positive trends are evident from the 2015 to 2016 PARCC administration in all but two assessed grades and content areas (see Tables C and D).
Table A. PARCC English Performance Band 3-5 2016 RESULTS—STATE VS FCPS
Table B. PARCC Math Performance Band 3-5 2016 RESULTS—STATE VS FCPS
PARCC Assessment
Performance Band Level 3-5 (% of Test Takers) PARCC
Assessment
Performance Band Level 3-5 (% of Test Takers)
State FCPS State FCPS
Gra
des
3-8
ELA 3 59.4 72.0
Gra
des
3-8
Math 3 67.2 78.2
ELA 4 66.7 78.8 Math 4 61.9 77.8
ELA 5 65.9 77.9 Math 5 63.0 77.3
ELA 6 66.3 73.8 Math 6 59.5 75.7
ELA 7 64.6 73.2 Math 7 56.7 74.2
ELA 8 63.1 71.8 Math 8 43.4 62.8
Hig
h
Scho
ol
ELA 10 63.6 73.8
Hig
h
Scho
ol
Algebra I 59.9 76.5
ELA 11* -- 65.3 Algebra II* -- 69.2
* Not every grade 11 student took PARCC ELA 11. * Not every student took PARCC Algebra II.
Table Key:
<10% above state >10-14.9% above state >15% above state

Table C. PARCC English Language Arts Performance Band 3-5 2015 AND 2016 RESULTS
Table D. PARCC Math Performance Band 3-5 2015 AND 2016 RESULTS
PARCC Assessment
Performance Band Level 3-5 (% of Test Takers) PARCC
Assessment
Performance Band Level 3-5 (% of Test Takers)
2015 2016 2015 2016
Gra
des
3-8
ELA 3 76.7 72.0
Gra
des
3-8
Math 3 77.1 78.2
ELA 4 77.3 78.8 Math 4 73.0 77.8
ELA 5 77.6 77.9 Math 5 75.0 77.3
ELA 6 79.3 73.8 Math 6 72.7 75.7
ELA 7 67.7 73.2 Math 7 71.3 74.2
ELA 8 68.9 71.8 Math 8 59.0 62.8
Hig
h
Scho
ol
ELA 10 69.6 73.8
Hig
h
Scho
ol
Algebra I 71.7 76.5
ELA 11* -- 65.3 Algebra II* 59.3 69.2
* Not every grade 11 student took PARCC ELA 11. * Not every student took PARCC Algebra II.
Table Key:
Decrease in percent
< 5% increase ≥ 5% increase

Data reveal a prevalence of positive performance trends among many FCPS student groups. However, in some cases, pervasive achievement gaps continue to exist. Table E displays the most significant and consistent gaps that are evident.
Special Education Students As shown in Table E, significant achievement gaps are evident among students with disabilities in elementary and secondary ELA and math. FCPS aims to ensure that students with disabilities experience the same level of academic success as their general education peers. Of significant importance, FCPS restructured its special education department to coordinate efforts and support systemic instructional programming for students. Other strategies to support academic success among students with disabilities include providing access to general education in the least restrictive environment, collaborating with general educators, conducting ongoing data analysis and progress monitoring, providing access to any and all interventions and/or enrichments, providing additional staffing (behavioral support), and providing ongoing professional learning (e.g., cultural proficiency, framework for teaching). These strategies will take place in the 2016-2017 school year. Additional details on these strategies, including resources allocations, are provided in later sections of this report (see Special Education section).
English Language Learners While FCPS ELL students have exceeded the state’s targets for progressing toward English proficiency (see Tables G and H), challenges still remain as evident by 2015 and 2016 PARCC results. Significant achievement gaps among ELL students remain despite a gap decrease in elementary ELA and math (see Table E). Achievement gaps increased among ELL students in middle and high school ELA and math. FCPS aims to promote successful integration into mainstream academic programs for prekindergarten to grade 12 students whose primary language is not English and/or have limited English language proficiency. In addition to restructuring the ELL office under the new AAE department, FCPS developed a three-year ELL achievement plan. This plan will focus on ELL/administrative staff support, technology, instructional model, college and career readiness, community outreach and parental engagement, and professional learning (e.g., cultural proficiency, framework for teaching), including sheltered instruction observation protocol (SIOP). Specifics, including resource allocations, are provided in the Limited English Proficiency section.
Students Failing to Meet/Make Progress Towards Meeting State Performance Standards Black/African American, Hispanic/Latino, and students receiving free/reduced meals are also groups of students that are not meeting standards when compared to the population as a whole. As shown in Table E, gaps are evident in ELA and math for the past two PARCC administrations. FCPS aims to raise achievement for all students and eliminate achievement gaps. FCPS is actively implementing multiple strategies to address these achievement gaps. Discussed in the proceeding sections, system-wide strategies, such as, focusing on cultural proficiency and framework for teaching, are being implemented as part of FCPS’s continuous strategic improvement efforts. Additional strategies (and related resource allocations) specific to each assessed content area are described in the reporting of each content area.

Table E. Achievement Gaps—Identified Student Groups Compared to All Students BASED ON 2015 AND 2016 PARCC RESULTS, PERFORMANCE BAND 3-5
Assessed Content
Area
Black/ African
American Hispanic/
Latino ELL Free/Reduced Meals
Special Education
2015 2016 2015 2016 2015 2016 2015 2016 2015 2016
Elementary ELA 11.4 11.5 18.2 14.8 56.8 51.1 19.6 18.4 52.1 49.2
Elementary Math 16.8 11.6 15.2 13.8 43.6 39.3 18.8 17.7 44.0 41.9
Middle ELA 17.1 15.5 12.1 14.1 62.6 64.9 20.7 21.7 52.6 51.8
Middle Math 20.6 17.3 14.8 14.1 58.5 58.4 20.8 22.8 47.3 50.7
High ELA (English 10) 25.8 23.8 10.7 12.4 49.1 60.0 23.4 19.4 43.7 44.5
High Math (Algebra 1) 19.8 17.8 13.2 17.3 38.9 43.7 18.0 23.3 39.6 36.3
FCPS has been aware of and monitoring achievement data throughout the transition of curriculum, instruction, and assessment. The FCPS local assessment framework has played a critical role in the system’s ability to monitor performance in a time of transition. Accelerating achievement and ensuring equity for all students has been at the forefront of the work as FCPS has created a new strategic plan. The following two sections present a high-level overview of the FCPS strategic plan, as well as, core frameworks and actions to align the work across central departments and ultimately improve schools for students.
FCP S ST RATEGIC PLAN AND MEASU RABLE G OALS While FCPS is excited to celebrate its accomplishments, stakeholders also recognize persistent gaps in achievement for some student groups and embrace a mindset of continual improvement. After working with a consulting firm specializing in strategic planning, FCPS has completed its first year of work with new aspirations, priorities, and measurable goals. Figure 1 on page 10 provides an illustration of the framework currently guiding the work within FCPS.

Figure 1. Aspirational goals and priorities for Frederick County Public Schools.

Along with the aspirational goals and priorities, FCPS is reporting regular progress on its 30 measurable goals that focus on both quantitative and qualitative outcomes, including a majority of goals focusing on stakeholder perception. The 2016 Master Plan Annual Update will contain important progress updates. However, FCPS values a multiple measures approach to the continuous strategic improvement (CSI) process. Therefore, strategic plan goal reporting provided to the Board of Education (BOE) of Frederick County will serve as the most comprehensive and current review of system progress.
C ONTI NU OU S ST RATEG IC I MPROVEME NT FCPS’s Division of Academics, Communication, Technology, and Student Achievement (ACTS) has recognized that the CSI process must be focused and research-based. Central leaders have established a multi-year plan to focus professional learning across the school system for central leadership, school-based leadership, and eventually teachers. There have been significant efforts across the system to collaborate and coordinate such that any and all professional learning is connected and meaningful. Figure 2 illustrates the three areas which will be a central focus of the long-term professional learning plan.
Evident in the sections of the master plan that follow, FCPS staff reference detailed plans to support struggling learners and special populations of students. In addition to these actions, FCPS staff will delve extensively into the Framework for Teaching (Charlotte Danielson, 2013) and the concept of cultural proficiency. Much research points to the critical role of the teacher in increasing student achievement. FCPS will be working with the company Frontline (costs: $39,999) to refine the observation and evaluation skills of all FCPS leaders. By deeply understanding the attributes of a proficient and a distinguished teacher, FCPS leaders will provide more meaningful feedback to improve the quality of teaching in every classroom across
Figure 2. Key focus areas for the long-term professional learning plan for Frederick County Public Schools.
Closing the Achievement Gap:
Accelerating Achievement and Ensuring Equity
Framework for Teaching
Cultural Proficiency with a Growth Mindset
Supports for Struggling Learners (Special
Populations)
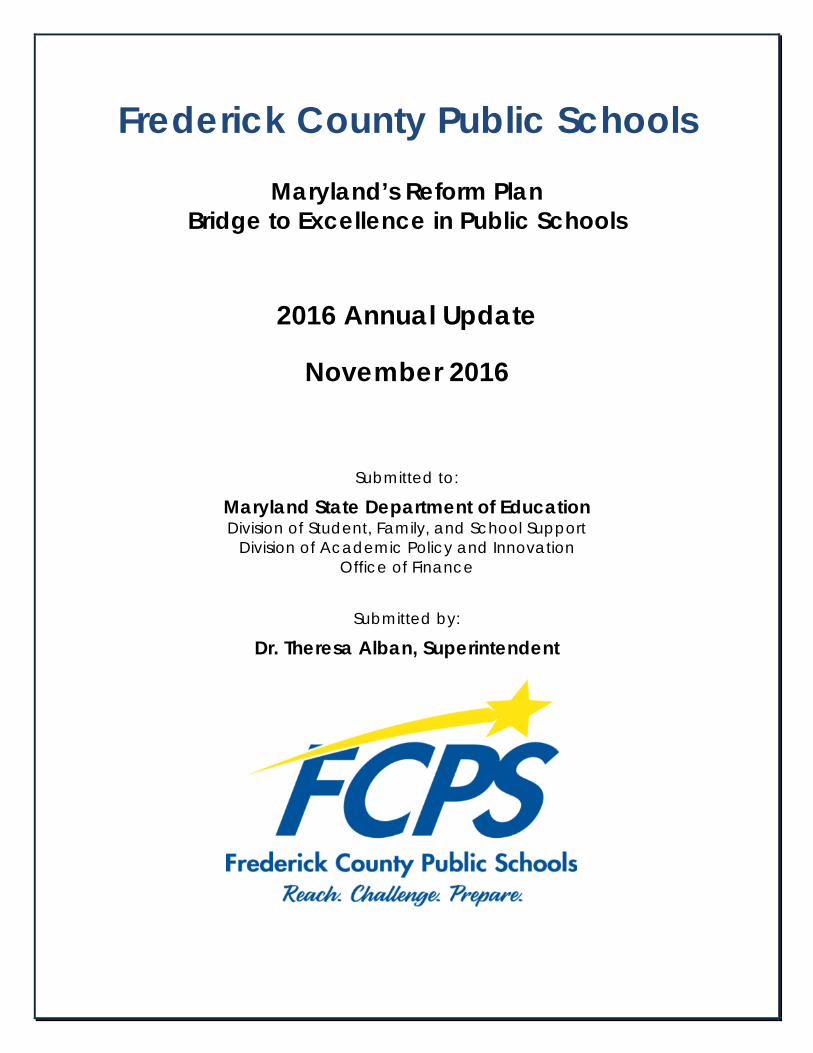
the system. Related to this area of study, each FCPS leader will be experiencing a journey in cultural proficiency. Using a long-range professional learning plan, leaders will explore “The Dimensions of Diversity” wheel from Gardenswartz and Rowe (1991), along with the “Cultural Proficiency Continuum” from Lindsey, Roberts, Campbell, and Jones (2013). Most “distinguished” ratings in the 2013 Framework for Teaching require extensive understanding and consideration of incorporating individual student voice and needs into teaching and learning. Thus, the study of cultural proficiency is a perfect complement to the Framework for Teaching in FCPS’s work to eliminate achievement gaps. Training in each of these areas will also be provided for teachers, once system leaders are appropriately trained.
While Figure 2 illustrates the “what” of the system’s work, it is important to also recognize the “how.” The ACTS division has identified four critical puzzle pieces to ensuring achievement of FCPS’s equity work (see Figure 3).
Leaders will focus on courage, conversation, capacity building, and coaching (the 4C’s) as they lead school improvement initiatives in their building. To support conversation, capacity building, and coaching at the system level, there has been a critical alignment of human and financial resources to support the achievement of FCPS goals.
System Accountability and School Improvement. In the 2015-2016 school year, a new department—System Accountability and School Improvement (SASI)—was created. SASI staff members have focused time on capacity building and assisting system leaders and schools with general data literacy. A new data access tool, Resource for Accountability, Data Analysis, and
Reporting (RADAR), was developed to support system and school staff in regularly reviewing student, school, and system level data to monitor progress and to respond to results.
System data reviews across departments have allowed for critical collaboration and coordination of resources at the central level with curriculum resources being adapted based on identified needs. Accelerated learning processes at the school level have assisted teams of teachers in clarifying what students need to know and be able to do and in evaluating their instruction towards students meeting identified standards.
Figure 3. Key focus areas for equity work for Frederick County Public Schools.
Conversation
Figure 4. FCPS’s System Accountability & School
Improvement department logo.

Finally, the ACTS division has identified critical system targets that each school uses to focus their improvement efforts. These targets align to the measurable goals in the FCPS Strategic Plan. Schools set goals and monitor progress using multiple measures, including state and local assessments, attendance data, suspension data, data on access to advanced coursework, teacher evaluation data, and stakeholder perceptual data. A focus on disproportionality and closing gaps in achievement are inherent in the targets. Schools are required to select high-yield strategies to achieve their school-specific goals. FCPS will achieve the goals in its strategic plan with each school focusing on their own CSI efforts. In addition, FCPS central staff will support the work in schools with pertinent trainings to support and reach its struggling students.
Accelerating Achievement and Equity Department. Also in the 2015-2016 school year, the Accelerating Achievement and Equity (AAE) department was formed. For the first time, FCPS has a group of leaders working together to eliminate achievement gaps for any underperforming
student group. Key staff members were brought together from the previous Special Education and Psychological Services, Minority Achievement, and Advanced Academics departments and the English Language Learning office. This has fostered collaboration and continuity in messaging, training, and support for schools across the ACTS division. Staff in the AAE department provide a critical equity lens to curriculum, instruction, assessment, professional learning, communications, and interpretation of results.
A strong alignment of staff and resources has only strengthened an already strong Response to Intervention (RTI) model implemented across each FCPS school. Strong partnerships among central staff
members [Curriculum, Instruction, and Innovation (CII), SASI, AAE, and the School Administration and Leadership (SAL) departments] will ensure the best curriculum, instruction, and assessment resources available in FCPS schools. With the formation of the AAE department, FCPS recognizes the need to improve instructional resources using the lens of special populations of students.
A tremendous amount of work has been performed by FCPS staff in relation to a new local assessment framework. In the second year of implementation, central office staff will continue to partner with FCPS classroom teachers to use feedback to continually improve the framework. The local assessment framework provides quality standard measures to: a) monitor student progress in FCPS curriculum; b) ensure high levels of achievement for all students; and c) identify areas of critical need across the system, at the school level, and/or for a particular group of students. In an attempt to provide a balanced and comprehensive assessment system, beyond the minimal required assessments needed at the system level, a suite of optional assessments is also available for a teacher to use as he or she deems appropriate. Of significant importance, ongoing monitoring of quality assessment items that provide useful
Figure 5. FCPS’s Accelerating Achievement & Equity
department logo.

feedback for students and demonstrate strong alignment to expectations on state assessments is occurring. This will ultimately ensure preparation of FCPS students for college and/or careers.
B U DGET NARRATI VE System Priorities The FCPS Strategic Plan served as the foundational document for developing its FY2017 budget as well as all of its planning efforts. The plan includes five aspirational goals and correlating priorities that reflect the core vision of FCPS schools and students (see Figure 1).
Fiscal Outlook Enrollment FCPS enrollment over the past several years has been relatively flat. There was a small decrease in enrollment last year. However, according to projections FCPS is entering a period of slow, steady growth, starting with the 2017 school year. FCPS must accommodate approximately 1,680 new students between 2016 and 2025 and additional capital funding will be required in these years considering the fact that currently many schools are at or near capacity. In addition to having to find funding for new facilities, since the majority of existing facilities are over 25 years old, ongoing maintenance in the operating budget will also be strained. Although both state and local formula funding are designed to address enrollment growth, the additional revenues often lag behind the need.
Unemployment Unemployment in Frederick County has decreased from a high of 6.8% in 2009 (at the height of the recession) to a current rate of 4%. This rate is below the state unemployment rate, and almost a full percentage point below the national rate for the same time period. This faster than average decline in unemployment is often attributed to the proximity of the county to both Baltimore, and Washington D.C., and consequently Frederick County’s per capita income remains in the top third of all Maryland counties.
Poverty The number of students who qualified for free/reduced-priced meals increased 1.5% from 10,801 students in October 2014 to 10,965 students in October 2015. As student enrollment was fairly flat during that same time period, the overall FARM percent of total enrollment increased from 26.52% to 26.92%. The FARM rate increase is attributable to local economic conditions as well as FCPS management’s efforts to improve communication and identification techniques for the program. The increase in FARM students allow FCPS to provide nutritious meals to its neediest students which ultimate leads to improved student performance.
Special Needs The number of students with disabilities increased from 4,326 students in October 2014 to 4,424 in October 2015, a 2.27% increase. The overall FY2017 Operating Budget included a $1,113,020 increase in the category of special education. This 1.9% increase over the prior year’s budget is reflective of the increasing demand for special education services.

English Language Learners The number of ELL students continues to increase as many new residents to Frederick County have limited English language skills. FCPS will serve over 2,500 ELL students speaking 64 different languages, while the majority are of Spanish origins. From 2011 to 2015, there is more than an 8% increase in ELL students who identified as Hispanic/Latino. The restructuring of the ELL office will continue to support the instructional programs for students.
The adopted FY2017 budget includes expenditures that the BOE of Frederick County believes are needed to continue to provide quality educational services to the students of FCPS in FY2017. It reflects feedback obtained from engaging individuals from all sectors with a stake in public education.
Despite receiving more than maintenance of effort (MOE) funding from Frederick County Government (i.e., $10.5 million more than MOE), the FY2017 budget was short of meeting the BOE of Frederick County request for funding. The state funding includes increases in the Geographic Cost of Education Index (GCEI) and Net Taxable Income (NTI) funding, which was slightly offset by the decreases in formula funding due to the decrease in enrollment. With the mandated increase in pension expenses and non-public placements, as well as a $2.9 million net increase in health and other insurances, the BOE of Frederick County was able to recognize savings in other areas to balance the budget. There was a large reduction in salary costs due to staff turnover and vacancies. In addition, there are savings in transportation fuel costs. By recognizing these savings, the BOE of Frederick County was able to direct resources toward goals in the strategic plan.
Climate Changes and Impact FCPS’s fiscal climate is expected to continue to improve in FY2017. The goals identified in the strategic plan will help to guide the allocation of scarce educational resources. FCPS’s strategic goals are aligned to master plan goals and objectives. Providing each and every student with high quality instruction, raising the achievement, and eliminating achievement gaps will remain a master plan priority for FCPS.
M ASTE R P LAN REPORTI NG In accordance with the master plan guidance document, the data provided throughout the FCPS 2016 Master Plan Annual Update will primarily speak to aspirational goals one and three (see Figure 1).
FINANCE SECTION
I N T R O D U C T I O N
The following finance section, in conjunction with the budget narrative information in the executive summary, includes a current year variance table (see Table 1.1A on page 16), a prior year variance table (see Table 1.1B on page 17), and responses to the analyzing questions. Together, these documents illustrate FCPS’s alignment of the annual budget with the master plan priorities.
R E V E N U E A N D E X P E N D I T U R E A N A L Y S I S
Actual revenues met expectations. Total revenues were $6.4 million under budget. Federal and other local revenues were under budget because the FCPS revenue lines included added authority to allow for unanticipated federal and local funding. Local revenue was also under budget due to the lower value of Frederick County in-kind services provided to FCPS. State revenue was under budget due to a reporting error in student enrollment which affected the formula revenues.
Standards and Assessments Actual expenditures were $157,004 less than the planned amount. Actual expenditures reflect the distribution of funds that were budgeted in the curriculum offices and expended to the elementary and secondary schools.
Data Systems
Actual expenditures were $115,881 less than the planned amount. FCPS experienced salary savings in this area resulting from vacancies and staff turnover.
Great Teachers Actual expenditures were $4,398,206 less than the planned amount. This variance is the salary savings from staff vacancies and turnover. In addition, this area includes added budget authority for restricted grants.
Mandatory Cost of Doing Business Actual expenditures were $10,128,230 less than the planned amount. Savings came from employee benefits costing less than expected due to staff turnover. Other savings occurred in vehicle fuel and building utilities. In addition, this area includes added budget authority for restricted grants.
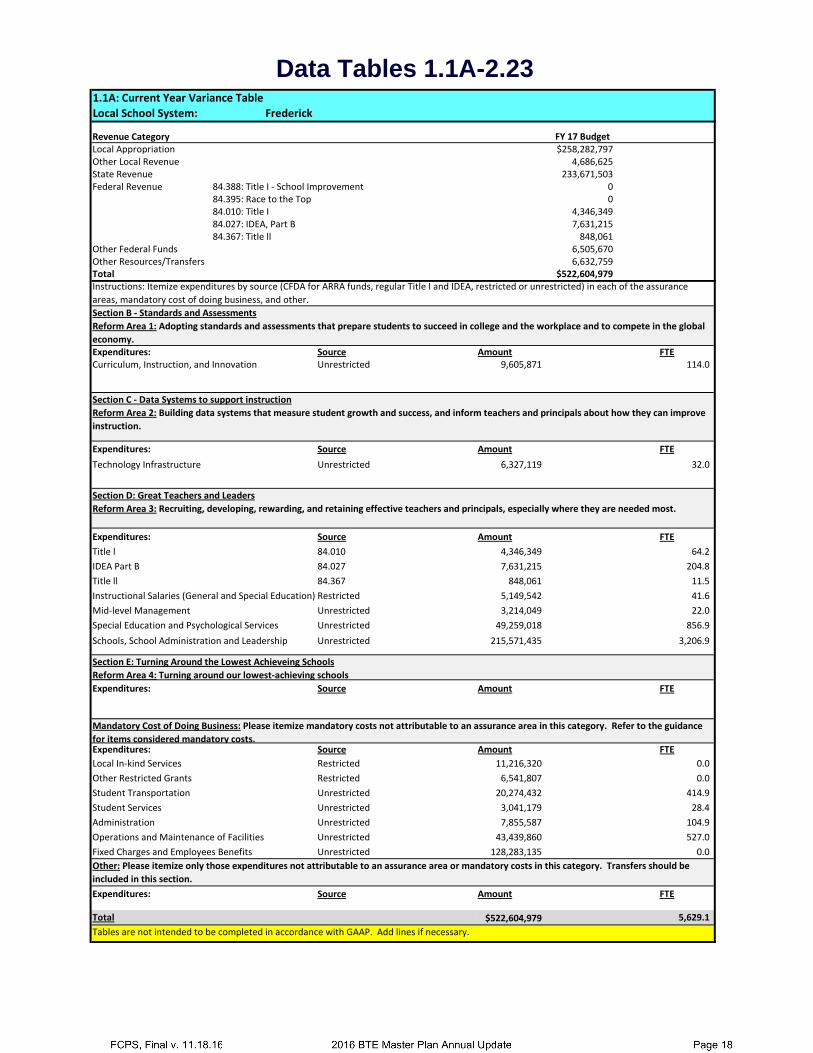
1.1A: Current Year Variance TableLocal School System: Frederick
Revenue CategoryLocal Appropriation $258,282,797Other Local Revenue 4,686,625State Revenue 233,671,503Federal Revenue 84.388: Title I - School Improvement 0
84.395: Race to the Top 084.010: Title I 4,346,34984.027: IDEA, Part B 7,631,21584.367: Title ll 848,061
Other Federal Funds 6,505,670Other Resources/Transfers 6,632,759Total $522,604,979
Expenditures: Source Amount FTECurriculum, Instruction, and Innovation Unrestricted 9,605,871 114.0
Expenditures: Source Amount FTETechnology Infrastructure Unrestricted 6,327,119 32.0
Expenditures: Source Amount FTETitle l 84.010 4,346,349 64.2IDEA Part B 84.027 7,631,215 204.8Title ll 84.367 848,061 11.5Instructional Salaries (General and Special Education) Restricted 5,149,542 41.6Mid-level Management Unrestricted 3,214,049 22.0Special Education and Psychological Services Unrestricted 49,259,018 856.9Schools, School Administration and Leadership Unrestricted 215,571,435 3,206.9
Expenditures: Source Amount FTE
Expenditures: Source Amount FTELocal In-kind Services Restricted 11,216,320 0.0Other Restricted Grants Restricted 6,541,807 0.0Student Transportation Unrestricted 20,274,432 414.9Student Services Unrestricted 3,041,179 28.4Administration Unrestricted 7,855,587 104.9Operations and Maintenance of Facilities Unrestricted 43,439,860 527.0Fixed Charges and Employees Benefits Unrestricted 128,283,135 0.0
Expenditures: Source Amount FTE
Total $522,604,979 5,629.1
Section B - Standards and AssessmentsReform Area 1: Adopting standards and assessments that prepare students to succeed in college and the workplace and to compete in the global economy.
FY 17 Budget
Instructions: Itemize expenditures by source (CFDA for ARRA funds, regular Title I and IDEA, restricted or unrestricted) in each of the assurance areas, mandatory cost of doing business, and other.
Tables are not intended to be completed in accordance with GAAP. Add lines if necessary.
Section C - Data Systems to support instructionReform Area 2: Building data systems that measure student growth and success, and inform teachers and principals about how they can improve instruction.
Section D: Great Teachers and LeadersReform Area 3: Recruiting, developing, rewarding, and retaining effective teachers and principals, especially where they are needed most.
Section E: Turning Around the Lowest Achieveing SchoolsReform Area 4: Turning around our lowest-achieving schools
Mandatory Cost of Doing Business: Please itemize mandatory costs not attributable to an assurance area in this category. Refer to the guidance for items considered mandatory costs.
Other: Please itemize only those expenditures not attributable to an assurance area or mandatory costs in this category. Transfers should be included in this section.
Data Tables 1.1A-2.23

1.1B Prior Year Variance Table (Comparison of Prior Year Expenditures)Local School System: Frederick
FY 2016Original Budget
FY 2016 Final Budget
Revenue 7/1/2015 6/30/2016 Change % ChangeLocal Appropriation 250,110,403.00 249,364,411.00 (745,992.00) -0.30%Other Local Revenue 4,886,625.00 3,712,444.00 (1,174,181.00) -24.03%State Revenue 231,744,865.00 230,470,783.00 (1,274,082.00) -0.55%Federal Revenue 84.010 Title I 4,130,926.00 4,178,002.00 47,076.00 1.14%Federal Revenue 84.027 IDEA, Part B 7,640,503.00 7,356,506.00 (283,997.00) -3.72%Other Federal Funds 7,559,866.00 4,483,140.00 (3,076,726.00) -40.70%Other Resources/Transfers 5,621,035.00 5,732,764.00 111,729.00 1.99%
Total 511,694,223.00 505,298,050.00 (6,396,173.00) -1.25%
Assurance Area SourceExpenditure Description
Planned Expenditure Actual Expenditure
Planned FTE Actual FTE
Standards and Assessments Unrestricted Curriculum, Instruction and Innova 4,310,493.00 1,738,230.00 115.7 104.0 Adjustment to Standards and AssessmenUnrestricted Curriculum, Instruction and Innova (2,415,259.00) Data Systems to support instruction Unrestricted Technology Services 3,960,496.00 5,066,923.00 30.0 32.0 Adjustment to Data Systems to support iUnrestricted Technology Services 1,222,308.00 Great Teachers and Leaders Unrestricted Instructional Supplies 9,209,190.00 8,416,073.00 - - Adjustment to Great Teachers and LeadeUnrestricted Instructional Supplies (743,195.00) Great Teachers and Leaders Unrestricted Instructional Salaries (Reg. & Spec 239,207,128.00 234,555,261.00 3,750.1 3,796.9 Adjustment to Great Teachers and LeadeUnrestricted Instructional Salaries (Reg. & Spec (1,412,326.00) (8.0) Great Teachers and Leaders Restricted Instructional Salaries (Reg. & Spec 4,057,328.00 3,625,212.00 49.8 27.0 Great Teachers and Leaders Restricted IDEA Part B 7,640,503.00 7,356,506.00 204.5 204.5 Great Teachers and Leaders Restricted Title 1 4,130,926.00 4,178,002.00 66.0 71.5 Great Teachers and Leaders Unrestricted Mid-level Administration 27,478,583.00 29,934,983.00 304.3 316.1 Adjustment to Great Teachers and LeadeUnrestricted Mid-level Administration 2,896,106.00 Mandatory Cost of Doing Business Restricted Local In-Kind Services 10,762,963.00 10,126,306.00 - - Mandatory Cost of Doing Business Restricted County Support for Pension Cost S 9,858,314.00 9,858,314.00 - - Mandatory Cost of Doing Business Restricted Other Restricted State & Fed. Fund 9,648,217.00 5,535,180.00 16.5 - Mandatory Cost of Doing Business Unrestricted Student Transportation Services 20,482,197.00 19,230,793.00 397.7 413.9 Mandatory Cost of Doing Business Unrestricted School Admin, Health & Student Se 8,421,892.00 9,816,031.00 89.9 115.2 Adjustment to Mandatory Cost of Doing Unrestricted School Admin, Health & Student Se 1,674,674.00 27.0 Mandatory Cost of Doing Business Unrestricted Operations and Maintenance of Fa 47,883,013.00 44,824,132.00 559.0 524.0 Adjustment to Mandatory Cost of Doing Unrestricted Operations and Maintenance of Fa (1,222,308.00) (19.0) Mandatory Cost of Doing Business Unrestricted Fixed Charges including Employee 104,642,980.00 102,632,956.00 - - Available for Future Budget Unrestricted - 8,403,148.00
511,694,223.00 505,298,050.00 5,583.37 5,605.08
Change in Expenditures - Instructions: Itemize FY 2016 actual expenditures and FTE by source (CFDA for ARRA funds, regular Title I and IDEA, restricted or unrestricted) in each of the assurance areas, mandatory cost of doing business, and other.

# Prof. % Prof. # Prof. % Prof. # Prof. % Prof. # Prof. % Prof. # Prof. % Prof. # Prof. % Prof. # Prof. % Prof. # Prof. % Prof. # Prof. % Prof. # Prof. % Prof.All Students 8937 665 7.4 1376 15.4 2264 25.3 4018 45.0 614 6.9 9301 800 8.6 1412 15.2 2382 25.6 4045 43.5 662 7.1American Indian or Alaska Native 31 * 9.7 * 12.9 11 35.5 13 41.9 * ≤5 26 * ≤5 * 19.2 11 42.3 * 30.8 * ≤5Asian 520 14 ≤5 38 7.3 100 19.2 298 57.3 70 13.5 528 * ≤5 53 10.0 94 17.8 270 51.1 98 18.6Black or African American 1002 138 13.8 205 20.5 317 31.6 322 32.1 * ≤5 1100 153 13.9 235 21.4 323 29.4 360 32.7 * ≤5Hispanic/Latino of any race 1214 172 14.2 326 26.9 303 25.0 390 32.1 * ≤5 1414 228 16.1 317 22.4 398 28.1 427 30.2 * ≤5Native Hawaiian or Other Pacific Islander 21 * 9.5 * 9.5 * 14.3 12 57.1 * 9.5 23 * 8.7 * ≤5 * 21.7 11 47.8 * 17.4White 5710 302 5.3 732 12.8 1422 24.9 2788 48.8 466 8.2 5743 351 6.1 738 12.9 1437 25.0 2770 48.2 447 7.8Two or more races 439 34 7.7 69 15.7 108 24.6 195 44.4 33 7.5 467 52 11.1 63 13.5 114 24.4 199 42.6 39 8.4Special Education 873 327 37.5 328 37.6 139 15.9 75 8.6 * ≤5 870 346 39.8 289 33.2 140 16.1 88 10.1 * ≤5Limited English Proficient (LEP) 368 137 37.2 156 42.4 47 12.8 27 7.3 * ≤5 418 160 38.3 153 36.6 81 19.4 24 5.7 * ≤5Free/Reduced Meals (FARMS) 2276 362 15.9 605 26.6 644 28.3 628 27.6 * ≤5 2739 470 17.2 685 25.0 785 28.7 743 27.1 * ≤5
# Prof. % Prof. # Prof. % Prof. # Prof. % Prof. # Prof. % Prof. # Prof. % Prof. # Prof. % Prof. # Prof. % Prof. # Prof. % Prof. # Prof. % Prof. # Prof. % Prof.All Students 4548 429 9.4 823 18.1 1222 26.9 1871 41.1 * ≤5 4746 532 11.2 807 17.0 1311 27.6 1878 39.6 218 ≤5American Indian or Alaska Native 15 * 6.7 * 13.3 * 40.0 * 40.0 * ≤5 * * ≤5 * 33.3 * 33.3 * 33.3 * ≤5Asian 249 * ≤5 21 8.4 53 21.3 140 56.2 25 10.0 269 * ≤5 29 10.8 53 19.7 150 55.8 28 10.4Black or African American 508 94 18.5 118 23.2 159 31.3 136 26.8 * ≤5 543 95 17.5 135 24.9 158 29.1 150 27.6 * ≤5Hispanic/Latino of any race 613 103 16.8 178 29.0 158 25.8 169 27.6 * ≤5 724 147 20.3 171 23.6 203 28.0 189 26.1 * ≤5Native Hawaiian or Other Pacific Islander * * 12.5 * 25.0 * 12.5 * 37.5 * 12.5 * * 11.1 * 11.1 * 22.2 * 22.2 * 33.3White 2936 200 6.8 462 15.7 783 26.7 1327 45.2 164 5.6 2963 249 8.4 440 14.8 825 27.8 1294 43.7 155 5.2Two or more races 219 20 9.1 40 18.3 62 28.3 90 41.1 * ≤5 229 31 13.5 28 12.2 67 29.3 90 39.3 13 5.7Special Education 586 224 38.2 218 37.2 92 15.7 51 8.7 * ≤5 607 249 41.0 188 31.0 102 16.8 65 10.7 * ≤5Limited English Proficient (LEP) 215 83 38.6 87 40.5 29 13.5 16 7.4 * ≤5 230 101 43.9 78 33.9 41 17.8 * ≤5 * ≤5Free/Reduced Meals (FARMS) 1142 225 19.7 341 29.9 305 26.7 258 22.6 13 ≤5 1393 310 22.3 370 26.6 385 27.6 314 22.5 * ≤5
# Prof. % Prof. # Prof. % Prof. # Prof. % Prof. # Prof. % Prof. # Prof. % Prof. # Prof. % Prof. # Prof. % Prof. # Prof. % Prof. # Prof. % Prof. # Prof. % Prof.All Students 4389 236 5.4 553 12.6 1042 23.7 2147 48.9 411 9.4 4555 268 5.9 605 13.3 1071 23.5 2167 47.6 444 9.7American Indian or Alaska Native 16 * 12.5 * 12.5 * 31.3 * 43.8 * ≤5 17 * 5.9 * 11.8 * 47.1 * 29.4 * 5.9Asian 271 * ≤5 17 6.3 47 17.3 158 58.3 45 16.6 259 * ≤5 24 9.3 41 15.8 120 46.3 70 27.0Black or African American 494 44 8.9 87 17.6 158 32.0 186 37.7 * ≤5 557 58 10.4 100 18.0 165 29.6 210 37.7 * ≤5Hispanic/Latino of any race 601 69 11.5 148 24.6 145 24.1 221 36.8 * ≤5 690 81 11.7 146 21.2 195 28.3 238 34.5 * ≤5Native Hawaiian or Other Pacific Islander 13 * 7.7 * ≤5 * 15.4 * 69.2 * 7.7 14 * 7.1 * ≤5 * 21.4 * 64.3 * 7.1White 2774 * ≤5 270 9.7 639 23.0 1461 52.7 302 10.9 2780 * ≤5 298 10.7 612 22.0 1476 53.1 292 10.5Two or more races 220 14 6.4 29 13.2 46 20.9 105 47.7 26 11.8 238 21 8.8 35 14.7 47 19.7 109 45.8 26 10.9Special Education 287 103 35.9 110 38.3 47 16.4 24 8.4 * ≤5 263 97 36.9 101 38.4 38 14.4 23 8.7 * ≤5Limited English Proficient (LEP) 153 54 35.3 69 45.1 18 11.8 11 7.2 * ≤5 188 59 31.4 75 39.9 40 21.3 14 7.4 * ≤5Free/Reduced Meals (FARMS) 1134 137 12.1 264 23.3 339 29.9 370 32.6 * ≤5 1346 160 11.9 315 23.4 400 29.7 429 31.9 * ≤5
Level 5
Table 2.1a: PARCC Assessment Performance Results - English Language Arts/Literacy for Grades 3-5 ALL STUDENTS
Student Group2015 2016
# TestedLevel 1 Level 2 Level 3 Level 4 Level 5
# TestedLevel 1 Level 2 Level 3 Level 4
Level 5
Table 2.1b: PARCC Assessment Performance Results - English Language Arts/Literacy for Grades 3-5 MALE STUDENTS
Student Group2015 2016
# TestedLevel 1 Level 2 Level 3 Level 4 Level 5
# TestedLevel 1 Level 2 Level 3 Level 4
Level 5
Table 2.1c: PARCC Assessment Performance Results - English Language Arts/Literacy for Grades 3-5 FEMALE STUDENTS
Student Group2015 2016
# TestedLevel 1 Level 2 Level 3 Level 4 Level 5
# TestedLevel 1 Level 2 Level 3 Level 4

# Prof. % Prof. # Prof. % Prof. # Prof. % Prof. # Prof. % Prof. # Prof. % Prof. # Prof. % Prof. # Prof. % Prof. # Prof. % Prof. # Prof. % Prof. # Prof. % Prof.All Students 8811 891 10.1 1586 18.0 2543 28.9 3148 35.7 643 7.3 8953 970 10.8 1453 16.2 2365 26.4 3311 37.0 854 9.5American Indian or Alaska Native 25 * 8.0 * 24.0 11 44.0 * 16.0 * 8.0 26 * 11.5 * 26.9 * 34.6 * 23.1 * ≤5Asian 454 21 ≤5 48 10.6 87 19.2 220 48.5 78 17.2 483 * ≤5 37 7.7 95 19.7 217 44.9 127 26.3Black or African American 989 196 19.8 253 25.6 321 32.5 194 19.6 * ≤5 999 187 18.7 238 23.8 300 30.0 242 24.2 32 ≤5Hispanic/Latino of any race 1037 194 18.7 223 21.5 311 30.0 268 25.8 * ≤5 1165 239 20.5 241 20.7 330 28.3 301 25.8 * ≤5Native Hawaiian or Other Pacific Islander * * ≤5 * 25.0 * 37.5 * 37.5 * ≤5 12 * 8.3 * ≤5 * 33.3 * 58.3 * ≤5White 5812 435 7.5 953 16.4 1682 28.9 2279 39.2 463 8.0 5784 481 8.3 846 14.6 1510 26.1 2354 40.7 593 10.3Two or more races 486 43 8.8 101 20.8 128 26.3 180 37.0 34 7.0 484 52 10.7 84 17.4 117 24.2 184 38.0 47 9.7Special Education 869 382 44.0 319 36.7 125 14.4 * ≤5 * ≤5 853 418 49.0 255 29.9 128 15.0 48 5.6 * ≤5Limited English Proficient (LEP) 170 106 62.4 48 28.2 16 9.4 * ≤5 * ≤5 212 149 70.3 46 21.7 12 5.7 * ≤5 * ≤5Free/Reduced Meals (FARMS) 1933 411 21.3 532 27.5 610 31.6 347 18.0 * ≤5 2233 527 23.6 562 25.2 655 29.3 447 20.0 * ≤5
# Prof. % Prof. # Prof. % Prof. # Prof. % Prof. # Prof. % Prof. # Prof. % Prof. # Prof. % Prof. # Prof. % Prof. # Prof. % Prof. # Prof. % Prof. # Prof. % Prof.All Students 4515 635 14.1 1001 22.2 1364 30.2 1318 29.2 * ≤5 4637 691 14.9 964 20.8 1295 27.9 1417 30.6 270 5.8American Indian or Alaska Native 13 * 7.7 * 30.8 * 38.5 * 15.4 * 7.7 16 * 6.3 * 31.3 * 43.8 * 12.5 * 6.3Asian 237 13 5.5 32 13.5 51 21.5 108 45.6 33 13.9 254 * ≤5 31 12.2 51 20.1 111 43.7 56 22.0Black or African American 507 134 26.4 148 29.2 152 30.0 65 12.8 * ≤5 506 131 25.9 136 26.9 146 28.9 84 16.6 * ≤5Hispanic/Latino of any race 541 138 25.5 134 24.8 158 29.2 95 17.6 * ≤5 599 157 26.2 144 24.0 157 26.2 122 20.4 * ≤5Native Hawaiian or Other Pacific Islander * * ≤5 * 66.7 * ≤5 * 33.3 * ≤5 * * 25.0 * ≤5 * 50.0 * 25.0 * ≤5White 2979 327 11.0 619 20.8 929 31.2 976 32.8 * ≤5 3024 366 12.1 603 19.9 866 28.6 1014 33.5 175 5.8Two or more races 235 22 9.4 62 26.4 69 29.4 71 30.2 * ≤5 234 30 12.8 45 19.2 66 28.2 83 35.5 * ≤5Special Education 602 277 46.0 212 35.2 81 13.5 * ≤5 * ≤5 585 294 50.3 180 30.8 79 13.5 30 5.1 * ≤5Limited English Proficient (LEP) 102 72 70.6 22 21.6 * 7.8 * ≤5 * ≤5 127 93 73.2 24 18.9 * 6.3 * ≤5 * ≤5Free/Reduced Meals (FARMS) 1012 278 27.5 310 30.6 290 28.7 128 12.6 * ≤5 1154 348 30.2 327 28.3 299 25.9 163 14.1 * ≤5
# Prof. % Prof. # Prof. % Prof. # Prof. % Prof. # Prof. % Prof. # Prof. % Prof. # Prof. % Prof. # Prof. % Prof. # Prof. % Prof. # Prof. % Prof. # Prof. % Prof.All Students 4296 256 6.0 585 13.6 1179 27.4 1830 42.6 446 10.4 4316 279 6.5 489 11.3 1070 24.8 1894 43.9 584 13.5American Indian or Alaska Native 12 * 8.3 * 16.7 * 50.0 * 16.7 * 8.3 10 * 20.0 * 20.0 * 20.0 * 40.0 * ≤5Asian 217 * ≤5 16 7.4 36 16.6 112 51.6 45 20.7 229 * ≤5 * ≤5 44 19.2 106 46.3 71 31.0Black or African American 482 62 12.9 105 21.8 169 35.1 129 26.8 * ≤5 493 56 11.4 102 20.7 154 31.2 158 32.0 23 ≤5Hispanic/Latino of any race 496 56 11.3 89 17.9 153 30.8 173 34.9 * ≤5 566 82 14.5 97 17.1 173 30.6 179 31.6 35 6.2Native Hawaiian or Other Pacific Islander * * ≤5 * ≤5 * 60.0 * 40.0 * ≤5 * * ≤5 * ≤5 * 25.0 * 75.0 * ≤5White 2833 * ≤5 334 11.8 753 26.6 1303 46.0 335 11.8 2760 * ≤5 243 8.8 644 23.3 1340 48.6 418 15.1Two or more races 251 21 8.4 39 15.5 59 23.5 109 43.4 23 9.2 250 22 8.8 39 15.6 51 20.4 101 40.4 37 14.8Special Education 267 105 39.3 107 40.1 44 16.5 * ≤5 * ≤5 268 124 46.3 75 28.0 49 18.3 18 6.7 * ≤5Limited English Proficient (LEP) 68 34 50.0 26 38.2 * 11.8 * ≤5 * ≤5 85 56 65.9 22 25.9 * ≤5 * ≤5 * ≤5Free/Reduced Meals (FARMS) 921 133 14.4 222 24.1 320 34.7 219 23.8 27 ≤5 1079 179 16.6 235 21.8 356 33.0 284 26.3 * ≤5
Level 3 Level 4 Level 5
Level 4 Level 5
Table 2.2c: PARCC Assessment Performance Results - English Language Arts/Literacy for Grades 6-8 FEMALE STUDENTS
Student Group2015 2016
# TestedLevel 1 Level 2 Level 3 Level 4 Level 5
# TestedLevel 1 Level 2
Table 2.2a: PARCC Assessment Performance Results - English Language Arts/Literacy for Grades 6-8 ALL STUDENTS
Table 2.2b: PARCC Assessment Performance Results - English Language Arts/Literacy for Grades 6-8 MALE STUDENTS
Student Group2015 2016
# TestedLevel 1 Level 2 Level 3 Level 4 Level 5
# TestedLevel 1 Level 2 Level 3
Level 3 Level 4 Level 52016
Level 2Student Group2015
# Tested # TestedLevel 1Level 1 Level 2 Level 3 Level 4 Level 5
# Prof. % Prof. # Prof. % Prof. # Prof. % Prof. # Prof. % Prof. # Prof. % Prof. # Prof. % Prof. # Prof. % Prof. # Prof. % Prof. # Prof. % Prof. # Prof. % Prof.All Students * * ≥95 * ≤5 * ≤5 * ≤5 * ≤5American Indian or Alaska Native * * ≤5 * ≤5 * ≤5 * ≤5 * ≤5Asian * * ≤5 * ≤5 * ≤5 * ≤5 * ≤5Black or African American * * ≥95 * ≤5 * ≤5 * ≤5 * ≤5Hispanic/Latino of any race * * ≤5 * ≤5 * ≤5 * ≤5 * ≤5Native Hawaiian or Other Pacific Islander * * ≤5 * ≤5 * ≤5 * ≤5 * ≤5White * * ≤5 * ≤5 * ≤5 * ≤5 * ≤5Two or more races * * ≤5 * ≤5 * ≤5 * ≤5 * ≤5Special Education * * ≥95 * ≤5 * ≤5 * ≤5 * ≤5Limited English Proficient (LEP) * * ≤5 * ≤5 * ≤5 * ≤5 * ≤5Free/Reduced Meals (FARMS) * * ≥95 * ≤5 * ≤5 * ≤5 * ≤5
# Prof. % Prof. # Prof. % Prof. # Prof. % Prof. # Prof. % Prof. # Prof. % Prof. # Prof. % Prof. # Prof. % Prof. # Prof. % Prof. # Prof. % Prof. # Prof. % Prof.All Students * * ≥95 * ≤5 * ≤5 * ≤5 * ≤5American Indian or Alaska Native * * ≤5 * ≤5 * ≤5 * ≤5 * ≤5Asian * * ≤5 * ≤5 * ≤5 * ≤5 * ≤5Black or African American * * ≥95 * ≤5 * ≤5 * ≤5 * ≤5Hispanic/Latino of any race * * ≤5 * ≤5 * ≤5 * ≤5 * ≤5Native Hawaiian or Other Pacific Islander * * ≤5 * ≤5 * ≤5 * ≤5 * ≤5White * * ≤5 * ≤5 * ≤5 * ≤5 * ≤5Two or more races * * ≤5 * ≤5 * ≤5 * ≤5 * ≤5Special Education * * ≥95 * ≤5 * ≤5 * ≤5 * ≤5Limited English Proficient (LEP) * * ≤5 * ≤5 * ≤5 * ≤5 * ≤5Free/Reduced Meals (FARMS) * * ≥95 * ≤5 * ≤5 * ≤5 * ≤5
# Prof. % Prof. # Prof. % Prof. # Prof. % Prof. # Prof. % Prof. # Prof. % Prof. # Prof. % Prof. # Prof. % Prof. # Prof. % Prof. # Prof. % Prof. # Prof. % Prof.All Students * * ≤5 * ≤5 * ≤5 * ≤5 * ≤5American Indian or Alaska Native * * ≤5 * ≤5 * ≤5 * ≤5 * ≤5Asian * * ≤5 * ≤5 * ≤5 * ≤5 * ≤5Black or African American * * ≤5 * ≤5 * ≤5 * ≤5 * ≤5Hispanic/Latino of any race * * ≤5 * ≤5 * ≤5 * ≤5 * ≤5Native Hawaiian or Other Pacific Islander * * ≤5 * ≤5 * ≤5 * ≤5 * ≤5White * * ≤5 * ≤5 * ≤5 * ≤5 * ≤5Two or more races * * ≤5 * ≤5 * ≤5 * ≤5 * ≤5Special Education * * ≤5 * ≤5 * ≤5 * ≤5 * ≤5Limited English Proficient (LEP) * * ≤5 * ≤5 * ≤5 * ≤5 * ≤5Free/Reduced Meals (FARMS) * * ≤5 * ≤5 * ≤5 * ≤5 * ≤5
Level 5
Table 2.3c: PARCC Assessment Performance Results - English Language Arts/Literacy for Grade 9 FEMALE STUDENTS
Student Group2015 2016
# TestedLevel 1 Level 2 Level 3 Level 4 Level 5
# TestedLevel 1 Level 2 Level 3 Level 4
Level 5
Table 2.3b: PARCC Assessment Performance Results - English Language Arts/Literacy for Grade 9 MALE STUDENTS
Student Group2015 2016
# TestedLevel 1 Level 2 Level 3 Level 4 Level 5
# TestedLevel 1 Level 2 Level 3 Level 4
Level 5
Table 2.3a: PARCC Assessment Performance Results - English Language Arts/Literacy for Grade 9 ALL STUDENTS
Student Group2015 2016
# TestedLevel 1 Level 2 Level 3 Level 4 Level 5
# TestedLevel 1 Level 2 Level 3 Level 4
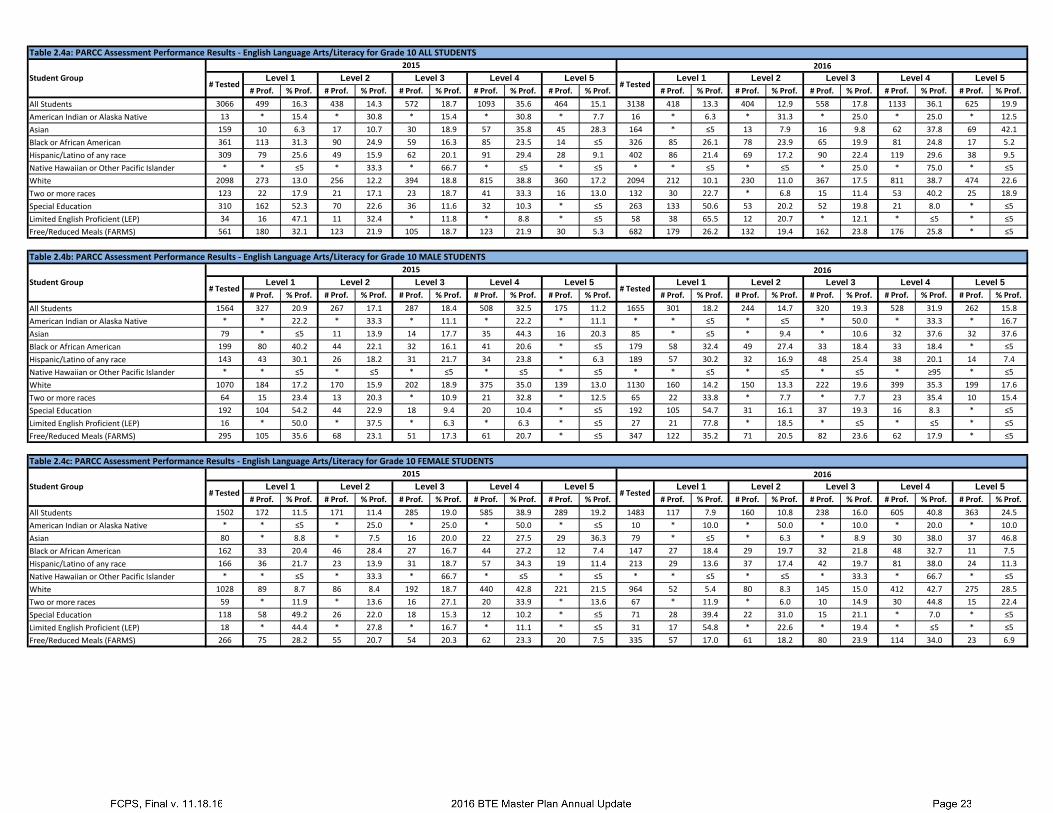
# Prof. % Prof. # Prof. % Prof. # Prof. % Prof. # Prof. % Prof. # Prof. % Prof. # Prof. % Prof. # Prof. % Prof. # Prof. % Prof. # Prof. % Prof. # Prof. % Prof.All Students 3066 499 16.3 438 14.3 572 18.7 1093 35.6 464 15.1 3138 418 13.3 404 12.9 558 17.8 1133 36.1 625 19.9American Indian or Alaska Native 13 * 15.4 * 30.8 * 15.4 * 30.8 * 7.7 16 * 6.3 * 31.3 * 25.0 * 25.0 * 12.5Asian 159 10 6.3 17 10.7 30 18.9 57 35.8 45 28.3 164 * ≤5 13 7.9 16 9.8 62 37.8 69 42.1Black or African American 361 113 31.3 90 24.9 59 16.3 85 23.5 14 ≤5 326 85 26.1 78 23.9 65 19.9 81 24.8 17 5.2Hispanic/Latino of any race 309 79 25.6 49 15.9 62 20.1 91 29.4 28 9.1 402 86 21.4 69 17.2 90 22.4 119 29.6 38 9.5Native Hawaiian or Other Pacific Islander * * ≤5 * 33.3 * 66.7 * ≤5 * ≤5 * * ≤5 * ≤5 * 25.0 * 75.0 * ≤5White 2098 273 13.0 256 12.2 394 18.8 815 38.8 360 17.2 2094 212 10.1 230 11.0 367 17.5 811 38.7 474 22.6Two or more races 123 22 17.9 21 17.1 23 18.7 41 33.3 16 13.0 132 30 22.7 * 6.8 15 11.4 53 40.2 25 18.9Special Education 310 162 52.3 70 22.6 36 11.6 32 10.3 * ≤5 263 133 50.6 53 20.2 52 19.8 21 8.0 * ≤5Limited English Proficient (LEP) 34 16 47.1 11 32.4 * 11.8 * 8.8 * ≤5 58 38 65.5 12 20.7 * 12.1 * ≤5 * ≤5Free/Reduced Meals (FARMS) 561 180 32.1 123 21.9 105 18.7 123 21.9 30 5.3 682 179 26.2 132 19.4 162 23.8 176 25.8 * ≤5
# Prof. % Prof. # Prof. % Prof. # Prof. % Prof. # Prof. % Prof. # Prof. % Prof. # Prof. % Prof. # Prof. % Prof. # Prof. % Prof. # Prof. % Prof. # Prof. % Prof.All Students 1564 327 20.9 267 17.1 287 18.4 508 32.5 175 11.2 1655 301 18.2 244 14.7 320 19.3 528 31.9 262 15.8American Indian or Alaska Native * * 22.2 * 33.3 * 11.1 * 22.2 * 11.1 * * ≤5 * ≤5 * 50.0 * 33.3 * 16.7Asian 79 * ≤5 11 13.9 14 17.7 35 44.3 16 20.3 85 * ≤5 * 9.4 * 10.6 32 37.6 32 37.6Black or African American 199 80 40.2 44 22.1 32 16.1 41 20.6 * ≤5 179 58 32.4 49 27.4 33 18.4 33 18.4 * ≤5Hispanic/Latino of any race 143 43 30.1 26 18.2 31 21.7 34 23.8 * 6.3 189 57 30.2 32 16.9 48 25.4 38 20.1 14 7.4Native Hawaiian or Other Pacific Islander * * ≤5 * ≤5 * ≤5 * ≤5 * ≤5 * * ≤5 * ≤5 * ≤5 * ≥95 * ≤5White 1070 184 17.2 170 15.9 202 18.9 375 35.0 139 13.0 1130 160 14.2 150 13.3 222 19.6 399 35.3 199 17.6Two or more races 64 15 23.4 13 20.3 * 10.9 21 32.8 * 12.5 65 22 33.8 * 7.7 * 7.7 23 35.4 10 15.4Special Education 192 104 54.2 44 22.9 18 9.4 20 10.4 * ≤5 192 105 54.7 31 16.1 37 19.3 16 8.3 * ≤5Limited English Proficient (LEP) 16 * 50.0 * 37.5 * 6.3 * 6.3 * ≤5 27 21 77.8 * 18.5 * ≤5 * ≤5 * ≤5Free/Reduced Meals (FARMS) 295 105 35.6 68 23.1 51 17.3 61 20.7 * ≤5 347 122 35.2 71 20.5 82 23.6 62 17.9 * ≤5
# Prof. % Prof. # Prof. % Prof. # Prof. % Prof. # Prof. % Prof. # Prof. % Prof. # Prof. % Prof. # Prof. % Prof. # Prof. % Prof. # Prof. % Prof. # Prof. % Prof.All Students 1502 172 11.5 171 11.4 285 19.0 585 38.9 289 19.2 1483 117 7.9 160 10.8 238 16.0 605 40.8 363 24.5American Indian or Alaska Native * * ≤5 * 25.0 * 25.0 * 50.0 * ≤5 10 * 10.0 * 50.0 * 10.0 * 20.0 * 10.0Asian 80 * 8.8 * 7.5 16 20.0 22 27.5 29 36.3 79 * ≤5 * 6.3 * 8.9 30 38.0 37 46.8Black or African American 162 33 20.4 46 28.4 27 16.7 44 27.2 12 7.4 147 27 18.4 29 19.7 32 21.8 48 32.7 11 7.5Hispanic/Latino of any race 166 36 21.7 23 13.9 31 18.7 57 34.3 19 11.4 213 29 13.6 37 17.4 42 19.7 81 38.0 24 11.3Native Hawaiian or Other Pacific Islander * * ≤5 * 33.3 * 66.7 * ≤5 * ≤5 * * ≤5 * ≤5 * 33.3 * 66.7 * ≤5White 1028 89 8.7 86 8.4 192 18.7 440 42.8 221 21.5 964 52 5.4 80 8.3 145 15.0 412 42.7 275 28.5Two or more races 59 * 11.9 * 13.6 16 27.1 20 33.9 * 13.6 67 * 11.9 * 6.0 10 14.9 30 44.8 15 22.4Special Education 118 58 49.2 26 22.0 18 15.3 12 10.2 * ≤5 71 28 39.4 22 31.0 15 21.1 * 7.0 * ≤5Limited English Proficient (LEP) 18 * 44.4 * 27.8 * 16.7 * 11.1 * ≤5 31 17 54.8 * 22.6 * 19.4 * ≤5 * ≤5Free/Reduced Meals (FARMS) 266 75 28.2 55 20.7 54 20.3 62 23.3 20 7.5 335 57 17.0 61 18.2 80 23.9 114 34.0 23 6.9
Level 5
Table 2.4c: PARCC Assessment Performance Results - English Language Arts/Literacy for Grade 10 FEMALE STUDENTS
Student Group2015 2016
# TestedLevel 1 Level 2 Level 3 Level 4 Level 5
# TestedLevel 1 Level 2 Level 3 Level 4
Level 5
Table 2.4b: PARCC Assessment Performance Results - English Language Arts/Literacy for Grade 10 MALE STUDENTS
Student Group2015 2016
# TestedLevel 1 Level 2 Level 3 Level 4 Level 5
# TestedLevel 1 Level 2 Level 3 Level 4
Level 5
Table 2.4a: PARCC Assessment Performance Results - English Language Arts/Literacy for Grade 10 ALL STUDENTS
Student Group2015 2016
# TestedLevel 1 Level 2 Level 3 Level 4 Level 5
# TestedLevel 1 Level 2 Level 3 Level 4

# Prof. % Prof. # Prof. % Prof. # Prof. % Prof. # Prof. % Prof. # Prof. % Prof. # Prof. % Prof. # Prof. % Prof. # Prof. % Prof. # Prof. % Prof. # Prof. % Prof.All Students 2019 317 15.7 384 19.0 439 21.7 680 33.7 199 9.9American Indian or Alaska Native * * 42.9 * 14.3 * 14.3 * 14.3 * 14.3Asian 69 * 10.1 13 18.8 16 23.2 27 39.1 * 8.7Black or African American 285 84 29.5 71 24.9 68 23.9 54 18.9 * ≤5Hispanic/Latino of any race 224 37 16.5 52 23.2 59 26.3 62 27.7 14 6.3Native Hawaiian or Other Pacific Islander * * ≤5 * ≤5 * 66.7 * 33.3 * ≤5White 1345 169 12.6 228 17.0 275 20.4 507 37.7 166 12.3Two or more races 86 17 19.8 19 22.1 18 20.9 28 32.6 * ≤5Special Education 252 111 44.0 74 29.4 44 17.5 18 7.1 * ≤5Limited English Proficient (LEP) 12 * 50.0 * 50.0 * ≤5 * ≤5 * ≤5Free/Reduced Meals (FARMS) 465 128 27.5 114 24.5 101 21.7 101 21.7 21 ≤5
# Prof. % Prof. # Prof. % Prof. # Prof. % Prof. # Prof. % Prof. # Prof. % Prof. # Prof. % Prof. # Prof. % Prof. # Prof. % Prof. # Prof. % Prof. # Prof. % Prof.All Students 1074 223 20.8 240 22.3 226 21.0 298 27.7 87 8.1American Indian or Alaska Native * * 40.0 * 20.0 * 20.0 * 20.0 * ≤5Asian 34 4 11.8 * 20.6 * 14.7 15 44.1 * 8.8Black or African American 159 58 36.5 41 25.8 34 21.4 24 15.1 * ≤5Hispanic/Latino of any race 110 21 19.1 29 26.4 29 26.4 27 24.5 * ≤5Native Hawaiian or Other Pacific Islander * * ≤5 * ≤5 * ≤5 * ≥95 * ≤5White 720 123 17.1 152 21.1 149 20.7 218 30.3 78 10.8Two or more races 45 15 33.3 10 22.2 * 17.8 12 26.7 * ≤5Special Education 151 73 48.3 47 31.1 17 11.3 * 6.0 * ≤5Limited English Proficient (LEP) * * 66.7 * 33.3 * ≤5 * ≤5 * ≤5Free/Reduced Meals (FARMS) 241 88 36.5 53 22.0 48 19.9 42 17.4 * ≤5
# Prof. % Prof. # Prof. % Prof. # Prof. % Prof. # Prof. % Prof. # Prof. % Prof. # Prof. % Prof. # Prof. % Prof. # Prof. % Prof. # Prof. % Prof. # Prof. % Prof.All Students 945 94 9.9 144 15.2 213 22.5 382 40.4 112 11.9American Indian or Alaska Native * * 50.0 * ≤5 * ≤5 * ≤5 * 50.0Asian 35 * 8.6 * 17.1 11 31.4 12 34.3 * 8.6Black or African American 126 26 20.6 30 23.8 34 27.0 30 23.8 * ≤5Hispanic/Latino of any race 114 16 14.0 23 20.2 30 26.3 35 30.7 10 8.8Native Hawaiian or Other Pacific Islander * * ≤5 * ≤5 * ≥95 * ≤5 * ≤5White 625 46 7.4 76 12.2 126 20.2 289 46.2 88 14.1Two or more races 41 * ≤5 * 22.0 10 24.4 16 39.0 * 9.8Special Education 101 38 37.6 27 26.7 27 26.7 * 8.9 * ≤5Limited English Proficient (LEP) * * 33.3 * 66.7 * ≤5 * ≤5 * ≤5Free/Reduced Meals (FARMS) 224 40 17.9 61 27.2 53 23.7 59 26.3 * ≤5
Level 5
Table 2.5c: PARCC Assessment Performance Results - English Language Arts/Literacy for Grade 11 FEMALE STUDENTS
Student Group2015 2016
# TestedLevel 1 Level 2 Level 3 Level 4 Level 5
# TestedLevel 1 Level 2 Level 3 Level 4
Level 5
Table 2.5b: PARCC Assessment Performance Results - English Language Arts/Literacy for Grade 11 MALE STUDENTS
Student Group2015 2016
# TestedLevel 1 Level 2 Level 3 Level 4 Level 5
# TestedLevel 1 Level 2 Level 3 Level 4
Level 5
Table 2.5a: PARCC Assessment Performance Results - English Language Arts/Literacy for Grade 11 ALL STUDENTS
Student Group2015 2016
# TestedLevel 1 Level 2 Level 3 Level 4 Level 5
# TestedLevel 1 Level 2 Level 3 Level 4

# Prof. % Prof. # Prof. % Prof. # Prof. % Prof. # Prof. % Prof. # Prof. % Prof. # Prof. % Prof. # Prof. % Prof. # Prof. % Prof. # Prof. % Prof. # Prof. % Prof.All Students 8974 508 5.7 1735 19.3 2581 28.8 3528 39.3 622 6.9 9297 556 6.0 1511 16.3 2282 24.5 4082 43.9 866 9.3American Indian or Alaska Native 31 * 12.9 * 12.9 * 22.6 13 41.9 * 9.7 26 * ≤5 * 26.9 * 26.9 10 38.5 * ≤5Asian 523 * ≤5 38 7.3 99 18.9 258 49.3 120 22.9 529 * ≤5 44 8.3 72 13.6 255 48.2 143 27.0Black or African American 1003 103 10.3 316 31.5 314 31.3 252 25.1 * ≤5 1097 122 11.1 249 22.7 343 31.3 339 30.9 * ≤5Hispanic/Latino of any race 1241 130 10.5 368 29.7 382 30.8 335 27.0 * ≤5 1412 161 11.4 348 24.6 402 28.5 451 31.9 * ≤5Native Hawaiian or Other Pacific Islander 21 * ≤5 * 19.0 * 19.0 11 52.4 * ≤5 23 * 8.7 * ≤5 * 30.4 11 47.8 * 8.7White 5716 * ≤5 917 16.0 1643 28.7 2500 43.7 425 7.4 5743 * ≤5 789 13.7 1342 23.4 2812 49.0 578 10.1Two or more races 439 31 7.1 88 20.0 132 30.1 159 36.2 29 6.6 467 33 7.1 73 15.6 109 23.3 204 43.7 48 10.3Special Education 874 204 23.3 400 45.8 198 22.7 63 7.2 * ≤5 870 226 26.0 332 38.2 195 22.4 97 11.1 * ≤5Limited English Proficient (LEP) 410 95 23.2 186 45.4 92 22.4 36 8.8 * ≤5 421 110 26.1 149 35.4 110 26.1 52 12.4 * ≤5Free/Reduced Meals (FARMS) 2291 259 11.3 745 32.5 736 32.1 515 22.5 * ≤5 2734 358 13.1 733 26.8 818 29.9 750 27.4 * ≤5
# Prof. % Prof. # Prof. % Prof. # Prof. % Prof. # Prof. % Prof. # Prof. % Prof. # Prof. % Prof. # Prof. % Prof. # Prof. % Prof. # Prof. % Prof. # Prof. % Prof.All Students 4570 284 6.2 887 19.4 1248 27.3 1800 39.4 351 7.7 4744 316 6.7 761 16.0 1113 23.5 2072 43.7 482 10.2American Indian or Alaska Native 15 * 6.7 * 13.3 * 26.7 * 33.3 * 20.0 * * ≤5 * 22.2 * 44.4 * 33.3 * ≤5Asian 251 * ≤5 20 8.0 46 18.3 117 46.6 64 25.5 269 * ≤5 24 8.9 37 13.8 125 46.5 77 28.6Black or African American 507 62 12.2 168 33.1 147 29.0 126 24.9 * ≤5 540 66 12.2 131 24.3 172 31.9 153 28.3 * ≤5Hispanic/Latino of any race 628 67 10.7 184 29.3 190 30.3 174 27.7 * ≤5 724 85 11.7 178 24.6 190 26.2 241 33.3 * ≤5Native Hawaiian or Other Pacific Islander * * 12.5 * 37.5 * 25.0 * 25.0 * ≤5 * * 22.2 * ≤5 * 22.2 * 33.3 * 22.2White 2942 * ≤5 466 15.8 791 26.9 1296 44.1 255 8.7 2964 * ≤5 394 13.3 654 22.1 1443 48.7 333 11.2Two or more races 219 15 6.8 44 20.1 68 31.1 80 36.5 12 5.5 229 17 7.4 32 14.0 54 23.6 104 45.4 22 9.6Special Education 587 127 21.6 265 45.1 138 23.5 51 8.7 * ≤5 607 152 25.0 216 35.6 146 24.1 77 12.7 * ≤5Limited English Proficient (LEP) 237 46 19.4 104 43.9 60 25.3 26 11.0 * ≤5 232 60 25.9 88 37.9 53 22.8 31 13.4 * ≤5Free/Reduced Meals (FARMS) 1152 138 12.0 370 32.1 357 31.0 264 22.9 * ≤5 1390 198 14.2 367 26.4 394 28.3 392 28.2 39 ≤5
# Prof. % Prof. # Prof. % Prof. # Prof. % Prof. # Prof. % Prof. # Prof. % Prof. # Prof. % Prof. # Prof. % Prof. # Prof. % Prof. # Prof. % Prof. # Prof. % Prof.All Students 4404 224 5.1 848 19.3 1333 30.3 1728 39.2 271 6.2 4553 240 5.3 750 16.5 1169 25.7 2010 44.1 384 8.4American Indian or Alaska Native 16 * 18.8 * 12.5 * 18.8 * 50.0 * ≤5 17 * 5.9 * 29.4 * 17.6 * 41.2 * 5.9Asian 272 * ≤5 18 6.6 53 19.5 141 51.8 56 20.6 260 * ≤5 20 7.7 35 13.5 130 50.0 66 25.4Black or African American 496 41 8.3 148 29.8 167 33.7 126 25.4 * ≤5 557 56 10.1 118 21.2 171 30.7 186 33.4 * ≤5Hispanic/Latino of any race 613 63 10.3 184 30.0 192 31.3 161 26.3 * ≤5 688 76 11.0 170 24.7 212 30.8 210 30.5 * ≤5Native Hawaiian or Other Pacific Islander 13 * ≤5 * 7.7 * 15.4 * 69.2 * 7.7 14 * ≤5 * 7.1 * 35.7 * 57.1 * ≤5White 2774 * ≤5 451 16.3 852 30.7 1204 43.4 170 6.1 2779 * ≤5 395 14.2 688 24.8 1369 49.3 245 8.8Two or more races 220 16 7.3 44 20.0 64 29.1 79 35.9 17 7.7 238 16 6.7 41 17.2 55 23.1 100 42.0 26 10.9Special Education 287 77 26.8 135 47.0 60 20.9 * ≤5 * ≤5 263 74 28.1 116 44.1 49 18.6 20 7.6 * ≤5Limited English Proficient (LEP) 173 49 28.3 82 47.4 32 18.5 10 5.8 * ≤5 189 50 26.5 61 32.3 57 30.2 21 11.1 * ≤5Free/Reduced Meals (FARMS) 1139 121 10.6 375 32.9 379 33.3 251 22.0 * ≤5 1344 160 11.9 366 27.2 424 31.5 358 26.6 * ≤5
Level 5
Table 2.6a: PARCC Assessment Performance Results - Mathematics for Grades 3-5 ALL STUDENTS
Student Group2015 2016
# TestedLevel 1 Level 2 Level 3 Level 4 Level 5
# TestedLevel 1 Level 2 Level 3 Level 4
Level 5
Table 2.6b: PARCC Assessment Performance Results - Mathematics for Grades 3-5 MALE STUDENTS
Student Group2015 2016
# TestedLevel 1 Level 2 Level 3 Level 4 Level 5
# TestedLevel 1 Level 2 Level 3 Level 4
Level 5
Table 2.6c: PARCC Assessment Performance Results - Mathematics for Grades 3-5 FEMALE STUDENTS
Student Group2015 2016
# TestedLevel 1 Level 2 Level 3 Level 4 Level 5
# TestedLevel 1 Level 2 Level 3 Level 4
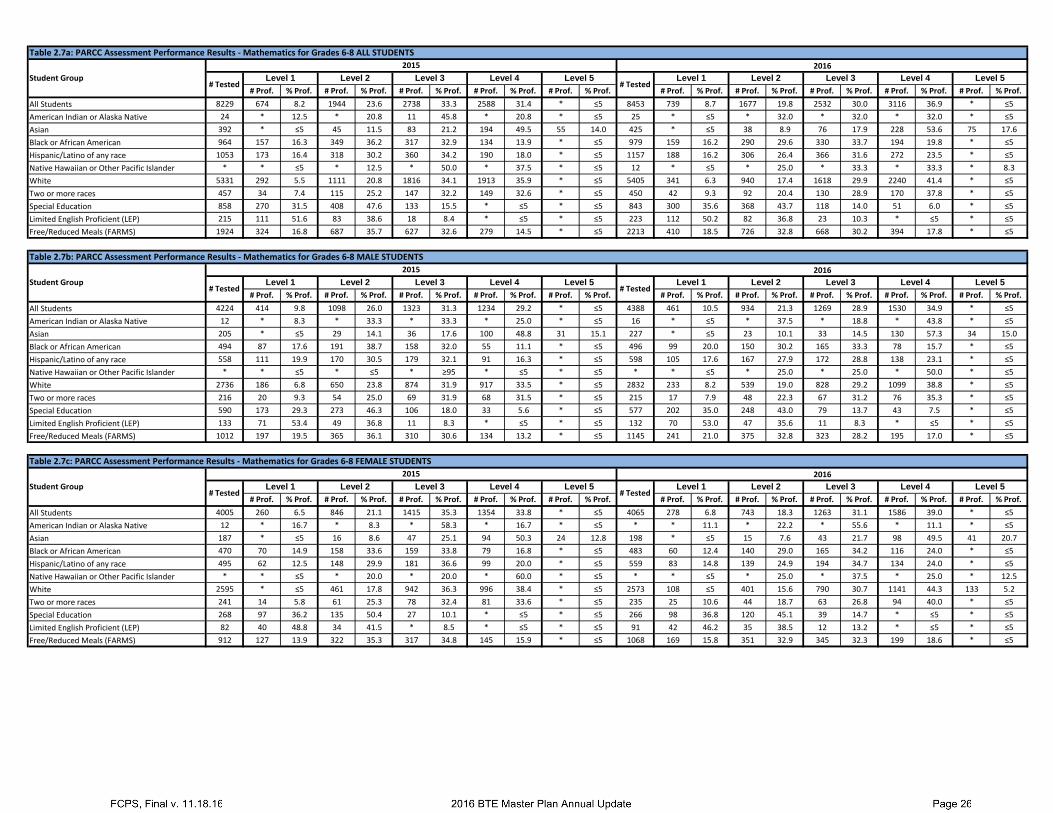
# Prof. % Prof. # Prof. % Prof. # Prof. % Prof. # Prof. % Prof. # Prof. % Prof. # Prof. % Prof. # Prof. % Prof. # Prof. % Prof. # Prof. % Prof. # Prof. % Prof.All Students 8229 674 8.2 1944 23.6 2738 33.3 2588 31.4 * ≤5 8453 739 8.7 1677 19.8 2532 30.0 3116 36.9 * ≤5American Indian or Alaska Native 24 * 12.5 * 20.8 11 45.8 * 20.8 * ≤5 25 * ≤5 * 32.0 * 32.0 * 32.0 * ≤5Asian 392 * ≤5 45 11.5 83 21.2 194 49.5 55 14.0 425 * ≤5 38 8.9 76 17.9 228 53.6 75 17.6Black or African American 964 157 16.3 349 36.2 317 32.9 134 13.9 * ≤5 979 159 16.2 290 29.6 330 33.7 194 19.8 * ≤5Hispanic/Latino of any race 1053 173 16.4 318 30.2 360 34.2 190 18.0 * ≤5 1157 188 16.2 306 26.4 366 31.6 272 23.5 * ≤5Native Hawaiian or Other Pacific Islander * * ≤5 * 12.5 * 50.0 * 37.5 * ≤5 12 * ≤5 * 25.0 * 33.3 * 33.3 * 8.3White 5331 292 5.5 1111 20.8 1816 34.1 1913 35.9 * ≤5 5405 341 6.3 940 17.4 1618 29.9 2240 41.4 * ≤5Two or more races 457 34 7.4 115 25.2 147 32.2 149 32.6 * ≤5 450 42 9.3 92 20.4 130 28.9 170 37.8 * ≤5Special Education 858 270 31.5 408 47.6 133 15.5 * ≤5 * ≤5 843 300 35.6 368 43.7 118 14.0 51 6.0 * ≤5Limited English Proficient (LEP) 215 111 51.6 83 38.6 18 8.4 * ≤5 * ≤5 223 112 50.2 82 36.8 23 10.3 * ≤5 * ≤5Free/Reduced Meals (FARMS) 1924 324 16.8 687 35.7 627 32.6 279 14.5 * ≤5 2213 410 18.5 726 32.8 668 30.2 394 17.8 * ≤5
# Prof. % Prof. # Prof. % Prof. # Prof. % Prof. # Prof. % Prof. # Prof. % Prof. # Prof. % Prof. # Prof. % Prof. # Prof. % Prof. # Prof. % Prof. # Prof. % Prof.All Students 4224 414 9.8 1098 26.0 1323 31.3 1234 29.2 * ≤5 4388 461 10.5 934 21.3 1269 28.9 1530 34.9 * ≤5American Indian or Alaska Native 12 * 8.3 * 33.3 * 33.3 * 25.0 * ≤5 16 * ≤5 * 37.5 * 18.8 * 43.8 * ≤5Asian 205 * ≤5 29 14.1 36 17.6 100 48.8 31 15.1 227 * ≤5 23 10.1 33 14.5 130 57.3 34 15.0Black or African American 494 87 17.6 191 38.7 158 32.0 55 11.1 * ≤5 496 99 20.0 150 30.2 165 33.3 78 15.7 * ≤5Hispanic/Latino of any race 558 111 19.9 170 30.5 179 32.1 91 16.3 * ≤5 598 105 17.6 167 27.9 172 28.8 138 23.1 * ≤5Native Hawaiian or Other Pacific Islander * * ≤5 * ≤5 * ≥95 * ≤5 * ≤5 * * ≤5 * 25.0 * 25.0 * 50.0 * ≤5White 2736 186 6.8 650 23.8 874 31.9 917 33.5 * ≤5 2832 233 8.2 539 19.0 828 29.2 1099 38.8 * ≤5Two or more races 216 20 9.3 54 25.0 69 31.9 68 31.5 * ≤5 215 17 7.9 48 22.3 67 31.2 76 35.3 * ≤5Special Education 590 173 29.3 273 46.3 106 18.0 33 5.6 * ≤5 577 202 35.0 248 43.0 79 13.7 43 7.5 * ≤5Limited English Proficient (LEP) 133 71 53.4 49 36.8 11 8.3 * ≤5 * ≤5 132 70 53.0 47 35.6 11 8.3 * ≤5 * ≤5Free/Reduced Meals (FARMS) 1012 197 19.5 365 36.1 310 30.6 134 13.2 * ≤5 1145 241 21.0 375 32.8 323 28.2 195 17.0 * ≤5
# Prof. % Prof. # Prof. % Prof. # Prof. % Prof. # Prof. % Prof. # Prof. % Prof. # Prof. % Prof. # Prof. % Prof. # Prof. % Prof. # Prof. % Prof. # Prof. % Prof.All Students 4005 260 6.5 846 21.1 1415 35.3 1354 33.8 * ≤5 4065 278 6.8 743 18.3 1263 31.1 1586 39.0 * ≤5American Indian or Alaska Native 12 * 16.7 * 8.3 * 58.3 * 16.7 * ≤5 * * 11.1 * 22.2 * 55.6 * 11.1 * ≤5Asian 187 * ≤5 16 8.6 47 25.1 94 50.3 24 12.8 198 * ≤5 15 7.6 43 21.7 98 49.5 41 20.7Black or African American 470 70 14.9 158 33.6 159 33.8 79 16.8 * ≤5 483 60 12.4 140 29.0 165 34.2 116 24.0 * ≤5Hispanic/Latino of any race 495 62 12.5 148 29.9 181 36.6 99 20.0 * ≤5 559 83 14.8 139 24.9 194 34.7 134 24.0 * ≤5Native Hawaiian or Other Pacific Islander * * ≤5 * 20.0 * 20.0 * 60.0 * ≤5 * * ≤5 * 25.0 * 37.5 * 25.0 * 12.5White 2595 * ≤5 461 17.8 942 36.3 996 38.4 * ≤5 2573 108 ≤5 401 15.6 790 30.7 1141 44.3 133 5.2Two or more races 241 14 5.8 61 25.3 78 32.4 81 33.6 * ≤5 235 25 10.6 44 18.7 63 26.8 94 40.0 * ≤5Special Education 268 97 36.2 135 50.4 27 10.1 * ≤5 * ≤5 266 98 36.8 120 45.1 39 14.7 * ≤5 * ≤5Limited English Proficient (LEP) 82 40 48.8 34 41.5 * 8.5 * ≤5 * ≤5 91 42 46.2 35 38.5 12 13.2 * ≤5 * ≤5Free/Reduced Meals (FARMS) 912 127 13.9 322 35.3 317 34.8 145 15.9 * ≤5 1068 169 15.8 351 32.9 345 32.3 199 18.6 * ≤5
Level 5
Table 2.7a: PARCC Assessment Performance Results - Mathematics for Grades 6-8 ALL STUDENTS
Student Group2015 2016
# TestedLevel 1 Level 2 Level 3 Level 4 Level 5
# TestedLevel 1 Level 2 Level 3 Level 4
Level 5
Table 2.7b: PARCC Assessment Performance Results - Mathematics for Grades 6-8 MALE STUDENTS
Student Group2015 2016
# TestedLevel 1 Level 2 Level 3 Level 4 Level 5
# TestedLevel 1 Level 2 Level 3 Level 4
Level 5
Table 2.7c: PARCC Assessment Performance Results - Mathematics for Grades 6-8 FEMALE STUDENTS
Student Group2015 2016
# TestedLevel 1 Level 2 Level 3 Level 4 Level 5
# TestedLevel 1 Level 2 Level 3 Level 4

# Prof. % Prof. # Prof. % Prof. # Prof. % Prof. # Prof. % Prof. # Prof. % Prof. # Prof. % Prof. # Prof. % Prof. # Prof. % Prof. # Prof. % Prof. # Prof. % Prof.All Students 3972 315 7.9 816 20.5 1102 27.7 1626 40.9 113 ≤5 3337 216 6.5 567 17.0 857 25.7 1510 45.3 187 5.6American Indian or Alaska Native 16 * 6.3 * 31.3 * 37.5 * 18.8 * 6.3 14 * 14.3 * 21.4 * 35.7 * 28.6 * ≤5Asian 193 * ≤5 24 12.4 38 19.7 101 52.3 25 13.0 156 * ≤5 10 6.4 25 16.0 87 55.8 33 21.2Black or African American 474 74 15.6 156 32.9 147 31.0 93 19.6 * ≤5 448 51 11.4 134 29.9 153 34.2 102 22.8 * ≤5Hispanic/Latino of any race 437 51 11.7 131 30.0 137 31.4 116 26.5 * ≤5 483 57 11.8 140 29.0 137 28.4 143 29.6 * ≤5Native Hawaiian or Other Pacific Islander * * ≤5 * 50.0 * 50.0 * ≤5 * ≤5 * * ≤5 * 50.0 * ≤5 * 50.0 * ≤5White 2668 169 6.3 455 17.1 727 27.2 1239 46.4 * ≤5 2059 * ≤5 248 12.0 488 23.7 1099 53.4 130 6.3Two or more races 180 15 8.3 43 23.9 45 25.0 74 41.1 * ≤5 173 11 6.4 30 17.3 49 28.3 73 42.2 10 5.8Special Education 396 97 24.5 175 44.2 86 21.7 34 8.6 * ≤5 313 60 19.2 127 40.6 78 24.9 44 14.1 * ≤5Limited English Proficient (LEP) 67 13 19.4 32 47.8 17 25.4 * 7.5 * ≤5 125 26 20.8 58 46.4 29 23.2 10 8.0 * ≤5Free/Reduced Meals (FARMS) 832 121 14.5 267 32.1 260 31.3 181 21.8 * ≤5 876 120 13.7 290 33.1 270 30.8 189 21.6 * ≤5
# Prof. % Prof. # Prof. % Prof. # Prof. % Prof. # Prof. % Prof. # Prof. % Prof. # Prof. % Prof. # Prof. % Prof. # Prof. % Prof. # Prof. % Prof. # Prof. % Prof.All Students 2088 211 10.1 461 22.1 567 27.2 783 37.5 * ≤5 1726 135 7.8 326 18.9 423 24.5 738 42.8 104 6.0American Indian or Alaska Native 10 * 10.0 * 30.0 * 30.0 * 20.0 * 10.0 * * 20.0 * 20.0 * 60.0 * ≤5 * ≤5Asian 99 * ≤5 11 11.1 21 21.2 46 46.5 17 17.2 79 * 1.3 7 8.9 13 16.5 43 54.4 15 19.0Black or African American 259 51 19.7 89 34.4 73 28.2 44 17.0 * ≤5 234 34 14.5 75 32.1 68 29.1 53 22.6 * ≤5Hispanic/Latino of any race 197 28 14.2 64 32.5 59 29.9 45 22.8 * ≤5 268 36 13.4 80 29.9 77 28.7 72 26.9 * ≤5Native Hawaiian or Other Pacific Islander * * ≤5 * 50.0 * 50.0 * ≤5 * ≤5 * * ≤5 * ≥95 * ≤5 * ≤5 * ≤5White 1426 116 8.1 265 18.6 393 27.6 609 42.7 * ≤5 1054 55 5.2 146 13.9 240 22.8 537 50.9 76 7.2Two or more races 95 11 11.6 28 29.5 17 17.9 37 38.9 * ≤5 85 8 9.4 16 18.8 22 25.9 33 38.8 * 7.1Special Education 273 71 26.0 114 41.8 56 20.5 28 10.3 * ≤5 224 40 17.9 89 39.7 55 24.6 36 16.1 * ≤5Limited English Proficient (LEP) 31 * 25.8 14 45.2 * 22.6 * 6.5 * ≤5 66 16 24.2 31 47.0 12 18.2 * 10.6 * ≤5Free/Reduced Meals (FARMS) 426 75 17.6 152 35.7 106 24.9 92 21.6 * ≤5 479 72 15.0 163 34.0 137 28.6 103 21.5 * ≤5
# Prof. % Prof. # Prof. % Prof. # Prof. % Prof. # Prof. % Prof. # Prof. % Prof. # Prof. % Prof. # Prof. % Prof. # Prof. % Prof. # Prof. % Prof. # Prof. % Prof.All Students 1884 104 5.5 355 18.8 535 28.4 843 44.7 * ≤5 1611 * ≤5 241 15.0 434 26.9 772 47.9 83 5.2American Indian or Alaska Native * * ≤5 * 33.3 * 50.0 * 16.7 * ≤5 * * 11.1 * 22.2 * 22.2 * 44.4 * ≤5Asian 94 * ≤5 13 13.8 17 18.1 55 58.5 * 8.5 77 * ≤5 * ≤5 12 15.6 44 57.1 18 23.4Black or African American 215 23 10.7 67 31.2 74 34.4 49 22.8 * ≤5 214 17 7.9 59 27.6 85 39.7 49 22.9 * ≤5Hispanic/Latino of any race 240 23 9.6 67 27.9 78 32.5 71 29.6 * ≤5 215 21 9.8 60 27.9 60 27.9 71 33.0 * ≤5Native Hawaiian or Other Pacific Islander * * ≤5 * 50.0 * 50.0 * ≤5 * ≤5 * * ≤5 * 33.3 * ≤5 * 66.7 * ≤5White 1242 * ≤5 190 15.3 334 26.9 630 50.7 * ≤5 1005 * ≤5 102 10.1 248 24.7 562 55.9 54 5.4Two or more races 85 * ≤5 15 17.6 28 32.9 37 43.5 * ≤5 88 * ≤5 14 15.9 27 30.7 40 45.5 * ≤5Special Education 123 26 21.1 61 49.6 30 24.4 * ≤5 * ≤5 89 20 22.5 38 42.7 23 25.8 * 9.0 * ≤5Limited English Proficient (LEP) 36 * 13.9 18 50.0 10 27.8 * 8.3 * ≤5 59 10 16.9 27 45.8 17 28.8 * 5.1 * ≤5Free/Reduced Meals (FARMS) 406 46 11.3 115 28.3 154 37.9 89 21.9 * ≤5 397 48 12.1 127 32.0 133 33.5 86 21.7 * ≤5
Level 5
Table 2.8a: PARCC Assessment Performance Results - Algebra I ALL STUDENTS
Student Group2015 2016
# TestedLevel 1 Level 2 Level 3 Level 4 Level 5
# TestedLevel 1 Level 2 Level 3 Level 4
Level 5
Table 2.8b: PARCC Assessment Performance Results - Algebra I MALE STUDENTS
Student Group2015 2016
# TestedLevel 1 Level 2 Level 3 Level 4 Level 5
# TestedLevel 1 Level 2 Level 3 Level 4
Level 5
Table 2.8c: PARCC Assessment Performance Results - Algebra I FEMALE STUDENTS
Student Group2015 2016
# TestedLevel 1 Level 2 Level 3 Level 4 Level 5
# TestedLevel 1 Level 2 Level 3 Level 4

# Prof. % Prof. # Prof. % Prof. # Prof. % Prof. # Prof. % Prof. # Prof. % Prof. # Prof. % Prof. # Prof. % Prof. # Prof. % Prof. # Prof. % Prof. # Prof. % Prof.All Students 1456 240 16.5 353 24.2 389 26.7 443 30.4 * ≤5 2506 315 12.6 456 18.2 618 24.7 1055 42.1 * ≤5American Indian or Alaska Native * * 14.3 * 14.3 * 28.6 * 28.6 * 14.3 * * 20.0 * 40.0 * 20.0 * 20.0 * ≤5Asian 97 * 7.2 16 16.5 20 20.6 42 43.3 12 12.4 136 * ≤5 15 11.0 28 20.6 76 55.9 11 8.1Black or African American 155 62 40.0 47 30.3 32 20.6 14 9.0 * ≤5 209 73 34.9 54 25.8 49 23.4 32 15.3 * ≤5Hispanic/Latino of any race 173 32 18.5 50 28.9 48 27.7 42 24.3 * ≤5 251 41 16.3 62 24.7 71 28.3 73 29.1 * ≤5Native Hawaiian or Other Pacific Islander * * ≤5 * 66.7 * 33.3 * ≤5 * ≤5 * * ≤5 * ≥95 * ≤5 * ≤5 * ≤5White 975 130 13.3 226 23.2 270 27.7 332 34.1 * ≤5 1795 179 10.0 299 16.7 440 24.5 832 46.4 * ≤5Two or more races 46 * 17.4 11 23.9 16 34.8 11 23.9 * ≤5 108 15 13.9 22 20.4 29 26.9 41 38.0 * ≤5Special Education 39 16 41.0 * 23.1 * 17.9 * 12.8 * 5.1 90 44 48.9 21 23.3 13 14.4 11 12.2 * ≤5Limited English Proficient (LEP) * * 50.0 * 33.3 * ≤5 * 16.7 * ≤5 * * 50.0 * 25.0 * 25.0 * ≤5 * ≤5Free/Reduced Meals (FARMS) 208 58 27.9 61 29.3 52 25.0 36 17.3 * ≤5 347 84 24.2 92 26.5 96 27.7 72 20.7 * ≤5
# Prof. % Prof. # Prof. % Prof. # Prof. % Prof. # Prof. % Prof. # Prof. % Prof. # Prof. % Prof. # Prof. % Prof. # Prof. % Prof. # Prof. % Prof. # Prof. % Prof.All Students 668 117 17.5 150 22.5 165 24.7 211 31.6 * ≤5 1216 176 14.5 221 18.2 280 23.0 497 40.9 * ≤5American Indian or Alaska Native * * ≤5 * ≤5 * 50.0 * 25.0 * 25.0 * * ≤5 * 50.0 * 50.0 * ≤5 * ≤5Asian 48 * 10.4 * 16.7 * 18.8 16 33.3 10 20.8 78 * 5.1 11 14.1 16 20.5 40 51.3 * 9.0Black or African American 72 27 37.5 22 30.6 18 25.0 * 6.9 * ≤5 106 40 37.7 33 31.1 20 18.9 13 12.3 * ≤5Hispanic/Latino of any race 78 16 20.5 22 28.2 21 26.9 19 24.4 * ≤5 108 21 19.4 28 25.9 28 25.9 29 26.9 * ≤5Native Hawaiian or Other Pacific Islander * * ≤5 * ≥95 * ≤5 * ≤5 * ≤5 * * ≤5 * ≤5 * ≤5 * ≤5 * ≤5White 447 64 14.3 92 20.6 109 24.4 168 37.6 * ≤5 875 102 11.7 139 15.9 202 23.1 400 45.7 * ≤5Two or more races 17 * 29.4 * 23.5 * 35.3 * 11.8 * ≤5 47 * 19.1 * 19.1 13 27.7 15 31.9 * ≤5Special Education 24 * 37.5 * 20.8 * 16.7 * 16.7 * 8.3 50 18 36.0 10 20.0 11 22.0 10 20.0 * ≤5Limited English Proficient (LEP) * * 75.0 * 25.0 * ≤5 * ≤5 * ≤5 * * ≥95 * ≤5 * ≤5 * ≤5 * ≤5Free/Reduced Meals (FARMS) 94 24 25.5 30 31.9 20 21.3 20 21.3 * ≤5 159 40 25.2 46 28.9 38 23.9 33 20.8 * ≤5
# Prof. % Prof. # Prof. % Prof. # Prof. % Prof. # Prof. % Prof. # Prof. % Prof. # Prof. % Prof. # Prof. % Prof. # Prof. % Prof. # Prof. % Prof. # Prof. % Prof.All Students 788 123 15.6 203 25.8 224 28.4 232 29.4 * ≤5 1290 139 10.8 235 18.2 338 26.2 558 43.3 * ≤5American Indian or Alaska Native * * 33.3 * 33.3 * ≤5 * 33.3 * ≤5 * * 33.3 * 33.3 * ≤5 * 33.3 * ≤5Asian 49 * ≤5 * 16.3 11 22.4 26 53.1 * ≤5 58 * ≤5 * 6.9 12 20.7 36 62.1 * 6.9Black or African American 83 35 42.2 25 30.1 14 16.9 * 10.8 * ≤5 103 33 32.0 21 20.4 29 28.2 19 18.4 * ≤5Hispanic/Latino of any race 95 16 16.8 28 29.5 27 28.4 23 24.2 * ≤5 143 20 14.0 34 23.8 43 30.1 44 30.8 * ≤5Native Hawaiian or Other Pacific Islander * * ≤5 * ≤5 * ≥95 * ≤5 * ≤5 * * ≤5 * ≥95 * ≤5 * ≤5 * ≤5White 528 66 12.5 134 25.4 161 30.5 164 31.1 * ≤5 920 77 8.4 160 17.4 238 25.9 432 47.0 * ≤5Two or more races 29 * 10.3 * 24.1 10 34.5 * 31.0 * ≤5 61 * 9.8 13 21.3 16 26.2 26 42.6 * ≤5Special Education 15 * 46.7 * 26.7 * 20.0 * 6.7 * ≤5 40 26 65.0 11 27.5 * ≤5 * ≤5 * ≤5Limited English Proficient (LEP) * * ≤5 * 50.0 * ≤5 * 50.0 * ≤5 * * 33.3 * 33.3 * 33.3 * ≤5 * ≤5Free/Reduced Meals (FARMS) 114 34 29.8 31 27.2 32 28.1 16 14.0 * ≤5 188 44 23.4 46 24.5 58 30.9 39 20.7 * ≤5
Level 5
Table 2.9a: PARCC Assessment Performance Results - Algebra II ALL STUDENTS
Student Group2015 2016
# TestedLevel 1 Level 2 Level 3 Level 4 Level 5
# TestedLevel 1 Level 2 Level 3 Level 4
Level 5
Table 2.9b: PARCC Assessment Performance Results - Algebra II MALE STUDENTS
Student Group2015 2016
# TestedLevel 1 Level 2 Level 3 Level 4 Level 5
# TestedLevel 1 Level 2 Level 3 Level 4
Level 5
Table 2.9c: PARCC Assessment Performance Results - Algebra II FEMALE STUDENTS
Student Group2015 2016
# TestedLevel 1 Level 2 Level 3 Level 4 Level 5
# TestedLevel 1 Level 2 Level 3 Level 4

# Prof. % Prof. # Prof. % Prof. # Prof. % Prof. # Prof. % Prof. # Prof. % Prof. # Prof. % Prof. # Prof. % Prof. # Prof. % Prof. # Prof. % Prof. # Prof. % Prof.All Students 480 90 18.8 248 51.7 128 26.7 11 ≤5 * ≤5American Indian or Alaska Native * * 33.3 * 66.7 * ≤5 * ≤5 * ≤5Asian 10 * 30.0 * 50.0 * 10.0 * ≤5 * 10.0Black or African American 77 18 23.4 45 58.4 13 16.9 * ≤5 * ≤5Hispanic/Latino of any race 58 12 20.7 33 56.9 11 19.0 * ≤5 * ≤5Native Hawaiian or Other Pacific Islander * * ≤5 * ≤5 * ≥95 * ≤5 * ≤5White 314 49 15.6 157 50.0 98 31.2 * ≤5 * ≤5Two or more races 17 * 41.2 * 35.3 * 23.5 * ≤5 * ≤5Special Education 139 43 30.9 75 54.0 20 14.4 * ≤5 * ≤5Limited English Proficient (LEP) 11 * 45.5 * 45.5 * 9.1 * ≤5 * ≤5Free/Reduced Meals (FARMS) 150 42 28.0 74 49.3 31 20.7 * ≤5 * ≤5
# Prof. % Prof. # Prof. % Prof. # Prof. % Prof. # Prof. % Prof. # Prof. % Prof. # Prof. % Prof. # Prof. % Prof. # Prof. % Prof. # Prof. % Prof. # Prof. % Prof.All Students 284 64 22.5 138 48.6 74 26.1 * ≤5 * ≤5American Indian or Alaska Native * * 50.0 * 50.0 * ≤5 * ≤5 * ≤5Asian * * 0.0 * 66.7 * ≤5 * ≤5 * 33.3Black or African American 45 12 26.7 25 55.6 * 15.6 * ≤5 * ≤5Hispanic/Latino of any race 31 * 22.6 14 45.2 * 29.0 * ≤5 * ≤5Native Hawaiian or Other Pacific Islander * * ≤5 * ≤5 * ≤5 * ≤5 * ≤5White 193 41 21.2 93 48.2 54 28.0 * ≤5 * ≤5Two or more races 10 * 30.0 * 30.0 * 40.0 * ≤5 * ≤5Special Education 91 30 33.0 46 50.5 14 15.4 * ≤5 * ≤5Limited English Proficient (LEP) * * 60.0 * 20.0 * 20.0 * ≤5 * ≤5Free/Reduced Meals (FARMS) 83 29 34.9 35 42.2 17 20.5 * ≤5 * ≤5
# Prof. % Prof. # Prof. % Prof. # Prof. % Prof. # Prof. % Prof. # Prof. % Prof. # Prof. % Prof. # Prof. % Prof. # Prof. % Prof. # Prof. % Prof. # Prof. % Prof.All Students 196 26 13.3 110 56.1 54 27.6 * ≤5 * ≤5American Indian or Alaska Native * * ≤5 * ≥95 * ≤5 * ≤5 * ≤5Asian * * 42.9 * 42.9 * 14.3 * ≤5 * ≤5Black or African American 32 * 18.8 20 62.5 * 18.8 * ≤5 * ≤5Hispanic/Latino of any race 27 * 18.5 19 70.4 * 7.4 * ≤5 * ≤5Native Hawaiian or Other Pacific Islander * * ≤5 * ≤5 * ≥95 * ≤5 * ≤5White 121 * 6.6 64 52.9 44 36.4 * ≤5 * ≤5Two or more races * * 57.1 * 42.9 * ≤5 * ≤5 * ≤5Special Education 48 13 27.1 29 60.4 * 12.5 * ≤5 * ≤5Limited English Proficient (LEP) * * 33.3 * 66.7 * ≤5 * ≤5 * ≤5Free/Reduced Meals (FARMS) 67 13 19.4 39 58.2 14 20.9 * ≤5 * ≤5
Level 5
Table 2.10a: PARCC Assessment Performance Results - Geometry ALL STUDENTS
Student Group2015 2016
# TestedLevel 1 Level 2 Level 3 Level 4 Level 5
# TestedLevel 1 Level 2 Level 3 Level 4
Level 5
Table 2.10b: PARCC Assessment Performance Results - Geometry MALE STUDENTS
Student Group2015 2016
# TestedLevel 1 Level 2 Level 3 Level 4 Level 5
# TestedLevel 1 Level 2 Level 3 Level 4
Level 5
Table 2.10c: PARCC Assessment Performance Results - Geometry FEMALE STUDENTS
Student Group2015 2016
# TestedLevel 1 Level 2 Level 3 Level 4 Level 5
# TestedLevel 1 Level 2 Level 3 Level 4
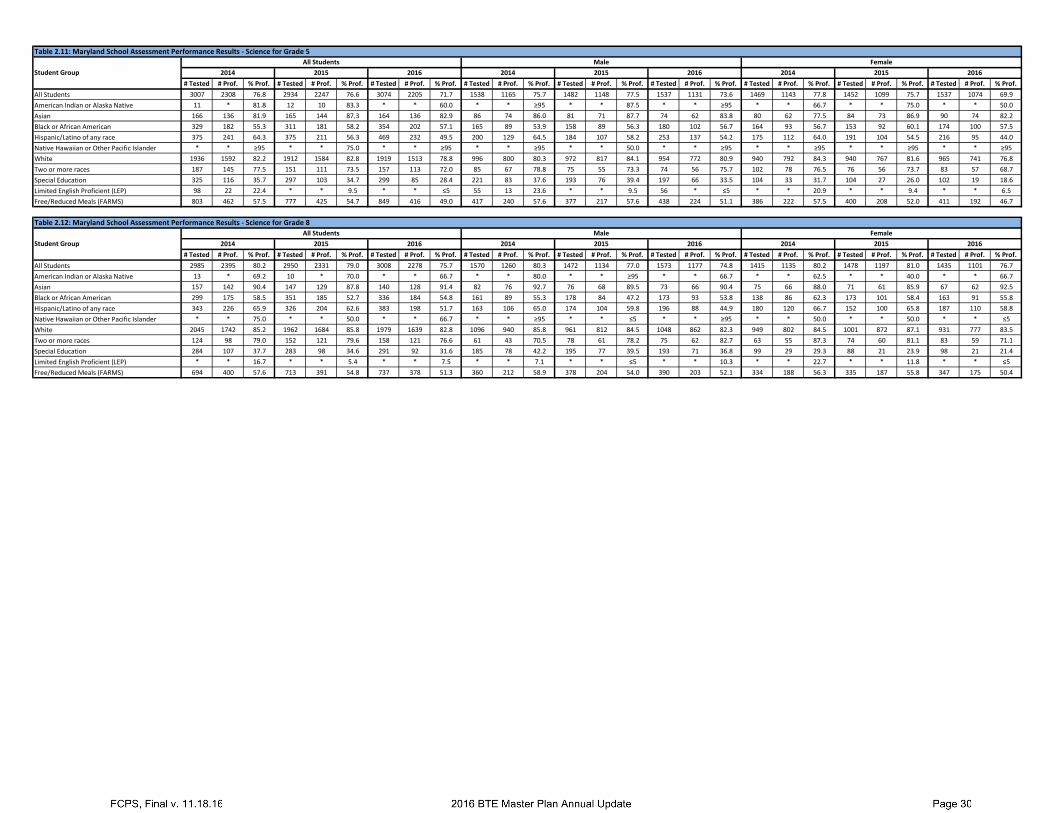
# Tested # Prof. % Prof. # Tested # Prof. % Prof. # Tested # Prof. % Prof. # Tested # Prof. % Prof. # Tested # Prof. % Prof. # Tested # Prof. % Prof. # Tested # Prof. % Prof. # Tested # Prof. % Prof. # Tested # Prof. % Prof.All Students 3007 2308 76.8 2934 2247 76.6 3074 2205 71.7 1538 1165 75.7 1482 1148 77.5 1537 1131 73.6 1469 1143 77.8 1452 1099 75.7 1537 1074 69.9American Indian or Alaska Native 11 * 81.8 12 10 83.3 * * 60.0 * * ≥95 * * 87.5 * * ≥95 * * 66.7 * * 75.0 * * 50.0Asian 166 136 81.9 165 144 87.3 164 136 82.9 86 74 86.0 81 71 87.7 74 62 83.8 80 62 77.5 84 73 86.9 90 74 82.2Black or African American 329 182 55.3 311 181 58.2 354 202 57.1 165 89 53.9 158 89 56.3 180 102 56.7 164 93 56.7 153 92 60.1 174 100 57.5Hispanic/Latino of any race 375 241 64.3 375 211 56.3 469 232 49.5 200 129 64.5 184 107 58.2 253 137 54.2 175 112 64.0 191 104 54.5 216 95 44.0Native Hawaiian or Other Pacific Islander * * ≥95 * * 75.0 * * ≥95 * * ≥95 * * 50.0 * * ≥95 * * ≥95 * * ≥95 * * ≥95White 1936 1592 82.2 1912 1584 82.8 1919 1513 78.8 996 800 80.3 972 817 84.1 954 772 80.9 940 792 84.3 940 767 81.6 965 741 76.8Two or more races 187 145 77.5 151 111 73.5 157 113 72.0 85 67 78.8 75 55 73.3 74 56 75.7 102 78 76.5 76 56 73.7 83 57 68.7Special Education 325 116 35.7 297 103 34.7 299 85 28.4 221 83 37.6 193 76 39.4 197 66 33.5 104 33 31.7 104 27 26.0 102 19 18.6Limited English Proficient (LEP) 98 22 22.4 * * 9.5 * * ≤5 55 13 23.6 * * 9.5 56 * ≤5 * * 20.9 * * 9.4 * * 6.5Free/Reduced Meals (FARMS) 803 462 57.5 777 425 54.7 849 416 49.0 417 240 57.6 377 217 57.6 438 224 51.1 386 222 57.5 400 208 52.0 411 192 46.7
# Tested # Prof. % Prof. # Tested # Prof. % Prof. # Tested # Prof. % Prof. # Tested # Prof. % Prof. # Tested # Prof. % Prof. # Tested # Prof. % Prof. # Tested # Prof. % Prof. # Tested # Prof. % Prof. # Tested # Prof. % Prof.All Students 2985 2395 80.2 2950 2331 79.0 3008 2278 75.7 1570 1260 80.3 1472 1134 77.0 1573 1177 74.8 1415 1135 80.2 1478 1197 81.0 1435 1101 76.7American Indian or Alaska Native 13 * 69.2 10 * 70.0 * * 66.7 * * 80.0 * * ≥95 * * 66.7 * * 62.5 * * 40.0 * * 66.7Asian 157 142 90.4 147 129 87.8 140 128 91.4 82 76 92.7 76 68 89.5 73 66 90.4 75 66 88.0 71 61 85.9 67 62 92.5Black or African American 299 175 58.5 351 185 52.7 336 184 54.8 161 89 55.3 178 84 47.2 173 93 53.8 138 86 62.3 173 101 58.4 163 91 55.8Hispanic/Latino of any race 343 226 65.9 326 204 62.6 383 198 51.7 163 106 65.0 174 104 59.8 196 88 44.9 180 120 66.7 152 100 65.8 187 110 58.8Native Hawaiian or Other Pacific Islander * * 75.0 * * 50.0 * * 66.7 * * ≥95 * * ≤5 * * ≥95 * * 50.0 * * 50.0 * * ≤5White 2045 1742 85.2 1962 1684 85.8 1979 1639 82.8 1096 940 85.8 961 812 84.5 1048 862 82.3 949 802 84.5 1001 872 87.1 931 777 83.5Two or more races 124 98 79.0 152 121 79.6 158 121 76.6 61 43 70.5 78 61 78.2 75 62 82.7 63 55 87.3 74 60 81.1 83 59 71.1Special Education 284 107 37.7 283 98 34.6 291 92 31.6 185 78 42.2 195 77 39.5 193 71 36.8 99 29 29.3 88 21 23.9 98 21 21.4Limited English Proficient (LEP) * * 16.7 * * 5.4 * * 7.5 * * 7.1 * * ≤5 * * 10.3 * * 22.7 * * 11.8 * * ≤5Free/Reduced Meals (FARMS) 694 400 57.6 713 391 54.8 737 378 51.3 360 212 58.9 378 204 54.0 390 203 52.1 334 188 56.3 335 187 55.8 347 175 50.4
Table 2.11: Maryland School Assessment Performance Results - Science for Grade 5
Student GroupAll Students Male Female
2014 2015 2016 2014 2015 2015 20162016 2014
Table 2.12: Maryland School Assessment Performance Results - Science for Grade 8
Student GroupAll Students Male Female
2014 2015 20162015 2016 2014 2015 2016 2014

# Tested # Prof. % Prof. # Tested # Prof. % Prof. # Tested # Prof. % Prof. # Tested # Prof. % Prof. # Tested # Prof. % Prof. # Tested # Prof. % Prof. # Tested # Prof. % Prof. # Tested # Prof. % Prof. # Tested # Prof. % Prof.All Students 30 27 90.0 20 17 85.0 28 22 78.6 19 16 84.2 14 12 85.7 14 * 64.3 11 11 ≥95 * * 83.3 14 13 92.9American Indian or Alaska Native * * ≤5 * * ≤5 * * ≤5 * * ≤5 * * ≤5 * * ≤5 * * ≤5 * * ≤5 * * ≤5Asian * * 50.0 * * ≤5 * * ≥95 * * 50.0 * * ≤5 * * ≤5 * * ≤5 * * ≤5 * * ≥95Black or African American * * 75.0 * * 80.0 * * ≤5 * * 50.0 * * ≥95 * * ≤5 * * ≥95 * * 50.0 * * ≤5Hispanic/Latino of any race * * ≥95 * * ≥95 * * ≥95 * * ≥95 * * ≤5 * * ≥95 * * ≥95 * * ≥95 * * ≥95Native Hawaiian or Other Pacific Islander * * ≥95 * * ≤5 * * ≤5 * * ≤5 * * ≤5 * * ≤5 * * ≥95 * * ≤5 * * ≤5White 19 18 94.7 12 11 91.7 17 14 82.4 13 12 92.3 * * 88.9 * * 66.7 * * ≥95 * * ≥95 * * ≥95Two or more races * * ≥95 * * ≥95 * * ≤5 * * ≤5 * * ≥95 * * ≤5 * * ≥95 * * ≤5 * * ≤5Special Education 30 27 90.0 20 17 85.0 28 22 78.6 19 16 84.2 14 12 85.7 14 * 64.3 11 11 ≥95 * * 83.3 14 13 92.9Limited English Proficient (LEP) * * ≤5 * * ≤5 * * ≥95 * * ≤5 * * ≤5 * * ≥95 * * ≤5 * * ≤5 * * ≤5Free/Reduced Meals (FARMS) 11 11 ≥95 * * 85.7 10 * 90.0 * * ≥95 * * 80.0 * * 80.0 * * ≥95 * * ≥95 * * ≥95
# Tested # Prof. % Prof. # Tested # Prof. % Prof. # Tested # Prof. % Prof. # Tested # Prof. % Prof. # Tested # Prof. % Prof. # Tested # Prof. % Prof. # Tested # Prof. % Prof. # Tested # Prof. % Prof. # Tested # Prof. % Prof.All Students 24 23 95.8 24 17 70.8 38 29 76.3 17 16 94.1 13 * 69.2 26 19 73.1 * * ≥95 11 * 72.7 12 10 83.3American Indian or Alaska Native * * ≤5 * * ≤5 * * ≥95 * * ≤5 * * ≤5 * * ≥95 * * ≤5 * * ≤5 * * ≤5Asian * * ≤5 * * ≤5 * * ≥95 * * ≤5 * * ≤5 * * ≤5 * * ≤5 * * ≤5 * * ≥95Black or African American * * ≥95 * * ≥95 * * 75.0 * * ≥95 * * ≥95 * * 80.0 * * ≥95 * * ≥95 * * 66.7Hispanic/Latino of any race * * ≥95 * * ≤5 * * 83.3 * * ≤5 * * ≤5 * * 80.0 * * ≥95 * * ≤5 * * ≥95Native Hawaiian or Other Pacific Islander * * ≤5 * * ≤5 * * ≤5 * * ≤5 * * ≤5 * * ≤5 * * ≤5 * * ≤5 * * ≤5White 17 16 94.1 18 13 72.2 20 14 70.0 13 12 92.3 10 * 70.0 13 * 61.5 * * ≥95 * * 75.0 * * 85.7Two or more races * * ≥95 * * 66.7 * * ≥95 * * ≥95 * * 50.0 * * ≥95 * * ≤5 * * ≥95 * * ≤5Special Education 24 23 95.8 24 17 70.8 38 29 76.3 17 16 94.1 13 * 69.2 26 19 73.1 * * ≥95 11 * 72.7 12 10 83.3Limited English Proficient (LEP) * * ≥95 * * ≤5 * * ≤5 * * ≤5 * * ≤5 * * ≤5 * * ≥95 * * ≤5 * * ≤5Free/Reduced Meals (FARMS) * * ≥95 10 * 70.0 16 12 75.0 * * ≥95 * * 66.7 13 * 69.2 * * ≥95 * * 75.0 * * ≥95
# Tested # Prof. % Prof. # Tested # Prof. % Prof. # Tested # Prof. % Prof. # Tested # Prof. % Prof. # Tested # Prof. % Prof. # Tested # Prof. % Prof. # Tested # Prof. % Prof. # Tested # Prof. % Prof. # Tested # Prof. % Prof.All Students 30 22 73.3 38 25 65.8 29 22 75.9 21 16 76.2 26 18 69.2 18 12 66.7 * * 66.7 12 * 58.3 11 10 90.9American Indian or Alaska Native * * ≤5 * * ≤5 * * ≤5 * * ≤5 * * ≤5 * * ≤5 * * ≤5 * * ≤5 * * ≤5Asian * * ≤5 * * ≥95 * * ≤5 * * ≤5 * * ≥95 * * ≤5 * * ≤5 * * ≤5 * * ≤5Black or African American * * 83.3 10 * 60.0 * * 66.7 * * 75.0 * * 66.7 * * 50.0 * * ≥95 * * 50.0 * * ≥95Hispanic/Latino of any race * * 33.3 * * 33.3 * * ≥95 * * 50.0 * * 50.0 * * ≤5 * * ≤5 * * ≤5 * * ≥95Native Hawaiian or Other Pacific Islander * * ≤5 * * ≤5 * * ≤5 * * ≤5 * * ≤5 * * ≤5 * * ≤5 * * ≤5 * * ≤5White 18 15 83.3 22 16 72.7 20 15 75.0 13 12 92.3 15 11 73.3 12 * 66.7 * * 60.0 * * 71.4 * * 87.5Two or more races * * ≥95 * * ≤5 * * ≥95 * * ≤5 * * ≤5 * * ≥95 * * ≥95 * * ≤5 * * ≤5Special Education 30 22 73.3 38 25 65.8 29 22 75.9 21 16 76.2 26 18 69.2 18 12 66.7 * * 66.7 12 * 58.3 11 10 90.9Limited English Proficient (LEP) * * ≤95 * * ≤5 * * ≥95 * * ≤5 * * ≤5 * * ≤5 * * ≤5 * * ≤5 * * ≥95Free/Reduced Meals (FARMS) 11 * 72.7 12 * 50.0 10 * 80.0 * * 85.7 * * 62.5 * * 60.0 * * 50.0 * * 25.0 * * ≥95
2016
Table 2.13: Alternate Maryland School Assessment Performance Results - Science for Grade 5
Student GroupAll Students Male Female
2014 2015 2016 2014 2015 2016 2014 2015
Table 2.15: Alternate Maryland School Assessment Performance Results - Science for Grade 10
Student GroupAll Students Male Female
2014 2015 2016 2014 2015 2016 2014 2015 2016
Table 2.14: Alternate Maryland School Assessment Performance Results - Science for Grade 8
Student GroupAll Students Male Female
2014 2015 2016 2014 2015 2016 2014 2015 2016

# Tested # Prof. % Prof. # Tested # Prof. % Prof. # Tested # Prof. % Prof. # Tested # Prof. % Prof. # Tested # Prof. % Prof. # Tested # Prof. % Prof. # Tested # Prof. % Prof. # Tested # Prof. % Prof. # Tested # Prof. % Prof.All Students 4000 2837 70.9 3706 2662 71.8 3873 2817 72.7 2047 1383 67.6 1912 1351 70.7 2025 1455 71.9 1953 1454 74.4 1794 1311 73.1 1848 1362 73.7American Indian or Alaska Native 11 * 54.5 15 11 73.3 17 15 88.2 * * 33.3 * * 66.7 10 * 80.0 * * 62.5 * * 83.3 * * ≥95Asian 188 140 74.5 166 142 85.5 184 165 89.7 112 81 72.3 86 71 82.6 92 83 90.2 76 59 77.6 80 71 88.8 92 82 89.1Black or African American 618 278 45.0 550 270 49.1 511 240 47.0 324 126 38.9 302 139 46.0 284 130 45.8 294 152 51.7 248 131 52.8 227 110 48.5Hispanic/Latino of any race 462 265 57.4 440 250 56.8 541 319 59.0 250 136 54.4 208 117 56.3 249 153 61.4 212 129 60.8 232 133 57.3 292 166 56.8Native Hawaiian or Other Pacific Islander * * 75.0 * * 33.3 * * 62.5 * * ≥95 * * ≤5 * * ≥95 * * 50.0 * * 33.3 * * 57.1White 2522 2021 80.1 2362 1885 79.8 2450 1958 79.9 1270 985 77.6 1229 968 78.8 1311 1026 78.3 1252 1036 82.7 1133 917 80.9 1139 932 81.8Two or more races 195 124 63.6 167 102 61.1 162 115 71.0 86 52 60.5 78 50 64.1 78 54 69.2 109 72 66.1 89 52 58.4 84 61 72.6Special Education 580 154 26.6 577 169 29.3 582 168 28.9 396 109 27.5 363 121 33.3 360 120 33.3 184 45 24.5 214 48 22.4 222 48 21.6Limited English Proficient (LEP) 79 17 21.5 60 * 15.0 84 20 23.8 49 * 18.4 31 * 9.7 42 * 16.7 30 * 26.7 29 * 20.7 42 13 31.0Free/Reduced Meals (FARMS) 1089 501 46.0 971 450 46.3 1045 491 47.0 581 248 42.7 501 240 47.9 536 251 46.8 508 253 49.8 470 210 44.7 509 240 47.2
# Tested # Pass % Pass # Tested # Pass % Pass # Tested # Pass % Pass # Tested # Pass % Pass # Tested # Pass % Pass # Tested # Pass % Pass # Tested # Pass % Pass # Tested # Pass % Pass # Tested # Pass % PassAll Students 3386 2912 86.0 3905 3012 77.1 4316 2960 68.6 1702 1452 85.3 2052 1569 76.5 2183 1466 67.2 1684 1460 86.7 1853 1443 77.9 2133 1494 70.0American Indian or Alaska Native 14 14 ≥95 16 15 93.8 13 10 76.9 * * ≥95 * * ≥95 * * 62.5 * * ≥95 11 10 90.9 * * ≥95Asian 156 146 93.6 194 175 90.2 182 158 86.8 79 74 93.7 99 91 91.9 94 79 84.0 77 72 93.5 95 84 88.4 88 79 89.8Black or African American 430 318 74.0 494 287 58.1 641 338 52.7 232 164 70.7 278 151 54.3 342 169 49.4 198 154 77.8 216 136 63.0 299 169 56.5Hispanic/Latino of any race 358 285 79.6 476 324 68.1 664 344 51.8 170 132 77.6 231 156 67.5 324 184 56.8 188 153 81.4 245 168 68.6 340 160 47.1Native Hawaiian or Other Pacific Islander * * 66.7 * * ≥95 * * 80.0 * * ≤5 * * ≥95 * * ≥95 * * 66.7 * * ≥95 * * 75.0White 2278 2027 89.0 2567 2087 81.3 2600 1959 75.3 1142 1013 88.7 1367 1110 81.2 1307 957 73.2 1136 1014 89.3 1200 977 81.4 1293 1002 77.5Two or more races 147 120 81.6 152 119 78.3 211 147 69.7 70 60 85.7 69 54 78.3 107 71 66.4 77 60 77.9 83 65 78.3 104 76 73.1Special Education 379 186 49.1 569 202 35.5 713 173 24.3 245 131 53.5 358 141 39.4 448 128 28.6 134 55 41.0 211 61 28.9 265 45 17.0Limited English Proficient (LEP) 34 19 55.9 79 28 35.4 167 24 14.4 19 12 63.2 42 15 35.7 82 14 17.1 15 * 46.7 37 13 35.1 85 10 11.8Free/Reduced Meals (FARMS) 770 527 68.4 1039 587 56.5 1340 595 44.4 386 263 68.1 543 302 55.6 700 318 45.4 384 264 68.8 496 285 57.5 640 277 43.3
Table 2.16: Maryland High School Assessment Performance Results - Biology (All Administrations)
Student GroupAll Students Male Female
2014 2015 2016 2014 2015 2016 2014 2015 2016
Table 2.17: Maryland High School Assessment Performance Results - Government (All Administrations)
2015 20162015 2016 2014 2015 2016 2014Student GroupAll Students Male Female
2014

# Tested # Prof. % Prof. # Tested # Prof. % Prof. # Tested # Prof. % Prof. # Tested # Prof. % Prof. # Tested # Prof. % Prof. # Tested # Prof. % Prof. # Tested # Prof. % Prof. # Tested # Prof. % Prof. # Tested # Prof. % Prof.All StudentsAmerican Indian or Alaska NativeAsianBlack or African AmericanHispanic/Latino of any raceNative Hawaiian or Other Pacific IslanderWhiteTwo or more racesSpecial EducationLimited English Proficient (LEP)Free/Reduced Meals (FARMS)
# Tested # Prof. % Prof. # Tested # Prof. % Prof. # Tested # Prof. % Prof. # Tested # Prof. % Prof. # Tested # Prof. % Prof. # Tested # Prof. % Prof. # Tested # Prof. % Prof. # Tested # Prof. % Prof. # Tested # Prof. % Prof.All StudentsAmerican Indian or Alaska NativeAsianBlack or African AmericanHispanic/Latino of any raceNative Hawaiian or Other Pacific IslanderWhiteTwo or more racesSpecial EducationLimited English Proficient (LEP)Free/Reduced Meals (FARMS)
# Tested # Prof. % Prof. # Tested # Prof. % Prof. # Tested # Prof. % Prof. # Tested # Prof. % Prof. # Tested # Prof. % Prof. # Tested # Prof. % Prof. # Tested # Prof. % Prof. # Tested # Prof. % Prof. # Tested # Prof. % Prof.All StudentsAmerican Indian or Alaska NativeAsianBlack or African AmericanHispanic/Latino of any raceNative Hawaiian or Other Pacific IslanderWhiteTwo or more racesSpecial EducationLimited English Proficient (LEP)Free/Reduced Meals (FARMS)
Table 2.18: Multi-State Alternate Assessment - English Language Arts/Literacy for Grades 3-5
Student GroupAll Students Male Female
2016 2017 2018 2016 2017 2018 2016 2017 2018
Table 2.19: Multi-State Alternate Assessment - English Language Arts/Literacy for Grades 6-8
2017 20182017 2018 2016 2017 2018 2016Student GroupAll Students Male Female
2016
2017 2018
Table 2.20: Multi-State Alternate Assessment - English Language Arts/Literacy for Grade 11
Student GroupAll Students Male Female
2016 2016 2017 2018 2016 2017 2018

# Tested # Prof. % Prof. # Tested # Prof. % Prof. # Tested # Prof. % Prof. # Tested # Prof. % Prof. # Tested # Prof. % Prof. # Tested # Prof. % Prof. # Tested # Prof. % Prof. # Tested # Prof. % Prof. # Tested # Prof. % Prof.All StudentsAmerican Indian or Alaska NativeAsianBlack or African AmericanHispanic/Latino of any raceNative Hawaiian or Other Pacific IslanderWhiteTwo or more racesSpecial EducationLimited English Proficient (LEP)Free/Reduced Meals (FARMS)
# Tested # Prof. % Prof. # Tested # Prof. % Prof. # Tested # Prof. % Prof. # Tested # Prof. % Prof. # Tested # Prof. % Prof. # Tested # Prof. % Prof. # Tested # Prof. % Prof. # Tested # Prof. % Prof. # Tested # Prof. % Prof.All StudentsAmerican Indian or Alaska NativeAsianBlack or African AmericanHispanic/Latino of any raceNative Hawaiian or Other Pacific IslanderWhiteTwo or more racesSpecial EducationLimited English Proficient (LEP)Free/Reduced Meals (FARMS)
# Tested # Prof. % Prof. # Tested # Prof. % Prof. # Tested # Prof. % Prof. # Tested # Prof. % Prof. # Tested # Prof. % Prof. # Tested # Prof. % Prof. # Tested # Prof. % Prof. # Tested # Prof. % Prof. # Tested # Prof. % Prof.All StudentsAmerican Indian or Alaska NativeAsianBlack or African AmericanHispanic/Latino of any raceNative Hawaiian or Other Pacific IslanderWhiteTwo or more racesSpecial EducationLimited English Proficient (LEP)Free/Reduced Meals (FARMS)
2018 2016 2017 2018
Table 2.21: Multi-State Alternate Assessment - Mathematics for Grades 3-5
Student GroupAll Students Male Female
2016 2017 2018 2016 2017
2018
Table 2.22: Multi-State Alternate Assessment - Mathematics for Grades 6-8
Student GroupAll Students Male Female
2016 2017 2018 2016 2017 2018 2016 2017
2018 2016 2017 2018
Table 2.23: Multi-State Alternate Assessment - Mathematics for Grade 11
Student GroupAll Students Male Female
2016 2017 2018 2016 2017
MARYLAND’S GOALS, OBJECTIVES, AND STRATEGIES
P RE FACE The following section of the 2016 Master Plan Annual Update is submitted in accordance with requirements specified under House Bill 999, which includes goals, objectives, and strategies regarding the performance of students receiving special education services, students with limited English proficiency [LEP; hereafter, English language Learner (ELL)], and students failing to meet or failing to make progress towards meeting state performance standards. In lieu of state performance standards, local education agencies (LEAs) were instructed to compare student group data to the student population as a whole.
Goals/objectives, accomplishments, challenges, and strategies/changes are provided for each assessed content area (elementary and secondary, where applicable)—English language arts (ELA), mathematics, science, and social studies (secondary only).
It is important to note that while some content areas have specific goals and strategies for students receiving special education services and ELL students, many of the goals and strategies are implemented system-wide and pertain to all curricular areas. Thus, stand-alone sections, capturing these goals and strategies, are provided for special education and limited English proficiency.
I NT RODUCTI ON FCPS’s mission is to reach its students with exceptional teaching and caring support, challenge them to achieve their potential, and prepare them for success in a global society. FCPS developed its aspirational goals and priorities to help achieve this mission. As FCPS moves forward, it remains committed to ensuring equity and opportunity for all of its students.
In support of this commitment, FCPS restructured and announced the creation of a new department, Accelerating Achievement and Equity (AAE), during the 2015-2016 school year. The new department reflects FCPS’s commitment to student equity and allows the school system to focus resources on eliminating student achievement gaps. The AAE department goal is to promote student achievement and equity through culturally responsive classroom practices and resources that best meet the needs of a diverse student population. An accelerated and equitable learning environment enables students to become empowered learners and to understand and appreciate the community’s diverse cultures. It prepares students to live, learn, and participate productively in the increasingly diverse society. Being culturally aware is a continuous, integrated, multi-ethnic, multi-disciplinary process necessary for all students to become college and career ready.
Under the restructuring process, the AAE department oversees programs and services for advanced academics, ELL students, multicultural education, and special education and psychological services. AAE team members collaborate with curricular experts in the department of Curriculum, Instruction, and Innovation (CII) regarding the development, implementation, and enhancements of curricular and instructional experiences that support underperforming students and highly able learners. Both AAE and CII departments collaborate
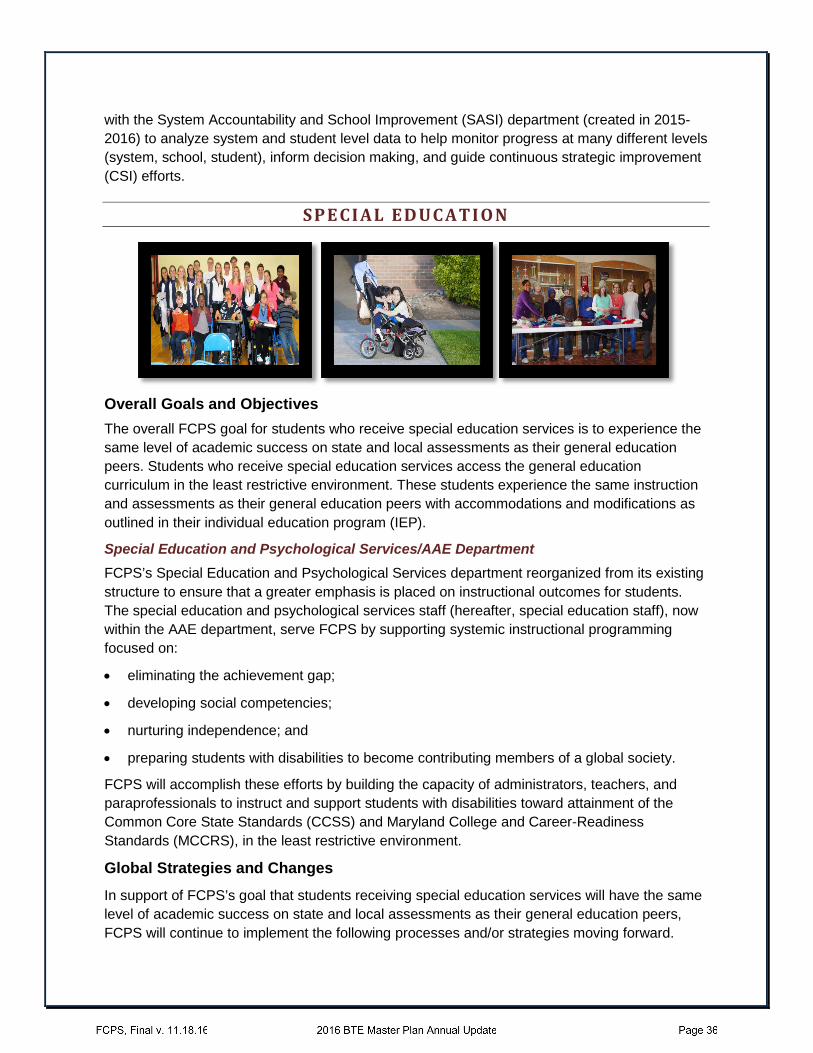
with the System Accountability and School Improvement (SASI) department (created in 2015-2016) to analyze system and student level data to help monitor progress at many different levels (system, school, student), inform decision making, and guide continuous strategic improvement (CSI) efforts.
SPE CI AL EDUC ATI ON
Overall Goals and Objectives The overall FCPS goal for students who receive special education services is to experience the same level of academic success on state and local assessments as their general education peers. Students who receive special education services access the general education curriculum in the least restrictive environment. These students experience the same instruction and assessments as their general education peers with accommodations and modifications as outlined in their individual education program (IEP).
Special Education and Psychological Services/AAE Department FCPS’s Special Education and Psychological Services department reorganized from its existing structure to ensure that a greater emphasis is placed on instructional outcomes for students. The special education and psychological services staff (hereafter, special education staff), now within the AAE department, serve FCPS by supporting systemic instructional programming focused on:
• eliminating the achievement gap;
• developing social competencies;
• nurturing independence; and
• preparing students with disabilities to become contributing members of a global society.
FCPS will accomplish these efforts by building the capacity of administrators, teachers, and paraprofessionals to instruct and support students with disabilities toward attainment of the Common Core State Standards (CCSS) and Maryland College and Career-Readiness Standards (MCCRS), in the least restrictive environment.
Global Strategies and Changes In support of FCPS’s goal that students receiving special education services will have the same level of academic success on state and local assessments as their general education peers, FCPS will continue to implement the following processes and/or strategies moving forward.

• Access to the General Education Curriculum. Students with disabilities participating in the Maryland state assessment, Partnership for Assessment of Readiness for College and Careers (PARCC), receive instruction and assessment with their general education peers. Instructional programs are implemented in collaboration with elementary and secondary general educators and special educators. Supplementary aids, services, and supports are monitored and provided, as necessary, for all students to access their individualized programs.
Accommodations for students with disabilities as listed in their IEPs and are implemented by general and special educators in collaboration with one another. FCPS developed a tutorial that is accessed by special educators, general educators, and instructional assistants to ensure that accommodations are implemented in instruction and assessment with fidelity to meet student needs.
Speech-language pathologists, school therapists, and school psychologists provide individual, small group, and whole class therapy sessions to students with disabilities in response to IEP needs. Curriculum material is incorporated into the sessions, as appropriate, to support the speech and language, mental health, emotional, and behavioral needs of students through evidence-based practice across all curricular areas.
• Collaboration with General Educators. Collaboration between general educators, special educators, speech-language pathologists, school psychologists, school therapists, and teacher specialists is implemented across all levels through IEP development and instructional delivery.
The special education staff in the AAE department work collaboratively with the CII department by conducting reconvening joint departmental meetings to plan for curriculum and instruction and to develop and plan for professional learning for special education and general education staff. Professional development opportunities are provided by the AAE and CII departments to all necessary stakeholders.
School leadership teams are trained in data analysis and include general and special educators in order to identify, service, and monitor student specific achievement. The teams not only include general and special educators but content specialists as well.
In FCPS, coteaching is highly valued and encouraged as the service delivery model that is most effective to close the achievement gap for students with disabilities.
• Strategies Used to Address the Achievement Gap. Data collection and analysis related to students identified with intellectual disabilities, emotional disabilities, and autism is ongoing. This process focuses on providing access to age and developmentally-appropriate instruction through culturally-relevant practices and strategies.
School teams analyze school-level data with the aim of determining services that best address student needs and promote student achievement. School psychologists and school therapists work closely with school staff and directly with students to ensure that students receive appropriate evidence-based interventions that target their areas of disability.

Additionally, the AAE department, in collaboration with the SASI department, analyzes student and school-level achievement data to ensure that student-specific IEP progress, formative and summative district assessments, and state-wide testing participation data are considered when developing student instructional programs and interventions.
• Interventions, Enrichments, and Supports to Address Diverse Learning Needs. All students, including students with disabilities, have access to any and all interventions for ELA that are currently recognized by FCPS. Students are placed into appropriate interventions (i.e., matched to their needs) based on data that are gathered from curricular assessments, educational assessments, and diagnostic assessments. Interventions are provided by multiple providers within buildings including, but not limited to, reading specialists, intervention teachers, special educators, and instructional assistants. To the
greatest extent possible, FCPS staff provide students with instruction using an inclusive service delivery model, allowing for students with disabilities to participate in daily instruction, intervention, and/or enrichment activities alongside their general education peers.
As part of the reorganization, additional staff and supports were added to enhance direct instructional support for teachers and paraprofessionals working with students with disabilities. The reorganization also provided for increased alignment and coordination of
services and supports for schools between the AAE and CII departments. In addition, a significant increase in professional learning for administrators, teachers, and paraprofessionals will be provided.
• Additional Staffing—Behavioral Intervention and Support. To address the needs of students with disabilities not accessing instruction due to social, emotional, and behavioral difficulties, the AAE department hired one coordinator and three additional behavior intervention/support teacher specialists. This additional staffing will not only provide direct support to teachers and students, but will also build capacity in staff to continue to meet student behavioral and emotional needs throughout the system.
• Additional Instruction and Intervention. In order for FCPS to eliminate the achievement gap and accelerate achievement for struggling learners, additional instruction and intervention beyond the core curriculum program is required.
• Professional Learning. All individuals working with students must be provided ongoing opportunities to grow as professionals. Special education teachers and paraprofessionals, administrators, and general education teachers will be equipped with the knowledge and tools necessary to support all students in order to increase student achievement.

Professional learning for special education paraprofessionals has been developed and scheduled in the following areas:
behavioral strategies
data collection
disability awareness
effective evidence-based instructional practices (EBIP)
fostering student independence
role of the special education paraprofessional
Professional learning for administrators, special education teachers, and general education teachers has been developed and scheduled in the following areas:
cultural proficiency
EBIP and strategies
MCCRS
Maryland Framework for Teaching
universal design for learning (UDL)
Monitoring of attendance and evaluation feedback at the conclusion of each training session will provide ongoing feedback to measure successful planning and implementation and to make necessary adjustments, as appropriate.
Resource Allocations Special education paraprofessionals, administrators, and educators need to be equipped with the knowledge and tools necessary to support all and increase student achievement. The following are activities and funds associated with targeted grants to improve the academic achievement outcomes of students receiving special education services.
• The Maryland State Department of Education (MSDE) Local Application of Federal Funds Grant continues to support professional learning and implementation of inclusive practices, as well as progress monitoring for instructional staff serving students (ages three to five). An effort for FCPS is to improve its early intervening services and increase inclusive opportunities for its youngest learners. For early learners, the continuum of services for preschool-aged children was increased by providing direct special education services to students in a less restrictive environment (whose profile deemed it necessary) and providing coaching and mentoring at preschool programs. (Costs: restricted, 170277-06, Early Childhood Connections 3-K, $45,838)
Early Childhood Connections (age three to kindergarten) funds will be used to purchase additional materials of instruction to support the opening of an additional inclusive early childhood classroom to accommodate the growing need for more classrooms due to increased enrollment.

• The MSDE Local Application of Federal Funds Grant supports professional learning opportunities for paraprofessionals. Targeted training will build capacity to support students with special needs in the general education setting in an effort to foster independence to close the achievement gap between students with disabilities and all students (i.e., the “all” student group). (Costs: restricted,170277-04, Utilizing Effective Evidence-based Instructional Practices, $79,382)
• The AAE department secured a group subscription, Read & Write for Google Chrome™, to support 3,000 students with disabilities. Students with disabilities will benefit from the use of this technology tool to gain confidence with reading, writing, studying, and research. (Costs: unrestricted, $30,000)
• The Transitional Planning Grant will provide ongoing professional learning to secondary administrators and teachers in the specialized programs for ongoing support, best practices, and resources related to emotional and comorbid disabilities, as it relates to employment activities for students. The focus is to move students through a process of self-awareness to self-advocacy. A parent component will include an information night to apprise parents of the instructional program. (Costs: restricted, 170277-04, Secondary Transition, $22,000)
LIM ITED E NG LIS H P ROFIC IENCY Overall Goals and Objectives FCPS ELL instruction promotes successful integration into mainstream academic programs for prekindergarten to grade 12 students whose first (or primary) language is not English and/or who have limited English language proficiency.
Office of English Language Learning As a result of 2015-2016 restructuring, the English Language Learning office is now within the AAE department. The office supports systemic instructional programming focusing on eliminating the achievement gap and helping all students to become contributing members of society. In support of this systemic effort, FCPS will build the capacity of administrators, teachers, and paraprofessionals to instruct and support
ELL students toward attainment of the MCCRS while attaining proficiency in English.
Global Strategies and Changes ELL students are assessed on the same content as all other students and scored in the same manner as all other students. ELL students also must take mainstream assessments after only one year in the United States. In addition, approximately 10-15% of elementary, 15-20% middle, and 25% of high school ELL students have limited or interrupted formal schooling upon

enrolling in FCPS. Therefore, success on PARCC assessments is an onerous challenge for this student group. PARCC assessments require strong academic language skills in the assessed areas. Research states that ELLs typically learn conversational English within one to two years; however, academic language/vocabulary skills take five to seven years on average to achieve success at grade level in English. ELL students with interrupted or no formal schooling can take seven to ten years to reach grade level English language literacy. This data holds true regardless of the student’s home language, country of origin, and socioeconomic status. In order for FCPS to accelerate achievement for ELL students, strategies and services beyond the core curriculum program will be required.
Three-Year ELL Achievement Plan A FCPS ELL summit was held in January 2015 where stakeholders began identifying areas of need and recommendations to meet the needs of ELL students in FCPS. This initiative led to the ELL office developing a three-year ELL achievement plan. The plan, created in 2015-2016, addresses dramatic growth in ELL students over the past ten years and efforts to decrease the achievement gap for this student group. The plan was a collaborative venture involving numerous FCPS stakeholders, including administrators, mainstream teachers, literacy specialists, curriculum specialists, counselors, department heads, and ELL staff members.
The plan focused on the following strategies:
• adding staffing as needed;
• enhancing use of technology;
• exploring additional college and career readiness options;
• focusing on administrative support;
• improving community outreach and parental engagement;
• offering professional learning, such as sheltered instruction observation protocol (SIOP) and credited MSDE courses related to ELL student achievement, for all stakeholders;
• providing social and emotional support to ELL students in need; and
• revamping the current instructional model at this level.
During and at the end of each year, the Three-Year ELL Achievement Plan is reviewed to monitor progress. Progress is also monitored by mainstream assessments and benchmarks already in place in content areas along with ELL assessments and formatives in corresponding courses. In addition, state-wide assessments provide additional information annually.
Additional Staffing and Support The ELL office/AAE department hired an instructional coordinator and a teacher specialist. The teacher specialist provides support to staff and students in high schools. Additionally, an ELL therapist was hired to support ELL students and their families. Many newly-enrolled ELL students experience physical and emotional trauma while traveling to the United States. Two additional coordinators were hired, one to coordinate services provided at the ELL office where

ELL students pre-enroll, interpreters and translations are provided, ELL language proficiency assessments are administered, and parent engagement activities are systematized.
Additional staffing will help reduce the ELL student-to-teacher ratios and allow a more collaborative effort with content area teachers. Additional administrative support will provide more professional learning opportunities, direct support to all teachers working with ELL students, and more efficient enrollment and assessment procedures to increase instructional time. The technology additions also will provide more diverse and rich instructional offerings. The revamped middle school ELL instructional model will greatly enhance collaboration among ELL and content area teachers while helping ELL students learn academic vocabulary more quickly. The social and emotional support for students in need will help students better adjust to their new school settings. Overall, the adjustments initiated will better equip staff members to support ELL students and increase their achievement.
Resource Allocations Table F provides a quick overview of the resource allocations provided as a result of implementing the Three-Year ELL Achievement Plan.
Table F. Three-Year ELL Achievement Plan and Resource Allocations
Resource Allocation Funding Amount Source of Funding
Seven additional ELL teachers • Approximately $50,000 per teacher
• Unrestricted
Additional administrative positions: ELL teacher specialist, ELL coordinator, International Office coordinator
• Cost-neutral due to reorganization
• Cost-neutral due to reorganization
Technology (Chromebooks) • $37,900 • Restricted
Professional learning: sheltered instruction observation protocol (SIOP), one-credit courses, and more
• $64,894 • $46,714
• Restricted • Unrestricted
Textbooks and resources to support middle school program
• $32,987 • Unrestricted
ELL therapist (social and emotional support) • Cost neutral due to reorganization
• Cost neutral due to reorganization
Coordinator of Family Partnerships/Community Partnerships (outreach and engagement)
• Cost-neutral due to reorganization
• Cost-neutral due to reorganization
Progress on ACCESS for ELLs 2.0
The following reports the progress of ELL students on the WIDA™ Assessing Comprehension and Communication in English State-to-State for English Language Learners (ACCESS for ELLs) 2.0 assessment in developing and attaining English language proficiency and achievement in reading/language arts and mathematics.

AMAO 1—Making Progress Towards Proficiency in English For making annual measurable achievement objective (AMAO) 1 progress, Maryland uses an overall composite proficiency level obtained from the ACCESS for ELLs 2.0 assessment. Students are considered to have made progress if their overall composite proficiency level on the ACCESS for ELLs 2.0 is 0.5 or higher than the overall composite proficiency level from the previous year’s assessment administration. In order to meet the Indicator 1 target for school year 2015-2016, LEAs must show that 57% of ELLs made progress.
Table G below illustrates FCPS’s progress made in meeting AMAO 1 for the past three school years. Data for school year 2015-2016 are not yet available. For the past three years, FCPS ELL students exceeded the state’s targets for progressing toward English proficiency.
Table G. ELL Students—MSDE Criteria and Targets for AMAO I ACCESS FOR ELLS—COMPOSITE PROFICIENCY LEVEL GAIN (0.5)
School Year State Target (%) FCPS % Met or Not Met
2012-13 54% 63.47% Met
2013-14 55% 69.36% Met
2014-15 56% 62.60% Met
2015-16 57% Not available yet Not available yet
The most challenging areas for ELL students on the ACCESS for ELLs 2.0 assessment are reading and writing; students continue to show strong progress in listening and speaking on this assessment.
AMAO 2—Attaining Proficiency in English For determining AMAO 2 attainment, Maryland uses an overall composite proficiency level and a literacy composite proficiency level obtained from the ACCESS for ELLs 2.0 assessment. Students are considered to have attained English proficiency if their overall composite proficiency level is 5.0 and literacy composite proficiency level is 4.0 or higher. In order to meet the Indicator 2 target for school year 2015-2016, LEAs must show that 15% of ELLs have attained proficiency.

Table H illustrates FCPS’s progress made in AMAO 2 for the past three school years. Data for school year 2015-2016 are not yet available. For the past three years, FCPS ELL students exceeded the state’s targets for attaining proficiency in English.
Table H. ELL Students—MSDE Criteria and Targets for AMAO 2 ACCESS FOR ELLS—COMPOSITE PROFICIENCY LEVEL (5.0) AND
LITERACY PROFICIENCY LEVEL (4.0)
School Year State Target (%) FCPS % Met or Not Met
2012-13 11% 21.70% Met
2013-14 12% 28.07% Met
2014-15 14% 20.61% Met
2015-16 15% Not available yet Not available yet
The most challenging areas for ELL students on the ACCESS for ELLs 2.0 assessment are reading and writing; students continue to show strong progress in listening and speaking on this assessment.
AMAO 3—Making Progress in Math and Reading for ELL Students Table I illustrates whether or not ELL students have made progress toward Maryland’s accountability measures. Progress in meeting reading and math AMO targets for ELL students in 2015-2016 is unknown as data were not available as of this writing. FCPS did not meet these targets in 2012-2013 and 2013-2014.
Table I: ELL Students—Progress on Reading and Math AMO Targets MARYLAND SCHOOL ASSESSMENT
School Year State
Reading ELL AMO %
FCPS ELL %
Met or Not Met
State Math
AMO % FCPS ELL
% Met or Not
Met
2012-2013 84.6% 73.4% Not Met 80.4% 69.4% Not Met
2013-2014 82.9% 78.0% Not Met 78.3% 57.8% Not Met
2014-2015 * * * * * *
2015-2016 * * * * * *
* 2014-2015 and 2015-2016 results are not available as MSA Math and Reading were not administered. No AMAOs have been established for PARCC.
The data, rationale, timelines, strategies, and specific resource allocations used to ensure that ELLs meet the targets for the AMAOs are discussed in the goals, accomplishments, challenges, and strategies sections above.
M ONIT ORING /ME ASU RI NG P ROGRE SS To monitor and track the progress of global strategies and plans specific to student groups, as well as provide evidence, FCPS will carry out the following activities in the next year:

• Quarterly reviews will be conducted for each content area utilizing local assessment data (formative framework). Curriculum staff, assessment and improvement staff, and instructional directors will be included in this process.
• School CSI teams are required to conduct regular progress reviews of their own strategies and report formative data within their fluid plans. Implementation of strategies are monitored through informal walk-through tools and quantitative formative data.
• Quarterly visits are conducted by instructional directors. Meetings are held with principals to discuss progress and to discuss any adjustments that are needed related to the strategies.
• Monthly meetings for math and ELA and quarterly meetings for science and social studies are held by central content specialists with school-based liaisons (e.g., literacy specialists, math specialists, department chairs, etc.) to discuss progress of strategies that have been implemented.
In all scenarios, FCPS embraces the continuous strategic process. Joint directors across all FCPS departments within the ACTS division meet weekly to ensure successful implementation of noted strategies and achievement results. This group will adjust professional learning plans, provide clarification in communications, and/or address any barriers to successful implementation of strategies.
P ARCC E NG LIS H LANG UAGE ARTS / LITE RACY Grad es 3-5
Overall Goals and Objectives FCPS is committed to ensuring that all students become independent readers and writers for many different purposes. Students will use their literacy skills to negotiate an increasingly complex and information-rich world. Students will refine and apply their knowledge of reading, writing, speaking, and listening by engaging in a variety of diverse texts and writing for authentic purposes and audiences. Students will find joy in reading and writing.
The FCPS elementary ELA program is based on research and best practices for instruction and assessment. The goals and objectives of FCPS elementary ELA program are to:
• Produce independent and strategic readers and writers.
• Provide students with the necessary foundational skills in reading and writing.
• Accelerate the reading and writing achievement of all students in language arts.

• Differentiate for students who are not yet meeting language arts expectations.
• Provide teachers curricular resources and assessments that are aligned to the MCCR frameworks.
Overall Accomplishments A review of data from the 2015 and 2016 administrations of PARCC reflects several accomplishments in elementary ELA. FCPS outperformed the state in PARCC in each performance band (i.e., levels 4-5 and 3-5) for grades 3-5 ELA in both years. In addition, students in grades 3-5 who identified as black/African American, Hispanic/Latino, and those receiving FARM outperformed the state in elementary ELA. See Tables 2.1a-2.1c for FCPS elementary ELA PARCC results.
Grade 3 ELA PARCC Performance Bands
• 2015—Levels 3-5: 76.7% and 60.1%; Levels 4-5: 56.2% and 38.1% (FCPS and state, respectively)
• 2015—Levels 3-5: black/African American: 66.9% and 46.8%; Hispanic/Latino: 58.9% and 42.6%; FARM: 57.8% and 42.7% (FCPS and state, respectively)
• 2016—Levels 3-5: 72.1% and 59.4%: and Levels 4-5: 48.3% and 37.5% (FCPS and state, respectively)
• 2016—Levels 3-5: black/African American: 61.8% and 44.4%% Hispanic/Latino: 55.5% and 43.4% and FARM: 54.6% and 42.0% (FCPS and state, respectively)
Grade 4 ELA PARCC Performance Bands
• 2015—Levels 3-5: 77.3% and 67.2%; Levels 4-5: 49.4% and 40.1% (FCPS and state, respectively)
• 2015—Levels 3-5: black/African American: 65.5% and 52.1%; Hispanic/Latino: 58.8% and 52.7%; FARM: 57.4% and 50.0% (FCPS and state, respectively)
• 2016—Levels 3-5: 78.8% and 66.7% Levels 4-5: 52.5% and 40.3% (FCPS and state, respectively)
• 2016—Levels 3-5: black/African American: 65.9% and 52.7% Hispanic/Latino: 64.6% and 53.4% FARM: 60.7% and 50.6% (FCPS and state, respectively)
Grade 5 ELA PARCC Performance Bands
• 2015—Levels 3-5: 77.6% and 67.2%; Levels 4-5: 49.8% and 40.0% (FCPS and state, respectively)
• 2015—Levels 3-5: black/African American: 64.8% and 51.7%; Hispanic/Latino: 59.3% and 53.6%; FARM: 57.4% and 49.6% (FCPS and state, respectively)
• 2016—Levels 3-5: 77.9% and 65.9% Levels 4-5: 51.2% and 39.4% (FCPS and state, respectively)

• 2016—Levels 3-5: black/African American: 66.7% and 50.2% Hispanic/Latino: 64.9% and 53.0% FARM: 58.5% and 48.4% (FCPS and state, respectively)
In addition to overall PARCC performance levels, PARCC sub-claims, i.e., components of the ELA assessment, are available for analysis. For ELA, these sub-claims are reading information, reading literature, reading vocabulary, written expression, and written knowledge of language. In analyzing these data, there appears to be a strong percent of students who met or exceeded expectations on the PARCC sub-claims. For elementary grades, similar performance in reading informational or literacy text continues to be evident. Sub-claim data in 2016 suggest that grade 3 and 5 students have more difficulties with written expression (i.e., the greatest percent of students falling below students performing at level 3) while grade 4 students have more difficulty in knowledge and use of language.
Special Education Students Goals and Objectives The goals and objectives for students with disabilities in grades 3-5 ELA are consistent with the overall goals and objectives for all FCPS students receiving special education services. Accomplishments The 2015 and 2016 PARCC data reflected success in elementary ELA among students with disabilities when compared to the state performance. In 2015, students receiving special education services in grades 3 and 5 outperformed the state in elementary ELA (30.0% and 22.8%; 22.9% and 20.8%, respectively). In 2016, students with disabilities in grades 3, 4, and 5 outperformed the state (27.0% and 21.9%; 29.3% and 24.6%; 24.5% and 20.8%, FCPS and state, respectively).
Challenges Despite a positive comparison to state performance, challenges still remain with students receiving special education services. When comparing both performance bands 3-5 and 4-5 for FCPS students receiving special education services (grades 3-5) and all FCPS students (grades 3-5), data showed a significant gap in performance in both 2015 and 2016 (see Table 2.1a).
• 2015 ELA grades 3-5 (performance bands)—Levels 3-5: 77.2%% and 25.0%%; Levels 4-5: 51.9% and 9.1% (all FCPS students and students receiving special education services, respectively)
• 2016 ELA grades 3-5 (performance bands)—Levels 3-5: 76.2% and 27.0%; Levels 4-5: 50.6% and 10.9% (all FCPS students and students receiving special education services)

Strategies or Changes Elementary literacy program guidelines were developed to provide additional instructional time with teachers who possess a comprehensive expertise in ELA/literacy. As a result of additional instructional time, FCPS anticipates an increase in elementary reading scores towards meeting established benchmarks on local and state assessments via quarterly assessments and mid- and end-of-year assessment cycles.
In addition, systemic strategies are being implemented to ensure progress among students receiving special education services in elementary ELA. Refer to Global Strategies or Changes in the Special Education section.
Limited English Proficient Students Goals and Objectives The goals for ELL students in grades 3-5 ELA are consistent with the overall goals and objectives for all FCPS ELL students.
Accomplishments ELL students in grade 3 (28.9%) outperformed the state (19.7%) in PARCC ELA in 2015 (i.e. performance band 3-5). As well, ELL students in grades 3 and 4 outperformed the state in PARCC ELA (31.5% and 23.7%; 23.5% and 18.4%, respectively). From 2015 to 2016, the percent of ELL students in performance band 3-5 increased from 20.4% to 25.1% (see Table 2.1a).
Challenges ELL students in grades 3-5 comprise approximately 4-5% (4.1% in 2015 and 4.5% in 2016) of all students in that grade band. The performance of the ELL student group was slightly less than the students receiving special education services. Only 20.4% of ELL students earned a score of three or higher on the PARCC ELA assessment in 2015 and 25.1% in 2016. Male and female ELL students had similar levels of achievement in 2015; however, female ELL students (28.7%) outperformed the male ELL students (22.1%) in 2016 (see Tables 2.1b and 2.1c).
Success on PARCC assessments can be a challenge for ELL students who experienced very little to none (or interrupted) formal schooling prior to FCPS enrollment. PARCC assessments require strong academic vocabulary skills in the assessed area. ELL students with lack of formal schooling can take several years to reach grade level English language literacy.
Strategies or Changes Systemic strategies are being implemented to ensure progress among ELL students in elementary ELA. Refer to Global Strategies or Changes in the Limited English Proficiency section.
Progress on ACCESS for ELLs See Progress on ACCESS for ELLs 2.0 in Limited English Proficiency section.
Despite reading and writing being the most challenging for ELL students on the ACCESS for ELLs 2.0 assessment, FCPS is encouraged by the performance of ELL students in grade 3 on

the PARCC assessment as they outperformed the state. This performance indicates that ELL students’ progress in learning English is impacting achievement on academic measures.
Students Failing to Meet or Make Progress Towards Meeting State Performance Standards
With this baseline data, curriculum specialists can only identify segments of the student population that are performing at a lower achievement level than the student population as a whole. The following student groups are identified as performing at a lower achievement level than the overall student population: black/African American, Hispanic/Latino, and students receiving special education services, ELL services, and FARM.
Goals and Objectives The goals and objectives for students failing to meet or make progress towards meeting state performance standards are similar to the overall goals for all FCPS elementary ELA students. In addition to these overall goals, the following are specific goals related to reading intervention.
Elementary ELA reading invention aims to:
• Encourage administrators to place highly qualified instructional teachers in reading intervention positions.
• Develop an elementary intervention placement guide for appropriate intervention program assignment.
• Provide elementary intervention trainings to support curriculum connections, data literacy, and student self-regulation.
• Train elementary interventionists on developing, implementing, and monitoring customized EBIP to address students’ specific reading needs.
• Support and monitor elementary intervention tagging within the student information system (SIS) for progress monitoring and longitudinal intervention history.
• Encourage collaboration between special education and ELL staff in the AAE department for consistency with intervention expectations and delivery.
Accomplishments Black/African American, Hispanic/Latino, and students receiving FARM outperformed the state in grades 3-5 for ELA (see Overall Accomplishments for PARCC ELA Grades 3-5). In addition, students receiving special education services in grades 3 and 5 outperformed (i.e., PARCC performance band 3-5) the state in 2015 and in 2016 (see Overall Accomplishments for Special Education Students in PARCC ELA Grades 3-5). Additionally, PARCC performance for ELL students increased in the last two years when looking at performance band 3-5.

Challenges Students receiving special education services and ELL students are not meeting state performance standards. A coherent instructional delivery model that connects the intervention to general education classroom instruction will continue to be important. Providing professional learning for all instructional stakeholders to understand the rigor and expectations of the MCCRS frameworks requires time and funding. Another challenge involves implementing literacy best practices necessary for accelerating struggling readers. This requires consistency with both intervention programs matched to the general education classroom
expectations. Materials for instruction and materials for necessary intervention remain limited in scope and quantity. The frameworks require all students to read and comprehend complex texts at their grade level. Accessibility to high quantity and high quality reading materials remains significantly below what research shows is needed to accelerate growth.
Strategies or Changes The following are strategies that will either be newly implemented or continued moving forward to ensure the progress of students who are failing to meet or make progress towards state performance standards.
• Kindergarten-Grade 5 Guide to Support ELL Writers. Elementary ELA curriculum staff created the K-5 Best Practice Guide for Supporting ELL Writers during 2015 summer curriculum workshops. The guide was developed by a group of classroom teachers, literacy specialists, and ELL teachers. Unrestricted funds (curriculum writing funds) were used to pay the teachers to participate in the workshop. The total cost of the workshop was $2,549.
The local on-demand writing assessment (administered three times per year) measures student growth in writing craft and writing mechanics. The guide was developed to help

teachers to plan appropriate instruction. It addresses materials, writing partnerships, mini-lesson guidance, conferencing, and celebrations/goal setting. The guide stresses the importance of the coteaching model utilizing the ELL teacher and the general education teacher to best meet the language needs of ELL students.
• Grade 2-5 Comprehensive Strategy Instruction. All students need access and exposure to grade level standards. From October 2014 to summer 2015, teachers developed comprehension strategy instruction seed lessons for grades 2-5. Unrestricted funds (curriculum writing funds) were used to pay the teachers to participate in the workshop. The total cost of the project was $10,105.
Optional formative assessments are available to grades 2-5 in a pre/post format for quarters one and two. The assessments are aligned to quarterly curriculum maps that address the 10 reading standards. The lessons were created to provide models of how to access and comprehend grade level complex text. The 10 reading standards, specifically R10 (Read and comprehend complex literary and informational texts independently and proficiently), prompted the creation of comprehension strategy instruction grades 2-5 lessons.
• Prekindergarten-Grade 5 Assessment Information. Assessment information documents for prekindergarten through grades 5 were developed during 2015 summer curriculum workshops. The documents were developed by a group of classroom teachers and literacy specialists. Unrestricted funds (curriculum writing funds) were used to pay the teachers to participate in the workshop. The total cost of the workshop was $6,797.
A state and local focus on reducing and/or eliminating redundant assessments facilitated the creation of prekindergarten through grade 5 assessment information documents. The assessment information documents were designed to support teachers to understand best practices to implement before, during, and after an assessment is administered as well as how to respond to the assessment results. Teacher guidance related to student goal setting, parent communication, and instructional planning guidance were included. The documents were initially implemented in August 2015. The documents will be implemented moving forward and are aligned to local assessment schedules.
• Local Accommodations for Special Services. Clarification on assessment accommodations was provided to better address the needs of student groups (e.g., ELL and students receiving special education services). Additionally, the assessment information documents for the local on-demand writing assessment clarifies accommodation guidance.
In addition, elementary ELA will continue to focus on strategies specific to reading intervention goals, which will include focusing on highly qualified teaching, appropriate intervention program guide, professional learning/training for interventions, data analysis and monitoring, and ongoing collaborations with AAE departmental staff.
Specifically, the elementary intervention placement guide was completed by a select group of teacher during 2015 curriculum workshops. The placement guide was developed to focus on utilizing the optional reading assessments to support appropriate placement and progress monitoring. Optional foundational skills assessments are recommended to provide additional diagnostic information for students’ specific needs. The guide will help school staff more

accurately match the intervention to the student needs. Unrestricted funds (curriculum writing funds) were used to pay the teachers to participate in the workshop. The total cost of the workshop was $3,398.
Additional resource allocations related to reading intervention include the following: • Leveled Literacy Intervention (LLI) Blue was purchased for schools as a systemic
intervention program offered at all elementary schools. Unrestricted funds were used to purchase and ship. The total cost was $83,538.
• Additional LLI materials were purchased to supplement existing resources at various grade levels. Unrestricted funds were used to purchase and ship. The total cost was $26,120.64.
P ARCC E NG LIS H LANG UAGE ARTS / LITE RACY Grad es 6-8
Like elementary ELA, the FCPS secondary ELA program supports the goal of ensuring that all students are independent readers, writers, and critical thinkers. In addition to finding joy in reading and writing, the secondary ELA program focuses on students working toward college and career readiness as they progress through the curriculum.
Overall Goals and Objectives
The FCPS middle school ELA program is based on research and best practices for instruction and assessment that enable students to be successful in the 21st century. Specifically, and similar to elementary ELA, the middle school ELA program aims to:
• Produce independent and strategic readers, writers, and critical thinkers.
• Provide students with the necessary skills to read and analyze a wide variety of increasingly challenging texts including poems, short stories, nonfiction and novels.
• Teach students to respond to both fiction and nonfiction by writing to express ideas via argumentative, narrative and explanatory formats.
• Accelerate the reading and writing achievement of all students in ELA.
• Differentiate for students who are not yet meeting language arts expectations.

• Provide curricular resources and assessments that are aligned to the MCCRS frameworks for ELA.
Overall Accomplishments
Data from the 2015 and 2016 administration of PARCC reflects several accomplishments. FCPS outperformed the state in grades 6-8 ELA. See Tables 2.2a-2.2c for FCPS ELA grades 6-8 PARCC results.
Grade 6 ELA PARCC Performance Bands
• 2015—Levels 3-5: 79.3% and 66.4%; Levels 4-5: 48.1% and 36.1% (FCPS and state, respectively)
• 2016—Levels 3-5: 73.8% and 66.3%; Levels 4-5: 44.0% and 37.0% (FCPS and state, respectively)
Grade 7 ELA PARCC Performance Bands
• 2015—Levels 3-5: 67.7% and 63.6%; Levels 4-5: 40.2% and 38.6% (FCPS and state, respectively)
• 2016—Levels 3-5: 73.2% and 64.6%; Levels 4-5: 48.2% and 39.4% (FCPS and state, respectively)
Grade 8 ELA PARCC Performance Bands
• 2015—Levels 3-5: 68.9% and 64.3%; Levels 4-5: 41.0% and 40.4% (FCPS and state, respectively)
• 2016—Levels 3-5: 71.8% and 63.1%; Levels 4-5: 47.3% and 38.6% (FCPS and state, respectively)
In addition, data from the 2016 PARCC administration reflects a strong percentage of students who met or exceeded expectations on the PARCC ELA grades 6-8 sub-claims. Similar to elementary ELA, the data show there is a balanced performance on whether students are reading information or literary text. Written expression and knowledge and use of language are two areas where students have the most difficulty.
Special Education Students
Goals and Objectives The goals for students receiving special education services in grades 6-8 ELA are consistent with the overall goals for all FCPS students receiving special education services.
Accomplishments Students receiving special education services in grades 6-8 outscored state scores when analyzing data in the performance band of 3-5 in 2015 and 2016.
Challenges Data from the 2015 administration of PARCC ELA grades 6-8 indicate that 19.4% of students who have disabilities were in the performance band 3-5 in comparison to 72% of all FCPS students. In 2016, 20.6% of students with disabilities performed at a level three or higher on

PARCC compared to 72.9% of all FCPS students. Thus, approximately 80% of students with disabilities who participated did not meet or partially met expectations.
Strategies or Changes Secondary literacy program guidelines were developed to provide students who are experiencing challenges additional instructional time with teachers who possess a comprehensive expertise in ELA/literacy. As a result of additional instructional time, FCPS anticipates an increase in middle school reading scores towards meeting established benchmarks on local and state assessments via quarterly assessments and mid/end of year assessment cycles.
In addition, systemic strategies are being implemented to ensure progress among students receiving special education services in secondary ELA. Refer to Global Strategies or Changes in the Special Education section.
Limited English Proficient Students
Goals and Objectives The goals for ELL students in grades 6-8 ELA are consistent with the overall goals and objectives for all FCPS ELL students.
Accomplishments While FCPS ELL students ranked third in the state in grade 6 ELA (performance band 3-5) in 2015, large gaps remain between all FCPS students and ELL students. Note: 2016 PARCC data for county performance comparison were not available at the time of this writing. Challenges Success on PARCC assessments can be a challenge for ELL students who experienced very little to none (or interrupted) formal schooling prior to FCPS enrollment. PARCC assessments require strong academic vocabulary skills in the assessed area. ELL students with lack of formal schooling can take several years to reach grade level English language literacy.
Strategies or Changes Systemic strategies are being implemented to ensure progress among ELL students in secondary ELA. Refer to Global Strategies or Changes in the Limited English Proficiency section.
Progress on Access for ELLs See Progress on ACCESS for ELLs 2.0 in Limited English Proficiency section.

Students Failing to Meet or Make Progress Towards Meeting State Performance Standards
The following student groups are identified as performing at a lower achievement level in grades 6-8 ELA when compared to the overall student population: black/African American, Hispanic/Latino, and students receiving special education services, ELL services, and FARM.
Goals and Objectives Identifying sound, research-based instructional strategies and making them available to all student populations are the main goals for eliminating the achievement gap. The continued use of UDL as well as the move toward more personalized
learning help support classroom instruction. Early identification of students who need extra support as well as continued work with the AAE and SASI departments round out goals for helping students make progress toward meeting state performance goals.
Additional goals related to reading intervention include the following: • Encourage administrators to place highly qualified instructional teachers in reading
intervention positions.
• Reinforce the recommended research-based delivery model for secondary intervention programs.
• Provide secondary intervention trainings to support curriculum connections, data literacy, and student self-regulation.
• Train secondary interventionists on utilizing embedded intervention materials.
• Support and monitor secondary intervention courses within the SIS for progress monitoring on local assessment performance.
• Collaborate with ELL and special education staff in the AAE department for consistency with intervention expectations and delivery.
Accomplishments The 2015 noteworthy accomplishments among students failing to meet or make progress toward meeting state performance standards in ELA/literacy for grades 6-8 include:
• Black/African American students in grades 6 and 7 outperformed the state in PARCC performance band 3-5; Black/African American students in grades 6 ranked second in the state in PARCC performance band 3-5.
• Hispanic/Latino students in grade 6 outperformed the state and ranked third in the state in PARCC performance band 3-5 in 2015.

• Students in grades 6-8 who received special education services outperformed the state in PARCC performance band 3-5 in 2015.
• In 2015, students in grade 6 receiving FARM outperformed the state and ranked second in the state in PARCC performance band 3-5.
• Grade 6 ELL students outperformed the state and ranked third in the state in PARCC performance band 3-5 in 2015.
Note: 2016 PARCC data for county performance comparison were not available at the time of this writing.
Challenges Black/African American, Hispanic/Latino, students with disabilities, students receiving FARM, and ELL students are not meeting state standards by a large margin. Likewise, male students are not performing as well as their female counterparts (see Tables 2.2b and 2.2c).
One challenge prohibiting these student groups from progressing involves a coherent instructional delivery model that connects the intervention to the general education classroom. In-servicing all instructional stakeholders to understand the rigor and expectations of the college and career ready frameworks for ELA requires time and funding.
Another challenge involves implementing literacy best practices necessary for accelerating struggling readers. This requires consistency with intervention programs matched to the general education classroom expectations.
Materials for instruction and materials for necessary intervention remain limited in scope and quantity. Maryland’s college and career ready frameworks for ELA require all students to read and comprehend complex texts at their grade level. Accessibility to high volume and high quality reading materials remains significantly below what research says is needed to accelerate growth.
Strategies or Changes
UDL and other research-based, high-yield instructional strategies, reading intervention opportunities, curriculum supporting the college and career ready frameworks for ELA, and professional development based on teachers’ needs will continue to be the mainstay of the instructional program in ELA grades 6-8.
Other strategies include: • ELL Instructional Strategies. ELL-friendly instructional strategies will be infused into
existing curriculum maps. With ELL student achievement being a systemic focus, ELA and ELL teachers worked collaboratively to infuse ELL best practices into existing curriculum maps in grades 6–8.
• Personalized Learning. A move toward more personalized educational opportunities for students is being implemented with blended learning as the backbone of this shift. Personalized learning through blended learning enables students to take more control over their learning and thus become more engaged in the learning process.

• Scaffolded Writing Instruction.
• MCCRS Aligned Benchmarks. All students scored lower than anticipated in the writing categories on PARCC. Formative and summative benchmarks, aligned to MCCRS, with anchor papers will be implemented. These benchmarks require standards to be rigorous while yielding data to adjust instruction.
• Collaborations with AAE Department. Special education and ELL staff are now under the AAE department. The secondary ELA program will continue or increase its collaborative work with the AAE department.
• Cultural Proficiency. The systemic focus on cultural proficiency will be woven into instruction. Cultural proficiency will enable teachers to be more aware of their students’ backgrounds and instructional needs.
In addition, the middle school ELA program will target strategies specific to overall reading intervention goals, which will include focusing on highly qualified teaching, research-based delivery model, professional learning/training for secondary interventions, data analysis and monitoring, and ongoing collaborations with AAE departmental staff.
• Progress Monitoring. During the 2015-2016 school year, additional trainings were provided to utilize the student achievement manager (SAM), which gathers data from the Reading Inventory and the Read 180 intervention program, for monitoring student progress and accessing instructional resources. Read 180 consumables were purchased for schools as a systemic intervention program offered at all secondary schools. Unrestricted funds were used to purchase and ship. The total cost was $33,544.
• Delivery Model. Select teachers completed a secondary planning and pacing guide that reinforces the need for the recommended research-based delivery model during the 2015 summer curriculum workshops. Unrestricted funds (curriculum writing funds) were used to pay the teachers to participate in the workshop. The total cost of the workshop was $2,124.
• Technical Support. Scholastic program technical support was also purchased to support intervention for secondary schools. Unrestricted funds were used; the total cost was $59,590.
• Training. All middle school ELA teachers received training on the changes at a curriculum day in August 2015. All ELA curriculum revisions for grades 6-8 came from unrestricted funding sources and were products of summer curriculum writing workshops at a cost of approximately $20,000.
The strategies and changes described above were to be implemented into instruction in the 2015-2016 school year. Changes and ongoing training sessions related to the changes will continue moving forward.

P ARCC E NG LIS H Grad e 10
Overall Goals and Objectives FCPS high school English program is based on research and best practices for instruction and assessment that enable students to be successful in the 21st century. The goals and objectives of FCPS high school English program are similar to middle school ELA (see Overall Goals and Objectives in PARCC English Language Arts/Literacy, Grades 6-8).
Overall Accomplishments Data for PARCC English 10 reflects several accomplishments: • All students in FCPS (50.7%, 56.0%) outperformed the state (39.7%, 44.4%) in PARCC
performance band 4-5 (2015 and 2016, respectively).
• All students in FCPS (69.4%, 73.8%) outperformed the state (60.6%, 63.6%) in PARCC performance band 3-5 (2015 and 2016, respectively).
• FCPS ranked fourth in the state on PARCC English 10 when comparing PARCC performance band 4-5 in 2015.
• FCPS ranked sixth in the state on PARCC English 10 on PARCC performance band 3-5 in 2015.
Data also reflect a strong percentage of students who met or exceeded expectations on the PARCC sub-claims.
Special Education Students
Goals and Objectives The goals and objectives for students with disabilities in secondary ELA are consistent with the overall goals and objectives for students with disabilities in FCPS.
Accomplishments
• Approximately 25-30% of students with disabilities who participated in the PARCC 10 ELA assessment earned a score of 3 or higher (25% in 2015 and 29.3% in 2016). See Tables 2.4a-2.4c for PARCC English 10 results.
• Students receiving special education services outscored the state in performance bands 3-5 and 4-5 in 2015 and 2016.
• Students receiving special education services ranked second in the state in performance band 4-5 in 2015.
• Students receiving special education services ranked fifth in performance band 4-5 in 2015.
Challenges A significant performance gap exists between students with disabilities (25.1%) and all FCPS students (69.4%) in 2015. This gap continues to be evident by the 2016 PARCC results.

Strategies or Changes FCPS has developed secondary literacy program guidelines that provide students who are experiencing challenges additional instructional time with teachers that possess a comprehensive expertise in ELA/literacy. As a result of additional instructional time, FCPS anticipates an increase in student performance on high school reading assessments towards meeting established benchmarks on local and state assessments via quarterly assessments and mid/end of year assessment cycles.
Most high schools in FCPS instituted a new schedule in the 2016-2017 school year that includes an extension/reteaching time for teachers to pull students for direct interventions. These direct interventions are likely to benefit all learners.
In addition, systemic strategies are being implemented to ensure progress among students receiving special education services in secondary ELA. Refer to Global Strategies or Changes in the Special Education section.
Limited English Proficient Students Goals and Objectives The goals and objectives for ELL students in secondary ELA are consistent with the overall goals and objectives for all FCPS ELL students.
Accomplishments Accomplishments of students failing to meet or make progress toward meeting state performance standards in ELA/literacy for grade 10 include:
• ELL students ranked first in the state in performance band 4-5 in 2015.
• ELL students ranked third in the state in performance band 3-5 in 2015.
Challenges Data show that large gaps still remain between all FCPS and ELL students. Success on PARCC assessments can be a challenge for ELL students who experienced very little to none (or interrupted) formal schooling prior to FCPS enrollment. PARCC assessments require strong academic vocabulary skills in the assessed area. ELL students with lack of formal schooling can take several years to reach grade level English language literacy.

Strategies or Changes Systemic strategies are being implemented to ensure progress among ELL students in secondary ELA. Refer to Global Strategies or Changes in the Limited English Proficiency section.
Progress on Access for ELLs See Progress on ACCESS for ELLs 2.0 in Limited English Proficiency section.
Students Failing to Meet or Make Progress Towards State Performance Standards Goals and Objectives The goals and objectives for students failing to meet or make progress towards performance standards in PARCC English 10 are consistent with the overall goals for all students in high school ELA. These include a focus on reading intervention-specific goals. See Overall Goals and Objectives in PARCC English Language Arts/Literacy, Grades 6-8.
Accomplishments The 2015 noteworthy accomplishments of students failing to meet or make progress toward meeting state performance standards in ELA/literacy for grade 10 include:
• Black/African American students—Level 4-5: outscored state scores; ranked fifth in the state.
• Hispanic/Latino students—Levels 4-5: outscored state scores, ranked fifth in the state; Level 3-5: outscored state scores, ranked sixth in the state.
• Students with disabilities—Level 4-5: outscored state scores, ranked second in the state; Level 3-5: outscored state scores, ranked fifth in performance band 3-5.
• FARM students—outscored state scores in performance band 4-5; outscored state scores in performance band 3-5.
• ELL students—ranked first in performance band 4-5; ranked third in performance band 3-5.
Note: 2016 PARCC data for county performance comparison were not available at the time of this writing.
Challenges Black/African American, Hispanic/Latino, students with disabilities, students receiving FARM, and ELL students are not meeting state standards by a large margin.
The challenges that are presented for high school English are similar to middle school ELA. See Challenges in Students Failing to Meet or Make Progress Towards Performance Standards in PARCC English Language Arts/Literacy, Grades 6-8.
Strategies or Changes See Strategies or Changes in Students Failing to Meet or Make Progress Towards Performance Standards in PARCC English Language Arts/Literacy, Grades 6-8.

P ARCC E NG LIS H G RADE 11 ( O p t i o n a l R e p o r t i n g )
In addition to MSDE’s graduation assessment requirements, Maryland law requires all students to take an assessment by the end of grade 11 to determine if the student is college and career ready. The first year that Maryland set forth this requirement was in 2015-2016. Thus, to ensure that all students were offered a free assessment to meet the state requirement, all students taking English 11 in 2015-2016 or later were offered to take the PARCC English 11 assessment. Tables 2.5a-2.5c show baseline data for the 2016 administration of PARCC English 11. In 2016, approximately 44% of all FCPS students taking English 11 were in performance band 4-5. At least half of students did not perform in levels 4-5 on PARCC English 11 in 2016. Significant achievement gaps are evident in the 2016 baseline data among black/African American and students receiving special services.
P ARCC MAT HEM ATI CS Grad es 3-5
As children learn mathematics they develop skills and concepts they will use in science, technology, business, and in a wide range of career areas. Children learn to value, understand, and use math not only at school but also in their world and are successful in the mathematical applications they encounter. The elementary school curriculum encourages students to enjoy learning and doing math and helps them to apply their growing base of knowledge as successful thinkers, problem solvers, and communicators. In encouraging the development of mathematics proficiency, staff works to develop conceptual understanding, procedural fluency, strategic competence, adaptive reasoning, and a productive disposition. These attributes are developed in all areas of study within all domains of study: counting and cardinality, number and operations in base ten, operations and algebraic thinking, measurement and data, Geometry, number and operations-fractions.
Overall Goals and Objectives
Systemic goals exist for mathematics within the framework of state assessments and local assessments. Targets for achievement on the PARCC assessments are listed below as well as targets for achievement within the local assessment platform.
PARCC-Specific Goals • Using a five-year PARCC target model, elementary math will achieve annual increases for
each student group with 10 or more students.

2014-2015 baseline: FCPs will cut the gap in half from baseline to 100%; Target student groups: FCPS will cut the gap by three quarters.
• Increase the percent of students who demonstrate growth by one performance level and the percent of students who score four and five from 2014-2015 baseline.
Local Math Assessments Reporting will occur for measurement of mastery of quarterly unit outcomes.
• For grade 2, 80% of students will score 80% or better on mastered unit outcomes for each benchmark (one through four) and/or demonstrate an increase from 2016 to 2017.
• For grades 3-5, 80% of students will score 80% or better on mastered unit outcomes for each benchmark (one through three) and/or demonstrate an increase from 2016 to 2017.
• For each student group, there will be no more than a 10% gap in performance.
Overall Accomplishments
Based upon the available data (see Tables 2.6a-2.6c), the following accomplishments are noted:
• Approximately half of all test takers (46.2% in 2015 and 53.2% in 2016) scored in performance band 4-5.
• Seventy-five percent of test takers in 2015 and 77.7% in 2016 scored in performance band 3-5.
• More than half of FARM, Hispanic/Latino, black/African American, and students identifying as two or more races scored in performance band 3-5 in both 2015 and 2016.
• The majority of Asians (91.1% in 2015 and 88.8% in 2016) scored in performance band 3-5 resulting in the highest student group performance.
• There were no significant gaps in gender when comparing performance band 3-5 among males and females.
Special Education Students Goals and Objectives The goals and objectives for students with disabilities in elementary mathematics are consistent with the overall goals and objectives for all FCPS students receiving special education services.
Accomplishments Based upon the available data, the following accomplishments are noted:
• Over 30% of students with disabilities were in performance band 3-5 on the PARCC math assessment in 2015 and 2016.
• Approximately 40-50% (2016 and 2015, respectively) of the students with disabilities performed at level two which indicates partial understanding. School teams will consider strategies to move student to level three and above.

Challenges Based upon the available data, the following challenges are noted:
• One of the system goals is there will be no more than a 10% gap in performance for students with disabilities compared to their nondisabled peers. The current gap that exists between the top performing student group and students with disabilities is 60.2%.
• Students receiving special education services are one of the lowest performing student groups with males scoring 33.2% and 39.4% (2015 and 2016, respectively) and females scoring 26.1% and 27.7% (2015 and 2016, respectively) in performance band 3-5.
Strategies or Changes FCPS developed elementary mathematics program guidelines that provide students who are experiencing challenges additional instructional time with teachers that possess a comprehensive expertise in mathematics. As a result of additional instructional time, FCPS anticipates an increase in elementary math scores towards meeting established benchmarks on local and state assessments via quarterly assessments and mid/end of year assessment cycles.
In addition, systemic strategies are being implemented to ensure progress among students receiving special education services in elementary mathematics. Refer to Global Strategies or Changes in the Special Education section.
Limited English Proficient Students
Goals and Objectives The goals and objectives for ELL students in elementary mathematics are consistent with the overall goals and objectives for all FCPS ELL students. In addition, specific PARCC and local assessment goals are described in Overall Goals and Objectives for PARCC Mathematics Grades 3-5.
Accomplishments Approximately 4.5% of all test-takers in the grade band 3-5 are ELL students. Elementary school students receiving ELL support had a lower percentage of PARCC mathematics scores that were three or higher (31.4% in 2015 and 38.5% in 2016) than every other student group except for students receiving special education services. Although this certainly isn’t an accomplishment, it provides important data results to plan for the next administration of this relatively new assessment.
Challenges Success on PARCC assessments can be a challenge for ELL students who experienced very little to none (or interrupted) formal schooling prior to FCPS enrollment. PARCC assessments require strong academic vocabulary skills in the assessed area. ELL students with lack of formal schooling can take several years to reach grade level English language literacy.
Strategies or Changes Systemic strategies are being implemented to ensure progress among ELL students in elementary mathematics. Refer to Global Strategies or Changes in the Limited English Proficiency section.

Progress on Access for ELLs See Progress on ACCESS for ELLs 2.0 in Limited English Proficiency section.
Students Failing to Meet or Make Progress Towards Meeting State Performance Standards Goals and Objectives Systemic goals exist for all students for mathematics within the framework of state assessments and local assessments. Targets for achievement on the PARCC assessments and targets for achievement within the local assessment platform are described in Overall Goals and Objectives for PARCC Mathematics Grades 3-5.
Accomplishments Based upon the available PARCC data, please note the accomplishments of students within groups whose performance is discrepant with that of the all student group (see Overall Accomplishments for PARCC Mathematics Grades 3-5 for an overview of elementary math accomplishments by student group).
Challenges Based upon available PARCC data and school-based discussions, challenges and barriers for students failing to meet standards can be related to the following root causes:
• Procedural fluency
• Making sense of problems, story problems, two and three step problems
• Fraction/decimal/percent connections and equivalences
• Place value—number base ten, rule of 10
• Reasoning—concept of quantity, context of number, ability to critique/defend
• Early number sense skills—jumping decades, number sequences, flexibility in composition and decomposition of number
• Math vocabulary and language
• Organizing data, pictures, writing, equations, etc.
• Perseverance with tasks
• Test taking skills—phobias, lack of precision
• Organizing and showing work—manipulative and visual modeling
• Use of strategies within the operations and algebraic thinking domain
Strategies or Changes In the 2016-2017 school-year, five years of an elementary math instructional leader (EMIL) program is underway providing the structure for growth changes and strategies.

• Curricular framework established based upon Sinek and DuFour’s work (the “what”, the “why”, and the “how “and how it pertains to curriculum design).
• Establish the above “what” as it pertains to the curricular “what, how, how do we know, and now what will we do.”
• Create a leadership structure within the EMIL program—EMIL Leadership Team (ELT).
• Focus EMIL curricular work using a work team model with teams established to support initiatives and growth opportunities: Curriculum NOW Team, Unit Formative Team, Quarterly Assessment Team, Home/School Connection Team, Professional Learning Team, ELT Response Team, Resource Team, and What Now/Intervention Team. Team charges are directed by the curriculum specialist for elementary mathematics, teacher specialist for elementary mathematics, and the ELT and EMIL group.
The ever-present implied rationale for such work is to build teacher capacity which results in student achievement. The rationale for the comprehensive work team strategy is found within the charge of such group (see Table J).

Table J. Elementary Math—Curricular Work Teams
Work Team Charge/Rationale Timeline
Quarterly Assessment Team
Develop quarterly assessments for grades 2-5 for the purpose of determining growth towards target.
Per timeline established
Unit Formatives Team Develop unit formatives for each unit grades 1-5 for the purpose of monitoring progress and informing instruction.
Establish timeline for delivery within unit window
Instructional Strategies Team
Update site documents on Curriculum NOW to include unit outcomes, standards, instructional strategies, tools, performance level descriptors, etc. for the purpose of providing staff accessibility to online planning and learning.
Per ending of each quarter
Home School Connection Team
Construct grade level curriculum pamphlets. Construct family support resources. Prepare for family/community events (e.g., Math Nights). Update FCPS.org parent resource site. All charges designed to support parents as “first teachers.”
Per event timeframe-Ongoing
Professional Learning Team
Direct and prepare one monthly professional learning opportunity for Elementary Math Instructional Leaders and staff in order to build capacity. Topics: sub-claims, data evidence tables, book study, presentations, SMPs.
Monthly
Resource Team Update FCPS.org. Develop a recommended classroom inventory by grade. Create technology resource page. All charges designed to support teacher and parent accessibility to curricular information.
Ongoing
What Now—Intervention Team- Subgroup (Math Inventory resources)
Field test Math Inventory in three schools. Provide parameters for evidence-based instructional programs. Stabilize math structure/block within full day schedule. Charges designed to provide quality extended learning opportunities.
School year 2016-2017
Elementary Math Instructional Leaders Response Team
Respond to current topics, issues, concerns. Provide advocacy and visionary statements when necessary in order to clarify and provide directions in process and procedures.
As needed

Tables K and L provides the additional strategies (including rationale, associated resources, and timelines for monitoring progress) that are being implemented in the elementary math program to ensure student progress.
Table K. Elementary Math—Additional Strategies and Resources
Strategies Charge/Rationale Timeline
Professional learning opportunities for intervention teachers
Provide interventionists with professional learning opportunities to support growth and understanding of the “learner,” the resources, curriculum, etc.
Quarterly
Tier 1 curricular materials within site
Provide general educators access to materials that enable them to respond to struggling students.
Annually
Extended learning opportunities (ELOs)
Provide before or after school math sessions for the purpose of accelerating achievement towards standards.
Annually
Math intervention opportunities
Provide pull-out or push-in services to children identified at school level. Identification based upon multiple measures (PARCC, local assessments, teacher ranking, etc.).
Establish timeline for delivery within unit window
Pursue research based interventions
Update current resource pool containing Math Navigator and Dreambox with resources to support an evidence-based instructional practice approach.
Per ending of each quarter
Table L. Elementary Math—Resource Allocations
Resource Allocation Funding Source of Funding
Local MSDE 1-3 credit math courses
FCPS Professional Learning budget—to be determined based upon enrollment
Unrestricted
Summer curricular workshops FCPS Curriculum Instruction and Innovation Department funding ($25,488)
Unrestricted
School-based Elementary Math Instructional Leaders monthly professional learning meetings
FCPS Elementary Math Department Budget ($36,088)
Unrestricted
Materials of instruction and text FCPS Elementary Math Department Budget ($23,150)
Unrestricted

P ARCC MAT HEM ATI CS Grad es 6-8
Overall Goals and Objectives The middle school mathematics program offers students strong academic preparation for success in high school and future careers. Students learn important Pre-Algebra and Algebra I skills and concepts. They also continue to master skills in:
• Algebra
• Patterns and functions
• Geometry
• Measurement
• Statistics
• Probability
• Number relationships and computation
Overall Accomplishments
One measure of student achievement is the results of the PARCC assessment. This assessment was administered for the first time in 2015 for mathematics. Over half of FCPS middle school students (68.2% in 2015 and 71.5% in 2016) earned a score of three or higher on the mathematics PARCC (2015, n=8,229; 2016, n=8,453) (see Tables 2.7a-2.7c for grades 6-8 PARCC math results).
Special Education Students
Goals and Objectives The goals and objectives for students receiving special education services in secondary mathematics are consistent with the overall goals and objectives for all FCPS students receiving special education services.
Accomplishments Approximately one-fifth (20.9% in 2015 and 20.7% in 2016) of students receiving special education services earned a score of three or higher on PARCC mathematics assessment among middle school students. These students comprise approximately 10% of middle school students.
Male students receiving special education services outperformed their female counterparts in both 2015 (24.4%, 13.4%, respectively) and 2016 (22.1% and 18.1%, respectively) in performance band 3-5. However, both gender groups’ achievement results would be considered low relative to that of students who do not receive special education services.
Challenges Middle school students receiving special education services had a lower percentage of PARCC mathematics scores that were in performance band 3-5 than every other student group except for students receiving ELL services (9.8% in 2015 and 13.0% in 2016). These students are assessed on the same content as their nondisabled peers and the scoring regime is also the same. Students with disabilities often find it difficult to keep pace with their nondisabled peers. As a result, many of these students may not master the content as readily. Over time, a lack of mastery of learning content makes it difficult for students in this student group to maintain grade level performance status.
Strategies or Changes Secondary mathematics program guidelines were developed to provide students who are experiencing difficulties additional instructional time with teachers who possess a comprehensive expertise in mathematics. As a result of additional instructional time, FCPS anticipates an increase in middle school math scores towards meeting established benchmarks on local and state assessments via quarterly assessments and mid/end of year assessment cycles.
Based on the data provided, FCPS developed an alternative course to better prepare students for the Algebra I course. The OnRamp to Algebra initiative provides prerequisite skills for students who will enroll in Algebra I. Ongoing professional learning will occur for teachers of the course in order for students to receive instruction to assist them in meeting the benchmarks on the local and state assessments. (Costs: Restricted Local Priority Flexibility, 170277-04, OnRamp to Algebra, $23,608)
In addition, systemic strategies are being implemented to ensure progress among students receiving special education services in secondary mathematics. Refer to Global Strategies or Changes in the Special Education section.
Limited English Proficient Students
Goals and Objectives The middle school mathematics program gives all students—including students with limited English proficiency—strong academic preparation for success in high school and future careers. Students learn important Pre-Algebra and Algebra I skills and concepts. They also continue to master skills in Algebra, pattern and functions, geometry, measurement, statistics, probability, and number relationships and computation.
Accomplishments ELL students in the middle schools comprise 2.6% of all middle school students. In 2015, only about one in 10 (9.8%) of this student group earned a score of three or higher on the PARCC mathematics assessment. This increased to 13.0% in 2016. Male and female ELL students had similar levels of achievement, although the male students made up about three-fifths of this student group.

Challenges In 2015, ELL students demonstrate the lowest performance among all student groups. This student group demonstrated half of the performance level of students receiving special education services (21.0%), and is nearly one-fifth that of black/African American students scoring in performance band 3-5 on the PARCC mathematics assessment at a rate of 47.5%. While a slight increase in performance (band 3-5) was evident in 2016 (i.e., 9.8% to 13.0%), ELL students still remain the lowest performing student group in PARCC grades 6-8 math.
Success on PARCC assessments can be a challenge for ELL students who experienced very little to none (or interrupted) formal schooling prior to FCPS enrollment. PARCC assessments require strong academic vocabulary skills in the assessed area. ELL students with lack of formal schooling can take several years to reach grade level English language literacy.
During the spring 2016 administration of PARCC math within this grade band, three Maryland school systems, one of them was FCPS, piloted a new accommodation for ELL students. ELL students took the PARCC assessment in Spanish as opposed to English. After students were carefully identified based upon the criteria offered by the MSDE and given the option to take this assessment in Spanish, students took the assessment in their native language. Based upon student feedback after the assessment, approximately 75% of the ELL students who participated in this pilot accommodation offered that they would prefer to take the assessment in English next time instead of Spanish. The reason that they gave for this choice was twofold. First of all, they stated that the language of instruction in their current classes is English. Second, although their first language indeed was Spanish, their reading and writing skills in that language were not sufficient to meet the academic language demands of the PARCC assessment.
Strategies or Changes In addition, systemic strategies are being implemented to ensure progress among ELL students in secondary mathematics. Refer to Global Strategies or Changes in the Limited English Proficiency section.
Progress on Access for ELLs See Progress on ACCESS for ELLs 2.0 in Limited English Proficiency section.
Students Failing to Meet or Make Progress Towards Meeting State Performance Standards
Goals and Objectives Middle school students earning a score of one or two on the PARCC mathematics assessment not only struggle to understand the mathematical concepts in general, but also have difficulty acquiring a working use of the standards for mathematical practices which include:
• attending to precision
• constructing viable arguments
• expressing regularity in repeated reasoning
• making sense of problems

• making use of math structure
• modeling with mathematics
• perseverance in solving problems
• reasoning abstractly and quantitatively
It is the goal of the secondary mathematics program to help teachers to impart these mathematical practices to their students for the students to build abilities in these mathematical practices.
Accomplishments In 2015, FCPS had five student groups that demonstrated achievement lower than 68.2%, three student groups that demonstrated achievement higher than 68.2%, and two student groups that demonstrated achievement very close to 68.2%. These student groups whose achievement was below 68.2% were: black/African American students (47.5%), Hispanic/Latino students (53.4%), students receiving special education services (21.0%, students receiving ELL services (9.8%), and students receiving FARM services (47.5%). In 2016, similar trends were evident when comparing student groups to all FCPS students.
Challenges There is great variation in achievement among different student groups. Approximately three-fourths (73.7% in 2015 and 76.2% in 2016) of students in the white student group earned a three or higher while only about half (50.6% in 2015 and 55.8% in 2016) of the students in the black/African American and Hispanic/Latino student groups combined earned similar scores. Black/African American and Hispanic/Latino students comprise about one-quarter of middle school students. Similarly, the gap between students receiving FARM (2015, n=1,924; 2016, n=2,213) and students who do not receive these services was also wide (47.5% vs. 74.6% in 2015; 48.7% vs. 79.5% in 2016).
Female middle school students had a higher percentage of scores three and above than did male middle school students (72.3% vs. 64.2% in 2015; 74.9% vs. 68.2% in 2016). This gender achievement gap existed for all student groups except Native Hawaiian/Other Pacific Islander and students receiving special education services.
Strategies or Changes Each middle school has a mathematics specialist. This person analyzes school data, supports school administration, and provides professional learning for mathematics and intervention teachers, conducts model lessons, meets with small groups of students, and attends regular monthly meetings and trainings at the district level.
Each middle school has mathematics intervention classes taught by teachers who receive regular training at the central level. These classes are intended to raise the level of understanding of mathematics content for students who struggle and provide instruction in addition to their regular math block.
Individual mathematics teachers have access to curriculum documents that support differentiation for students who fail to meet progress towards state performance standards.

Each strategy is intended to help staff to identify students who fail to meet progress towards state performance standards and to provide resources to the student through the teacher to help them to raise their level of understanding.
Standard-based assessments are available to measure progress of student understanding on a standard-by-standard basis. Additionally, three benchmark assessments are administered during the school year to allow students and teachers to identify math content areas that students meet with success as well as those areas that require more attention in order to help students to raise their level of understanding.
Funds for intervention materials are received via a grant that is administered through the AAE department. Funds for training teachers and middle school mathematics specialists are from general school system funds.
P ARCC ALGEBRA I
Overall Goals and Objectives FCPS’s secondary mathematics program aims to help students be successful, productive citizens who can use mathematics in their daily lives. To accomplish this, the high school mathematics program prepares students for a wide range of future academic and career options, including science, technology, engineering and business.
High school math teachers use a variety of instructional resources and technology to help students communicate, reason, think critically, and become lifelong learners.
The high school mathematics program:
• Provides instruction in the core courses: Algebra I, Geometry, and Algebra II.
• Encourages students to select electives from a wide range of courses, such as Advanced Algebra, Contemporary Mathematics, Pre-Calculus with Trigonometry, and Statistics and Probability.
• Provides opportunities for advanced, honors-level study in courses, such as AP Calculus I and II, Calculus III, AP Statistics, IB Math Methods and Studies, as well as other college courses.

• Encourages students to participate in curricular activities inside and outside the classroom such as science fair and internships.
Overall Accomplishments The PARCC Algebra I results are one measure in assessing student achievement in high school mathematics. PARCC Algebra I was first administered in 2015. Over 70% (71.4%) of students who took the PARCC Algebra I assessment earned a score of three or higher (n=3,972) in 2015. This percentage increased to 76.6% in 2016 (n=3,337) (see Tables 2.8a-2.8c).
Special Education Students
Goals and Objectives The goal of secondary mathematics is that there is no more than a 10% gap in performance for students receiving special education services when compared to their peers.
Accomplishments Approximately 31% percent of students with disabilities participating in PARCC Algebra I assessment earned a score of three or higher in 2015. This increased to 40.3% in 2016. This student group comprises ten percent of the PARCC Algebra I assessment participants.
Approximately two-thirds of these students are male. Male students receiving special education services performed at a slightly higher rate than their female counterparts (32.2% vs. 29.3% in 2015; 42.5% vs. 34.8% in 2016) in PARCC Algebra I. However, both gender groups’ achievement results would be considered low relative to that of students who do not receive special education services.
Challenges Students receiving special education services had one of the lower percentage of scores that were three or higher (on the PARCC Algebra I assessment) when compared to other student groups. These students are assessed on the same content as their nondisabled peers and the scoring regime is also the same. Students with disabilities often find it difficult to keep pace with their nondisabled peers. As a result, many of these students may not master the content as readily. Over time, a lack of mastery of learning content makes it difficult for students in this student group to maintain grade level performance status.
Strategies and Changes Secondary mathematics program guidelines were developed to provide students who are experiencing challenges additional instructional time with teachers who possess a comprehensive expertise in mathematics. As a result of additional instructional time, FCPS anticipates an increase in Algebra I scores towards meeting established benchmarks on local and state assessments via quarterly assessments and mid/end of year assessment cycles. Also, as described in middle school mathematics, the OnRamp to Algebra alternative course is being provided to better prepare students for Algebra I.
In addition, systemic strategies are being implemented to ensure progress among students with disabilities in secondary mathematics. Refer to Global Strategies or Changes in the Special Education section.

Limited English Proficient Students
Goals and Objectives The goals and objectives for ELL students in secondary mathematics are consistent with the overall goals and objectives for all FCPS ELL students.
Accomplishments ELL students who took the PARCC Algebra I assessment comprised approximately 2-4% (2015 and 2016, respectively) of all PARCC Algebra I participants. Only about one in three of this student group earned a score of three or higher on the PARCC Algebra I assessment in both 2015 and 2016. Female ELL students had a slightly better performance compared to the male ELL students (36.1% vs. 29.0%) in 2015. This trend continued in 2016. Both groups were very small and similar in size in both administration years.
In 2015 and 2016, the performance of ELL students (i.e., performance band 3-5) is one of the lowest among all racial and special services student groups in PARCC Algebra I. It is less than half of the achievement level of the full population of PARCC Algebra I participants (71.4% in 2015 and 76.6% in 2016) and is more than 20 percent lower than students who receive FARM (53.5% in 2015 and 53.2% in 2016).
Challenges Success on PARCC assessments can be a challenge for ELL students who experienced very little to none (or interrupted) formal schooling prior to FCPS enrollment. PARCC assessments require strong academic vocabulary skills in the assessed area. ELL students with lack of formal schooling can take several years to reach grade level English language literacy. In support of this, the pilot administration among ELL students in spring 2016 suggested that ELL student reading and writing skills in Spanish were not sufficient to meet the academic language demands of the PARCC assessment. Thus, ELL students preferred taking the assessment in English over Spanish.
Strategies or Changes Systemic strategies are being implemented to ensure progress among ELL students in secondary math. Refer to Global Strategies or Changes in the Limited English Proficiency section.
Progress on Access for ELLs See Progress on ACCESS for ELLs 2.0 in Limited English Proficiency section.
Students Failing to Meet or Make Progress Towards State Performance Standards Goals and Objectives The goals and objectives for students failing to meet or make progress towards state performance standards in secondary mathematics are consistent with the overall goals and objectives for all FCPS students in secondary math.

Accomplishments The percent of students in performance band 3-5 on the PARCC Algebra I assessment in 2015 was 71.4% (n=3,972) and 76.6% in 2016 (n=3,337). Two student groups—Asian and white— demonstrated higher performance compared to all students taking PARCC Algebra I.
Challenges Approximately 29% in 2015 and approximately 23% in 2016 of PARCC Algebra I participants were in performance level one and two. More than half of these students were part of the white student group. Black/African American and Hispanic/Latino student groups combined account for 36% (2015) and 49% (2016) of PARCC Algebra I test-takers.
FCPS had six student groups—black/African American, Hispanic/Latino, two or more races, students with disabilities, ELL students, and students receiving FARM—that demonstrated lower performance compared to all students in PARCC Algebra I in both administration years. There were two student groups whose performance is not statistically significant due to a small number of students in that group.
There is significant variation in achievement among different student groups. Approximately three-fourths (76.6%) of white students earned a three or higher in 2016 while only 58.9% of black/African American and Hispanic/Latino students combined earned similar scores. Black/African American and Hispanic/Latino students comprise less than one-quarter of the students who took the PARCC Algebra I
assessment. Similarly, the gap between students receiving FARM (2015, n=832; 2016, n=876) and students who do not receive these services was also wide (53.5% vs. 76.5% in 2015; 53.2% vs. 84.8% in 2016). In 2015, female students who took the PARCC Algebra I assessment had a higher percentage of scores three and above than did male students (75.6% vs 67.9%). This trend was evident in 2016 among female and male students taking PARCC Algebra I. This gender achievement gap existed for most of the major student groups including black/African American, Hispanic/Latino, and white.
Strategies and Changes High schools have two levels of intervention coursework available to students to prepare them for the full Algebra I course. The first level is OnRamp to Algebra and the second level is

Connections to A lgebra. Students may be identified for enrollment in either one or both of these classes. These classes seek to assist students with the Pre-Algebra skills that they never learned or perhaps did not learn well enough to progress to the full Algebra course. These courses are typically taken in students’ first year of high school.
Individual mathematics teachers have access to curriculum documents that allow for differentiation for students who fail to meet progress towards state performance standards.
Each strategy is intended to help staff to identify students who fail to meet progress towards state performance e standards and to provide resources to the student through the teacher to help them to raise their level of understanding.
Formative assessments are available to measure progress of student understanding. Analysis of the results from these assessments allow students and teachers to identify math content areas that students meet with success as well as those areas that require more attention in order to help students to raise their level of understanding.
Funds for intervention materials are received via a grant that is administered through the special education department in FCPS. Funds for training teachers and middle school mathematics specialists are from general school system funds.
P ARCC ALGEBRA II ( O p t i o n a l R e p o r t i n g )
Overall Accomplishments PARCC was first administered in Algebra II in 2015. Nearly 60% (59.2%) of students who took the PARCC Algebra II assessment earned a score of three or higher (n=1,456) in 2015 (see Tables 2.9a-2.9c). This percent increased to 69.3% in 2016 (n=2,506).
Special Education Students
Goals and Objectives The goals and objectives for students receiving special education in secondary mathematics are consistent with the overall goals and objectives for all FCPS students receiving special education services.
Accomplishments In 2015, approximately one-third (36%) of students with disabilities who participated in the PARCC Algebra II assessment earned a score of three or higher. This student group comprises a very small percent of the PARCC Algebra II assessment participants. A little under two-thirds of these students are male. Male students receiving special education services outperformed (performance levels 3-5) their female counterparts in PARCC Algebra II in 2015 and 2016. Both gender groups have a very small group size and both gender groups’ achievement results would be considered low relative to that of students who do not receive special education services.

Challenges There is great variation in performance among different student groups. Approximately two-thirds (63.5%) of white students earned a three or higher while only 41.8% of the students in the black/African American and Hispanic/Latino groups combined earned similar scores. Similar
trends were evident in 2016 (73.4% white and 50.0% black/African American and Hispanic/Latino combined). Black/African American and Hispanic/Latino students comprise less than one-quarter (22.5% in 2015 and 18.4% in 2016) of the students who took the PARCC Algebra II assessment.
Similarly, the gap between students receiving FARM (2015, n=208; 2016, n=347) and students who do not receive these services was also wide (42.8% vs. 62.0% in 2015; 49.3% vs. 72.4% in 2016).
In 2015, male and female students who took the PARCC Algebra II assessment did not have a statistically significant difference in their respective percentage of scores three and above (60.0% vs 58.6%). However, in 2016, female students outperformed male students taking PARCC Algebra II by 3.7%. Gender differences are evident among certain student groups but with the largest difference between black/African Americans males and females as well as Hispanic/Latino males and females. Note that the black/African American and Hispanic/Latino student groups each comprise approximately 10% of the PARCC Algebra II assessment participants in both PARCC administration years.
Students receiving special education services had a lower percentage of scores that were three or higher (on the PARCC Algebra II assessment) than every other student group of significant size except black/African Americans. Students are assessed on the same content as their nondisabled peers and the scoring regime is also the same. Hence, varied instructional strategies and methodologies must be used to instruct students in this student group. They also must learn compensatory skills to minimize the impact of their disability on their learning performance and progress.
Strategies or Changes Secondary mathematics program guidelines were developed to provide students who are experiencing difficulties additional instructional time with teachers who possess a comprehensive expertise in mathematics. In order for FCPS to accelerate achievement for struggling learners, additional instruction and intervention beyond the core curriculum program will be required to eliminate the achievement gap. In order to eliminate the achievement gap, all individuals working with students need to be provided ongoing opportunities to grow as

professionals. The special education paraprofessionals, administrators, and educators need to be equipped with the knowledge and tools necessary to support all students to increase student achievement.
As a result of additional instructional time, FCPS anticipates an increase in student performance of Algebra II scores towards meeting established benchmarks on local and state assessments via quarterly assessments and mid/end of year assessment cycles.
Monitoring of attendance and evaluation feedback at the conclusion of each training session will provide on-going tools to measure successful planning and implementation to make adjustments, as appropriate.
Ongoing professional learning will occur for teachers of the course in order for students to receive instruction to assist them in meeting the benchmarks on the local and state assessments. (Costs: Restricted Local Priority Flexibility, 170277-04, OnRamp to Algebra, $23,608)
Limited English Proficient Students
Goals and Objectives The goals and objectives for ELL students in secondary mathematics are consistent with the overall goals and objectives for all FCPS ELL students.
Accomplishments The number of ELL students participating in Algebra II was very small (i.e., less than 10 students). Therefore, analysis of the data for ELL students are not provided as results cannot be generalized due to the small n.
Challenges Success on PARCC assessments can be a challenge for ELL students who experienced very little to none (or interrupted) formal schooling prior to FCPS enrollment. PARCC assessments require strong academic vocabulary skills in the assessed area. ELL students with lack of formal schooling can take several years to reach grade level English language literacy.
Strategies or Changes Systemic strategies are being implemented to ensure progress among all ELL students in secondary ELA. Refer to Global Strategies or Changes in the Limited English Proficiency section.
Progress on Access for ELLs See Progress on ACCESS for ELLs 2.0 in Limited English Proficiency section.
Students Failing to Meet or Make Progress Towards State Performance Standards Goals and Objectives Students earning a score below three on the PARCC Algebra II assessment struggle to understand the mathematical concepts sufficiently to demonstrate this understanding. They lack the acquisition of mathematical practices. (See list of practices in Goals and Objective for Students Failing to Meet or Make Progress Towards Meeting State Performance Standards in

PARCC Mathematics Grades 6-8 section). It is the goal of the secondary mathematics program to help teachers to impart these mathematical practices to their students for the students to build abilities in these mathematical practices.
Accomplishments The percent of students earning a score of three or higher on the PARCC Algebra II assessment in 2015 was 59.2% (n=1,456) and 69.3% (n=2,506) in 2016. Approximately 41% of PARCC Algebra II test-takers earned a score less than a three in 2015. In 2016, this decreased to 31% of PARCC Algebra II test-takers earning a score less than three.
Challenges In 2015, FCPS had five student groups (of significant size) that demonstrated achievement lower than 59.2%, two student groups (of significant size) that demonstrated achievement higher than 59.2%, and three student groups whose achievement is not statistically significant due to a small group size. The five student groups whose achievement was below 59.2% were: black/African American students (29.7%), Hispanic/Latino students (52.6%), two or more races (58.7%), students receiving special education services (35.9%), and students receiving FARM services (42.8%). In 2016, these student groups demonstrated similar performance when compared to all FCPS students.
Strategies or Changes High schools have two levels of intervention coursework available to students to prepare them for the full Algebra I course. The first (lower) level is OnRamp to Algebra and the second (somewhat higher) level is Connections to Algebra. Students may be identified for enrollment in either one or both of these classes. These classes seek to assist students with the Pre-Algebra skills that they never learned or perhaps did not learn well enough to progress to the full Algebra course. These courses are typically taken in the students’ first year of high school. Students taking these courses are better prepared for Algebra I, which (in turn) helps them to be better prepared for Algebra II.
Additionally, FCPS offers a course titled Intermediate Algebra for students who successfully complete Algebra I and Geometry and are not yet prepared to take the full Algebra II. The Intermediate Algebra course assists students with the Algebra I skills that they never learned or perhaps did not learn well enough to progress to the Algebra II course. This course is typically taken in the students’ third year of high school.
Individual mathematics teachers have access to curriculum documents that allow for differentiation for students who fail to meet progress towards state performance standards.
Each strategy is intended to help staff to identify students who fail to meet progress towards state performance standards and to provide resources to the student through the teacher to help them to raise their level of understanding.
Formative assessments are available to measure progress of student understanding. Analysis of the results from these assessments allow students and teachers to identify math content areas that students meet with success as well as those areas that require more attention in order to help students to raise their level of understanding.
Funds for training teachers and for creating the Intermediate Algebra course are from general school system funds.
P ARCC GE OMETRY ( O p t i o n a l R e p o r t i n g )
Like PARCC English 11, the PARCC Geometry assessment was first offered to students in 2015-2016.
Tables 2.10a-2.10c show baseline data for the 2016 administration of PARCC Geometry. In 2016, only 2.9% of all FCPS students taking PARCC Geometry were in performance band 4-5. White students comprise over half (65.0%) of the PARCC Geometry test-takers. Approximately 52% student taking the PARCC Geometry assessment were in performance level two.
M SA SCIE NCE GRADE 5
The FCPS elementary science vision states, “Teachers have the resources and knowledge they need to teach science. Students are engaged in meaningful scientific investigations and look forward to science every day.”
Overall Goals and Objectives FCPS’s elementary science program aims to ensure that students learn science through investigations and experiments, reading, technology, and problem solving. In support of classroom instruction, FCPS’s Earth and Space Science Laboratory (ESSL) (https://education.fcps.org/essl/) provides an extension and/or enrichment to the elementary science curriculum. All students in grades 1-5 visit the ESSL during the school year in connection with their earth/space science unit. In addition, the FCPS Science Center also

supports instruction of life science units by delivering a variety of living organisms in the classroom.
Overall Accomplishments
FCPS’s performance on the Maryland School Assessment (MSA) for grade 5 science continues to be above the state average in 2016. However, like the state average, the performance of FCPS on the MSA for grade 5 science is declining.
The Maryland BOE adopted the Next Generation Science Standards (NGSS) as Maryland State Science Standards (MSSS) in June, 2013. All Maryland LEAs are expected to be completely aligned to the MSSS by 2017-2018. The Maryland Integrated Science Assessment (MISA) will assess the MSSS and replace the MSA.
FCPS’s elementary science program is transitioning to the new MSSS. The transition to new standards will take place in grade 5 during the 2016-2017 school-year, grades 3 and 4 during 2017-2018, and prekindergarten through grades 2 during the 2017-2018 school-year.
Special Education Students
Goals and Objectives The goals and objectives for students with disabilities in elementary science are consistent with the overall goals and objectives for all FCPS students receiving special education services.
Accomplishments In 2016, students with disabilities outperformed the performance of this student group overall in the state (28.4% and 11.4%, respectively). The gap between all FCPS students and students with disabilities in grade 5 science on the MSA has also stayed fairly constant; it has not widened (see Table 2.11).
Challenges A challenge for students with disabilities in FCPS is that this student group performs significantly below all other student groups. Specifically, the performance gap between students with disabilities and all FCPS students in 2016 is 43.3%. Additionally, since 2014 the number of students with disabilities who participated in MSA remained relatively stagnant, however there was a 6% decrease in proficiency since that time. Lastly, when comparing female and male students with disabilities, proficiencies are noticeable and significant (18.6% vs. 33.5%, MSA 2016).

Strategies and Changes As mentioned above, FCPS will be aligning its science curriculum with the new science standards. This involves developing new curricular modules. This will be implemented in the 2016-2017 school year. Funds for professional learning communities as teachers learn the new curricular units has been provided locally. No other significant resource allocations have occurred.
Systemic strategies are being implemented to ensure progress among students receiving special education services in elementary science. Refer to Global Strategies or Changes in the Special Education section.
Limited English Proficient Students
Goals and Objectives The goals and objectives for ELL students in elementary science are consistent with the overall goals and objectives for all FCPS ELL students.
Accomplishments and Challenges FCPS has few accomplishments for ELL students in grade 5 science. ELLs are the lowest performing student group in FCPS in grade 5 science. The achievement gap decreased by 0.3% from 2015 to 2016 (see Table 2.11).
Strategies and Changes FCPS will be aligning its science curriculum with the new science standards. This will be implemented in the 2016-2017 school year. Funds for professional learning communities as teachers learn the new curricular units has been provided locally. No other significant resource allocations have occurred.
In addition, systemic strategies are being implemented to ensure progress among ELL students in elementary science. Refer to Global Strategies or Changes in the Limited English Proficiency section.
Students Failing to Meet or Make Progress Towards State Performance Standards Goals and Objectives The goals and objectives for students failing to meet or make progress towards state performance standards in elementary science are consistent with the overall goals and objectives for all FCPS students in elementary science.

Accomplishments There are very little accomplishments for grade 5 science based on analysis of MSA data. For the most part, proficiency rates continue to decline.
Challenges As mentioned above, students with disabilities perform significantly lower than all other student groups, with the exception of ELL students, on MSA grade 5 science. In addition, performance gaps are evident among black/African American (14.6%) students, Hispanic/Latino students (22.2%), and students receiving FARM (22.7%) who took the MSA grade 5 science in 2016 (when compared to all FCPS students).
Strategies and Changes As mentioned previously, the elementary science program is transitioning to the new science standards in accordance with MSDE expectations and in preparation of the MISA. To accomplish this, FCPS is developing new curricular modules. The new units were also created using Universal Design for Learning. This will be implemented in the 2016-2017 school year. Funds for professional learning communities as teachers learn the new curricular units has been provided locally. No other significant resource allocations have occurred.
In addition, systemic strategies are being implemented to ensure progress among all students, including those failing to meet or make progress towards state performance standards, in elementary science. Refer to Global Strategies or Changes in the Limited English Proficiency and Special Education sections.
M SA SCIE NCE GRADE 8 Students learn science by acquiring knowledge and constructing explanations of natural phenomena. Students test those explanations and communicate findings both in oral and written forms. Through this process, students develop a deep understanding of science that combines knowledge and facts with reasoning and critical thinking.
Overall Goals and Objectives FCPS’s secondary science program, specific to middle school, aims to ensure students learn to
use and apply scientific knowledge through an array of science classes. Each grade level science course in middle school is an integrated study of life, Earth, and physical sciences through four overarching strands—change, movement, organization, and systems. Science and engineering practices, disciplinary core ideas, and cross cutting practices are integrated in all modules to provide a comprehensive, hands-on laboratory experience in middle school science. Students also participate in field-based experiences facilitated through the FCPS Outdoor School Program (http://education.fcps.org/outdoorschoolfcps/) where

classroom investigations are applied to real-world settings.
The overall goal for a quality science education (Taking Science to School, National Research Council, 2007) is to develop student proficiency in:
• Knowing, using, and interpreting scientific explanations of the natural world (disciplinary core ideas and crosscutting concepts);
• Generating and evaluating scientific evidence and explanations (practices);
• Participating productively in scientific practices and discourse (practices); and
• Understanding the nature and development of scientific knowledge (practices and crosscutting concepts).
Overall Accomplishments FCPS’s performance on the MSA for grade 8 science continues to be above the state average in 2016. FCPS saw small gains in performance for the following student groups—black/African American and ELL. Like the state average, the performance of FCPS on the MSA for grade 8 science is beginning to decline. The Maryland BOE adopted the NGSS as MSSS in June, 2013. All Maryland LEAs are expected to be completely aligned to the MSSS by 2017-2018. The Maryland Integrated Science Assessment (MISA) will assess the MSSS and replace the MSA.
Special Education Students
Goals and Objectives The goals and objectives for students with disabilities in secondary science are consistent with the overall goal and objectives for students with disabilities in FCPS.
Accomplishments Students with disabilities in FCPS outperformed the state special education student group. While a gap continues to exist between all students and the special education student group on the MSA for grade 8 science, the gap has not widened, but has also stayed fairly constant.
Challenges A challenge for students with disabilities in FCPS is that this student group performs significantly below all other student groups in grade 8 science. Specifically, the performance gap between students with disabilities and all students is 44%. Additionally, since 2014, the number of students with disabilities who participated in MSA grade 8 science remained relatively stagnant; however, there was a 6% decrease in proficiency since that time. Lastly, when comparing female and male students with disabilities, proficiencies are noticeable and significant (21.0% vs. 37.0%, respectively on the MSA 2016 for grade 8 science) (see Table 2.12).
Strategies and Changes FCPS will be aligning its science curriculum with the new science standards. In addition, systemic strategies are being implemented to ensure progress among students receiving special education services in secondary science. Refer to Global Strategies or Changes in the Special Education section.

Limited English Proficient Students
Goals and Objectives The goals and objectives for ELL students in secondary science are consistent with the overall goals and objectives for all FCPS ELL students.
Accomplishments Data show that from 2015 to 2016, the percent of ELL males considered proficient increases from 0% to 10.3% (see Table 2.12). In addition, the gap between ELL students and all students decreased by 5.4% from 2015 to 2016. FCPS has few accomplishments for ELL students in grade 8 science.
Challenges ELL students are the lowest performing student group in FCPS in grade 8 science. The largest challenge for students with limited English proficiency in grade 8 science is the lowest performing scores as well as the largest achievement gap. ELL students in FCPS also scored below the state average for ELL students (7.5% and 12.3%, respectively). Limited academic language skills among many ELL students enrolling in FCPS affects the level of success on state assessments like MSA science.
Strategies and Changes FCPS will be aligning its science curriculum with the new science standards. In addition, systemic strategies are being implemented to ensure progress among all FCPS ELL students in secondary science. Refer to Global Strategies or Changes in the Limited English Proficiency section.
Students Failing to Meet or Make Progress Towards State Performance Standards Goals and Objectives FCPS’s goals and objectives for all students, including underperforming students, is to promote academic growth and equity while reducing the achievement gap.
Accomplishments From 2015 to 2016, MSA science results for grade 8 show the achievement gap either decreasing slightly or remaining constant among certain student groups—American Indian/Alaska Native, black/African American, Native Hawaiian/Other Pacific Islander, and students receiving FARM (see Table 2.12). Performance among blacks/African Americans, Native Hawaiian/Other Pacific Islander, and ELL students increased from 2015 to 2016. Black/African American students outperformed the state average.
Challenges Challenges exist for the following student groups who performed on average below the FCPS student population as a whole on MSA science grade 8 in 2016: American Indian/Alaska Native, black/African American, Hispanic/Latino, Native Hawaiian/Other Pacific Islander, and students receiving special education, ELL, and FARM.

Strategies and Changes FCPS will be aligning its science curriculum with MSSS in accordance with MSDE expectations and in preparation of the MISA (field testing may occur as early as spring 2017). To accomplish this, FCPS is developing new curricular modules. These new units incorporate cross-cutting concepts, disciplinary core ideas and science and engineering practices around real world topics. MSSS standards support MSCCS in ELA and math. MSSS standards are “hands-on” as well as “minds-on”. Students act like scientists in science classrooms and employ higher level thinking strategies. The new units were also created using Universal Design for Learning. All middle school science courses will be aligned to the MSSS and implemented in the 2016-2017 school year.
Funds for professional learning communities as teachers learn the new curricular units has been provided locally. No other significant resource allocations have occurred.
HS A BIOLOGY High school students learn science by acquiring knowledge and constructing explanations of natural phenomena and then testing explanations and communicating findings. This process results in a deeper understanding of science that combines knowledge and facts with reasoning and critical thinking. These student learning experiences incorporate a variety of instructional resources and technology. The experiences help to develop successful and productive citizens who understand the impact of science on their daily lives.
Overall Goals and Objectives
Similar to middle school students, the goal of the FCPS’s secondary science program for high school students is to ensure that all high school students can use and apply scientific knowledge.
High school science classes actively involve students in learning science concepts using the processes and tools of science to explore their scientific interests. To obtain a Maryland diploma, three credits in laboratory science are required. Science instruction must include instruction in earth and space science, life science and physical science curricula to be aligned to the MSSS and prepare for the MISA.
The goal for a quality science education (Taking Science to School, National Research Council, 2007) is to develop student proficiency in:
• Knowing, using, and interpreting scientific explanations of the natural world (disciplinary core ideas and cross-cutting concepts);
• Generating and evaluating scientific evidence and explanations (practices);
• Participating productively in scientific practices and discourse (practices); and

• Understanding the nature and development of scientific knowledge (practices and cross-cutting concepts).
Overall Accomplishments Based on the Maryland High School Assessment (HSA) performance results for Biology, all students showed a slight overall increase of 0.9% from 2015 to 2016 (see Table 2.16). All student groups, except black/African American and students with disabilities, showed some level of increase in performance in HSA Biology from 2015 to 2016.
Note on HSA Biology Data Reporting: HSA Biology results have previously been reported by test performance status in grade 10, 11, and 12. Performance status included the highest score for a student taking the assessment. Historically, this data reporting has shown approximately 90% (or more) of students performing proficiently on HSA Biology by either grade 10, 11, or 12. To parallel PARCC reporting, this is the first year (in about 10 years) that all administrations of HSA Biology has been reported. Reporting of all administrations includes multiple assessments taken by a student. As a result, HSA Biology reporting presents lower overall scores than in prior years.
Special Education Students
Goals and Objectives The goals and objectives for students with disabilities in secondary science are consistent with the overall goals and objectives for all FCPS students with disabilities.
Accomplishments From 2014 to 2016, the HSA Biology performance of students with disabilities increased from 2014 (26.6%) to 2016 (28.9%) despite a small decline in 2015 (see Table 2.16). The achievement gap between all FCPS students and students with disabilities decreased by approximately 2% from 2014 to 2016.
Challenges Challenges for students with disabilities accessing instruction in Biology remain. When analyzing 2016 HSA Biology results for students with disabilities, a 43% gap remains in comparison to all FCPS students.
Strategies and Changes In addition, systemic strategies are being implemented to ensure progress among students receiving special education services in secondary science. Refer to Global Strategies or Changes in the Special Education section.
Limited English Proficient Students
Goals and Objectives The goals and objectives for ELL students in secondary science are consistent with the overall goals and objectives for all FCPS ELL students.
Accomplishments From 2015 to 2016, there was an increase in performance among ELL students taking HSA Biology (15.0% to 23.8% proficient) (see Table 2.16).
Challenges FCPS has few accomplishments for ELL students taking HSA Biology despite the increase in performance over the last two years. ELL students remain the lowest performing FCPS student group in HSA Biology with the largest achievement gap of 48.9% in 2016 (when compared to all FCPS students) (see Table 2.16).
Strategies and Changes In addition, systemic strategies are being implemented to ensure progress among all ELL students in secondary science. Refer to Global Strategies or Changes in the Limited English Proficiency section.
Students Failing to Meet or Make Progress Towards State Performance Standards Goals and Objectives The goals and objectives of all FCPS students, including those failing to meet or make progress towards performance standards, in secondary science is to reduce the achievement gap.
Accomplishments From 2014 to 2016, HSA Biology proficiency rates increased by 2% among black/African American students and 1% for students receiving FARM. See Table 2.16.
Challenges Despite these incremental accomplishments, challenges are still evident among certain student groups—black/African American, Hispanic/Latino, Native Hawaiian/Other Pacific Islander, two or more races, and students receiving special education, ELL, and FARM. These students are performing at a lower achievement level than the FCPS student population as a whole.
Strategies and Changes FCPS is aligning biology curriculum to the MSSS in accordance with MSDE’s expectation that all LEAs be aligned by 2017-2018 and in preparation for MISA (field testing may occur spring 2017). The new Biology curriculum will incorporate cross-cutting concepts, disciplinary core ideas and science and engineering practices around real world topics. The new MSSS standards support MSCCS in ELA and math. MSSS standards are “hands-on” as well as “minds-on”. Students act like scientists in science classrooms and employ higher level thinking strategies
FCPS will be implementing a new updated text resource with corresponding online resources in all Biology classes in 2016-2017 to ensure progress for all students. The previous text and resources were dated (over ten years old). These new resources are current, engaging, and include strategies for reaching all students. The units are being designed using the UDL framework. The new text resources were purchased using local funds.

HS A GOVERNMENT FCPS’s social studies program promotes the preparation of global citizens for a dynamic and diverse world. FCPS’s social studies offerings provide an opportunity for students to experience history, economics, government and geography from multiple perspectives. Students engage in authentic disciplinary activities to gain a greater understanding of themselves and the world in which they live. All social studies coursework is undergirded from grades 6 through 12 with skills and processes in reading and writing aligned with the college and career ready standards.
Overall Goals and Objectives
FCPS’s secondary social studies program will focus on the following three goals during the 2016-2017 school year. • Goal 1. Continue development and revision of disciplinary literacy activities and formative
document based question (DBQs) assessments, and implementation of these activities and assessments in all required courses grades 6-12 to support the college and career ready and content standards.
• Goal 2. Examine course sequence change in high school for the improvement of Government HSA scores by moving American Studies II to grade 9 and Government to grade 10.
• Goal 3. Development of web-based resources to support social studies instruction for all learners in grades 6-12.
Overall Accomplishments
In the 2015-2016 school year, each core class (grades 6-11) implemented the new DBQ assessments. Due to the year-long nature of middle school courses, four DBQs were administered at each grade level. In the semesterized high school courses, two DBQs were administered for Modern World History and American Studies II. The local Government assessments included four shorter DBQ type questions and one selected response assessment that mirrored the Government HSA in format.
For the 2016-2017 school year, the Government assessment was adjusted to two more lengthy DBQ tasks similar to the other social studies courses. A new social studies writing rubric was developed based on the MCCRS and implemented as part of this assessment process. A

companion document of spiraling skills and process for grades 6-12 was created to help guide rubric use. The documents were both aligned to MCCRS.
Special Education Students
Goals and Objectives The goals and objectives for students with disabilities in secondary social studies are consistent with the overall goals and objectives for students with disabilities in FCPS.
Accomplishments The data from Table 2.17 includes all HSA Government test administrations; therefore, these data include students who had multiple test administrations (i.e., retests) within the course of a school year. Thus, very few accomplishments can be reported as proficiency rates appear lower compared to past reporting.
Note: Similar to HSA Biology, this is the first year in many years that HSA Government has been reported in this manner. Past data reporting for the Master Plan were based on performance status by grade level; thus, accounting for the highest score for a student.
Challenges According to Table 2.17, a significant disparity exists in pass rates on all test administrations between general education students and students who receive special education services. In 2016, 24.3% of students who receive special education services passed the Government HSA compared to 68.6% for their general education peers, a difference of 44.3%. Government HSA scores in 2016 declined overall by 8.5% to 68.6% for all test administrations and test takers, a decline also seen in the scores for students who receive special education services. It should be noted that the Government HSA was reinstated in the 2013-2014 school year and the 2014 data may not reflect many retakers. From 2014 to 2016, the number of test administrations increased which does not necessarily reflect a growth in high school population, rather this increase in administrations may be due to students retaking the exam.
The decline in pass rates for students who receive special education services is greater than the decline for general education students between 2015 and 2016 the students receiving special education services’ scores declined by 11.2% compared to the 8.5% of their general education peers during this time period. Further disparities are found between male and female special education test takers with male students receiving special education services outperforming their female peers in 2014, 2015, and 2016.
Strategies and Changes The intensive reading, writing, and vocabulary skills required for the Government course and HSA present a challenge for all students and especially those with disabilities. The following strategies will be implemented in the 2016-2017 school year.
• Resequencing. As individual schools examine resequencing options, including moving American Studies II to grade 9 and Government to grade 10, schools are encouraged to take into account the data for their students receiving special education services. Resequencing of high school courses could provide an additional year for students to

develop reading and writing skills necessary for success on the Government HSA. For schools that choose to resequence American Studies II in grade 9 and Government in grade 10, data will be available in the 2019-2020 school year. (Costs to be determined depending on course enrollment.)
• Targeted Interventions. Some schools are experimenting with targeted interventions for their struggling learners and have found success using this strategy. Data will be available for analysis at the conclusion of the 2016-2017 school year for those schools participating in a targeted intervention. (Cost-neutral)
• Additional Instructional Materials. The creation of additional instructional materials that support the reading and writing process in the Government course is also necessary. This work began in the summer of 2016 with the creation of a new Social Studies website to support instruction and will continue throughout the 2016-2017 school year through professional learning opportunities offered to Government teachers. The creation of web-based resources for teaching the course will provide teachers with tools for supporting all students and specifically those with special needs. Targeted teacher training with vocabulary, reading and writing strategies will also support the needs of these students.
FCPS allocated approximately $16,000 in unrestricted funds for teacher workshops during the summer of 2016 for the development of innovative instructional materials for Government and creation of the new social studies website as a portal for teachers to acquire and share instructional materials. An additional $4,300 is allocated in the 2016-2017 budget to support continued teacher professional learning in this area. These resources benefit all students including students receiving special education services. (This training is part of $4,300 allocated for professional learning—funding of summer workshops in 2017 will ensure continued professional learning opportunities to support vocabulary, reading and writing instruction in social studies).
• Scheduling. Most high schools in FCPS instituted a new schedule in the 2016-2017 school year that includes an extension/reteaching time for teachers to pull students for direct interventions. These direct interventions are likely to benefit all learners. The addition of an extension/reteaching period in the high school schedule was the result of the successful use of this intervention at one FCPS high school. Students at this school exceeded performance standards consistently during the first five years the school was open. Data will also be available at the end of the 2016-2017 school year to determine the impact of the extension/remediation period (cost-neutral).
Limited English Proficient Students
Goals and Objectives The goals and objectives for ELL students in secondary social studies are consistent with the overall goals and objectives for all FCPS ELL students in secondary social studies.
Accomplishments Data supports the large achievement gaps that exist between ELL students and their student peers. Thus, very few accomplishments can be noted in Government HSA for this student

group. ELL students are the lowest performing group in Government HSA across the past three administrations.
Challenges ELL students underperformed on the Government HSA when compared to their peers. According to Table 2.17, this disparity for all test administrations (i.e., ELL compared to all student group) increased from 2014 to 2016. The declining overall pass rates from all test takers are reflected in this data. This decline may be due in part to an increase in students retaking the exam in the data.
Disparities between male and female ELL student pass rates are observed in all administration years with males outperforming females. This gap closed significantly in 2015 with less than 1% difference in performance; however, a dramatic overall decrease in scores continue to occur.
Strategies Similar strategies that will be implemented with students receiving special education services will also be implemented for ELL students in the 2016-2017 school year. These include:
• Additional Instructional Materials. During the summer of 2016, teachers worked to develop an online component of the Government course with a focus on vocabulary activities. During the 2016-2017 school year, staff will engage in professional development
to create instructional resources to help support ELL students especially in the area of vocabulary acquisition. During the summer of 2016 approximately $16,000 in unrestricted funds was allocated for the development of innovative instructional resources for Government. Further unrestricted funds in the amount of $4,300 are budgeted for the 2016-2017 school year to support additional development of instructional materials to benefit all students including ELL students.
• Resequencing/Targeted Interventions. Some schools are also piloting targeted interventions for low level readers by moving Government to grade 10 and having these students complete the American Studies II course in grade 9. An overall resequence of the high school social studies program that reflects these targeted interventions could better meet the needs of all students. This resequence would be expected to positively impact ELL students in their acquisition of language and understanding of the thematic concepts of American Government. Schools that are examining a resequencing of courses are encouraged to review the data for all learners to inform this decision. Current targeted intervention programs will produce data during the 2015-2016 and 2016-2017 school years. Analysis of this data will be conducted once available.

Students Failing to Meet or Make Progress Towards State Performance Standards The social studies program supports the success of all learners. For students to meet the goal of global citizenship, all students must show proficiency on these standard measures of achievement.
Goals and Objectives Identifying sound research-based instructional strategies, providing teacher training and support in these strategies, and making them available for all students is the goal in eliminating the achievement gap. Personalization of learning and the application of the UDL principles and practices will also help eliminate this gap. Collaboration with the AAE Department as well as the SASI Department will allow for continued monitoring of goals and development of strategies to achieve goals.
Accomplishments Again, very few accomplishments can be reported as proficiency rates appear lower compared to past reporting and new reporting methods.
Challenges The data in Table 2.17 shows that some student groups are failing to meet performance standards on the Government HSA when compared to the overall FCPS student population--black/African American, Hispanic/Latino, two or more races, and students receiving special services (i.e., special education, ELL, and FARM).
• Disparities also exist between males and females in many of these student groups. Specifically, black/African American students underperform when compared to the student population as a whole, with black/African American females outperforming black/African American males by 7.1% in 2014, 8.7% in 2015, and 7.1% in 2016.
• Hispanic/Latino students experience higher passing rates than black/African American students, but Hispanic/Latino students are still behind the whole by 6.4% in 2014, 9% in 2015, and 16.8% in 2016.
• Students receiving special education services have the lowest pass rate, underperforming in 2014 by 36.9%, in 2015 by 41.6%, and in 2016 by 44.3%. Male students with disabilities outperformed females receiving special education services by 12.5% in 2014, 10.5% in 2015, and 11.6% in 2016.
• ELL students overall underperformed by 30.1% in 2014, 41.7% in 2015, 54.2% in 2016, with a male/female disparity existing in all administration years.
• Students receiving FARM also underperformed by 17.6% in 2014, 20.6% in 2015, and 24.2% in 2016. Students receiving FARM had negligible male/female disparity in all administration years.
• In 2015, ELL students scored at a similar rate (35.4% passing) to students receiving special education services (35.5% passing). In 2016, this gap increased (14.4% passing and 24.3% passing; ELL and students with disabilities, respectively). Large achievement gaps exist between these student groups and their general education peers.

• According to the Maryland Report Card, overall in 2014, FCPS students who identify as black/African American, Hispanic/Latino, two or more races outperformed their peers across the state, as did students receiving special education services, ELL services and FARMS. In 2015, the Maryland Report Card showed above average pass rates for Hispanic/Latino and ELL students. Disparities between male and female ELL and male and female Hispanic/Latino students closed significantly between 2014 and 2015.
Strategies or Changes UDL and other research based strategies, intervention opportunities, curriculum and instructional practices supporting and aligned with the MCCCR frameworks for social studies, will continue as hallmarks of the social studies instructional program. Social studies instruction will continue to focus on the content standards for teaching Government, and professional learning based on teachers’ needs. The implementation of the intervention period in most high schools and targeted interventions that sequence American Studies II before Government will be examined.
Other strategies include:
• Collaboration with the ELL staff in the AAE development of vocabulary and reading strategies in the Government content. As the ELL population increases it is imperative that FCPS continues to evolve its practice to meet the needs of this diverse population.
• Personalization of learning using technology to blend traditional instruction with student centered activities that provide students an opportunity to choose their path, place and pace of learning is being developed. Allowing students to choose their own path to learning, setting their own pace, and sometimes their own place of learning provides the opportunity for students to have ownership over their learning and thus more fully engage in the learning process.
• Increased collaboration with the new AAE Department. The AAE department oversees special education and ELL; both are key to monitoring student success and developing systemic initiatives to address the achievement gap.
• Systemic focus on cultural proficiency. Cultural proficiency enables teachers to understand the learners in their classrooms and tailor learning experiences to better meet the needs of individual students.
• Implementation of the new Social Studies Writing Rubric supported by CCR standards and the use of new Benchmark DBQ assessments. New benchmark DBQ assessments focus attention on reading and writing strategies which are imperative for success on the Government HSA.
All instructional strategies listed will be implemented in the 2016-2017 school year. Teachers participated in professional learning activities beginning in the summer of 2016, and these professional learning activities will continue throughout the 2016-2017 school year. Student progress will be measured using performance data from the Government HSA test administrations for this time period, as well as performance data available in the teacher access center (TAC) on local benchmark DBQ assessments.

Approximately $16,000 in unrestricted funds were allocated in the summer of 2016 to support the creation of web-based resources for instruction, as well as the new writing rubric and benchmark assessments. An additional $4,300 of unrestricted funds is budgeted to support further development of teacher resources and blended professional learning.
Mu lti -Sta te Alternate Asse ssment ( O p t i o n a l R e p o r t i n g )
The Multi-State Alternate Assessment (MSAA) is designed to measure academic content that is aligned to and derived from Maryland content standards. The MSAA supports higher academic outcomes for students with significant cognitive disabilities in preparation for post-secondary outcomes. The MSAA is administered in ELA and math in grades 3-8 and 11.
Accomplishments The MSAA was first administered in FCPS during the 2015-2016 school year; therefore, only baseline data are available. It is important to note that grade 11 students in Maryland were exempt from participating in the MSAA in 2015-2016 as these students fulfilled their assessment requirements by taking the ALT-MSA in grade 10. For the most part, students taking the MSAA performed better in math compared to ELA (see Table M).
Challenges Generalization of the MSAA results by student group cannot be made due to a small group size.
Strategies or Changes FCPS provides IEPs for FCPS students with severe intellectual, physical, emotional, hearing, and visual and learning disabilities. Curriculum focuses on functional academic skills, social skills training, community-based instruction, personal management, and communication skills. In addition, older students participate in vocational training, supported by employment and work-study programs. FCPS partners with multiple community agencies to coordinate services for its students with disabilities and their families.
Table M. 2016 Multi-State Alternate Assessment Results PROFICIENCY LEVELS—BY GRADE AND CONTENT
Grade Percent of Students Performing at Levels 3-4
ELA Math
3 47.1% 47.1%
4 31.8% 31.8%
5 28.6% 53.6%
6 32.0% 36.0%
7 29.7% 37.8%
8 28.9% 39.5%
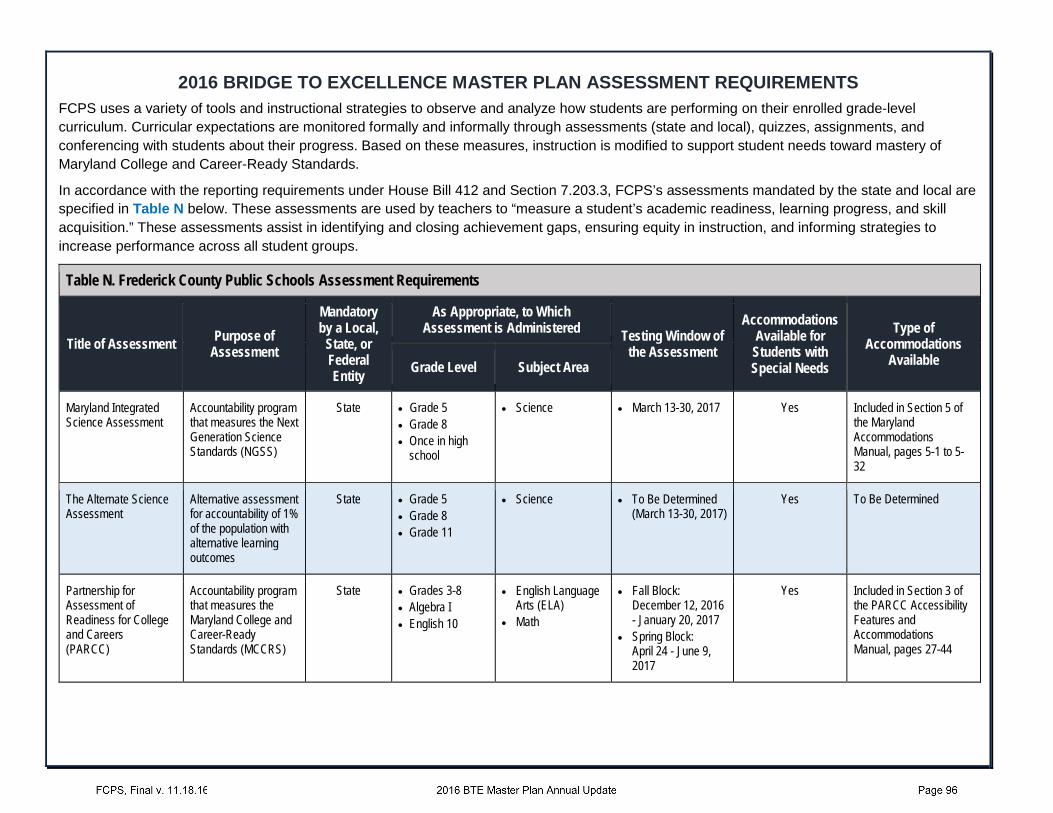
2016 BRIDGE TO EXCELLENCE MASTER PLAN ASSESSMENT REQUIREMENTS FCPS uses a variety of tools and instructional strategies to observe and analyze how students are performing on their enrolled grade-level curriculum. Curricular expectations are monitored formally and informally through assessments (state and local), quizzes, assignments, and conferencing with students about their progress. Based on these measures, instruction is modified to support student needs toward mastery of Maryland College and Career-Ready Standards.
In accordance with the reporting requirements under House Bill 412 and Section 7.203.3, FCPS’s assessments mandated by the state and local are specified in Table N below. These assessments are used by teachers to “measure a student’s academic readiness, learning progress, and skill acquisition.” These assessments assist in identifying and closing achievement gaps, ensuring equity in instruction, and informing strategies to increase performance across all student groups.
Table N. Frederick County Public Schools Assessment Requirements
Title of Assessment Purpose of Assessment
Mandatory by a Local,
State, or Federal Entity
As Appropriate, to Which Assessment is Administered Testing Window of
the Assessment
Accommodations Available for
Students with Special Needs
Type of Accommodations
Available Grade Level Subject Area
Maryland Integrated Science Assessment
Accountability program that measures the Next Generation Science Standards (NGSS)
State • Grade 5• Grade 8• Once in high
school
• Science • March 13-30, 2017 Yes Included in Section 5 of the Maryland Accommodations Manual, pages 5-1 to 5-32
The Alternate Science Assessment
Alternative assessment for accountability of 1% of the population with alternative learning outcomes
State • Grade 5• Grade 8• Grade 11
• Science • To Be Determined(March 13-30, 2017)
Yes To Be Determined
Partnership for Assessment of Readiness for College and Careers (PARCC)
Accountability program that measures the Maryland College and Career-Ready Standards (MCCRS)
State • Grades 3-8• Algebra I• English 10
• English LanguageArts (ELA)
• Math
• Fall Block:December 12, 2016- January 20, 2017
• Spring Block:April 24 - June 9,2017
Yes Included in Section 3 of the PARCC Accessibility Features and Accommodations Manual, pages 27-44

Table N. Frederick County Public Schools Assessment Requirements
Title of Assessment Purpose of Assessment
Mandatory by a Local,
State, or Federal Entity
As Appropriate, to Which Assessment is Administered Testing Window of
the Assessment
Accommodations Available for
Students with Special Needs
Type of Accommodations
Available Grade Level Subject Area
The Multi-State Alternate Assessment (MSAA)
Alternative assessment for accountability of 1% of the population with alternative learning outcomes
State • Grades 3-8 • Grade 11
• ELA • Math
• March 6 - May 12, 2017
Yes Included in the MSAA Test Administration Manual, page 22
High School Assessments
Maryland graduation requirements
State • High school • Government • Biology
• January 2017 • May 2017 • July 2017
Yes Included in Section 5 of the Maryland Accommodations Manual, pages 5-1 to 5-32
Kindergarten Readiness Assessment (KRA)
The KRA identifies children's individual needs, enabling teachers to make informed instructional decisions.
State • Random sample of kindergarten students
• Measures: - social foundations - physical well-being
and motor development
- language and literacy
- mathematics
• August 22 – September 30, 2016
Yes Included in Guidelines on Allowable Supports for the KRA, page 7
ACCESS for ELLs English Language Proficiency Assessment
State • Kindergarten, Grades 1-12, non-English speaking students
• Measures English language proficiency in the areas of:
- listening - speaking - reading - writing - comprehension
and literacy
• Entry into the school system, then again in 2nd semester (January 9 - February 15, 2017)
No Not Applicable

Table N. Frederick County Public Schools Assessment Requirements
Title of Assessment Purpose of Assessment
Mandatory by a Local,
State, or Federal Entity
As Appropriate, to Which Assessment is Administered Testing Window of
the Assessment
Accommodations Available for
Students with Special Needs
Type of Accommodations
Available Grade Level Subject Area
Elementary School Math Interviews
Measure progress on MCCRS
Local • Prekindergarten • Kindergarten • Grade 1
• Math • Quarterly Yes Included in Section 5 of the Maryland Accommodations Manual, pages 5-1 to 5-32
Elementary School Math Benchmarks
Measure progress on MCCRS
Local • Grades 2-5 • Math • Grade 2: Quarterly • Grades 3-5:
three times per year
Yes Included in Section 5 of the Maryland Accommodations Manual, pages 5-1 to 5-32
Math Performance Series
Computer Adaptive Universal Screener
Local • Grade 2 • Grade 5
• Math • January 3 - February 22, 2017
Yes Included in Section 5 of the Maryland Accommodations Manual, pages 5-1 to 5-32
Elementary School ELA Oral Language Acquisition Inventory
Computer Adaptive Universal Screener
Local • Prekindergarten • ELA • Quarterly Yes Included in Section 5 of the Maryland Accommodations Manual, pages 5-1 to 5-32
Elementary School ELA Benchmark Assessment System
Measure progress on MCCRS
Local • Prekindergarten • Kindergarten-
Grades 1-2 • Grades 3-4 • Grade 5
• ELA • Prekindergarten: Quarter 4
• Kindergarten, Grades 1-2: Quarters 1, 2, and 4
• Grades 3-4: Quarters 1 and 3
• Grade 5: Quarter 1
Yes Included in Section 5 of the Maryland Accommodations Manual, pages 5-1 to 5-32
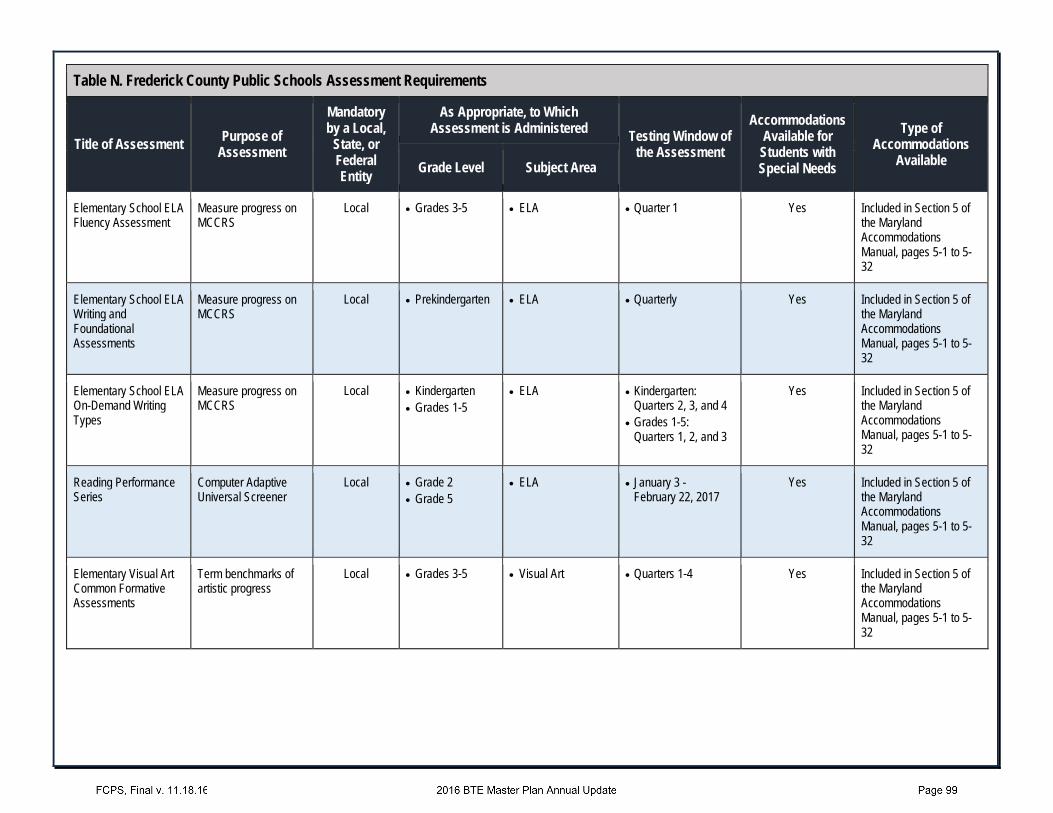
Table N. Frederick County Public Schools Assessment Requirements
Title of Assessment Purpose of Assessment
Mandatory by a Local,
State, or Federal Entity
As Appropriate, to Which Assessment is Administered Testing Window of
the Assessment
Accommodations Available for
Students with Special Needs
Type of Accommodations
Available Grade Level Subject Area
Elementary School ELA Fluency Assessment
Measure progress on MCCRS
Local • Grades 3-5 • ELA • Quarter 1 Yes Included in Section 5 of the Maryland Accommodations Manual, pages 5-1 to 5-32
Elementary School ELA Writing and Foundational Assessments
Measure progress on MCCRS
Local • Prekindergarten • ELA • Quarterly Yes Included in Section 5 of the Maryland Accommodations Manual, pages 5-1 to 5-32
Elementary School ELA On-Demand Writing Types
Measure progress on MCCRS
Local • Kindergarten • Grades 1-5
• ELA • Kindergarten: Quarters 2, 3, and 4
• Grades 1-5: Quarters 1, 2, and 3
Yes Included in Section 5 of the Maryland Accommodations Manual, pages 5-1 to 5-32
Reading Performance Series
Computer Adaptive Universal Screener
Local • Grade 2 • Grade 5
• ELA • January 3 - February 22, 2017
Yes Included in Section 5 of the Maryland Accommodations Manual, pages 5-1 to 5-32
Elementary Visual Art Common Formative Assessments
Term benchmarks of artistic progress
Local • Grades 3-5 • Visual Art • Quarters 1-4 Yes Included in Section 5 of the Maryland Accommodations Manual, pages 5-1 to 5-32

Table N. Frederick County Public Schools Assessment Requirements
Title of Assessment Purpose of Assessment
Mandatory by a Local,
State, or Federal Entity
As Appropriate, to Which Assessment is Administered Testing Window of
the Assessment
Accommodations Available for
Students with Special Needs
Type of Accommodations
Available Grade Level Subject Area
Elementary Visual Art Common Summative Assessments
Semester summary of student achievement
Local • Grades 1-5 • Visual Art • January 2017 • May 2017
Yes Included in Section 5 of the Maryland Accommodations Manual, pages 5-1 to 5-32
Elementary General Music Common Formative Assessments
Term benchmarks of artistic progress
Local • Grades 3-5 • General Music • Quarters 1-4 Yes Included in Section 5 of the Maryland Accommodations Manual, pages 5-1 to 5-32
Elementary General Music Common Summative Assessments
Semester summary of student achievement
Local • Grades 1-5 • General Music • January 2017 • May 2017
Yes Included in Section 5 of the Maryland Accommodations Manual, pages 5-1 to 5-32
Elementary School Physical Education Benchmarks
Measure progress on FCPS PE standards
Local • Grades K-5 • Physical Education • Year-long (3-5 times per term)
Yes Included in Section 5 of the Maryland Accommodations Manual, pages 5-1 to 5-32
Middle School Math Benchmarks
Measure progress on MCCRS
Local • Grades 6-8 • Math • Quarters 2 and 3 Yes Included in Section 5 of the Maryland Accommodations Manual, pages 5-1 to 5-32

Table N. Frederick County Public Schools Assessment Requirements
Title of Assessment Purpose of Assessment
Mandatory by a Local,
State, or Federal Entity
As Appropriate, to Which Assessment is Administered Testing Window of
the Assessment
Accommodations Available for
Students with Special Needs
Type of Accommodations
Available Grade Level Subject Area
Math Performance Series
Computer Adaptive Universal Screener
Local • Grade 8 • Math • January 3 - February 22, 2017
Yes Included in Section 5 of the Maryland Accommodations Manual, pages 5-1 to 5-32
Middle School English Language Narrative Writing Task
Measure progress on MCCRS
Local • Grades 6-8 • ELA • Quarter 1 Yes Included in Section 5 of the Maryland Accommodations Manual, pages 5-1 to 5-32
Middle School Literary Writing Task
Measure progress on MCCRS
Local • Grades 6-8 • ELA • Quarter 3 Yes Included in Section 5 of the Maryland Accommodations Manual, pages 5-1 to 5-32
Middle School Research Simulation Task
Measure progress on MCCRS
Local • Grades 6-8 • ELA • Quarter 4 Yes Included in Section 5 of the Maryland Accommodations Manual, pages 5-1 to 5-32
Reading Performance Series
Computer Adaptive Universal Screener
Local • Grade 8 • Math • January 3 – February 22, 2017
Yes Included in Section 5 of the Maryland Accommodations Manual, pages 5-1 to 5-32

Table N. Frederick County Public Schools Assessment Requirements
Title of Assessment Purpose of Assessment
Mandatory by a Local,
State, or Federal Entity
As Appropriate, to Which Assessment is Administered Testing Window of
the Assessment
Accommodations Available for
Students with Special Needs
Type of Accommodations
Available Grade Level Subject Area
Middle School Social Studies Performance Task 1
Measure progress on Maryland State Social Studies Standards (MSSSS)
Local • Grades 6-8 • Social Studies • Quarter 1 or 2 Yes Included in Section 5 of the Maryland Accommodations Manual, pages 5-1 to 5-32
Middle School Social Studies Performance Task 2
Measure progress on MSSSS
Local • Grades 6-8 • Social Studies • Quarter 3 or 4 Yes Included in Section 5 of the Maryland Accommodations Manual, pages 5-1 to 5-32
Science Performance Task 1 and 2
Measure progress on Maryland State Science Standards (MSSS)
Local • Grades 6-8 • Science • Quarters 1 and 2 Yes Included in Section 5 of the Maryland Accommodations Manual, pages 5-1 to 5-32
Science Performance Task 3 and 4
Measure progress on MSSS
Local • Grades 6-8 • Science • Quarters 3 and 4 Yes Included in Section 5 of the Maryland Accommodations Manual, pages 5-1 to 5-32
Middle School Physical Education Benchmarks
Measures progress on essential curriculum
Local • Grades 6-8 • Physical Education • 5 assessments per term
Yes Included in Section 5 of the Maryland Accommodations Manual, pages 5-1 to 5-32
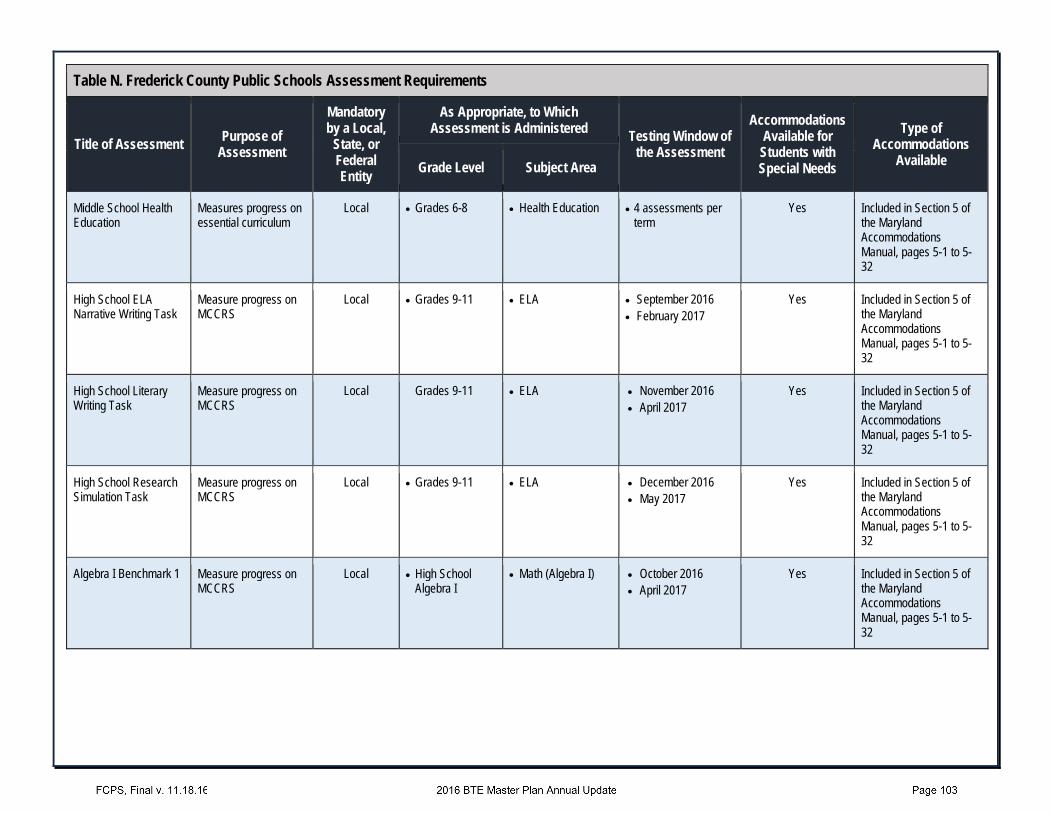
Table N. Frederick County Public Schools Assessment Requirements
Title of Assessment Purpose of Assessment
Mandatory by a Local,
State, or Federal Entity
As Appropriate, to Which Assessment is Administered Testing Window of
the Assessment
Accommodations Available for
Students with Special Needs
Type of Accommodations
Available Grade Level Subject Area
Middle School Health Education
Measures progress on essential curriculum
Local • Grades 6-8 • Health Education • 4 assessments per term
Yes Included in Section 5 of the Maryland Accommodations Manual, pages 5-1 to 5-32
High School ELA Narrative Writing Task
Measure progress on MCCRS
Local • Grades 9-11 • ELA • September 2016 • February 2017
Yes Included in Section 5 of the Maryland Accommodations Manual, pages 5-1 to 5-32
High School Literary Writing Task
Measure progress on MCCRS
Local Grades 9-11 • ELA • November 2016 • April 2017
Yes Included in Section 5 of the Maryland Accommodations Manual, pages 5-1 to 5-32
High School Research Simulation Task
Measure progress on MCCRS
Local • Grades 9-11 • ELA • December 2016 • May 2017
Yes Included in Section 5 of the Maryland Accommodations Manual, pages 5-1 to 5-32
Algebra I Benchmark 1 Measure progress on MCCRS
Local • High School Algebra I
• Math (Algebra I) • October 2016 • April 2017
Yes Included in Section 5 of the Maryland Accommodations Manual, pages 5-1 to 5-32

Table N. Frederick County Public Schools Assessment Requirements
Title of Assessment Purpose of Assessment
Mandatory by a Local,
State, or Federal Entity
As Appropriate, to Which Assessment is Administered Testing Window of
the Assessment
Accommodations Available for
Students with Special Needs
Type of Accommodations
Available Grade Level Subject Area
Algebra I Benchmark 2 Measure progress on MCCRS
Local • High School Algebra I
• Math (Algebra I) • December 2016 • May 2017
Yes Included in Section 5 of the Maryland Accommodations Manual, pages 5-1 to 5-32
Geometry Benchmark 1 Measure progress on MCCRS
Local • High School Geometry
• Math (Geometry) • October 2016 • March 2017
Yes Included in Section 5 of the Maryland Accommodations Manual, pages 5-1 to 5-32
Geometry Benchmark 2 Measure progress on MCCRS
Local • High School Geometry
• Math (Geometry) • December 2016 • May 2017
Yes Included in Section 5 of the Maryland Accommodations Manual, pages 5-1 to 5-32
Algebra II Benchmark 1 Measure progress on MCCRS
Local • High School Algebra II
• Math (Algebra II) • October 2016 • April 2017
Yes Included in Section 5 of the Maryland Accommodations Manual, pages 5-1 to 5-32
Algebra II Benchmark 2 Measure progress on MCCRS
Local • High School Algebra II
• Math (Algebra II) • December 2016 • May 2017
Yes Included in Section 5 of the Maryland Accommodations Manual, pages 5-1 to 5-32

Table N. Frederick County Public Schools Assessment Requirements
Title of Assessment Purpose of Assessment
Mandatory by a Local,
State, or Federal Entity
As Appropriate, to Which Assessment is Administered Testing Window of
the Assessment
Accommodations Available for
Students with Special Needs
Type of Accommodations
Available Grade Level Subject Area
Government Benchmark 1
Measure progress on MSSSS
Local • High SchoolGovernment
• Social Studies(Government)
• October 2016• March 2017
Yes Included in Section 5 of the Maryland Accommodations Manual, pages 5-1 to 5-32
Government Benchmark 2
Measure progress on MSSSS
Local • High SchoolGovernment
• Social Studies(Government)
• December 2016• May 2017
Yes Included in Section 5 of the Maryland Accommodations Manual, pages 5-1 to 5-32
Biology Experimental Design and Data Tasks
Measure progress on MSSS
Local • High SchoolBiology
• Science (Biology) • ThroughoutSemester
Yes Included in Section 5 of the Maryland Accommodations Manual, pages 5-1 to 5-32
High School Physical Education Benchmarks
Measures progress on essential curriculum
Local • High School • Physical EducationFitness For Life
• 5 assessments perterm
Yes Included in Section 5 of the Maryland Accommodations Manual, pages 5-1 to 5-32
High School Health Education
Measures progress on essential curriculum
Local • High School • Health Education • 4 assessments perterm
Yes Included in Section 5 of the Maryland Accommodations Manual, pages 5-1 to 5-32
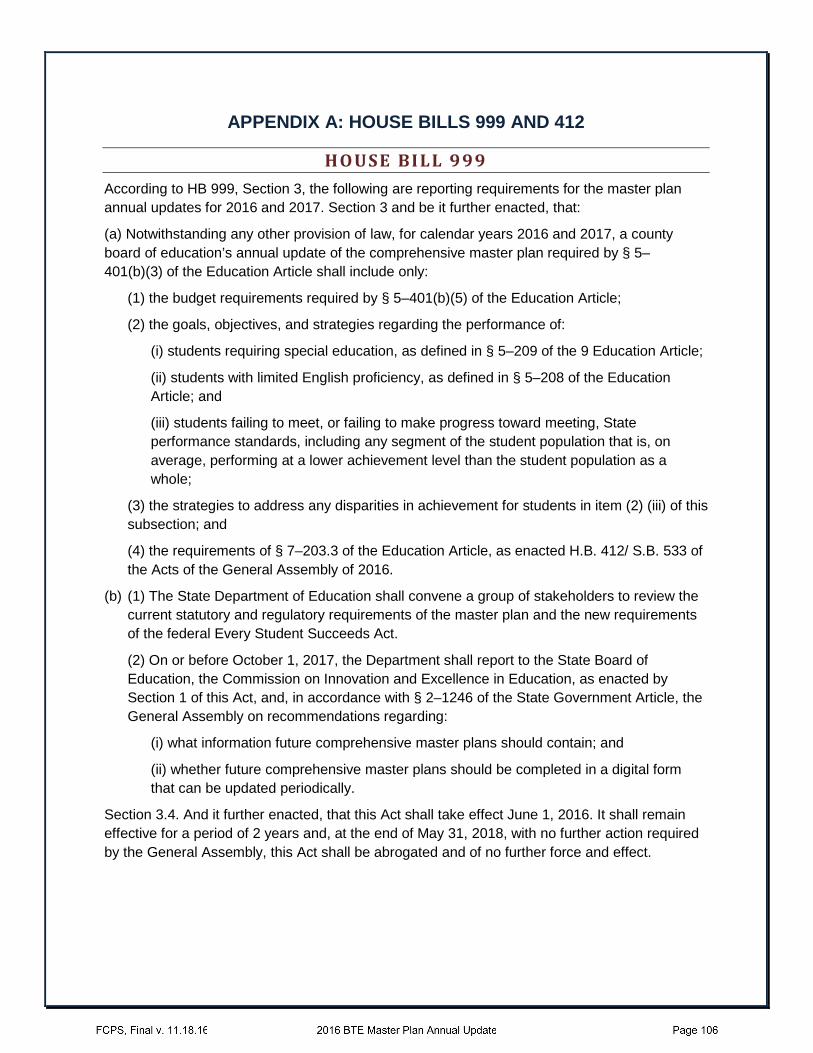
APPENDIX A: HOUSE BILLS 999 AND 412
HOUSE BI LL 999 According to HB 999, Section 3, the following are reporting requirements for the master plan annual updates for 2016 and 2017. Section 3 and be it further enacted, that:
(a) Notwithstanding any other provision of law, for calendar years 2016 and 2017, a county board of education’s annual update of the comprehensive master plan required by § 5–401(b)(3) of the Education Article shall include only:
(1) the budget requirements required by § 5–401(b)(5) of the Education Article;
(2) the goals, objectives, and strategies regarding the performance of:
(i) students requiring special education, as defined in § 5–209 of the 9 Education Article;
(ii) students with limited English proficiency, as defined in § 5–208 of the Education Article; and
(iii) students failing to meet, or failing to make progress toward meeting, State performance standards, including any segment of the student population that is, on average, performing at a lower achievement level than the student population as a whole;
(3) the strategies to address any disparities in achievement for students in item (2) (iii) of this subsection; and
(4) the requirements of § 7–203.3 of the Education Article, as enacted H.B. 412/ S.B. 533 of the Acts of the General Assembly of 2016.
(b) (1) The State Department of Education shall convene a group of stakeholders to review the current statutory and regulatory requirements of the master plan and the new requirements of the federal Every Student Succeeds Act.
(2) On or before October 1, 2017, the Department shall report to the State Board of Education, the Commission on Innovation and Excellence in Education, as enacted by Section 1 of this Act, and, in accordance with § 2–1246 of the State Government Article, the General Assembly on recommendations regarding:
(i) what information future comprehensive master plans should contain; and
(ii) whether future comprehensive master plans should be completed in a digital form that can be updated periodically.
Section 3.4. And it further enacted, that this Act shall take effect June 1, 2016. It shall remain effective for a period of 2 years and, at the end of May 31, 2018, with no further action required by the General Assembly, this Act shall be abrogated and of no further force and effect.

HOUSE BI LL 412 and SE CTI ON 7-203.3 The 2016 General Assembly House Bill 412, Assessment Administration and Provision of Information, Chapter 264 includes the new §7-203.3, Education Article of the Annotated Code of Maryland. As enacted by House Bill 412/Senate Bill 533, §7-203.3 reporting requirements are specified below:
(A) (1) In this section, “ASSESSMENT” means a locally, state, or federally mandated test that is intended to measure a student’s academic readiness, learning progress, and skill acquisition.
(2) “ASSESSMENT” does not include a teacher-developed quiz or test.
(B) This section does not apply to an assessment or test given to a student relating to:
(1) A student’s 504 Plan;
(2) The federal individuals with disabilities education Act, 20 U.S.C.1400; or
(3) Federal law relating to English Language Learners
(C) For each assessment administered in a local school system, each county board shall provide the following information:
(1) The title of the assessment;
(2) The purpose of the assessment;
(3) Whether the assessment is mandated by a local, state or federal entity;
(4) The grade level or subject area, as appropriate, to which the test is administered;
(5) The testing window of the assessment; and
(6) Whether accommodations are available for students with special needs and what the accommodations are.
(D) On or before October 15th of each year, the information required under subsection (A) of this shall be:
(1) updated;
(2) posted on the website of the county board; and
(3) included in the annual update of the county board’s master plan required under § 5–401 of this article section.
Section 2. And be it further enacted, that this shall take effect July 1, 2016.


![Error Bounds for Approximation in Chebyshev Points...; kf ¡qnk1 • 4M (‰¡1)‰n: (2.6) Proof: (2.1), (2.2a) and (2.2b) imply that for any x 2 [¡1;1] kf ¡pnk1 • nX¡1 j=0 0jb](https://img.dokumen.tips/doc/110x75/5f0380317e708231d4096015/error-bounds-for-approximation-in-chebyshev-points-kf-qnk1-a-4m-a1an.jpg)