Embed Size (px)
Citation preview

Logic Models
PADM 522

Components of a Logic Model
The components of Logic Model (column
titles)
Inputs
Activities
Outputs
Outcomes
Impact
Logic Model for a Senior Walking Program
Outputs Activities Impact Inputs Outcomes
Number of sites
that participate
(10)
Number of
seniors who
enroll (120)
Number that
complete the
program (100)
Number that
join in, even
though they
didn’t enroll
(20)
Number who
meet goals (70)
Number that
exceed goals
(20)
Hire staff
Get incentives and
pedometers
Train site leaders
(10)
Recruit seniors
(120)
Get baseline data.
Help seniors set
goals for walking
and fruit/veg
consumption, and
train them to use
pedometer and
logbooks.
Lead 10-week
program of walking
and nutrition ed
Collect followup
data
To improve the
health of older
adults (60+) in
Honolulu by
increasing
their level of
physical
activity and
consumption
of fruits and
vegetables
AARP
(pedometers,
incentives)
Lanakila
nutrition
support staff,
meal site
leaders, & new
staff person
In-kind support
from Honolulu
County and
Hawaii State
offices on
aging
HMSA
Foundation
funds
Increase from baseline
in number of steps
walked per week and
relative amount of F/V
consumed (70)
Increase from baseline
in feelings of energy,
endurance, strength,
and sound sleep (70)
Improvements from
baseline in attitude
toward exercise (50)
Number of seniors who
commit to continue
walking after the
program is over (30)
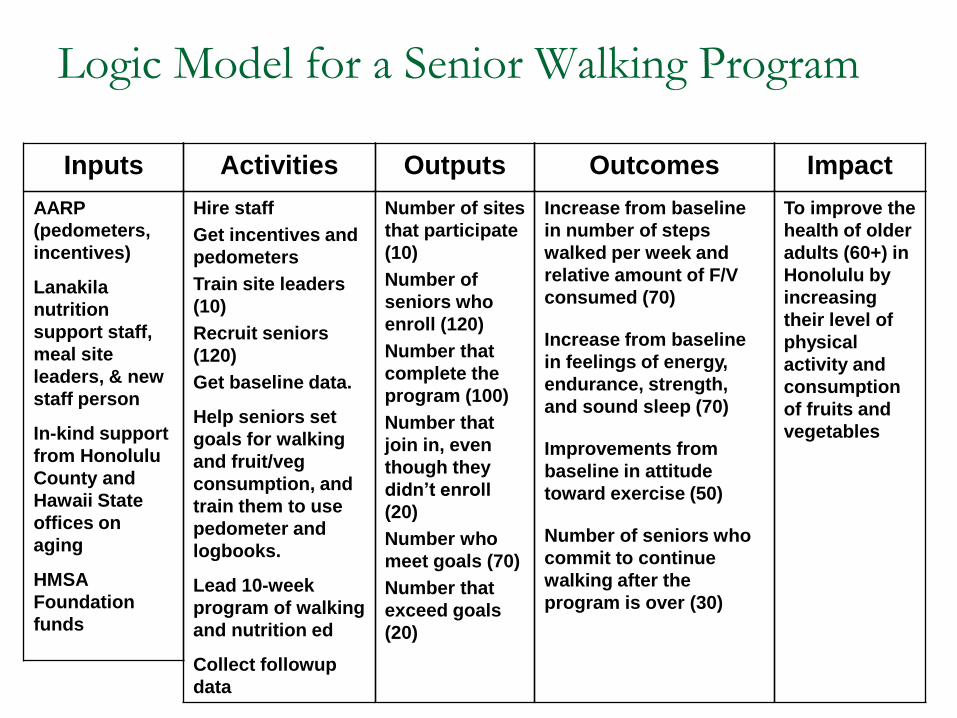
Logic Model components in connection with Strategic Management/Planning components Logic Model
Inputs
Activities
Outputs
Outcomes
Impacts
Strategic Framework
Strategic Goals
Strategic Objectives
Process objectives
Outcome objectives
Activities
Resources

Logic Model
Outputs Activities Impact Inputs Outcomes
PROCESS
OBJECTIVES
ACTIVITIES,
PROCESSES,
TASKS
GOAL(S)
RESOURCES
OUTCOME
OBJECTIVES

Inputs – aka Resources
Resources, such as
Funding
Facilities
Staff
Volunteers

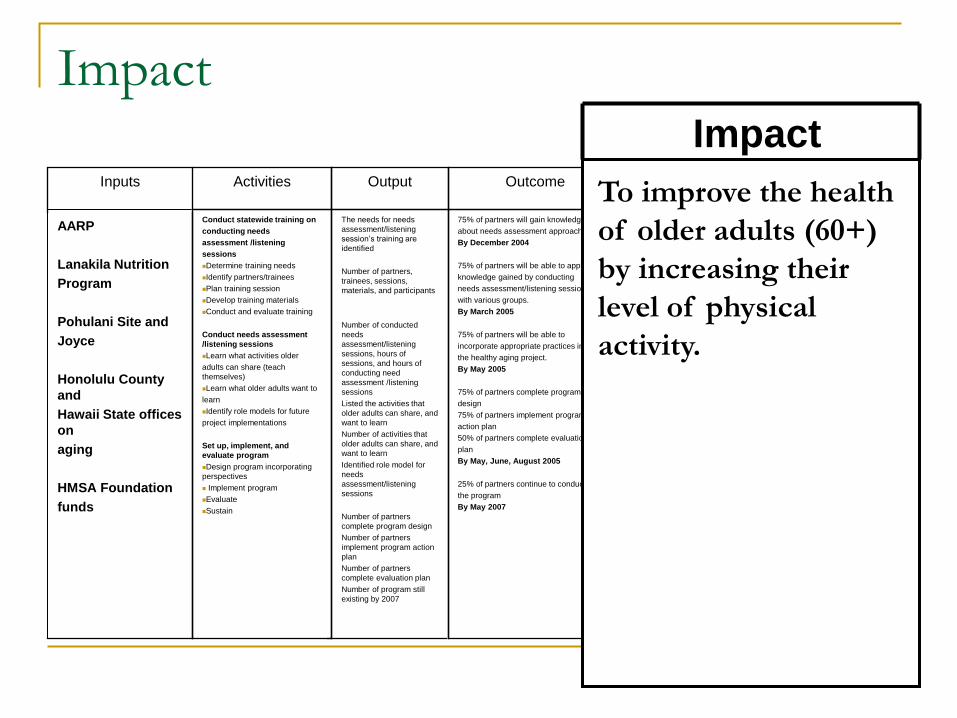
Inputs - Resources
Output Activities Impact Outcome
The needs for needs
assessment/listening
session’s training are
identified
Number of partners, trainees,
sessions, materials, and
participants
Number of conducted needs
assessment/listening
sessions, hours of sessions,
and hours of conducting
need assessment /listening
sessions
Listed the activities that
older adults can share, and
want to learn
Number of activities that
older adults can share, and
want to learn
Identified role model for
needs assessment/listening
sessions
Number of partners
complete program design
Number of partners
implement program action
plan
Number of partners
complete evaluation plan
Number of program still
existing by 2007
Conduct statewide training on
conducting needs
assessment /listening
sessions
Determine training needs
Identify partners/trainees
Plan training session
Develop training materials
Conduct and evaluate training
Conduct needs assessment
/listening sessions
Learn what activities older
adults can share (teach
themselves)
Learn what older adults want to
learn
Identify role models for future
project implementations
Set up, implement, and evaluate
program
Design program incorporating
perspectives
Implement program
Evaluate
Sustain
. 75% of partners will gain knowledge
about needs assessment approaches.
By December 2004
75% of partners will be able to apply
knowledge gained by conducting
needs assessment/listening sessions
with various groups.
By March 2005
75% of partners will be able to
incorporate appropriate practices in
the healthy aging project.
By May 2005
75% of partners complete program
design
75% of partners implement program
action plan
50% of partners complete evaluation
plan
By May, June, August 2005
25% of partners continue to conduct
the program
By May 2007
Senior Centers
Funds—foundation
funding, matching funds
Staff (new and existing)
Equipment
Inputs
To improve the
health of older
adults (60+) in
Honolulu by
increasing their
level of physical
activity and
consumption of
fruits and
vegetables

Activities aka Processes or Tasks
Events or actions of the program, such as
Recruiting seniors
Running the program
Collecting data

Activities - Processes
Output Impact Outcome
The needs for needs
assessment/listening
session’s training are
identified
Number of partners, trainees,
sessions, materials, and
participants
Number of conducted needs
assessment/listening
sessions, hours of sessions,
and hours of conducting
need assessment /listening
sessions
Listed the activities that
older adults can share, and
want to learn
Number of activities that
older adults can share, and
want to learn
Identified role model for
needs assessment/listening
sessions
Number of partners
complete program design
Number of partners
implement program action
plan
Number of partners
complete evaluation plan
Number of program still
existing by 2007
To improve the
health of older
adults (60+) in
Honolulu by
increasing their
level of physical
activity and
consumption of
fruits and
vegetables
75% of partners will gain knowledge
about needs assessment approaches.
By December 2004
75% of partners will be able to apply
knowledge gained by conducting
needs assessment/listening sessions
with various groups.
By March 2005
75% of partners will be able to
incorporate appropriate practices in
the healthy aging project.
By May 2005
75% of partners complete program
design
75% of partners implement program
action plan
50% of partners complete evaluation
plan
By May, June, August 2005
25% of partners continue to conduct
the program
By May 2007
Input
Partnership;
Hawaii Department
of
Health (Community
Health Division,
Executive
Office on Aging,
Hawaii
District Health
Office, etc.)
County agencies
Other public and
private agencies
Funding;
State
($ 10,000 per year)
Activities
Recruit seniors (120)
Lead 10-week walking
program
Collect data

Outputs aka Process Objectives
Direct products of the program, such as
Number of seniors recruited
Number of seniors retained

Outputs
Impact Outcome
To improve the
health of older
adults (60+) in
Honolulu by
increasing their
level of physical
activity and
consumption of
fruits and
vegetables
75% of partners will gain knowledge
about needs assessment approaches.
By December 2004
75% of partners will be able to apply
knowledge gained by conducting
needs assessment/listening sessions
with various groups.
By March 2005
75% of partners will be able to
incorporate appropriate practices in
the healthy aging project.
By May 2005
75% of partners complete program
design
75% of partners implement program
action plan
50% of partners complete evaluation
plan
By May, June, August 2005
25% of partners continue to conduct
the program
By May 2007
Activities
Conduct statewide training on
conducting needs
assessment /listening
sessions
Determine training needs
Identify partners/trainees
Plan training session
Develop training materials
Conduct and evaluate training
Conduct needs assessment
/listening sessions
Learn what activities older
adults can share (teach themselves)
Learn what older adults want to
learn
Identify role models for future
project implementations
Set up, implement, and evaluate
program
Design program incorporating
perspectives
Implement program
Evaluate
Sustain
Inputs
AARP
Lanakila Nutrition
Program
Pohulani Site and
Joyce
Honolulu County
and
Hawaii State offices
on
aging
HMSA Foundation
funds
Outputs •Number of seniors who
enroll (120)
•Number that complete the
program (100 out of 120)

Outputs
Activities
Outputs
Recruit seniors (120)
Number of seniors who enroll
(120)
Number that complete
program (100 out of 120)

Outcomes aka Outcome Objectives
Desired effects of the program, such as
Increase in physical activity
Increase in benefits of physical activity

Activities
Outcomes
Resources
AARP
Lanakila Nutrition
Program
Pohulani Site and
Joyce
Honolulu County
and
Hawaii State offices
on
aging
HMSA Foundation
funds
Conduct statewide training on
conducting needs
assessment /listening
sessions
Determine training needs
Identify partners/trainees
Plan training session
Develop training materials
Conduct and evaluate training
Conduct needs assessment
/listening sessions
Learn what activities older
adults can share (teach
themselves)
Learn what older adults want to
learn
Identify role models for future
project implementations
Set up, implement, and evaluate
program
Design program incorporating
perspectives
Implement program
Evaluate
Sustain
Impact
Share
Appropriate
healthy aging
practices with
older adults.
In the future:
Improve health
status of older
adults by starting
or continuing to
exercise and
eating fruits and
vegetables.
Output
The needs for needs
assessment/listening
session’s training are
identified
Number of partners, trainees,
sessions, materials, and
participants
Number of conducted needs
assessment/listening
sessions, hours of sessions,
and hours of conducting
need assessment /listening
sessions
Listed the activities that
older adults can share, and
want to learn
Number of activities that
older adults can share, and
want to learn
Identified role model for
needs assessment/listening
sessions
Number of partners
complete program design
Number of partners
implement program action
plan
Number of partners
complete evaluation plan
Number of program still
existing by 2007
Outcomes
•Increase from baseline in number
of steps walked per week (70 out
of 100)
•Increase from baseline in feelings
of energy, endurance, strength,
and sound sleep (70 out of 100)

Outcomes logically connect back to inputs, activities
Outcomes
Activities
Lead program for 10 weeks.
Collect data.
Increase from baseline in
number of steps walked per
week.
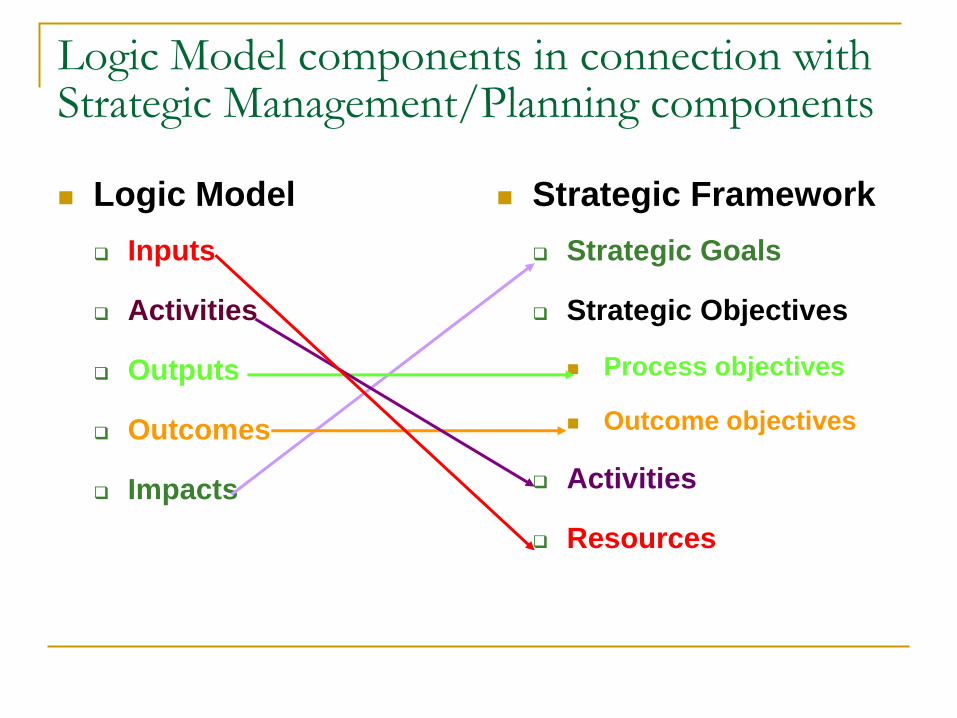
Impact recalls Goal(s)
Mission or ultimate purpose of a program,
translate into strategic goals and objectives
replicated in programmatic goals and objectives,
such as
Improved conditions,
Increased capacity, and
Reduced mortality.
Impact
Output Activities Outcome
The needs for needs
assessment/listening
session’s training are
identified
Number of partners,
trainees, sessions,
materials, and participants
Number of conducted
needs
assessment/listening
sessions, hours of
sessions, and hours of
conducting need
assessment /listening
sessions
Listed the activities that
older adults can share, and
want to learn
Number of activities that
older adults can share, and
want to learn
Identified role model for
needs
assessment/listening
sessions
Number of partners
complete program design
Number of partners
implement program action
plan
Number of partners
complete evaluation plan
Number of program still
existing by 2007
Conduct statewide training on
conducting needs
assessment /listening
sessions
Determine training needs
Identify partners/trainees
Plan training session
Develop training materials
Conduct and evaluate training
Conduct needs assessment
/listening sessions
Learn what activities older
adults can share (teach
themselves)
Learn what older adults want to
learn
Identify role models for future
project implementations
Set up, implement, and
evaluate program
Design program incorporating
perspectives
Implement program
Evaluate
Sustain
75% of partners will gain knowledge
about needs assessment approaches.
By December 2004
75% of partners will be able to apply
knowledge gained by conducting
needs assessment/listening sessions
with various groups.
By March 2005
75% of partners will be able to
incorporate appropriate practices in
the healthy aging project.
By May 2005
75% of partners complete program
design
75% of partners implement program
action plan
50% of partners complete evaluation
plan
By May, June, August 2005
25% of partners continue to conduct
the program
By May 2007
Inputs
AARP
Lanakila Nutrition
Program
Pohulani Site and
Joyce
Honolulu County
and
Hawaii State offices
on
aging
HMSA Foundation
funds
Impact
To improve the health
of older adults (60+)
by increasing their
level of physical
activity.

What’s new about this? Why is it important?
Federal funding agencies and foundations are now
requiring applicants to provide a Logic Model with their
grant proposal. They typically require awardees in multi-
site programs to adhere to the same Logic Model.
It is also common to either require or look favorably on
proposals with a program evaluation plan in them.
Funders are also requiring grant applicants to identify the
partnership among agencies and across sectors that will
run the program, and in some instances (CDC, NIH,
Indian Health Services and other health funders in
particular) to define how partnership functioning as such
will be evaluated.

CDC
NATIONAL
ORGS
STATE ORGS
& REGIONAL
TRAINING
CENTERS
NATIONAL &
STATE ORGS &
REGIONAL
TRAINING
CENTERS .
State orgs will have
increased capacity to
help others
Local orgs with
intensive training
demonstrate:
•Increased knowledge
& skill
•Greater motivation
•Strengthened org
structures &
processes
Activities Short-Term
Outcomes
Intermediate
Outcomes
Orgs
offering
science-
based
programs
Youth
exposed to
science-
based
programs
Long-Term
Outcomes
(Impacts) Teen
Preg
rates
STD &
HIV
rates
CDC’s Capacity Building Initiative Connected to Teen Programming

Antecedent Goals and
Objectives Inputs Activities Outcomes Outputs
Contextual Variables
•This is just for Phase II. There are other Logic Models for
Phases I and III. (Note the inclusion of Goals and
Objectives, an explicit acknowledgement of the need for a
Strategic framework—MR).
National Cancer Institute’s Community Network Partners

Performance Logic Model
Inputs Activities and Outputs Intermediate Outcomes End Outcomes
Agency Strategic Plan/Annual Performance Plan
Manager-Employee Performance Plans
$
FTE
$
FTE
$
FTE
Activity-based Costing/Performance Budgeting
Information Technology/E-government plan
Inputs Activities and Outputs Intermediate Outcomes End Outcomes
Performance Budgeting & Financial Management
Competitive Sourcing/Contracting
Accountability and Performance Report
Backward mapping from End Outcomes back to Inputs is the basis for Performance
Measurement and Program Evaluation. The organization’s Performance Framework includes:


Welfare-To-Work Logic Model
Inputs Activities/Outputs Intermediate Outcomes End Outcomes
$
FTE
$
FTE
$
FTE
$
FTE
$
FTE
Goal: Increase Self-
Sufficiency in the
Community through
Increased Employment
Measures: -Decrease in Welfare
Ratio of $paid to #clients
-Decrease Unemployment
-# unemployment rate
total; # unemployment
rate for clients
-Increase Self-Sufficiency
-% of community
achieving a self-sufficient
wage; % of clients
achieving self-sufficient
wage
Outputs for Strategy 1
-# of clients trained for
standard employment
-# of clients trained or
completing degree in
high-wage employment
area
Activities for Strategy 1
-- # of training courses
held
-- # training
methodologies developed
--# employer surveys
completed
--# training promotional
kits deployed
--# career counseling
sessions provided
-# employers offering
continuing education
assistance
Strategy 1: Improve Hard Skills of
Clients to Reflect Hiring Needs of
the Economy
-Increase % with adequate hard skills
for standard employment
-Increase % completed continuing ed
for high-wage career advancement
Strategy 2: Improve the Soft Skills of
Clients to Aid in Job Placement
and Retention
-Increase % of clients with appropriate
soft skills
Strategy 5: Enhance Access to
Transportation
-Decrease % of clients w/out transport
Strategy 6: Decrease Barriers
Presented by Physical Disability
-Increase % of employers offering
“integrative” workplace for people
with disabilities
-Decrease % of clients with physical
disability preventing employment
External Factors:
# jobs created in economy annually; %
jobs
created with self-sufficient income
potential

Statement of Work Example 2 for Job Training
INPUT OUTPUT OUTCOME
“Assessment of the results of
a program activity compared
to its intended purpose.”
“Tabulation, calculation, or
recording of activity or effort,
expressed in a quantitative or
qualitative manner.”
“Amount of resources devoted
to a program activity,”
Examples:
$1,000,000 broken down by
object class
50 FTE, broken down by
position grades
Examples:
50 courses will be offered
10,000 people will complete the
courses
Exit tests of participants will
demonstrate that at least 85% of
participants acquired
competency in skills taught in
the training courses
Examples:
8000 people--trained by program-
-will land and keep their jobs more
than 6 months
90% of those who land jobs will
earn the same or more in their
new job as in their old one
75% of those with jobs will report
via survey that the skills they
learned were important factors in
getting the job
Areas where agencies are comfortable Real Results

Causal Logic Models: Incorporating Change & Action Models

Intervention
Other
Factors
Outcome
A causal logic model
clarifies the theory of
how interventions
produce outcomes.
Multiple methods and techniques
establish the relative importance of
causes of changes in outcomes
Causal logic models

Components of a causal logic model (in red) pertain to program theory; they augment regular logic modeling
From left to right on a logic model one would find:
Inputs (Fiscal and Human Resources Invested; Key Programmatic Initiatives)
Assumptions, Underlying Conditions, Premises (May Specify Ones Under Program Control and Outside Program Control, as in USAID’s Logical Framework or LogFrame)
Causative (If-then) Linkages Among Program Functions, Indicating Change and Action Models or Program Theory
Program Activities, Services
Immediate or Short-term Outcomes (process measures)
Intermediate or Medium-term Outcomes (outcome measures)
Long-term Results, Long-term Outcomes or Program Impact (impact measures)

A Complex Causal Logic Model Framework
Activities/Services
Provide BB
Do AA
Populationgets BB
IntermediateOutcomes
ImmediateOutcomes
Somethinghappens
# Trained
A later result
A later result
Condition ABC
Improve
Long Term Outcomes/
Results
Provide trainingabout CC
InputsAssumptions/
Conditions
PersonnelResources
If condition A exists
Funding/Other
ResourcesIf need B exists
Curriculum If condition C exists

A basic worksheet for a causal logic model
Inputs Assumption
or
Underlying
Condition
(if-then
construct)
Activities Immediate
(Short-
term)
Outcomes
Intermediate
Outcomes
Long Term
Outcomes/
Results/
Impact

Evaluation Design
A general principle: The more rigorous the
evaluation research design, the more plausible the
resulting estimate of intervention effects.
The design of impact (or outcome, or summative)
evaluations faces two competing pressures:
Evaluations should be undertaken with sufficient rigor
that relatively firm conclusions can be reached.
However, practical considerations of time, money,
cooperation, and protection of participants limit the
design options and methodological procedures that
can be employed.

Evaluation Design
Evaluators assess the effects of social programs by:
Comparing information about outcomes for
participants and nonparticipants,
Making repeated measurements on participants
before and after intervention,
Or other methods that attempt to achieve the
equivalent of such comparisons.
The basic aim of impact assessment is to produce
an estimate of the net effects of an intervention.

Evaluation Design
Impact assessment is relevant at many stages of the evaluation process.
Pilot demonstrations to estimate whether a proposed program will work.
Program design to test the most effective ways to develop and integrate the various program elements.
Program initiation to test the efficacy of the program at a limited number of sites.
Program modification to test the effects of the changes.
Program continuation to test for sunset legislation, funding renewal, or program defense.

Key Concepts in Impact Assessment
Prerequisites for assessing impact. Program’s objectives must be well-articulated to make
it possible to specify credible measures of the expected outcomes.
The interventions must be sufficiently well-implemented that there is no question that critical elements have been delivered to appropriate targets.
Change and action models (program theory) therefore need to be made explicit. If-then causal sequences premised in the evaluation design define both change and action models (which together make up program theory)
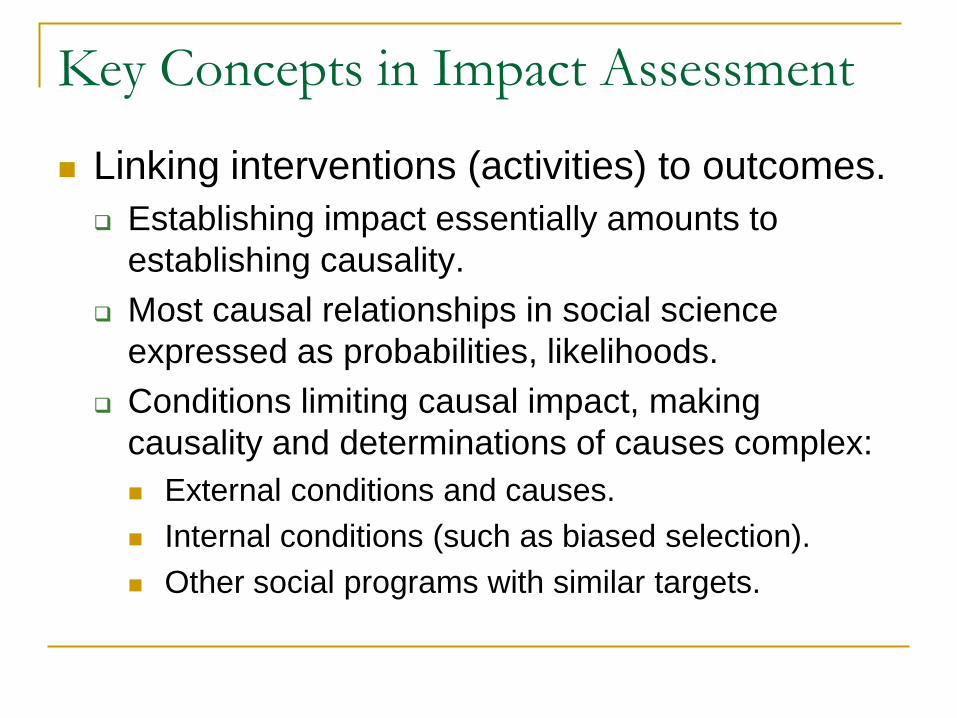
Key Concepts in Impact Assessment
Linking interventions (activities) to outcomes.
Establishing impact essentially amounts to
establishing causality.
Most causal relationships in social science
expressed as probabilities, likelihoods.
Conditions limiting causal impact, making
causality and determinations of causes complex:
External conditions and causes.
Internal conditions (such as biased selection).
Other social programs with similar targets.

Impact Assessment
Gross versus net outcomes. Net outcomes and
the counterfactual.
Effects
Design
factors)
gconfoundin s(extraneou
processesother
of Effects
effect)(net
onInterventi
of Effects
OutcomeGross

Extraneous Confounding Factors
Uncontrolled selection.
Preexisting differences between treatment and control
groups.
Self-selection.
Program location and access.
Deselection processes (attrition bias).
Endogenous change.
Secular drift.
Interfering events.
Maturational trends.

Design effects
Sampling validity
Measurement reliability: Does the measure produce the same results repeatedly? Unreliability dilutes and obscures real differences.
Reproducibility should not fall below 75 or 80%.
Measurement validity. Does the instrument measure what it is intended to
measure?
Criteria.
Consistency with usage.
Consistency with alternative measures.
Internal consistency.
Consequential predictability.

Design Effects Choice of outcome measures.
A critical measurement problem in evaluations is that of selecting the best measures for assessing outcomes.
Conceptualization of measures.
Reliability, feasibility, replicability of measures.
Proxy measures (e.g., reduced or free school lunch stats as a proxy for poverty).
Strategies for Isolating the Effects of Extraneous Factors
Full versus partial-coverage programs: Full coverage means absence of control group, requiring use of reflexive controls. E.g., NCLB as a full-coverage program.
Find cross-case comparisons, e.g., similar groups not participating in the program.
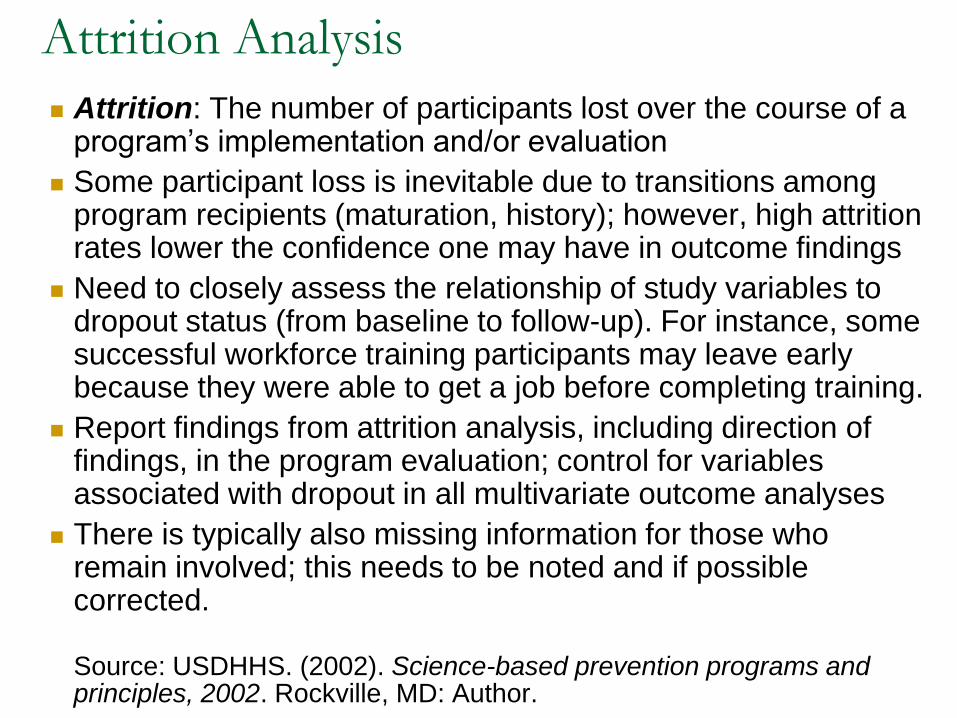
Attrition Analysis
Attrition: The number of participants lost over the course of a program’s implementation and/or evaluation
Some participant loss is inevitable due to transitions among program recipients (maturation, history); however, high attrition rates lower the confidence one may have in outcome findings
Need to closely assess the relationship of study variables to dropout status (from baseline to follow-up). For instance, some successful workforce training participants may leave early because they were able to get a job before completing training.
Report findings from attrition analysis, including direction of findings, in the program evaluation; control for variables associated with dropout in all multivariate outcome analyses
There is typically also missing information for those who remain involved; this needs to be noted and if possible corrected.
Source: USDHHS. (2002). Science-based prevention programs and principles, 2002. Rockville, MD: Author.
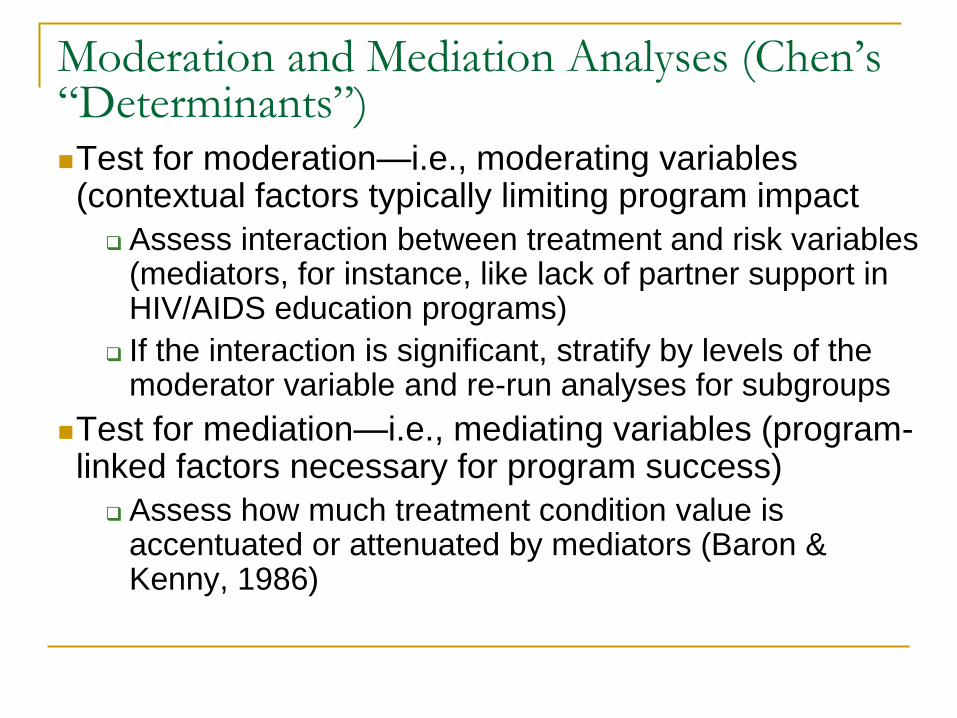
Moderation and Mediation Analyses (Chen’s “Determinants”) Test for moderation—i.e., moderating variables (contextual factors typically limiting program impact
Assess interaction between treatment and risk variables (mediators, for instance, like lack of partner support in HIV/AIDS education programs)
If the interaction is significant, stratify by levels of the moderator variable and re-run analyses for subgroups
Test for mediation—i.e., mediating variables (program-linked factors necessary for program success)
Assess how much treatment condition value is accentuated or attenuated by mediators (Baron & Kenny, 1986)

LSA Afterschool Program Example
Curriculum Design
Coaching, & Scientist Visits
Best-practices-based
curricular content both
builds on & strengthens
school science
Improved ability to succeed academically
School retention; going to college
Process
Evaluation
Science Camp
Tested Program
Content
Skilled Program
Delivery
Stimulating Lab
Activities
Outcome Evaluation
Mediators
Moderators
Poverty
Family education levels
Gender & ethnicity
constraints on aspiration
Short-term Outcomes Medium-term
Outcomes Impacts
Hands-on
Program
Increased student role-identification as a scientist and Interest in science
Increased student
desire and capacity to
engage in science
Increased Involvement in science
Science courses; major in science
Increased self- efficacy in science
Consider/choose science career

Science Camp example Used other afterschool science programs for middle-
school students nationally as the comparison group, especially those targeting or largely incorporating girls and students from historically-underrepresented minorities.
Targeted (initial and final evaluation report) literature reviews with over 150 citations as basis of comparison. Most find negligible gains in science knowledge and academic performance, while some do find modest gains in interest in and self-efficacy in science. Significant number of studies identify motivation/attitude toward science as a critical variable, leading to my design of a Science Attitude pre- and post survey. Along with the research synthesis entailed in the lit. review, interviews with students and instructors, surveys, pre- post subject matter tests, photographs, observation all were important evaluation methods.

Literature review and research synthesis cast as a meta-evaluation of the pertinent literature for the Lovelace Science Academy evaluation An extensive literature review developed for the 2010
evaluation set the backdrop for the outcome findings in the
2011 evaluation. The subject became the program itself,
and its significant positive outcomes, against the baseline
of limited-gain or ambiguous impact findings in dozens of
other national and international evaluations. Findings for
the 2010 and 2011 evaluations were considered together,
in finding that the Science Camp consistently produced
major gains in knowledge, self-efficacy, and motivation
toward as well as identification with science. Synthesis of
the literature provided a more comprehensive standpoint
than local comparisons. Reprised for the 2012 evaluation.

Science Camp Outcome Measures
Science Camp evaluation found significant gains in science content knowledge, aspiration, and self-efficacy. Repeated measure paired t-tests were used to gauge gains in knowledge for each subject-matter module. Paired t-tests are a form of variation sampling that do not require (or allow for) randomization but do set up a comparison vector between results and results to be expected by chance variation.
The formula for the t-test is a ratio. The top part of the ratio is the difference between the two means or averages. The bottom part is a measure of the variability or dispersion of the scores.
A Science Attitude Survey developed as a synthesis of proven tests (in 2011 Report) showed major motivation gains. Unpaired t-tests were used for this assessment.

Discussion
There is a great deal of variation in logic models—
there is no one format, but instead should allow for
adaptation of format to program. Check the following
Kellogg Foundation site: http://www.wkkf.org/Pubs/Tools/Evaluation/Pub3669.pdf
They can be time consuming to prepare
However, logic models
Can standardize activities and outcomes
Can be a great guide for evaluation (allowing one to
develop data collection around the framework provided by
outputs and outcomes)

Causal analysis and network systems complexity
Partnerships are systems; system dynamics are inherently complex
Constantly changing;
Governed by feedback;
Non-linear, history-dependent;
Adaptive and evolving;
Characterized by trade-offs;
Characterized by complex causality—coordination complexity, sequencing complexity, causal complexity due to multiple actors and influences, etc.
Far too much focus in evaluation on a single intervention as the unit of analysis;
Understanding connectivity between programs is important;
Many complex interventions require programming (and therefore also evaluation) at multiple levels, e.g., at the community, neighborhood, school and individual level;
Multilevel alignment is required across interventions

Challenge of partnered/networked programs
We need a different methodology for learning about partnered programs and the multiple factors that may affect networked outcomes: 1. Needs to be dynamic in design 2. An accumulating evidence strategy from multiple efforts at systematic inquiry over time 3. A basic systems orientation—a set of elements standing in strong interaction (an organized complexity) 4. Gathering empirical evidence about such phenomena is increasingly an organizing goal for evaluation (CDC, NIH).
5. Value-added strategies and methods, as well as path analysis, impact mapping, and other complex methods may be applied to issue of multiple causality and multiple attribution

Evaluating Collaboration
Types and stages of collaboration, collaborative networks (Harranz)
Back-end collaboration involves policy level executives in agencies, while front-end collaboration involves program principals and those who deal directly with clients.
Collaboration is important because it allows us to See problems whole—get up above single organizational
systems
Define the universe of need more comprehensively than single agencies
Build bridges (close gaps) across agencies; build bridges across agency-community gaps

Collaboration is difficult to sustain & evaluate
Difficulties in researching outcomes, including complex nature of outcomes
long time is needed to assess outcomes
ascertaining the extent to which the outcome is the result of the partnership, individual partners
different definitions of desired outcomes
In general, challenges associated with shared outcomes and attribution of impacts, gainsharing versus appropriation of successes by one or some dominant partner organizations

Continuum based on:
Required Commitment
Change required
Risk involved
Level of interdependence
Power
Trust
Willingness to share power
Willingness to share credit
or blame for outcomes—
accountability level
Networking
Coordinating
Cooperating
Collaborating
Partnership Continuum
Source: A. T. Himmelman, Collaboration for a Change

Shared Outcomes
“No group ever becomes a team until it holds itself accountable.” Katzenbach and Smith, The Wisdom of Teams
What are we accountable for?
How will we know when we have achieved it; how will we measure it? Responsibility for evaluation should be shared.
A strategy of redirection from low-impact disparate programs to high impact coordinated and integrated programs
A strategy of small wins cumulatively building to large wins
Sequencing of activities; integration of partners

Readiness to Evaluate a Partnership
Is partnership formed? What stage of formation?
Are partners committed to evaluate partnership & its work?
Are partnership’s goals realistic?
Are interventions consistent with partnership’s goals?
Are desired results specific and clear enough?
Are interventions well-grounded in theory/prior evidence (such as needs assessments)?
Do you know what kinds of data will be needed?
Are data available? Do you know where to access? Any limits or constraints on access to data?
Can evaluation be timely enough to permit findings to be used to make program/policy decisions?

Readiness to Evaluate a Partnership
Will findings be generalizable and useful in deciding whether to expand strategies to new populations and settings?
Are adequate resources available that can be shared or obtained (funding, time, expertise, partner support)?
Will evaluation address key partnership questions & be translated into “lessons learned”?
Are partners willing to heed evaluation results, even if they cause partnership to change or be viewed differently?
Is the evaluator or evaluation team willing to listen to the partnership about how to design evaluation and interpret and report results?

What Should We Evaluate? Questions:
What about partnership works/doesn’t work well? How
can we make partnership work better?
Who are key members? Are we meeting their needs?
Are we building their capacity?
What resources have been most helpful or are needed?
What are associated costs?
Do interventions fit partnership’s mission & goals?
Are strategies successful?
Is implementation reaching intended groups?
What have we accomplished?

Partnership Evaluation—Levels
LEVEL 1: Partnership process, infrastructure, or function
LEVEL 2: Partnership interventions
LEVEL 3: Impacts relating to community change
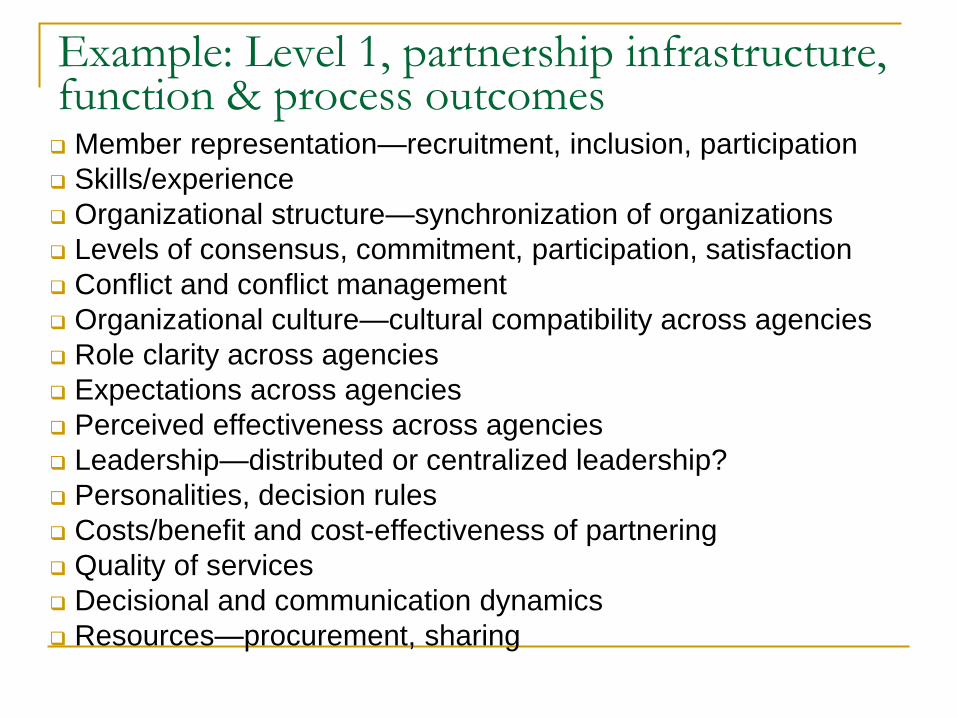
Example: Level 1, partnership infrastructure, function & process outcomes Member representation—recruitment, inclusion, participation
Skills/experience
Organizational structure—synchronization of organizations
Levels of consensus, commitment, participation, satisfaction
Conflict and conflict management
Organizational culture—cultural compatibility across agencies
Role clarity across agencies
Expectations across agencies
Perceived effectiveness across agencies
Leadership—distributed or centralized leadership?
Personalities, decision rules
Costs/benefit and cost-effectiveness of partnering
Quality of services
Decisional and communication dynamics
Resources—procurement, sharing

We evaluate partnerships so as to understand: Transaction costs reduction Value added Sustainability of outcomes Strategic influences Partnership complementarities (of resources,
capacities, functions, people, etc.) Partnership synergies (if any) Systemic impact In sum, whether a partnership approach has been or
is to be ultimately better than the next best alternative
Evaluating partnering as a mechanism

To reveal: Value created by the partnership for partner organizations (and
other stakeholders)
–expected
–unexpected
–potential
Extent of strategic alignment and goal congruence among
partners
Degree of effectiveness/efficiency/impact
Degree of effectiveness/efficiency/impact
Relative level of influence (sectoral/strategic)
Relative impact of different partners on program outcomes—can
this be determined from program data?
Partner relationship evaluation

Complex effects chain in partnered programs
Partners
1, 2, 3,
etc.
Shared
Common
Outcomes
Attribution difficulties;
transparency &
accountability challenges

Instruments & Tools
Coalition Effectiveness Inventory (CEI)
Meeting Effectiveness Inventory (MEI)
Teamwork surveys
Collaboration & Inclusivity checklists
Member Satisfaction Surveys
Member & Leader Interviews

The Problem with Determining Impact
Causation implies: Systemic impact implies:
* Direct cause/effect * Open systems
* Positive, intended * Unexpected positive and results negative results occur; * focus on ultimate results
* Crediting a single * Multiple actors create contributor results & need be credited
* The process ends * Change is an ongoing when it occurs process

Low
High
ProgramEndogenous Actors
Relative Influence of a Program

Evaluating Relative Influence
Boundary
Impacts
from
Partners
Program

Centers for Disease Control and Prevention (CDC)
Strategic Partnerships and Alliances Framework
The CDC has developed a framework for planning and
evaluation of partnerships in the health sciences
The CDC, along with NIH and the IHS and the
overarching US Department of Health and Human
Services, has determined that there is a need successful
partnerships and strategic alliances with all levels and
sectors to enhance/extend organizational leadership and
capacity, and promote innovation and performance in
public health programs

CDC Partnership and Strategic Alliance
Evaluation Tool
Developed by the CDC Division of Partnerships and Strategic
Alliances but used widely by NIH programs; revised periodically.
Over 100 statements related to one of seven key attributes
Items generated through a review of the partnering literature and
other similar evaluation tools
Likert scale 1-5 strongly disagree strongly agree
Results presented as scale reflecting Partnership Health (or
Success) along the key evaluation criteria and as overall score
I have revised the 4th version of this tool with a condensed survey,
for use in the end-of-program evaluation of the NARCH3
Program

Resources
Adam G. Skelton, Broad Street Consulting Group, Inc., www.broadstreetconsulting.com, [email protected]
Partnership Continuum, Inc., www.PartneringIntelligence.com
The Partnering Initiative, www.thepartneringinitiative.org Coalitions and Partnerships in Community Health, Francis Dunn
Butterfoss, Wiley & Sons, 2007 Mattessich, et.al., Collaboration: What makes it work (2nd edition), A
review of research literature on factors influencing successful collaborations, Wilder Foundation, 2001
Center for Civic Partnerships, www.civicpartnerships.org http://www.cdc.gov/eval/framework.htm#graphic http://www.cdc.gov/eval/evalcbph.pdf http://www.cacsh.org/psat.html http://thepartneringinitiative.org

Evaluation Sources
Butterfoss, F. D. (2006). Process evaluation for community participation. Annual Review of Public Health, 27, 323-340.
Cargo, M., & Mercer, S. (2008). The value and challenges of participatory research-strengthengin its practice. Annual Review of Public Health, 29(24), 325-350.
Gallagher, S. S. (2000). Program evaluation—balancing rigor with reality. Injury Prevention, 6, 78-79.
Kelly, K., & Van Vlaenderen, H. (1995). Evaluating participation processes in community development. Evaluation and Program Planning, 18(4), 371-383.
Kreuter, M. W., Lezin, N. A., & Young, L. A. (2000). Evaluating community-based collaborative mechanisms: Implications for practitioners. Health Promotion Practice, 1(1), 49-63.
Minkler, M., Blackwell, A. G., Thompson, M., & Tamir, H. (2003). Community-based participatory research: Implications for public health funding. American Journal of Public Health, 93(8), 1210-1213.
Nichols, L. (2002). Participatory program planning: Including program participants and evaluators. Evaluation and Program Planning, 25, 1-14.

Free/Low Cost Evaluation Resources
Survey Monkey: $200./yr http://www.surveymonkey.com/
Innovation Network: Tools for evaluation plans, logic
models & more http://www.innonet.org/index.php
Online Evaluation Resource Library: Create surveys,
interviews, observation guides: http://www.oerl.sri.com/
United Way Outcome Measurement Resource Network:
Downloadable or low cost (< $50. tools & instruction)
http://national.unitedway.org/outcomes/resources/

Resources
W.K. Kellogg Foundation. (1998). Evaluation Handbook.
Battle Creek, MI.
http://www.wkkf.org/Pubs/Tools/Evaluation/Pub770.pdf
CDC. National Heart Disease and Stroke Prevention
Program. (2007). Evaluation Guide: Fundamentals of
Evaluating Partnerships.
http://www.cdc.gov/dhdsp/state_program/evaluation_guide
s/pdfs/Partnership_Guide.pdf
CDC. (1999). Framework for Program Evaluation in Public Health. MMWR 1999;48 (No. RR-11), updated 2001. Washington, DC: Superintendent of Documents, U.S. Government Printing Office. http://www.cdc.gov/mmwr/preview/mmwrhtml/rr481a1.htm

Resources
Butterfoss, FD. (2007). Coalitions and Partnerships in Community Health. San Francisco, CA: Jossey Bass. http://coalitionswork.com
Taylor-Powell, E., Rossing, B., & Geran, J. (1998). Evaluating collaboratives: Reaching the potential. University of Wisconsin-Extension. Madison. Available: http://www.uwex.edu/ces/pdande/evaluation/evaldocs.html
or from http://cecommerce.uwex.edu/pdfs/G3658_8.PDF The site also includes an organizational assessment tool.
Community Toolbox: http://www.ctb.edu
Collaboration: What Makes It Work, 2nd Edition. Mattessich, PW, et al. Amherst H. Wilder Foundation, 2004. This is an up-to-date and in-depth review of collaboration research. The edition also includes The Collaboration Factors Inventory.

Resources for Partnership Assessments
http://www.cdc.gov/prc/about-prc-program/partnership-trust-tools.htm
http://www.cdc.gov/dhdsp/state_program/evaluation_guides/evaluating_partnerships.htm
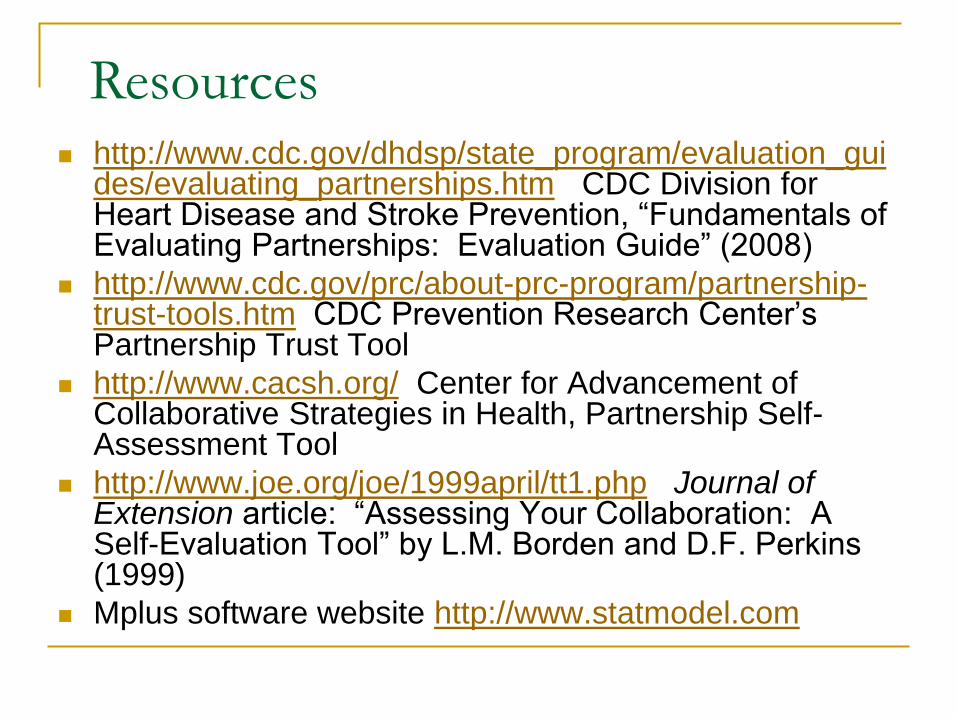
http://www.cdc.gov/dhdsp/state_program/evaluation_gui
des/evaluating_partnerships.htm CDC Division for Heart Disease and Stroke Prevention, “Fundamentals of Evaluating Partnerships: Evaluation Guide” (2008)
http://www.cdc.gov/prc/about-prc-program/partnership-trust-tools.htm CDC Prevention Research Center’s Partnership Trust Tool
http://www.cacsh.org/ Center for Advancement of Collaborative Strategies in Health, Partnership Self-Assessment Tool
http://www.joe.org/joe/1999april/tt1.php Journal of Extension article: “Assessing Your Collaboration: A Self-Evaluation Tool” by L.M. Borden and D.F. Perkins (1999)
Mplus software website http://www.statmodel.com
Resources

Evaluation Guide Website
http://www.cdc.gov/DHDSP/state_program/evaluation_guides/index.htm

Other resources
Introduction to Program Evaluation for Public
Health Programs: A Self Study Guide
http://www.cdc.gov/eval/evalguide.pdf
University of Wisconsin, CE Program
http://www.uwex.edu/ces/pdande/

The CDC Roadmap is a Web-based training resource designed to assist states in program planning, implementation and evaluation. It provides online access to training, tools, and other resources needed for successful program development and implementation.
The Roadmap is divided into four sections.
Components can be accessed in any order.
Each section has an introductory overview and information on What to Do and How to Do It.
http://www.cdc.gov/dhdsp/roadmap/index.htm


![[Logic] [Mathematics] - Mathematical Logic. Lecture Notes (Stephen Simpson).pdf](https://img.dokumen.tips/doc/110x75/55cf8ecd550346703b95c429/logic-mathematics-mathematical-logic-lecture-notes-stephen-simpsonpdf.jpg)