Embed Size (px)
DESCRIPTION
Program for International Student Assessment (PISA) 2006. Prepared by the Education Trust December 2007. PISA Performance U.S.A. Ranks Near Bottom, Has Fallen Since 2000. Rankings are for the 26 OECD countries participating in PISA in 2000, 2003, and 2006. - PowerPoint PPT Presentation
Citation preview
20
07
by T
he
Ed
uca
tion
Tru
st, Inc.
Program for International Student Assessment (PISA)
2006
Prepared by the Education Trust
December 2007

20
07
by T
he
Ed
uca
tion
Tru
st, Inc.
Rankings are for the 26 OECD countries participating in PISA in 2000, 2003, and 2006.
PISA PerformanceU.S.A. Ranks Near Bottom, Has Fallen Since 2000
Subject 2000 Rank(out of 26)
2003 Rank(out of 26)
2006 Rank(out of 26)
Mathematics 17th 22nd 22nd
Science 13th Tied for 17th 19th
Source: Organization for Economic Cooperation and Development (OECD), PISA 2006 Results, http://www.oecd.org/

20
07
by T
he
Ed
uca
tion
Tru
st, Inc.
There are countries that have improved their ranking since 2000 in math
Country 2000 Rank(out of 26)
2006 Rank(out of 26)
U.S.A. 17th 22nd
Luxembourg 25th Tied for 19th
Poland 21st 17th
Germany 18th 13th
Czech Republic 16th 10th
Source: NCES, PISA Results, http://nces.ed.gov/surveys/pisa/
Rankings are for the 26 OECD countries participating in PISA in 2000, 2003, and 2006.

20
07
by T
he
Ed
uca
tion
Tru
st, Inc.
There are also countries that have improved their ranking since 2000 in science
Country 2000 Rank(out of 26)
2006 Rank(out of 26)
U.S.A. 13th 19th
Belgium Tied for 14th 11th
Switzerland Tied for 14th 9th
Germany 19th 7th
Source: NCES, PISA Results, http://nces.ed.gov/surveys/pisa/
Rankings are for the 26 OECD countries participating in PISA in 2000, 2003, and 2006.

20
07
by T
he
Ed
uca
tion
Tru
st, Inc.
Mathematics
Program for International Student Assessment (PISA)
20
07
by T
he
Ed
uca
tion
Tru
st, Inc.
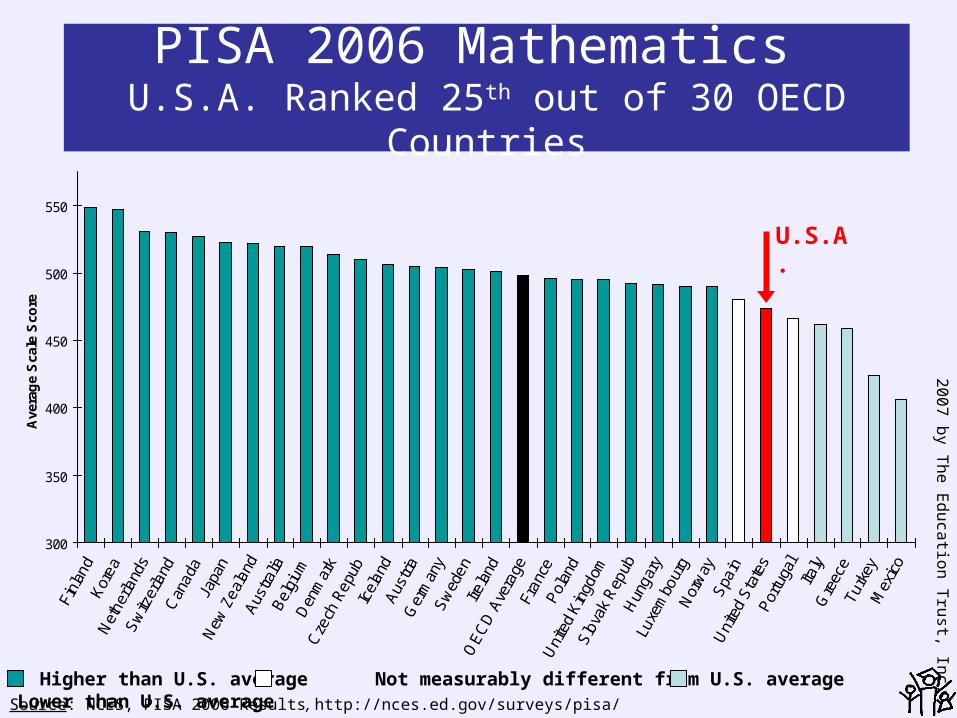
PISA 2006 Mathematics U.S.A. Ranked 25th out of 30 OECD Countries
300
350
400
450
500
550
Ave
rag
e S
cale
Sco
re
U.S.A.
Source: NCES, PISA 2006 Results, http://nces.ed.gov/surveys/pisa/
Higher than U.S. average Not measurably different from U.S. average Lower than U.S. average
20
07
by T
he
Ed
uca
tion
Tru
st, Inc.
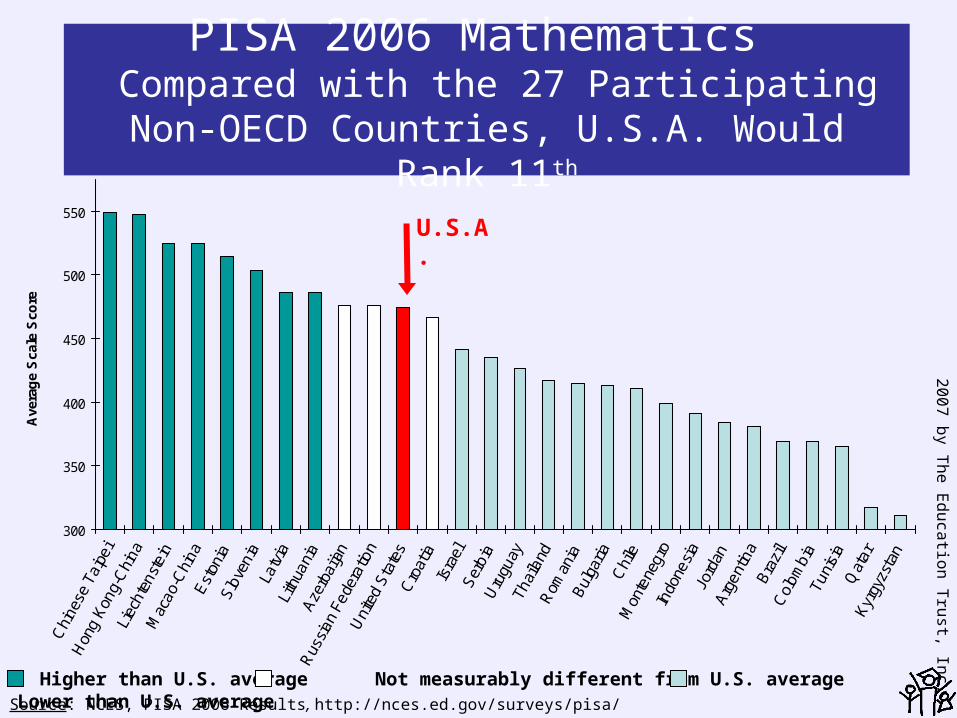
PISA 2006 Mathematics Compared with the 27 Participating Non-OECD
Countries, U.S.A. Would Rank 11th
300
350
400
450
500
550
Ave
rag
e S
cale
Sco
re
U.S.A.
Source: NCES, PISA 2006 Results, http://nces.ed.gov/surveys/pisa/
Higher than U.S. average Not measurably different from U.S. average Lower than U.S. average

20
07
by T
he
Ed
uca
tion
Tru
st, Inc.
Science Literacy
Program for International Student Assessment (PISA)

20
07
by T
he
Ed
uca
tion
Tru
st, Inc.
300
350
400
450
500
550
Ave
rag
e S
cale
Sco
re
PISA 2006 Science Of 30 OECD Countries, U.S.A. Ranked 21st
U.S.A.
Source: NCES, PISA 2006 Results, http://nces.ed.gov/surveys/pisa/
Higher than U.S. average Not measurably different from U.S. average Lower than U.S. average

20
07
by T
he
Ed
uca
tion
Tru
st, Inc.
PISA 2006 Science Compared with the 27 Participating Non-OECD
Countries, U.S.A. Would Rank 9th
300
350
400
450
500
550
Ave
rag
e S
cale
Sco
re
U.S.A.
Source: NCES, PISA 2006 Results, http://nces.ed.gov/surveys/pisa/
Higher than U.S. average Not measurably different from U.S. average Lower than U.S. average

20
07
by T
he
Ed
uca
tion
Tru
st, Inc.
Countries whose 15-year-old students’ average science literacy
score was not measurably different from the U.S.A. average?
•Poland•Denmark•France•Iceland•Slovak Republic•Russian Federation
• Croatia• Latvia• Lithuania• Spain• Norway• Luxembourg
Source: NCES, PISA 2006 Results, http://nces.ed.gov/surveys/pisa/
20
07
by T
he
Ed
uca
tion
Tru
st, Inc.
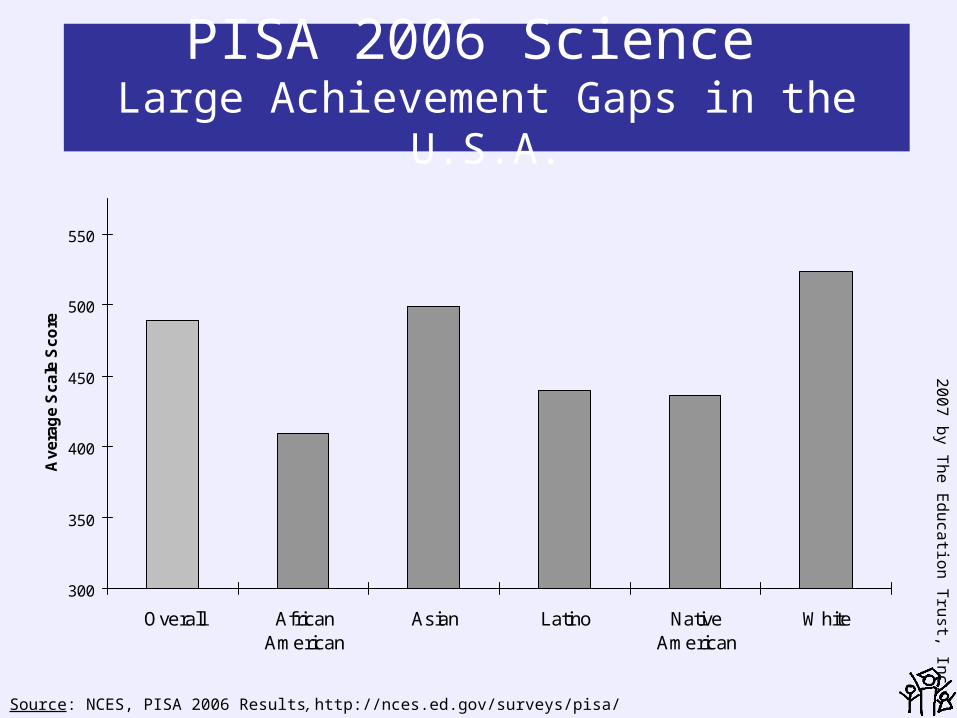
PISA 2006 Science Large Achievement Gaps in the U.S.A.
300
350
400
450
500
550
Overall AfricanAmerican
Asian Latino NativeAmerican
White
Av
era
ge
Sc
ale
Sc
ore
Source: NCES, PISA 2006 Results, http://nces.ed.gov/surveys/pisa/
20
07
by T
he
Ed
uca
tion
Tru
st, Inc.
How does the United States compare on the PISA science
content areas?
20
07
by T
he
Ed
uca
tion
Tru
st, Inc.
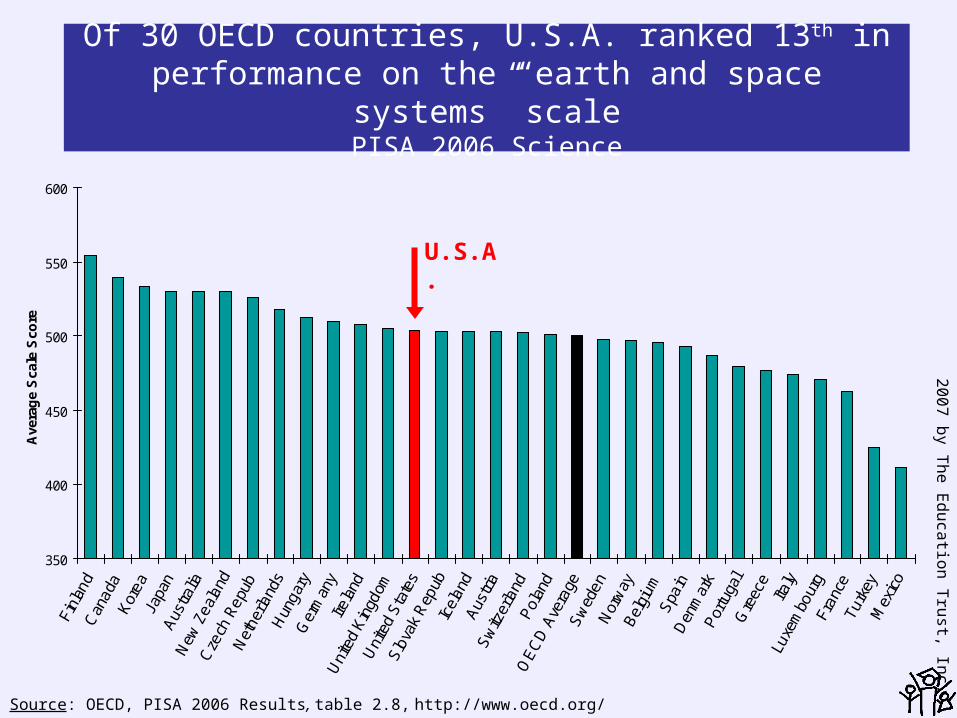
Of 30 OECD countries, U.S.A. ranked 13th in performance on the “earth and space systems” scale
PISA 2006 Science
350
400
450
500
550
600
Ave
rag
e S
cale
Sco
re
Source: OECD, PISA 2006 Results, table 2.8, http://www.oecd.org/
U.S.A.

20
07
by T
he
Ed
uca
tion
Tru
st, Inc.
Of 30 OECD countries, U.S.A. ranked 25th in performance on the “living systems” scale
PISA 2006 Science
350
400
450
500
550
600
Ave
rag
e S
cale
Sco
re
Source: OECD, PISA 2006 Results, table 2.9, http://www.oecd.org/
U.S.A.

20
07
by T
he
Ed
uca
tion
Tru
st, Inc.
Of 30 OECD countries, U.S.A. ranked 22nd in performance on the “physical systems” scale
PISA 2006 Science
350
400
450
500
550
600
Ave
rag
e S
cale
Sco
re
Source: OECD, PISA 2006 Results, table 2.10, http://www.oecd.org/
U.S.A.

20
07
by T
he
Ed
uca
tion
Tru
st, Inc.
How does the United States compare on PISA science higher
order thinking competency?
20
07
by T
he
Ed
uca
tion
Tru
st, Inc.
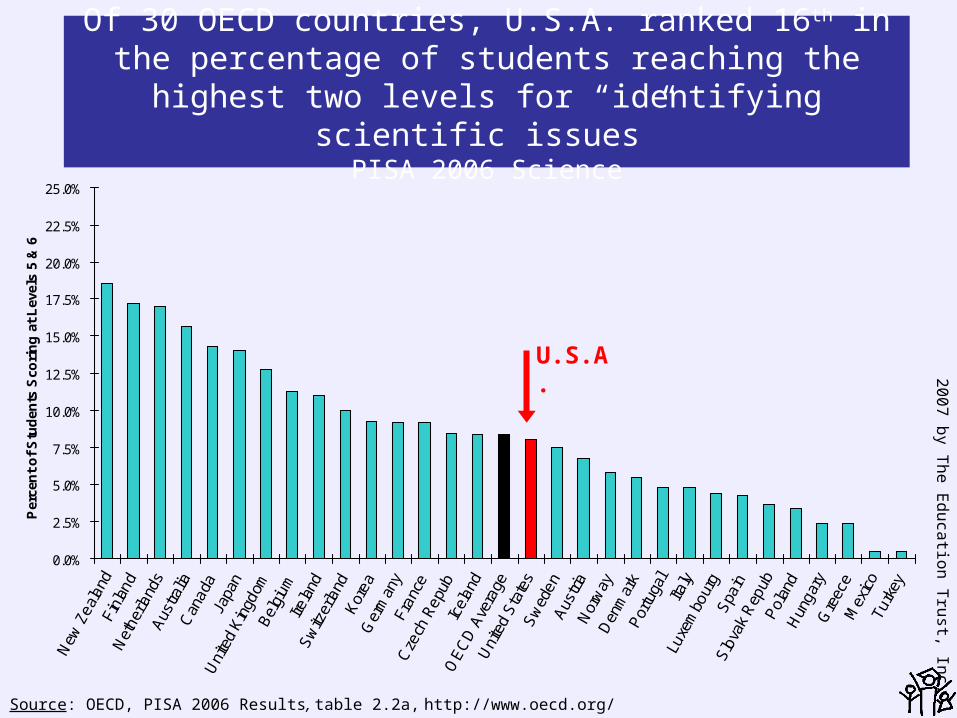
Of 30 OECD countries, U.S.A. ranked 16th in the percentage of students reaching the highest two levels for
“identifying scientific issues”PISA 2006 Science
0.0%
2.5%
5.0%
7.5%
10.0%
12.5%
15.0%
17.5%
20.0%
22.5%
25.0%
Per
cen
t o
f S
tud
ents
Sco
rin
g a
t L
evel
s 5
& 6
Source: OECD, PISA 2006 Results, table 2.2a, http://www.oecd.org/
U.S.A.
20
07
by T
he
Ed
uca
tion
Tru
st, Inc.
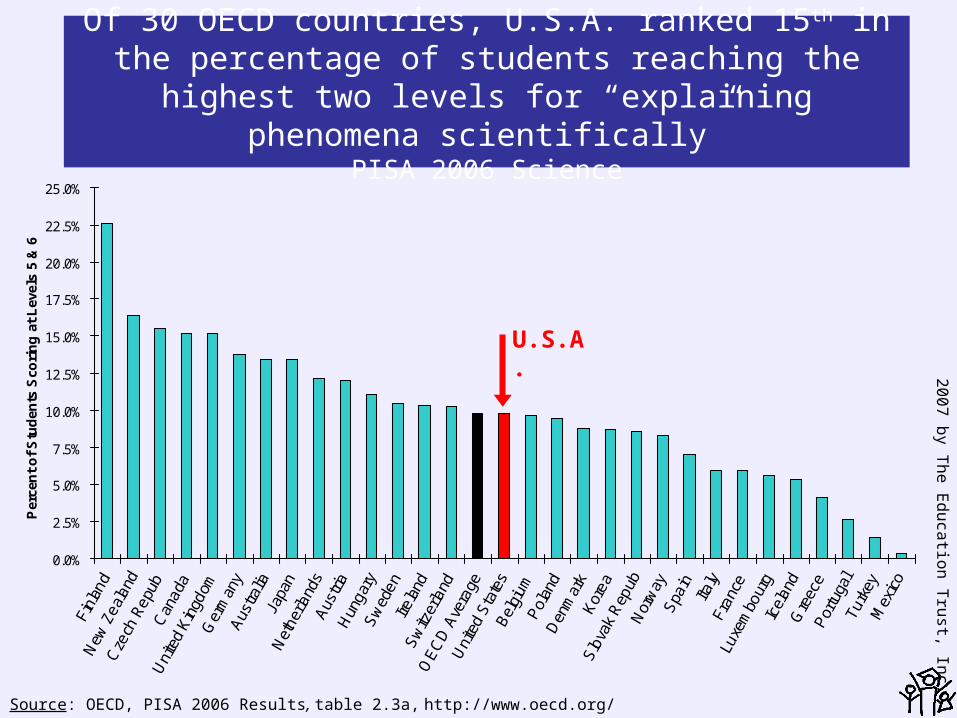
Of 30 OECD countries, U.S.A. ranked 15th in the percentage of students reaching the highest two levels for
“explaining phenomena scientifically”PISA 2006 Science
0.0%
2.5%
5.0%
7.5%
10.0%
12.5%
15.0%
17.5%
20.0%
22.5%
25.0%
Per
cen
t o
f S
tud
ents
Sco
rin
g a
t L
evel
s 5
& 6
Source: OECD, PISA 2006 Results, table 2.3a, http://www.oecd.org/
U.S.A.

20
07
by T
he
Ed
uca
tion
Tru
st, Inc.
Of 30 OECD countries, U.S.A. ranked 15th in the percentage of students reaching the highest two levels for
“using scientific evidence”PISA 2006 Science
0.0%
2.5%
5.0%
7.5%
10.0%
12.5%
15.0%
17.5%
20.0%
22.5%
25.0%
Per
cen
t o
f S
tud
ents
Sco
rin
g a
t L
evel
s 5
& 6
Source: OECD, PISA 2006 Results, table 2.4a, http://www.oecd.org/
U.S.A.

20
07
by T
he
Ed
uca
tion
Tru
st, Inc.
For the United States to continue to compete internationally, we
need to put aside our pride
20
07
by T
he
Ed
uca
tion
Tru
st, Inc.
This means learning from other countries

20
07
by T
he
Ed
uca
tion
Tru
st, Inc.
It also means recognizing common myths for what they are:
Excuses

20
07
by T
he
Ed
uca
tion
Tru
st, Inc.
Myth #1
Our high performing students are all we need to compete
internationally

20
07
by T
he
Ed
uca
tion
Tru
st, Inc.
U.S.A. Ranks 13th out of 30 OECD Countries in the Science Achievement of Highest-Performing* Students
PISA 2006 Science
450
500
550
600
650
700
Ave
rag
e S
cale
Sco
re
U.S.A.
*Students at the 95th PercentileSource: OECD, PISA 2006 Results, table 2.1c, http://www.oecd.org/

20
07
by T
he
Ed
uca
tion
Tru
st, Inc.
U.S.A. Ranks 23rd out of 29 OECD Countries in the Math Achievement of Highest-Performing* Students
PISA 2003 Mathematics
450
500
550
600
650
700
Bel
gium
Japa
nK
orea
Sw
itzer
land
Net
herla
nds
New
Zea
land
Finl
and
Aus
tralia
Can
ada
Cze
ch R
epub
Den
mar
kS
wed
enG
erm
any
OE
CD
Ave
rage
Aus
tria
Icel
and
Fran
ceS
lova
k R
epub
Nor
way
Hun
gary
Luxe
mbo
urg
Irela
ndP
olan
dU
nite
d S
tate
sS
pain
Italy
Turk
eyP
ortu
gal
Gre
ece
Mex
ico
Ave
rag
e S
cale
Sco
re
Source: Organization for Economic Cooperation and Development (OECD), PISA 2003 Results, http://www.oecd.org/
U.S.A.
*Students at the 95th Percentile

20
07
by T
he
Ed
uca
tion
Tru
st, Inc.
Myth #2
The United States has so many poor kids – it’s just not possible for
schools to make a difference
20
07
by T
he
Ed
uca
tion
Tru
st, Inc.
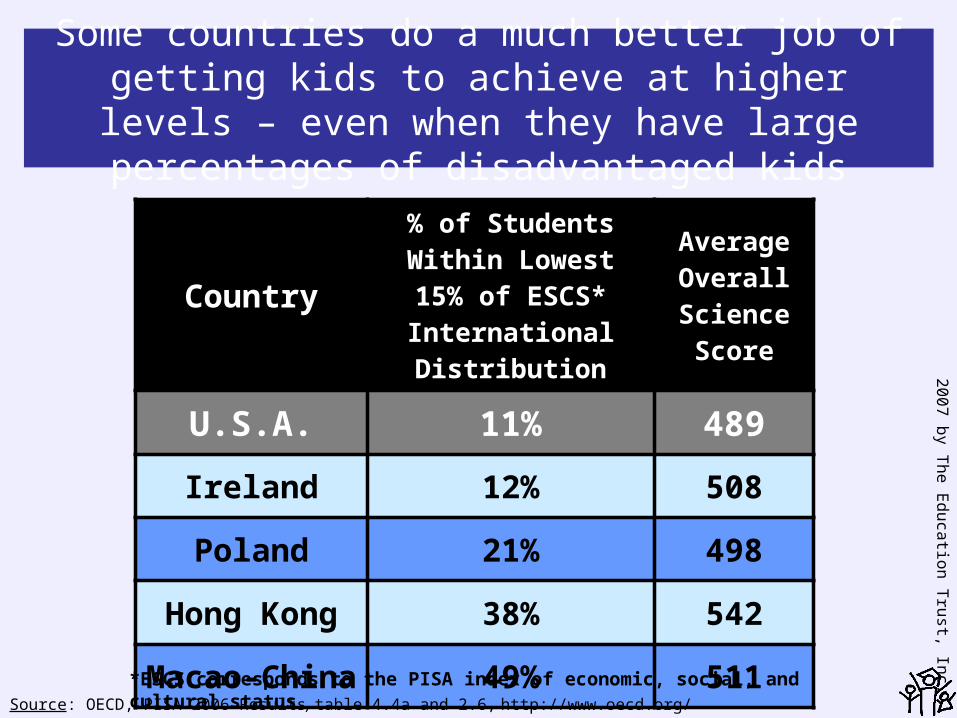
Some countries do a much better job of getting kids to achieve at higher levels – even when they have
large percentages of disadvantaged kids
Country
% of Students Within Lowest 15% of
ESCS* International Distribution
Average Overall Science Score
U.S.A. 11% 489
Ireland 12% 508
Poland 21% 498
Hong Kong 38% 542
Macao-China 49% 511
Source: OECD, PISA 2006 Results, table 4.4a and 2.6, http://www.oecd.org/
*ESCS corresponds to the PISA index of economic, social, and cultural status.

20
07
by T
he
Ed
uca
tion
Tru
st, Inc.
And after separating our students into SES quartiles…
• Our lowest-SES kids are not as disadvantaged as the lowest-SES kids in many other countries
• Our highest-SES kids are more advantaged than the highest-SES kids in many other countries
Source: OECD, PISA 2006 Results, table 4.8b, http://www.oecd.org/

20
07
by T
he
Ed
uca
tion
Tru
st, Inc.
Yet our low-SES kids do very poorly
CountryAverage Low-SES
Science Score
U.S.A. 445
Ireland 476
Poland 469
Hong Kong 526
Macao-China 503
Source: OECD, PISA 2006 Results, table 4.8b, http://www.oecd.org/

20
07
by T
he
Ed
uca
tion
Tru
st, Inc.
Our high-SES kids aren’t always the highest performers
CountryAverage
High-SES Science Score
U.S.A. 541
Ireland 548
Poland 539
Hong Kong 564
Macao-China 518
Source: OECD, PISA 2006 Results, table 4.8b, http://www.oecd.org/

20
07
by T
he
Ed
uca
tion
Tru
st, Inc.
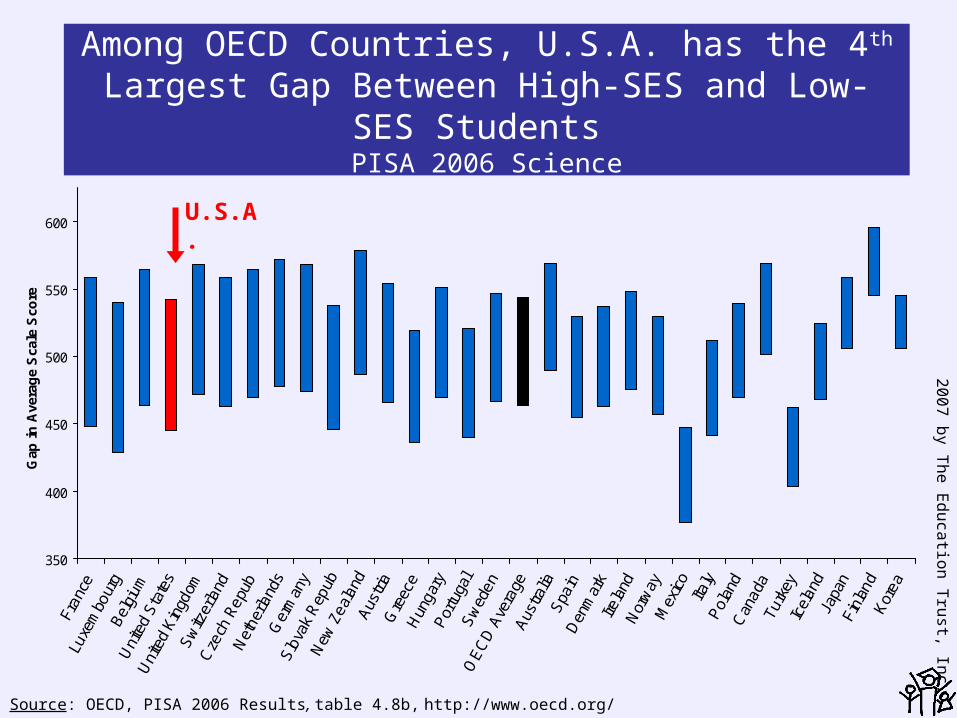
And we have very large gaps between our high-SES and low-SES kids
Country Gap in Average Science Score
U.S.A. 96
Ireland 72
Poland 70
Hong Kong 38
Macao-China 15
Source: OECD, PISA 2006 Results, table 4.8b, http://www.oecd.org/

20
07
by T
he
Ed
uca
tion
Tru
st, Inc.
How do our high-SES and low-SES students perform
when compared with OECD countries?
20
07
by T
he
Ed
uca
tion
Tru
st, Inc.
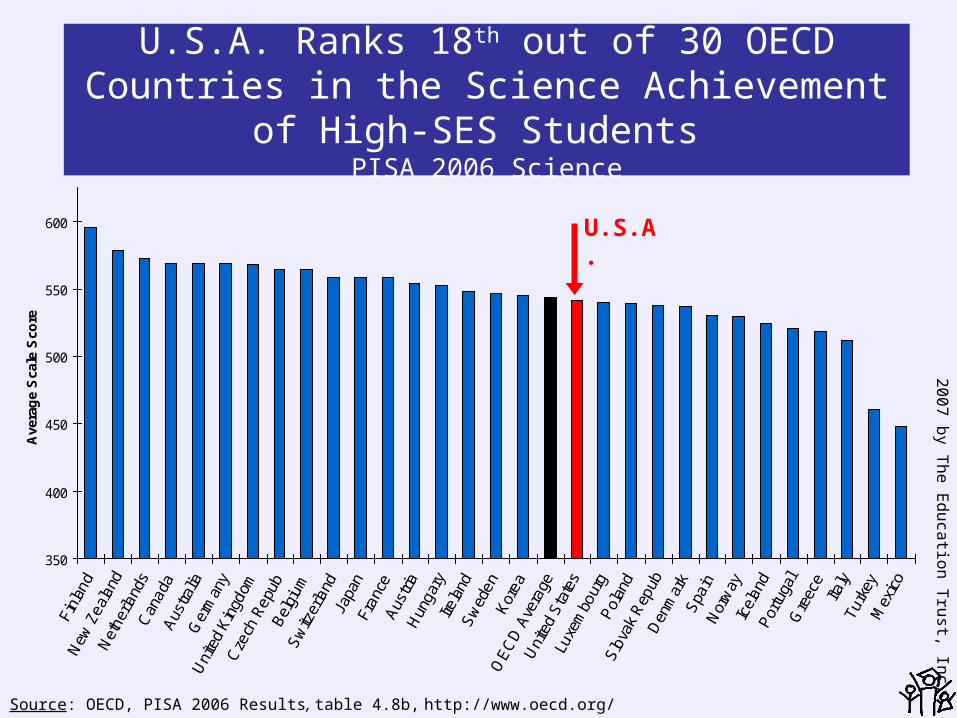
U.S.A. Ranks 18th out of 30 OECD Countries in the Science Achievement of High-SES Students
PISA 2006 Science
350
400
450
500
550
600
Ave
rag
e S
cale
Sco
re
U.S.A.
Source: OECD, PISA 2006 Results, table 4.8b, http://www.oecd.org/

20
07
by T
he
Ed
uca
tion
Tru
st, Inc.
U.S.A. Ranks 24th out of 30 OECD Countries in the Science Achievement of Low-SES Students
PISA 2006 Science
350
400
450
500
550
600
Ave
rag
e S
cale
Sco
re
U.S.A.
Source: OECD, PISA 2006 Results, table 4.8b, http://www.oecd.org/
20
07
by T
he
Ed
uca
tion
Tru
st, Inc.
Among OECD Countries, U.S.A. has the 4th Largest Gap Between High-SES and Low-SES Students
PISA 2006 Science
350
400
450
500
550
600
Gap
in
Ave
rag
e S
cale
Sco
re
Source: OECD, PISA 2006 Results, table 4.8b, http://www.oecd.org/
U.S.A.

20
07
by T
he
Ed
uca
tion
Tru
st, Inc.
Myth #3
Immigrants! They’re ruining us!

20
07
by T
he
Ed
uca
tion
Tru
st, Inc.
The U.S.A. does have a larger percentage of immigrants and children of immigrants than most
OECD countries
0.0%
10.0%
20.0%
30.0%
40.0%
50.0%
Per
cen
t o
f S
tud
ents
2nd Generation 1st Generation
Source: OECD, PISA 2006 Results, table 4.2c, http://www.oecd.org/
U.S.A.

20
07
by T
he
Ed
uca
tion
Tru
st, Inc.
But ranks 21st out of 30 OECD countries when only taking into account native student* scores
PISA 2006 Science
300
350
400
450
500
550
600
Finl
and
Can
ada
New
Zea
land
Net
herla
nds
Ger
man
yJa
pan
Sw
itzer
land
Aus
tralia
Aus
tria
Kor
eaB
elgi
umU
nite
d K
ingd
omC
zech
Rep
ubS
wed
enLu
xem
bour
gIre
land
OE
CD
Ave
rage
Hun
gary
Fran
ceD
enm
ark
Pol
and
Uni
ted
Sta
tes
Icel
and
Spa
inN
orw
ayS
lova
k R
epub
Italy
Por
tuga
lG
reec
eTu
rkey
Mex
ico
Ave
rag
e S
cale
Sco
re
U.S.A.
*Students born in the country of assessment with at least one parent born in the same countrySource: OECD, PISA 2006 Results, table 4.2c, http://www.oecd.org/

20
07
by T
he
Ed
uca
tion
Tru
st, Inc.
And despite having more 1st and 2nd generation students*, Hong Kong students perform better
Country% 1st
Generation Students
Average Science Score
U.S.A. 5.8% 442
Hong Kong 19.2% 521
Source: OECD, PISA 2006 Results, table 4.2c, http://www.oecd.org/
Country% 2nd
Generation Students
Average Science Score
U.S.A. 9.4% 456
Hong Kong 24.6% 551
*1st generation students were born in another country and their parents were born in another country
*2nd generation students were born in the country of assessment but their parents were born in another country
20
07
by T
he
Ed
uca
tion
Tru
st, Inc.
Myth #4
The United States doesn’t spend enough on education
20
07
by T
he
Ed
uca
tion
Tru
st, Inc.
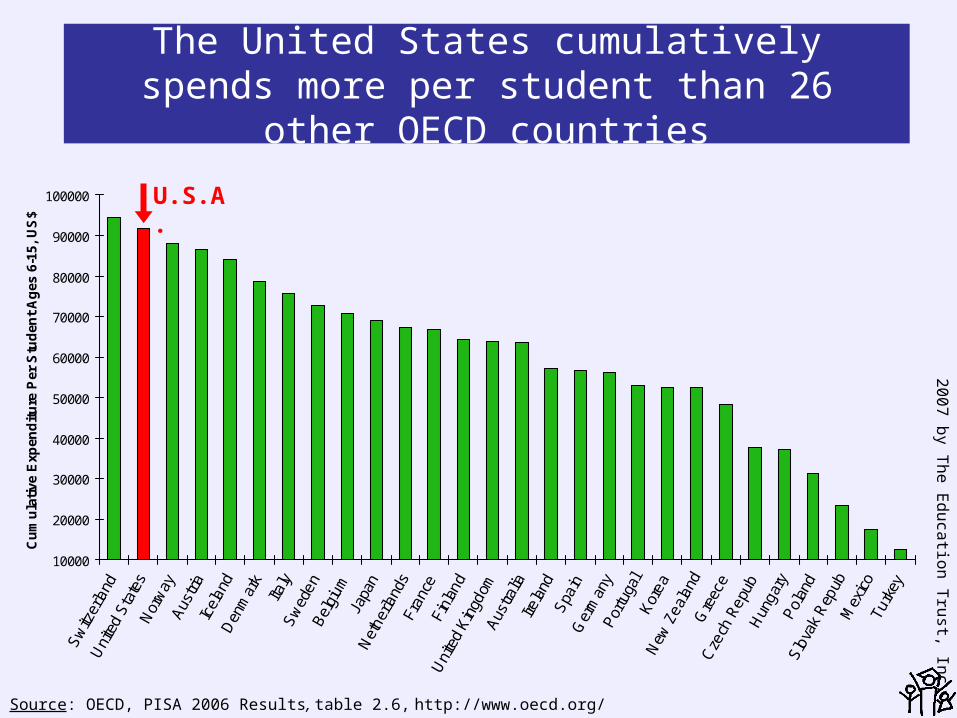
The United States cumulatively spends more per student than 26 other OECD countries
10000
20000
30000
40000
50000
60000
70000
80000
90000
100000
Sw
itzer
land
Uni
ted
Sta
tes
Nor
way
Aus
tria
Icel
and
Den
mar
kIta
lyS
wed
enB
elgi
umJa
pan
Net
herla
nds
Fran
ceFi
nlan
dU
nite
d K
ingd
omA
ustra
liaIre
land
Spa
inG
erm
any
Por
tuga
lK
orea
New
Zea
land
Gre
ece
Cze
ch R
epub
Hun
gary
Pol
and
Slo
vak
Rep
ubM
exic
oTu
rkey
Cu
mu
lati
ve E
xpen
dit
ure
Per
Stu
den
t A
ges
6-1
5, U
S$
Source: OECD, PISA 2006 Results, table 2.6, http://www.oecd.org/
U.S.A.
20
07
by T
he
Ed
uca
tion
Tru
st, Inc.
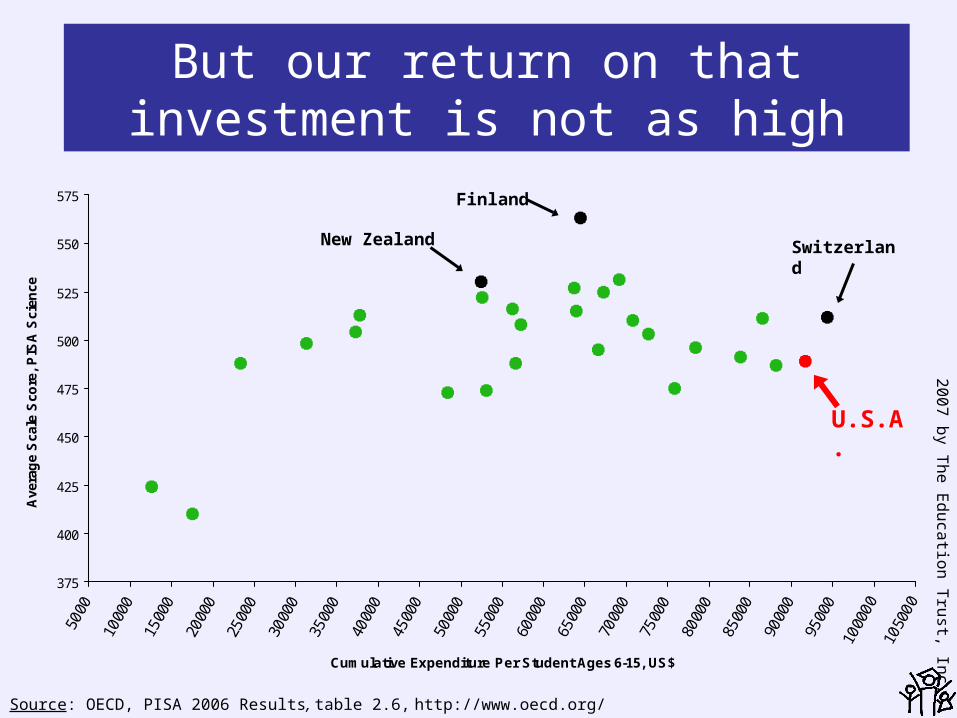
But our return on that investment is not as high
375
400
425
450
475
500
525
550
575
5000
1000
0
1500
0
2000
0
2500
0
3000
0
3500
0
4000
0
4500
0
5000
0
5500
0
6000
0
6500
0
7000
0
7500
0
8000
0
8500
0
9000
0
9500
010
0000
1050
00
Cumulative Expenditure Per Student Ages 6-15, US$
Ave
rag
e S
cale
Sco
re,
PIS
A S
cien
ce
U.S.A.
New Zealand Switzerland
Finland
Source: OECD, PISA 2006 Results, table 2.6, http://www.oecd.org/

20
07
by T
he
Ed
uca
tion
Tru
st, Inc.
The United States ranks in the top 10 in terms of spending effort
(out of 29 OECD countries)
0.0%
0.5%
1.0%
1.5%
2.0%
2.5%
3.0%
3.5%
4.0%
4.5%
5.0%
5.5%
New
Zea
land
Sw
itzer
land
Sw
eden
Uni
ted
Kin
gdom
Kor
eaD
enm
ark
Mex
ico
Nor
way
Bel
gium
Uni
ted
Sta
tes
Fran
ceA
ustra
liaFi
nlan
dLu
xem
bour
g
OE
CD
Ave
rage
Por
tuga
lIc
elan
dP
olan
dA
ustri
aN
ethe
rland
sIta
lyG
erm
any
Hun
gary
Irela
ndC
zech
Rep
ubTu
rkey
Slo
vak
Rep
ubS
pain
Japa
nG
reec
e
Per
cen
t o
f G
DP
Sp
ent
on
Pri
mar
y/S
eco
nd
ary
Ed
uca
tio
n
Source: OECD Education at a Glance 2007, table B2.2, http://www.oecd.org/
U.S.A.

20
07
by T
he
Ed
uca
tion
Tru
st, Inc.
But our return on that effort is also not as high
375
400
425
450
475
500
525
550
575
1.5%
2.0%
2.5%
3.0%
3.5%
4.0%
4.5%
5.0%
5.5%
Percent of GDP Spent on Primary/Secondary Education
Ave
rag
e S
cale
Sco
re,
PIS
A S
cien
ce
Sources: OECD, PISA 2006 Results and Education at a Glance 2007, http://www.oecd.org/
U.S.A.
JapanFinland
AustraliaNew Zealand

20
07
by T
he
Ed
uca
tion
Tru
st, Inc.
Myth #5
American kids just don’t value math and science – we can’t
teach them well in those subjects if they don’t really want to learn
them

20
07
by T
he
Ed
uca
tion
Tru
st, Inc.
Most United States 15-year-olds report that doing well in math at school is important
50.0%
60.0%
70.0%
80.0%
90.0%
100.0%
Icel
and
Mex
ico
Den
mar
k
Uni
ted
Kin
gdom
Irela
ndC
anad
aN
ew Z
eala
ndS
wed
enG
erm
any
Uni
ted
Sta
tes
Aus
tralia
Turk
eyS
witz
erla
nd
OE
CD
Ave
rage
Aus
tria
Nor
way
Italy
Bel
gium
Por
tuga
lFr
ance
Net
herla
nds
Cze
ch R
epub
Spa
inK
orea
Slo
vak
Rep
ubJa
pan
Pol
and
Gre
ece
Finl
and
Luxe
mbo
urg
Hun
gary
Per
cen
t o
f S
tud
ents
U.S.A.
Source: OECD, PISA 2006 Results, table 3.7, http://www.oecd.org/
20
07
by T
he
Ed
uca
tion
Tru
st, Inc.
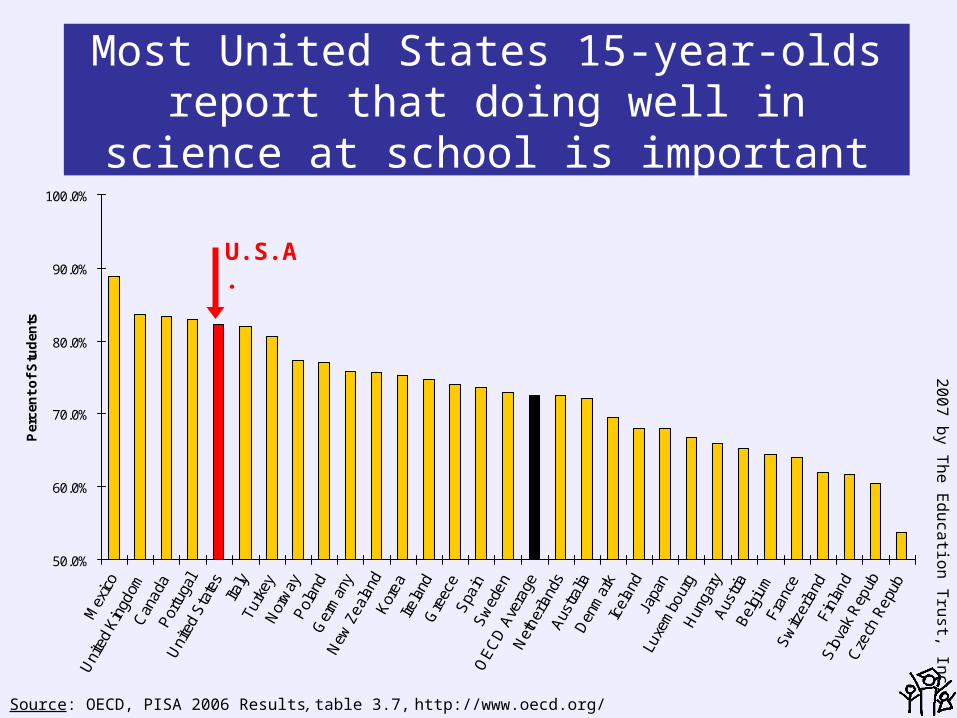
Most United States 15-year-olds report that doing well in science at school is important
50.0%
60.0%
70.0%
80.0%
90.0%
100.0%
Mex
ico
Uni
ted
Kin
gdom
Can
ada
Por
tuga
lU
nite
d S
tate
sIta
lyTu
rkey
Nor
way
Pol
and
Ger
man
yN
ew Z
eala
ndK
orea
Irela
ndG
reec
eS
pain
Sw
eden
OE
CD
Ave
rage
Net
herla
nds
Aus
tralia
Den
mar
kIc
elan
dJa
pan
Luxe
mbo
urg
Hun
gary
Aus
tria
Bel
gium
Fran
ceS
witz
erla
ndFi
nlan
dS
lova
k R
epub
Cze
ch R
epub
Per
cen
t o
f S
tud
ents
U.S.A.
Source: OECD, PISA 2006 Results, table 3.7, http://www.oecd.org/
20
07
by T
he
Ed
uca
tion
Tru
st, Inc.
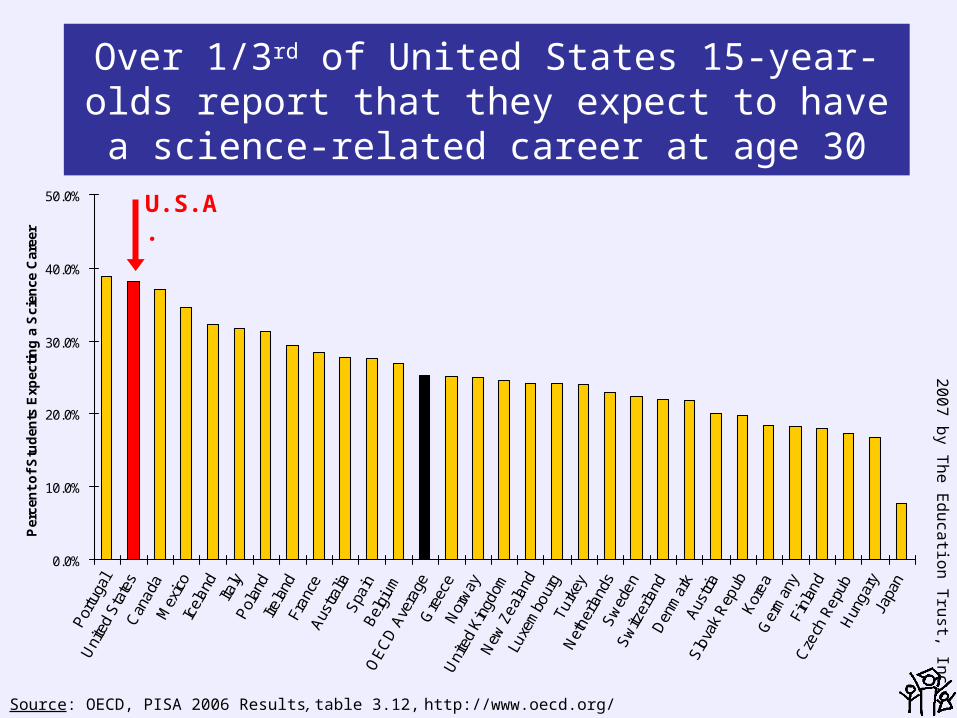
Over 1/3rd of United States 15-year-olds report that they expect to have a science-related career
at age 30
0.0%
10.0%
20.0%
30.0%
40.0%
50.0%
Por
tuga
lU
nite
d S
tate
sC
anad
aM
exic
oIc
elan
dIta
lyP
olan
dIre
land
Fran
ceA
ustra
liaS
pain
Bel
gium
OE
CD
Ave
rage
Gre
ece
Nor
way
Uni
ted
Kin
gdom
New
Zea
land
Luxe
mbo
urg
Turk
eyN
ethe
rland
sS
wed
enS
witz
erla
ndD
enm
ark
Aus
tria
Slo
vak
Rep
ubK
orea
Ger
man
yFi
nlan
dC
zech
Rep
ubH
unga
ryJa
pan
Per
cen
t o
f S
tud
ents
Exp
ecti
ng
a S
cien
ce C
aree
r
U.S.A.
Source: OECD, PISA 2006 Results, table 3.12, http://www.oecd.org/

20
07
by T
he
Ed
uca
tion
Tru
st, Inc.
But even those U.S. students who expect to have a career in science don’t perform as
well as students in other countries
375
425
475
525
575
625
Finl
and
New
Zea
land
Cze
ch R
epub
Aus
tralia
Japa
nG
erm
any
Can
ada
Hun
gary
Uni
ted
Kin
gdom
Bel
gium
Net
herla
nds
Kor
eaIre
land
Sw
itzer
land
Aus
tria
OE
CD
Ave
rage
Slo
vak
Rep
ubS
pain
Pol
and
Sw
eden
Den
mar
kFr
ance
Icel
and
Nor
way
Luxe
mbo
urg
Gre
ece
Uni
ted
Sta
tes
Por
tuga
lIta
lyTu
rkey
Mex
icoA
vera
ge
Sca
le S
core
of
Stu
den
ts E
xpec
tin
g a
Sci
ence
Car
eer
Source: OECD, PISA 2006 Results, table 3.12, http://www.oecd.org/
U.S.A.

20
07
by T
he
Ed
uca
tion
Tru
st, Inc.
Myth #6
If our kids could spend more time on science and math, they would
do better
20
07
by T
he
Ed
uca
tion
Tru
st, Inc.
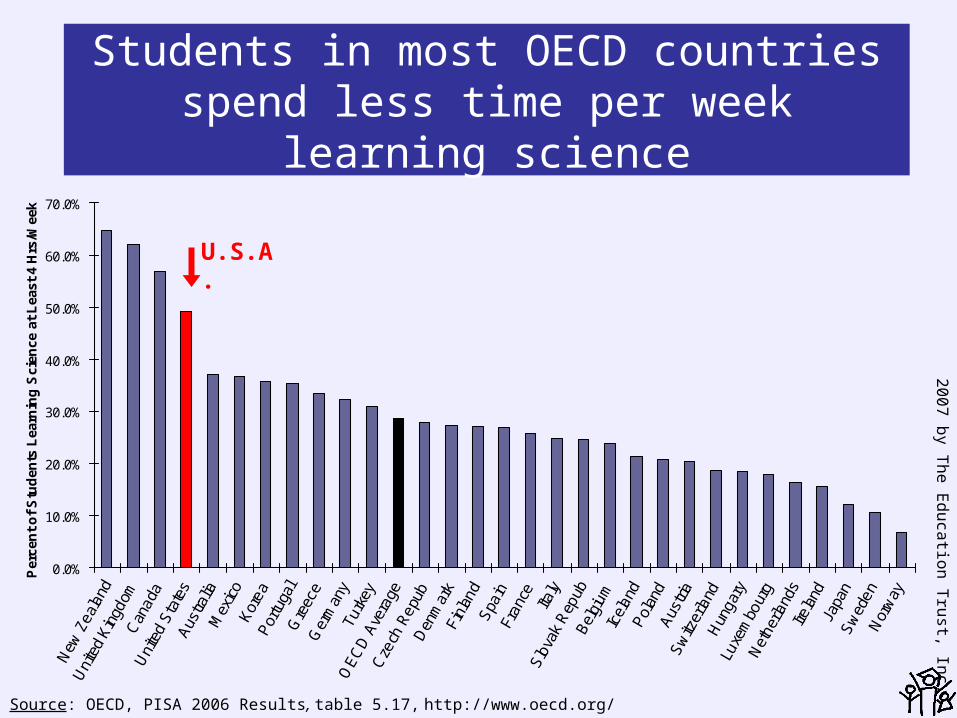
Students in most OECD countries spend less time per week learning science
0.0%
10.0%
20.0%
30.0%
40.0%
50.0%
60.0%
70.0%
New
Zea
land
Uni
ted
Kin
gdom
Can
ada
Uni
ted
Sta
tes
Aus
tralia
Mex
ico
Kor
eaP
ortu
gal
Gre
ece
Ger
man
yTu
rkey
OE
CD
Ave
rage
Cze
ch R
epub
Den
mar
kFi
nlan
dS
pain
Fran
ceIta
lyS
lova
k R
epub
Bel
gium
Icel
and
Pol
and
Aus
tria
Sw
itzer
land
Hun
gary
Luxe
mbo
urg
Net
herla
nds
Irela
ndJa
pan
Sw
eden
Nor
way
Per
cen
t o
f S
tud
ents
Lea
rnin
g S
cien
ce a
t L
east
4 H
rs/W
eek
Source: OECD, PISA 2006 Results, table 5.17, http://www.oecd.org/
U.S.A.

20
07
by T
he
Ed
uca
tion
Tru
st, Inc.
Students in most OECD countries also spend less time per week on science
homework
0.0%
10.0%
20.0%
30.0%
40.0%
50.0%
Italy
Por
tuga
lM
exic
oP
olan
dG
reec
eS
pain
Turk
eyU
nite
d S
tate
sG
erm
any
Hun
gary
Can
ada
Slo
vak
Rep
ub
OE
CD
Ave
rage
Uni
ted
Kin
gdom
Fran
ceA
ustri
aN
ew Z
eala
ndB
elgi
umN
ethe
rland
sIre
land
Kor
eaLu
xem
bour
gA
ustra
liaIc
elan
dC
zech
Rep
ubS
witz
erla
ndS
wed
enD
enm
ark
Finl
and
Japa
n
Per
cen
t o
f S
tud
ents
Sp
end
ing
>2
Hrs
/Wee
k o
n S
cien
ce H
om
ewo
rk
Source: OECD, PISA 2006 Results, table 5.17, http://www.oecd.org/
U.S.A.
20
07
by T
he
Ed
uca
tion
Tru
st, Inc.
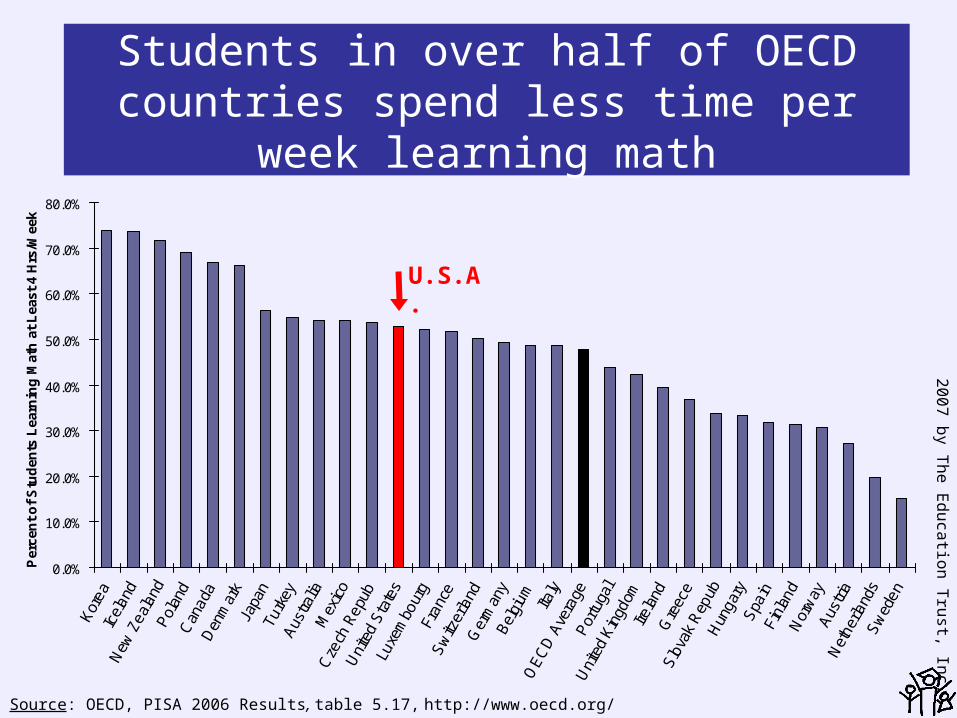
Students in over half of OECD countries spend less time per week learning math
0.0%
10.0%
20.0%
30.0%
40.0%
50.0%
60.0%
70.0%
80.0%
Kor
eaIc
elan
dN
ew Z
eala
ndP
olan
dC
anad
aD
enm
ark
Japa
nTu
rkey
Aus
tralia
Mex
ico
Cze
ch R
epub
Uni
ted
Sta
tes
Luxe
mbo
urg
Fran
ceS
witz
erla
ndG
erm
any
Bel
gium Ita
ly
OE
CD
Ave
rage
Por
tuga
l
Uni
ted
Kin
gdom
Irela
ndG
reec
eS
lova
k R
epub
Hun
gary
Spa
inFi
nlan
dN
orw
ayA
ustri
aN
ethe
rland
sS
wed
en
Per
cen
t o
f S
tud
ents
Lea
rnin
g M
ath
at
Lea
st 4
Hrs
/Wee
k
Source: OECD, PISA 2006 Results, table 5.17, http://www.oecd.org/
U.S.A.

20
07
by T
he
Ed
uca
tion
Tru
st, Inc.
Students in over half of OECD countries also spend less time per week on
math homework
0.0%
10.0%
20.0%
30.0%
40.0%
50.0%
60.0%
Italy
Ger
man
yTu
rkey
Kor
eaM
exic
oA
ustri
aP
olan
dG
reec
eU
nite
d S
tate
sS
pain
Por
tuga
lC
anad
aB
elgi
umH
unga
ry
OE
CD
Ave
rage
Aus
tralia
Den
mar
kIre
land
Fran
ceS
lova
k R
epub
Icel
and
Luxe
mbo
urg
Sw
itzer
land
New
Zea
land
Net
herla
nds
Japa
n
Uni
ted
Kin
gdom
Cze
ch R
epub
Finl
and
Sw
edenP
erce
nt
of
Stu
den
ts S
pen
din
g >
2 H
rs/W
eek
on
Mat
h H
om
ewo
rk
Source: OECD, PISA 2006 Results, table 5.17, http://www.oecd.org/
U.S.A.

20
07
by T
he
Ed
uca
tion
Tru
st, Inc.
It is high time that as a nation we stop making excuses
Our international competitiveness depends on it

20
07
by T
he
Ed
uca
tion
Tru
st, Inc.
The Education Trust
www.edtrust.org
202-293-1217