Embed Size (px)
Citation preview

Program for International Student Assessment (PISA) 2003 Data Analysis User’s Guide
October 2006
U.S. Department of Education Institute of Education Sciences NCES 2007-048
David Kastberg Stephen Roey Trevor Williams David Ferraro Westat
Connie Smith Pearson
Mariann Lemke Project Officer National Center for Education Statistics
U.S. Department of Education Margaret Spellings Secretary
Institute of Education Sciences Grover J. Whitehurst Director
National Center for Education Statistics Mark S, Schneider Commissioner The National Center for Education Statistics (NCES) is the primary federal entity for collecting, analyzing, and reporting data related to education in the United States and other nations. It fulfills a congressional mandate to collect, collate, analyze, and report full and complete statistics on the condition of education in the United States; conduct and publish reports and specialized analyses of the meaning and significance of such statistics; assist state and local education agencies in improving their statistical systems; and review and report on education activities in foreign countries. NCES activities are designed to address high priority education data needs; provide consistent, reliable, complete, and accurate indicators of education status and trends; and report timely, useful, and high quality data to the U.S. Department of Education, the Congress, the states, other education policymakers, practitioners, data users, and the general public.
We strive to make our products available in a variety of formats and in language that is appropriate to a variety of audiences. You, as our customer, are the best judge of our success in communicating information effectively. If you have any comments or suggestions about this or any other NCES product or report, we would like to hear from you. Please direct your comments to:
National Center for Education Statistics Institute of Education Sciences U.S. Department of Education 1990 K Street NW Washington, DC 20006
October 2006
The NCES World Wide Web Home Page is: http://nces.ed.gov The NCES World Wide Web Electronic Catalog is: http://nces.ed.gov/pubsearch Suggested citation: Lemke, M., Williams, T., Roey, S., Smith, C., Kastberg, D., Jocelyn, L., Ferraro, D. (2003). The Program for International Student Assessment (PISA) 2003 Data Analysis User’s Guide. (NCES 2007-048). U.S. Department of Education, NCES. Washington, DC: U.S. Government Printing Office. For ordering information on this report, write to:
U.S. Department of Education, ED Pubs P.O. Box 1398 Jessup, MD 20794-1398 or call toll free 1-877-4ED-PUBS or go to the Internet: http://nces.ed.gov/surveys/pisa
Content contact: Eugene Owen 202-502-7244 [email protected]
i
ACKNOWLEDGEMENTS
Several people contributed to making this User’s Guide possible, and the authors wish to thank all those who have assisted with various aspects of the report. We would like to thank Mariann Lemke, Elois Scott, Val Plisko, Ralph Lee, Bruce Taylor, and Edie McArthur of NCES. Joan Murphy of Westat edited the report.

ii
TABLE OF CONTENTS
Chapter Page
ACKNOWLEDGEMENTS............................................................................. I 1 A USER’S GUIDE TO THE U.S. DATA FROM PISA 2003 ........................ 1
1.1 The Program for International Student Assessment (PISA) ............... 1 1.2 The Implementation of PISA.............................................................. 1 1.3 Type of questions in PISA.................................................................. 2 1.4 Reporting performance in PISA.......................................................... 2
2 U.S. PISA 2003 SCHOOL SAMPLE .............................................................. 3
2.1 Introduction......................................................................................... 3 2.2 School Sampling Frame...................................................................... 3 2.3 School Sample .................................................................................... 4
2.3.1 Measures of Size and School Selection............................... 4 2.3.2 School Sample Design ........................................................ 7 2.3.3 Tabulations Within Subgroups for Frame and Sample ....... 8
2.4 PISA School Selection........................................................................ 10
2.4.1 School Selection.................................................................. 10 2.4.2 Selecting Substitute Schools ............................................... 11
2.5 Selecting Students............................................................................... 11 2.6 Fall Data Collection School and Student Sample ............................... 11
3 RECRUITMENT OF SCHOOLS AND STUDENTS..................................... 12
3.1 Contacting States, Districts, and Schools ........................................... 12 3.1.1 Contacting States................................................................. 12 3.1.2 Contacting Districts............................................................. 12 3.1.3 Contacting Schools.............................................................. 12
3.2 Recruiting Parents and Students ......................................................... 13 3.3 Student Sampling and Exclusion Criteria ........................................... 13 3.4 Student Exclusions in PISA 2003....................................................... 14 3.5 Participation Results ........................................................................... 15

iii
TABLE OF CONTENTS (CONTINUED)
Chapter Page
4 INSTRUMENTS, TRAINING AND DATA COLLECTION ........................ 17
4.1 Instruments ......................................................................................... 17
4.1.1 Production of Assessment Booklets and Questionnaires .... 17 4.1.2 Distribution of Materials ..................................................... 17
4.2 Field Staff Organization...................................................................... 18
4.2.1 Recruiting, Hiring, and Training Supervisors ..................... 19 4.2.2 Conduct the Assessment ..................................................... 19 4.2.3 Results of Telephone Followup .......................................... 19
4.3 Sampling and Data Collection Forms ................................................. 20
4.3.1 School Cooperation Form ................................................... 20 4.3.2 School Information Form.................................................... 20 4.3.3 Student Listing Form........................................................... 21 4.3.4 Student Tracking Form ....................................................... 21 4.3.5 Sampling Contingency Plan Form and Random
Number Table...................................................................... 21 4.3.6 Instructions for Defining Students with Special
Education Needs (SEN) ...................................................... 21 4.3.7 Instructions for Including/Excluding Students Form .......... 22 4.3.8 Session Report Form........................................................... 22
4.4 Coding, Scoring, and Data Processing................................................ 22
4.4.1 Data Marking and Scoring .................................................. 22 4.4.2 File Creation and Consistency Checks................................ 24
5 THE PISA 2003 DATA .................................................................................. 25
5.1 PISA 2003 Data sets ........................................................................... 25 5.2 The US National Data......................................................................... 26 5.3 Accessing the US Data Through the Electronic Codebook ................ 27 5.4 Confidentiality of US Data ................................................................. 27 5.5 Accessing Data from Other Countries ................................................ 28 5.6 Special Considerations in the Anbalysis of PISA 2003 Data ............. 28 5.7 Analyzing School Data ....................................................................... 29
REFERENCES ............................................................................................... 32

iv
TABLE OF CONTENTS (CONTINUED)
List of Appendixes
Appendix Page
A PISA 2003 School and Student Questionnaires............................................... A-1 B U.S. Adaptations to the PISA 2003 Student and School Questionnaires......... B-1 C PISA 2003 Sampling and Data Collection Forms ........................................... C-1 D Other PISA 2003 Reports and References....................................................... D-1
List of Tables
Table Page 2-1 Frame tabulations by school grade span .......................................................... 4 2-2 Frame tabulations by public/private school status ........................................... 4 2-3 Percentages by grade for the age-eligible students: PISA 2003 ...................... 5 2-4 Implicit stratification variables: PISA 2003 .................................................... 8 2-5 Frame and sample tabulations by age-eligible proportion of students by grade level: PISA 2003 ............................................................................... 9 2-6 Frame and sample tabulations by private/public school status: PISA 2003 .... 9 2-7 Frame and sample tabulations by regionof the country: PISA 2003 ............... 9 2-8 Frame and sample tabulations by location of school relative to populous areas: PISA 2003 ............................................................................................. 10 2-9 Frame and sample tabulations by minority status:PISA 2003 ......................... 10 3-1a School response rates before replacement (weighted): PISA 2003 ................. 15 3-1b School response rates after replacement (weighted): PISA 2003 .................... 15 3-2 Student response rates (weighted): PISA 2003................................................ 16 4-1 Number of items by reliability percentage, ranges, and subject: PISA 2003........................................................................................................ 23

v
TABLE OF CONTENTS (CONTINUED)
List of Figures
Figure Page
2-1 Preliminary measure of size as a function of estimated age-eligible students: PISA 2003......................................................................................... 6
List of Exhibits Exhibit Page
3-1 PISA 2003 Exclusion Criteria.......................................................................... 14 5-1 Example of SAS syntax for merging student and school data ......................... 30 5-2 Example of SPSS syntax for merging student and school data ....................... 31
1
1. A User’s Guide to the U.S. Data from PISA 2003
This User’s Guide contains a description of the procedures used to conduct the 2003 cycle of PISA in the United States, and instructions on how to access the US data through the Electronic Codebook that is included as part of this package. The Guide is designed to supplement information contained in the international publications produced by OECD, and in particular the PISA 2003 Data Analysis Manual (OECD, 2005), by describing those aspects of PISA 2003 that are unique to the United States. The following sections in this chapter provide general information about PISA. 1.1 The Program for International Student Assessment (PISA)
The Program for International Student Assessment (PISA) is a system of international
assessments that measures 15-year-olds’ capabilities in reading literacy, mathematics literacy, and science literacy every 3 years. PISA was first implemented in 2000 and with the second cycle taking place in 2003. The third cycle of assessment will take place in 2006.
Each PISA data-collection effort assesses one subject area in depth, although all three are
assessed in each cycle so that participating countries have an ongoing source of achievement data in every subject area. In addition to the reading literacy, mathematics literacy, and science literacy, PISA also measures general or cross-curricular competencies such as learning strategies. In the second cycle, PISA 2003, mathematics literacy was the subject area assessed in depth along with the new cross-curricular area of problem solving. In 2006, PISA will focus on science literacy. Results from PISA 2000, which focused on reading literacy, are described in Lemke et al. (2001) and Organization for Economic Cooperation and Development (OECD) (2001). The PISA NCES website (http://nces.ed.gov/surveys/pisa) provides background information on the PISA surveys, copies of NCES publications that relate to PISA, and sample PISA items from previous assessments.
1.2 The implementation of PISA
To implement PISA, each country selects a nationally representative sample of 15-year- olds, regardless of grade level. The U.S. sample for PISA includes both public and private schools, randomly selected and weighted to be representative of the nation. Each selected student completes a 2-

2
hour paper and pencil assessment, and a 30-minute background questionnaire that collects information on his/her background and attitudes toward learning. In each country, the assessment is translated into the primary language of instruction; in the United States, all materials are written in English. The international design and procedures for PISA do not allow for accommodations for students with special needs or limited proficiency in the test language. 1.3 Types of questions in PISA
The PISA assessment consists of a mix of multiple-choice, short-answer, and extended- response questions. The PISA 2003 assessment of mathematics was found to have approximately one-third multiple choice questions, compared to two-thirds in NAEP. Each assessment task consists of a passage of text, a graph, or other stimulus material followed by a series of questions. 1.4 Reporting performance in PISA
The PISA assessment employed a Balanced Incomplete Block Design to optimize the relationship between subject matter coverage and respondent burden. As a consequence, like other large-scale assessments, PISA was not designed to provide individual student scores, but rather national and sub-national estimates of performance. Scores for reading literacy, mathematics literacy, and science literacy are provided as five plausible values on a scale that ranges from 0 to 1,000 points.

3
2. U.S. PISA 2003 School Sample
2.1 Introduction
The PISA 2003 school sample was drawn for the United States in November, 2002. The sample design for this school sample was developed to retain some of the properties of the PISA 2000 U.S. school sample, and to follow international requirements as given in the PISA sampling manual. Unlike the PISA 2000 sample, which had a three-stage design with a sample of geographic PSUs as the first stage of selection, the PISA2003 sample was selected in a two-stage sampling process with the first stage a sample of schools, and the second stage a sample of students within schools. Thus, the sample design for the PISA sample was a stratified systematic sample, with sampling probabilities proportional to measures of size. The sample had no explicit stratification and no oversampling of specified groups.
The student population for the PISA 2003 is the set of all 15 year-olds in the United States.
The PISA school sample consisted of 420 schools containing at least one seventh through twelfth grade class. The schools were selected with probability proportionate to the school’s estimated enrollment of 15 year-olds based on the 2003 National Assessment of Educational Progress (NAEP) school frame with 2000-2001 school data. A sample of 35 students was selected within each school if 35 or more students were listed. If a school had less than 35 students then all students were selected. The overall sample design is intended to approximate a self-weighting sample of students as much as possible, with each 15 year-olds student in the U.S. having an equal probability of being selected.
2.2 School Sampling Frame
The school frame for the PISA sample was developed from the 2003 NAEP school frame with 2000-2001 school data. For the most up to date information, see the NAEP website at http://nces.ed.gov/nationsreportcard. The data for public schools was from the Common Core of Data (CCD), and the data for private schools was from the Private School Survey (PSS). Any school containing at least one seventh through twelfth grade class as of the school year 2000-2001 was included on the school sampling frame.
Tables 2-1 and 2-2 present frame tabulations of the number of schools by the school grade
span (lowest to highest grade level of the school) and public/private school status, respectively.

4
Table 2-1. Frame tabulations by school grade span: PISA 2003 Grade span Schools Percent Total 60,247 100.00108 14,777 24.50912 14,370 23.90608 8,805 14.60112 6,487 10.80712 3,822 6.30708 2,659 4.40612 1,510 2.50508 1,470 2.4Other 6,347 10.5
NOTE: Detail may not sum to total because of rounding.
SOURCE: Organization for Economic Cooperation and Development, Program for International Student Assessment (PISA) 2003. Table 2-2. Frame tabulations by public/private school status: PISA 2003 School status Schools PercentTotal 60,247 100.0Private 18,637 30.9Public 41,790 69.1
NOTE: Detail may not sum to total because of rounding.
SOURCE: Organization for Economic Cooperation and Development, Program for International Student Assessment (PISA) 2003.
2.3 School Sample
2.3.1 Measures of Size for School Selection
The first step in assigning the school measure of size was to estimate the number of age eligible students in each school on the frame. There was no direct information as to the numbers of students in each school who were born in a particular year, only estimates of the numbers of students in each school who were in each grade. (In most cases, the latter estimate was derived by taking the total student enrollment in the school and dividing this total by the number of grades reported for the school, unless a within-grade enrollment was present on the frame and judged as reliable for use as an estimate.) To use these estimates to develop an estimate of the number of 15 year olds for each school, estimates of the percentages of students born in 1987 in each grade in the 2002-2003 school year were derived using

5
the PISA 2000 data. Even though the data corresponds to an earlier school year, it was deemed the most accurate source. The PISA 2000 percentages by grade for the age-eligible students are shown in Table 2.3.
Table 2-3. Percentages of age-eligible students by grade: PISA 2003
Grade
Percentage of Age-eligible
students
7th 0.3
8th 4.0 9th 42.0 10th 53.2 11th 0.4 12th 0.1 NOTE: Detail may not sum to total because of rounding.
SOURCE: Organization for Economic Cooperation and Development, Program for International Student Assessment (PISA) 2003.
From the table, the modal grade for 15 year-old children is the tenth grade, with a large
fraction in the ninth grade. Very small fractions are in the seventh, eighth, or eleventh grade, with completely negligible percentages (less than 0.01 percent all together) in other grades. These percentages divided by 100 are indicated as pg below (g=7, 8, 9, 10, 11).
The age-eligible estimate AEi for each school i on the frame was calculated as follows (with
Eig the estimated number of students enrolled in grade g for school i):
∑=
=12
7giggi EpAE
Note that AEi tends to be small for frame schools without a ninth or tenth grade (i.e., schools
that end in the eighth grade, or schools that begin with the eleventh grade) even if the schools themselves have a high enrollment. A school’s measure of size is proportional to its share of the target population, that is, the 15 year-old students. Schools with enrollments of only a few students would have very large weights if selected. To minimize the impact of these schools on variances and estimates, the measure of size was adjusted.

6
The following is a summary of the steps for assigning measures of size to the schools on the PISA frame. The field names on the SAS frame files are capitalized.
Determine the estimated target population size for the school. This is the age-eligible
enrollment per school, AGEELIG (AEi), as described earlier; and
Calculate measures of size according to the age-eligible enrollment per grade as shown.
8.75 51.312*( 1.67) 5 25
35 25 3535
AGEELIGAGEELIG AGEELIG
MOSAGEELIG
AGEELIG AGEELIG
<=⎧⎪ + < <=⎪= ⎨ < <=⎪⎪ <⎩
This is a piecewise constant and linear function. A graph of this function is given in the following figure.
Figure 2-1. Preliminary measure of size as a function of estimated age-eligible students: PISA 2003
0
5
10
15
20
25
30
35
40
45
50
0 5 10 15 20 25 30 35 40 45 50
Estimated age-eligible students
Prel
imin
ary
mea
sure
of s
ize
SOURCE: Organization for Economic Cooperation and Development, Program for International Student Assessment (PISA) 2003.

7
The school probability of selection without adjustment is proportional to the estimated age-eligibles AEi (pi=a*AEi, with a the proportionality constant). The student sample design was to sample 35 students with equal probability when the school has more than 35 age-eligible students, and to take all students when the school has less than or equal to 35 age-eligible students. For schools with more than 35 students, the within-school probability of selection for each student is 35/TAEi, where TAEi is the true number of age-eligible students in the school (which was found at the time the school was assessed) so that the overall student probability of selection is a*AEi*(35/TAEi), which reduces to a*35 when TAEi is equal to AEi. Within a school with less than 35 age-eligible students all age-eligible students are taken with certainty, so that the overall student probability of selection is the school probability of selection a*AEi. To avoid students with too-small probabilities of selection from these schools (which increases sampling variability), a bound is set that no student should have a smaller probability of selection then (1/4)*a*35, which is 8.75*a. This can be accomplished by bounding MOSi below by 8.75. There are a variety of continuous functions (piece-wise and otherwise) which obey this constraint while being consistent with the simple slope-one linear function for AEi greater than 35 (corresponding to MOSi being equal to AEi). The particular piece-wise function chosen is constant for schools with AEi values between 25 and 35, maximizing the probabilities of selection for these schools while being consistent with the other constraints.
2.3.2 School Sample Design
The sample design for the PISA sample was a stratified systematic sample, with sampling probabilities proportional to measures of size. The PISA sample had no explicit stratification. A sample of 420 schools was drawn from the frame as a single stratum. The frame was implicitly stratified by five categorical stratification variables. They are listed in Table 2-4 below. The frame was sorted according to these school characteristics, implicitly stratifying the frame. There are a total of 640 implicit strata. The last sort key within the implicit stratification was by grade enrollment (MOS) in descending order.

8
Table 2-4. Implicit stratification variables: PISA 2003
Variable name Variable definition Number of levels
GRADPROP Age-eligible proportion by grade level:
0708=schools with 7th or 8th as last grade 09= schools with 9th grade as last grade 0910= schools with grades 09-12 10= schools with 10-12 090810= all other schools
5
PUBPRIV Type of school: public or private 2 NAEPRG_S Region of country: North East, South East, Central, West 4
TYP_LOC_R Location of school relative to populous areas: 1=large central city 250,000+ 2=mid-size central city <250,000 3=urban fringe of large central city 4=urban fringe of mid-size central city 5=large town 25,000+ 6=small town 2,500-25,000 7=rural outside MSA 8=rural inside MSA
8
MINSTAT Minority status: above or below 15% 2 NOTE: Detail may not sum to total because of rounding.
SOURCE: Organization for Economic Cooperation and Development, Program for International Student Assessment (PISA) 2003.
2.3.3 Tabulations within Subgroups for Frame and Sample
This section provides an overview of the frame and sample for the implicit strata used in the sample process. The implicit stratification worked effectively: the sample percentage of schools was close to the measure-of-size percentage of the frame for all the implicit strata. For these strata-defining subgroups, Tables 2-5 through 2-9 present the following summary tabulations in these subgroups:
Total measure of size. This is the summation of ijMOS over the subgroup. Note that
this is larger than the national population student size because the minimum ijMOS is adjusted for small schools; and
Sample size. This is the final realized sample size of schools in the subgroup for the U.S. PISA sample.

9
Table 2-5. Frame and sample tabulations by age-eligible proportion of students by grade level: PISA 2003
Frame Sample Grade level Measure of Size Percent of
MOSNumber of
SchoolsPercent of
Schools Total 4,266,750 100.0 420 100.0 0708 340,575 8.0 33 7.9 09 120,362 2.8 12 2.9 090810 602,636 14.1 59 14.0 0910 3,099,869 72.7 306 72.9 10 103,307 2.4 10 2.4
NOTE: Detail may not sum to total because of rounding.
SOURCE: Organization for Economic Cooperation and Development, Program for International Student Assessment (PISA) 2003. Table 2-6. Frame and sample tabulations by public/private school status: PISA 2003
Frame Sample School status Measure of Size Percent of MOS Number of Schools Percent of Schools Total 4,266,750 100.0 420 100.0 Private 410,550 9.6 41 9.8 Public 3,856,200 90.4 379 90.2
NOTE: Detail may not sum to total because of rounding.
SOURCE: Organization for Economic Cooperation and Development, Program for International Student Assessment (PISA) 2003. Table 2-7. Frame and sample tabulations by region of the country: PISA 2003
Frame Sample Region of country Measure of Size Percent of
MOSNumber of
SchoolsPercent of
Schools Total 4,266,750 100.0 420 100.0 North East 863,242 20.2 84 20.0 South East 1,000,020 23.4 101 24.0 Central 1,016,207 23.8 99 23.6 West 1,387,281 32.5 136 32.4
NOTE: Detail may not sum to total because of rounding.
SOURCE: Organization for Economic Cooperation and Development, Program for International Student Assessment (PISA) 2003.

10
Table 2-8. Frame and sample tabulations by location of school relative to populous areas: PISA 2003 Strata Frame Sample Location of school Measure of Size Percent of MOS
Number of Schools Percent of Schools
Total 4,266,750 100.0 420 100.0 1 704,782 16.5 67 16.0 2 610,585 14.3 64 15.2 3 1,240,186 29.1 122 29.0 4 378,905 8.9 36 8.6 5 56,592 1.3 5 1.2 6 436,661 10.2 43 10.2 7 413,401 9.7 41 9.8 8 425,637 10.0 42 10.0
NOTE: Detail may not sum to total because of rounding.
SOURCE: Organization for Economic Cooperation and Development, Program for International Student Assessment (PISA) 2003. Table 2-9. Frame and sample tabulations by minority status: PISA 2003
Frame Sample Minority status Measure of Size Percent of MOS Number of Schools Percent of Schools Total 4,266,750 100.0 420 100.0 Above 15% 2,248,941 52.7 221 52.6 Below 15% 2,017,808 47.3 199 47.4
NOTE: Detail may not sum to total because of rounding.
SOURCE: Organization for Economic Cooperation and Development, Program for International Student Assessment (PISA) 2003.
2.4 PISA School Selection
2.4.1 School Selection
The sample was then systematically selected from the ordered frame. Normally, a sampling interval is calculated within each explicit stratum by dividing the cumulative probability of selection by the sample size. However, since the PISA sample had no explicit stratification, the overall sampling interval was calculated by dividing the cumulative probability of selection by the total sample size. A random number between 0 and the sampling interval was generated, and a sequence of numbers was in turn generated by adding integer multiples of the sampling interval _SKIPINT to the random number, until the cumulative probability of selection, CUMPROB, was exceeded. For each number in the sequence, the first school with a

11
cumulative measure of size, CUMPROB, that equals or exceeds that number was selected. Westat’s in-house software WESSAMP was utilized to do this systematic sampling.
2.4.2 Selecting Substitute Schools
Substitutes for noncooperating sampled schools were identified, assigning the two schools neighboring the sampled school on the frame. There were several constraints on the assignment of substitutes. One sampled school was not allowed to substitute for another, and a given school could not be assigned to substitute for more than one sampled school. Furthermore, substitutes were required to be in the implicit stratum as the sampled school. If the sampled school was the first or last school in the stratum, then the second school following or preceding the sampled school was identified as the substitute. There are no restrictions for identifying substitute schools that are also in the NAEP sample. If the first substitute is a NAEP school, the second substitute would be contacted first to reduce the burden on the schools. Under these rules, it was possible to identify two substitutes for all sampled schools.
2.5 Selecting Students
The final stage of selection was students within schools. Within each sampled school that agreed to participate in PISA, all 15 year-olds in the school were enumerated. An equal probability sample of 35 students was sampled from the student frame for the school.
2.6 Fall Data Collection School and Student Sample
For the fall data collection, the school sample included those original schools from the spring sample that had refused participation in the spring but had indicated a willingness to participate in a fall assessment. Substitute schools were not included in the fall sample because their participation would have little effect on raising the final participation rate as defined internationally.
In order to achieve a comparable sample of students, the date-of-birth requirement for students assessed in the fall was shifted accordingly to ensure that they were of the same age as those students in the spring sample.

12
3. Recruitment of Schools and Students
3.1 Contacting States, Districts, and Schools
Local control of public education in the United States tends to mean that the decision to participate may be made at any of state, district or school levels. Thus, approaching schools requires that state, school district, and local school officials be contacted, in that order, for permission to proceed.
3.1.1 Contacting States
Westat began the recruitment process by contacting the Chief State School Officer and State Test Director in each of the 46 states with schools sampled for PISA. A package was sent to each state that included information on incentives and the study in general. Follow-up contact was undertaken by telephone and, ultimately, all states granted permission to contact school districts in their jurisdiction.
3.1.2 Contacting Districts
Once permission to contact the districts was granted, the school district office for each selected public school was contacted and permission to approach the selected school(s) in that district was requested from the superintendent. Districts received a package of study information materials similar to that sent to schools. Follow-up phone calls were made in the same way.
Fifty-three school districts, containing 149 schools, required a formal application to conduct
research. In most cases this amounted to asking for a research proposal since the applications tended to ask for varying levels of detail about the study, its purposes, procedures and research design. Of the 53 research applications submitted, 45 were successful in gaining approval to approach schools. The remaining eight districts declined to have their schools participate in the study. Once districts agreed to participate, they were asked to sign an Agreement to Participate form that was used to maintain a record of participation for the schools and field staff.
3.1.3 Contacting Schools
Once approval to contact the school(s) was obtained from the school district the sampled schools were contacted. At this time each school was sent a school information package addressed to the

13
principal. A few days after this material was dispatched to the school, a follow-up contact was made by telephone.
The procedures for contacting private schools were slightly different. These schools were contacted directly unless, as in the case of Catholic schools, an organization such as the local diocese required approval similar to public school district approval.
3.2 Recruiting Parents and Students
Once the students were selected within a school, Westat staff worked with the School Contact on the school-specific procedures for obtaining the consent of parents and students. Schools vary considerably in what they require in this respect; some use a simple notification, others a consent-by-default approach in which parents have to provide a written objection to participation and, in a minority of cases, schools require explicit written consent from parents. Some schools also adopt similar procedures in asking for student consent. To accommodate these consent requirements Westat provided three examples of parent permission letters that schools could use/adapt as desired to meet their own guidelines of parent permission or notification.
3.3 Student Sampling and Exclusion Criteria
The student sample was selected approximately one week before the assessment. Field supervisors followed student sampling procedure specified in the international PISA manuals and selected the sample using international sampling software on portable laptop computers.
In each school, the student sample consisted of up to 35 students born in 1987. Schools were
asked to provide specific information about age-eligible students, either by generating a list using a school computer or by entering student information on the PISA Student Listing Form. Upon receipt of a student list, student information was entered into the student sampling software provided by the international study center and a random sample of 35 students was selected. If a school had less than 35 age-eligible students, all eligible students were selected to participate.
Once the student sample had been selected, school officials reviewed the list and decided if
any students should be excluded from based on the international exclusion criteria presented in the international PISA manuals and shown in Exhibit 4-1. The “Other” category included all other categories

14
of conditions for exclusions. For example, students who were home-schooled, students who transferred out of the school to another school, or students who were not age 15 as defined by PISA (born in 1987).
Exhibit 3-1. PISA 2003 Exclusion Criteria
INSTRUCTIONS FOR EXCLUDING STUDENTS The following guidelines define general categories for the exclusion of students within schools. These guidelines need to be carefully implemented within the context of each educational system. The numbers to the left are codes to be entered in column 7 of the Student Tracking Form to identify excluded students.
1 = Functionally disabled students. These are students who are permanently physically disabled in such a way that they cannot perform in the PISA testing situation. Functionally disabled students who can respond to the test should be included in the testing.
2 = Educable mentally retarded students. These are students who are considered in the professional opinion of the school principal or by other qualified staff to be educable mentally retarded or who have been psychologically tested as such. This includes students who are emotionally or mentally unable to follow even the general instructions of the test. However, students should not be excluded solely because of poor academic performance or disciplinary problems.
3 = Students with limited proficiency in the test language. These are students who are unable to read or speak the language of the test and would be unable to overcome the language barrier in the test situation. Typically, a student who has received less than 1 year of instruction in the language of the test should be excluded, but this definition may need to be adapted in different countries.
4 = Other.
It is important that these criteria be followed strictly for the study to be comparable within and across countries. When in doubt, include the student.
3.4 Student Exclusions in PISA 2003
Of the 6,502 students identified in the PISA 2003 sample, schools excluded 534 from the assessment using international exclusion criteria supplied to them. The breakdown of excluded students is as follows: functional disability – 32; intellectual disability – 431; and limited English proficiency – 71. The resulting (weighted) exclusion rate was 7.28 percent. This exclusion rate was higher than expected relative to the rate of 4 percent reported for PISA in 2000, and the rate of approximately 4 percent reported for TIMSS in 2003. Basically, while the relative proportions in each exclusion category were comparable across studies, the absolute numbers increased in the PISA data collection. As this increased rate became apparent field staff were informed and urged to question schools closely about their decisions and verify these wherever possible.

15
3.5 Participation Results
The original PISA school sample consisted of 420 schools, 382 of which were eligible to participate. Only 179 of the original sample of schools-- a weighted participation rate of 47 percent-- agreed to participate in a spring assessment. However, close to 20 percent of refusals in the original sample cited time of year as the main problem and, when asked, agreed to undertake the assessment in the fall. With the permission of the international agency, the U.S. conducted a follow-up fall assessment of students of the same age. Combining data from both spring and fall assessments, 249 original schools and 13 replacements schools participated in the study. School participation rates are presented in Tables 3-1a and 3.1b. Table 3-1a. School response rates before replacement (weighted): PISA 2003
Before Replacement
Weighted participation rate
before replacement (%)
Number of responding
schools (weighted by
enrollment)
Number of schools sampled (responding and nonresponding,
weighted by enrollment)
Number of responding
schools (unweighted)
Number of responding and non-responding
schools (unweighted)
64.94 2,451,083 3,774,330 249 382 Table 3-1b. School response rates after replacement (weighted): PISA 2003
After Replacement
Weighted school participation
rate after replacement (%)
Number of responding
schools(weighted by
enrollment)
Number of schools sampled
(responding and
nonresponding, weighted by enrollment)
Number of responding
schools (unweighted)
Number of responding and non-responding
schools (unweighted)
68.12 2,571,003 3,774,322 262 382
SOURCE: Organization for Economic Cooperation and Development, Program for International Student Assessment (PISA) 2003.
Although the response rates met the minimum international requirement, they failed to meet
the 85 percent required by the NCES statistical standards. As a result, a bias analysis was conducted to determine if the characteristics of nonresponding schools differed from those of responding schools. On

16
the whole the evidence suggested minimal bias along the dimensions examined for both samples. The full nonresponse bias analysis is available in Program for International Student Assessment 2003 Non-response Bias Analysis (Ferraro, Czuprynski and Williams forthcoming). For a more detailed treatment of the adjustment procedures for nonresponse see Chapter 8: Survey weighting and the calculation of sampling variance and PISA 2003 Technical Report (OECD, 2005, Chapter 15) (http://www.pisa.oecd.org/document/13/0,2340,en_32252351_32236173_35188685_1_1_1_1,00.html).
Table 3-2 shows statistics on student participation. In total 6,502 students were sampled
from the 262 responding schools. Eligible students were defined as those born in 1987. The result of attrition because of ineligibility, withdrawal, exclusion, or absenteeism was that 5,456 students took the assessment. The weighted number of students assessed, expressed as a percentage of the weighted number of eligible students, yielded a student response rate of 83 percent, a rate which exceeds the PISA international standard of 80 percent. However, this response rate is based only on those students in schools with student participation rate of at least 50 percent, a reduced total of 5,342 students. In the partially responding schools, 114 students took the assessment. All 5,456 students are included in the international database. Table 3-2. Student response rates (weighted): PISA 2003
Weighted participation rate after replacement
(%)
Number of students assessed
(weighted)
Number of students sampled (assessed
and absent, weighted)
Number of students assessed
(unweighted)
Number of students sampled (assessed
and absent, unweighted)
82.73 1,772,279 2,142,288 5,342 6,502
SOURCE: Organization for Economic Cooperation and Development, Program for International Student Assessment (PISA) 2003.

17
4. Instruments, Training, and Data Collection
4.1 Instruments
The instrumentation for PISA consisted of separately administered student and school components. The student component consisted of assessment items and a separately timed background questionnaire designed to collect basic demographic information and information on the student’s attitudes towards mathematics, instructional experiences, and attitudes about school. The school questionnaire completed by the school principal or designate collected information on the demographic characteristics of the school and the structure and approach for education instruction. Each instrument was adapted to U.S. English. The school and student questionnaires are provided in appendix B. U.S. adaptations to the international versions of the questionnaires are provided in appendix C. A detailed description of the assessment and questionnaire development is provided in the PISA 2003 Technical Report (OECD, 2005, Chapters 2 and 3) (http://www.pisa.oecd.org/document/13/0,2340,en_32252351_32236173_35188685_1_1_1_1,00.html).
4.1.1 Production of Assessment Booklets and Questionnaires
Pearson Educational Measurement (Pearson) assembled the booklets from files containing the scoring guides with cultural adaptations or translations approved by the Australian Council for Educational Research (ACER), the international coordinating center for PISA. The United States developed an additional six booklets for a U.S.-only metric-imperial study to investigate possible effects of using metric measurement units (e.g., meters, liters, etc.) compared to the more familiar imperial units (e.g., feet, gallons, etc.) on test performance. As each book was completed it was printed on a stand-alone printer and sent to Westat for further proofing. Final versions were sent to the International Study Center. All documents were produced in non-scannable form.
4.1.2 Distribution of Materials
Pearson was responsible for bar coding, spiraling, bundling, and shipping materials to
Westat field staff. Due to security issues, every assessment booklet was given a unique bar code label. Once bar coded, they were then spiraled into bundles of 19 booklets. Each bundle contained a header

18
sheet that listed the barcodes assigned to each of the booklets for a particular spiral and was then shrink-wrapped and ready for distribution.
Two bundles were assigned to each school and the materials were packaged and sent to their
appropriate supervisor. Extra materials such as calculators, timers and packing materials were also included for each supervisor.
For the fall data collection effort, materials for 91 additional schools and 40 bulk-material
shipments were assembled in July and sent directly to Westat to forward to the appropriate staff.
4.2 Field Staff Organization
The organization of field staff followed closely the guidelines presented in the international PISA manuals. While these guidelines allow some flexibility in procedures to meet the needs of local school systems in each country, only minor adjustments to international protocols were necessary in this instance.
Westat employed four Field Managers and 86 Field Supervisors nationwide to support the spring data collection efforts. Thirty-nine Supervisors were held over for additional work on the fall data collection. Field Supervisors were assigned to one of the four Field Managers who coordinated and monitored the work of the Field Supervisors. The latter assumed all the responsibilities assigned internationally to test administrators who, in most countries, are school personnel. In the U.S. the administration of national assessments tends to be assigned to local Field Supervisors employed by the surveying agency in order to reduce burden on schools and ensure the confidentiality of data. All Field Supervisors reported directly to their Field Manager on a daily basis.
Consistent with international guidelines, each school in the study was asked to appoint a
School Coordinator as the primary contact for Westat field staff. In the U.S., however, School Coordinator responsibilities were reduced to a subset of those specified internationally, since many tasks were assigned to Westat staff for reasons noted above. The international version of the School Coordinator Manual was simplified and presented as a brochure describing the responsibilities of both the school and the School Coordinator. Copies of this brochure were distributed to School Coordinators once

19
appointed and a toll-free number was provided as a reference point for questions or concerns about their responsibilities.
4.2.1 Recruiting, Hiring and Training Supervisors
The 86 Field Supervisors were hired from a pool of experienced Westat field personnel to
undertake the spring data collection, with a subset of continuing through to the PISA fall collection. Most supervisors had worked on other educational assessments requiring adherence to strict policies of confidentiality and conduct. Before they were employed, the supervisors were fingerprinted and subjected to background checks the results of which are kept on file at Westat. For the 2003 data collection, each supervisor signed a statement of nondisclosure indicating that they would maintain confidentiality of all survey materials and of the data collected.
Training of the PISA supervisors provided an overview of the project, a discussion of the
study materials, and instruction on gaining cooperation, procedures for the pre-assessment call to the school. Practical exercises dealt with preparation of the booklets, conducting the assessment, and post-assessment activities.
4.2.2 Conduct of the Assessment
The field supervisors administered the assessment according to the instructions set forth in the international PISA Test Administrator Manual. Supervisors distributed the assessment booklets, matching the student with the preassigned booklet type according to the preprinted Student Tracking Form. The assessments were administered in two 60 minute parts. Students were given 30 minutes to complete the Student Questionnaire, with an additional 10 minutes if necessary.
4.2.3 Results of Telephone Followup
To confirm the work of the PISA field supervisor and to obtain feedback from schools, the Westat field manager telephoned the school coordinator at 25 percent of participating schools several

20
days after the assessment. All school coordinators surveyed said that the assessment went very well or satisfactorily. When asked how well the PISA representative organized and executed tasks during the preassessment period, 97 percent of school coordinators said that these tasks had been handled very well or satisfactorily.
4.3 Sampling and Data Collection Forms
Most of the forms discussed in this section 5.3.1 through 5.3.8 are standard international forms developed by PISA for use in all countries. A few additional were created by Westat for use only in the United States. All forms are provided in appendix D.
4.3.1 School Cooperation Form
Completed through the school principal, the School Cooperation Form was used to record information gathered during the gaining cooperation phase of the study. It provides a progression of questions to be asked of the principal as well as bullets of study information to help with answering any questions the principal may have. This completed form was then maintained in the School Folder.
4.3.2 School Information Form
The School Information Form was developed for use in the United States to gather more detailed information about the participating school pertaining to the pending assessment. The Field Supervisor recorded School Contact (SC) replies to a series of questions provided in the form. Information on the responsibilities of the SC throughout the process, sampling, parental consent, and scheduling issues are covered in this form. The School Information Form was also maintained in the School Folder for the Supervisors’ reference.

21
4.3.3 Student Listing Form
The Student Listing Form (SLF) is the sheet provided to schools for listing all of the age-eligible students enrolled at the school. Explicit instructions and guidelines were provided and electronic submissions of student lists were encouraged. While the basis of the SLF is an international form, minor adaptations were made to the instructions to cover needs specific to the US data collection.
4.3.4 The Student Tracking Form
The Student Tracking Form remained unchanged from the international version and was output from the KeyQuest Software as required. All identification and sampling information was filled in by the KeyQuest program from data obtained through communications with the School Contact, and also from the list of eligible students provided by all participating schools. The remaining information was entered by the Field Supervisor to record exclusions and students with special education needs as well as the participation status for each of the other students.
4.3.5 Sampling Contingency Plan Form and Random Number Table
Provisions were made to allow a Field Supervisor to select a student sample onsite. The provisions included a Sampling Contingency Plan Form, a Random Number Table and detailed instructions. No need for this arose during the data collection period.
4.3.6 Instructions for Defining Students with Special Education Needs (SEN)
The Student Tracking Form contains a column (column 8) for indicating students with special education needs (SEN). Instructions to assist in defining students with a SEN were provided to each School Contact and Field Supervisors were available to assist in this process if needed. Students with intellectual or functional disabilities and students with Limited English Proficiency (LEP) needed to be coded in the Student Tracking Form, but were not to be automatically excluded from the assessment.

22
4.3.7 Instructions for Including/Excluding Students form
Column nine of the Student Tracking Form records information on each student’s inclusion/exclusion status. A student defined with a Special Education Need in column 8 was not automatically excluded from the assessment. An exclusion code was to be applied only if the SEN was to the degree that students were unable to perform in the PISA testing situation. The Instructions for Including/Excluding Students provided clear directions for applying the correct inclusion codes for each student listed on the Student Tracking Form.
4.3.8 Session Report Form
The Session Report Form is an international form used to capture information about each assessment session. The Field Supervisor completed most of this form during the session by recording session timing, student behavior, any disruptions that may have occurred during the session, and by providing any information on specific assessment booklet or questionnaire items that may have been problematic.
4.4 Coding, Scoring, and Data Processing
Pearson was responsible for the printing and distribution of materials to the field and the receipt and processing of completed booklets and session materials after testing. After materials were received, three data entry systems were used to transcribe data to computerized form: key entry, optical mark recognition (OMR), and image scanning. These systems captured the demographic data, multiple-choice responses, and scores from short-answer and extended responses allowing the data to be arranged in format that conformed to the PISA codebook specifications. This data was edited for its consistency and to correct any formatting errors.
4.4.1 Data Marking and Scoring
Pearson trained markers to score the instruments for the United States using the marking guides, examples, and training materials provided by the Australian Council for Educational Research (ACER). Per agreement with ACER, 16 Math scorers (two teams) were hired. Each of the Math scorers

23
was trained on four different clusters and each team was reconfigured for the next training. This ensured that the scorers could be compared to all others in the whole pool rather than just the team. Books were scored by clusters (blocks). Twelve scorers were hired for the same two-week period for scoring of Reading, Science and Problem Solving. A 25% re-score for inter-rater reliability comparison was done during the course of all scoring.
Scorings were coded and scanned. During scanning, the scoring system identified any
missing marks, blank responses, or out-of-range marks on the score sheets. The score sheets were then run through the scanning system to check the system for errors. Inter-rater reliability reports were also produced form this system. Table 4-1 shows the range of item reliability percentages for Math, Science, Reading, and Problem Solving items.
After all scoring was completed approximately 100 books from book types one through six,
eight, ten and twelve selected for second scoring were re-scored for 3rd and 4th scoring. These scores were entered manually into the mainframe system rather than being scanned. The scoring plan for all subjects was specifically agreed to by ACER, NCES, and Pearson. Table 4-1. Number of items by reliability percentage, ranges, and subject: PISA 2003
Subject Number of Items
100% agreement
99- 90% agreement
89- 80% agreement
79 -70% agreement
Math 36 - 30 6 - Science 15 - 14 1 - Reading 21 3 18 - - Problem Solving 11 1 10 - -
SOURCE: Organization for Economic Cooperation and Development, Program for International Student Assessment (PISA) 2003.
Thirty of the math items had an agreement between 90 – 99 percent between the first and
second scores, while six items had 80 to 89 percent agreement. Fourteen of the science items had an agreement between 90 – 99 percent while one item had an agreement between 80 – 89 percent. Three of the reading items had 100 percent of the first and second scores match. Eighteen items had an agreement between 90 – 99 percent between the first and second scores. Of the problem solving items, one item had 100 percent agreement while the remaining 10 items had agreement of 90 -- 99 percent.

24
4.4.2 File Creation and Consistency Checks
After open-ended scoring was complete, a two digit score was assigned to each open-ended item. These scores were first checked against allowed values, corrected if necessary, and then merged with the demographic and key entered data. At this time, final output files were produced for each file type. The final files were checked by the Software Quality Specialists to ensure the data was in the correct format. In earlier editing functions, data was checked for completeness and compliance with Codebook specifications. Supplemental edit, logic, and linkage checks were conducted on the data files. The data files were then process through the ACER KeyQuest reports system. Data questions were reviewed and resolved, and data modifications were documented. The data files and edit reports were prepared and shipped to ACER in accordance with the specifications and timeline prescribed by ACER.

25
5. The PISA 2003 Data
The purpose of this chapter is to provide the user with an overview of the content of the PISA 2003 data and to make the user aware of considerations that need to be taken into account in analysis. It is highly recommended that the user refer first to the PISA 2003 Data Analysis Manual for detailed information on these analysis issues. That report is available for downloading at (http://www.pisa.oecd.org/document/18/0,2340,en_32252351_32236173_35016146_1_1_1_1,00.html). The international data may be downloaded from this same site. Detailed instructions for using the ECB and for accessing the PISA data from the CD-ROM may be found in the Quick Guide document on the CD-ROM and in the Help file of the ECB.
5.1 PISA 2003 Data Sets
The PISA database contains three data sets: the school questionnaire file (usa_schl.dat), the student questionnaire file (usa_stud.dat) and the assessment items file (usa_assesm.dat). The data are in ASCII format. Associated extract programs are included within the ECB to assist the user in reading the data to produce SAS data sets and SPSS system files. Since the data are hierarchical (students are clustered within schools) each student record contains identification variables that enable the user to merge the school data with the student data. The school data may be merged to the student data using the variable SCHOOLID.
The contents of the PISA 2003 files are described below:
usa_stud.dat. This file contains: student and school identification variables; student responses to the questionnaire; derived index scores; mathematics, science and reading performance scores; student sampling weights; and, (Fay) replicate weights. There are 5,456 cases in the student file.
usa_schl.dat. This file contains: the school identification variable; school responses to the school questionnaire; derived school index scores; and, the school sampling weight. There are 274 cases in the school file.
usa_assesm.dat. This file contains data on student responses to each item of the assessment. There 5,456 cases in the student assessment file.

26
5.2 The US National Data
The US national data contains variables of three kinds: international variables, that have an identical format across countries; adapted international variable, international variables which have relatively minor adaptations to suit US conditions and may not be exactly the same across countries; and, US variables, a small number of variables included as national options in the US data but not collected by other countries (e.g., race/ethnicity). All country-specific adaptations were approved by the International Study Center for comparability prior to the assessment. The full set of adaptations for the United States is contained in appendix C. US-only variables are identified by comments in the Comment field of the Electronic Codebook.
A few international items were not administered because either they were not applicable to
students and schools in the United States or they were deemed inappropriate to ask of students. A list of these items follows. Where a specific item was deleted the text of the item is given. Where an entire question with a range of items was deleted the question stem is given.
Student Questionnaire: ST01Q02: Which if the following programs are you in? ST17Q14 – ST17Q16: optional country specific items for home possessions ST23Q02: ISCED Level 3B or 3C ST25Q01 – ST25Q06: Which of the following are reasons why you attend this school? ST27Q01 – ST27Q06: My school is a place where: EC05Q01: Have you changed your study program since you started grade X? EC06Q01: Type of mathematics class (The US restructured this question in a way that was deemed not comparable with the international structure and meaning of the question. This variable became a US variable.) EC06Q02: National code for type of mathematics class EC07Q01: In your last school report, what was your mark in mathematics? (This question had two forms. EC07Q01 asked for a specific grade while EC07Q02 asked if the grade was above or below passing. The US used the latter version.)

27
School Questionnaire: SC07Q11—SC07Q14: How many instruction weeks are in the school year? SC07Q21—SC07Q24: How many hours in total are there in the school week? SC07Q31—SC07Q34: How many hours for instruction are there in the school week? The three item sets above asked principals to estimate hours for programs of study, which are not applicable to the US as defined internationally. The US asked these questions for the school as a whole, creating three US variables. SC10Q07: Specific country defined factor for school admittance Finally, there are some variables that are structured differently in the US data set. These are
SC26Q01—SC26Q12 and SC27Q01—SC27Q07 in the school questionnaire. These variables ask about decision making about various activities (hiring teachers, formulating school budgets, approving instructional content, etc.) and what groups or individuals (the principal, teachers, parents, school board etc.) have primary responsibility in decision making about them. They are defined as string variables in the international data set. In the US data, each string element is defined as an individual variable. See appendix C for the exact variable naming convention.
5.3 Accessing the US Data Through the Electronic Codebook
The ECB contains a feature that produces SAS and SPSS extract code to read in the data files and write out permanent SAS and SPSS data sets. Once the extract code is saved with the desired variables, the code can be run in SAS/SPSS to create a data set ready for analysis. Users will need to make some minor edits to the code prior to running it. The use of these extract files is explained in the Quick Guide document available on the CD-ROM and in the Help menu of the ECB under “Extracting Programs.”
5.4 Confidentiality of the US Data
Confidentiality analyses were conducted to provide reasonable assurance that the PISA 2003 public use data files will not allow identification of individual schools, teachers, or students when compared against public data collections. While no public data collections identify teachers or students by name, three publicly available data files identify schools by name. The National Center for Education Statistics (NCES) regularly publishes the Common Core of Data (CCD), a detailed public school listing,

28
and the Private School Survey (PSS), a detailed private school listing. Quality Education Data Inc. (QED), a private-owned educational research firm, also publishes a school-based file that provides demographic information for both public and private schools. There is a relatively remote possibility that some teachers and/or students in the PISA data files could be identified through comparisons with these public files. Providing a reasonable degree of assurance that PISA schools cannot be identified assures that teacher and student data also remain unidentifiable.
Users should be aware that schools or students in the U.S. PISA dataset cannot be identified.
Through a technique of probabilistic matching, schools considered problematic in this respects were identified and data masking procedures implemented to remove the risk of identification by systematic perturbation using both national and international variables.
5.5 Accessing Data from Other Countries
Currently, the international version of the PISA database may be downloaded, along with documentation explaining the structure and content of the database, at http://pisaweb.acer.edu.au/oecd_2003/oecd_pisa_data_s1.html. The international student and school data sets are large, single data sets containing all countries. Subsets of countries may be created or data from other countries may be combined with the US data set using merge procedures similar to those shown in Exhibits 5.1 and 5.2 and the examples contained in the PISA 2003 Data Analysis Manual (OECD 2005, Chapter 9) (http://www.pisa.oecd.org/document/18/0,2340,en_32252351_32236173_35016146_1_1_1_1,00.html).
5.6 Special Considerations in the Analysis of PISA 2003 Data
Three aspects of the design of PISA need careful attention in any analysis. The first stems from the sample design. Schools and students had unequal, but known, probabilities of selection. As a consequence, analyses will need to apply the sampling weights provided on the file in order to generalize to the population sampled. Most software packages make provision for weighting. A detailed description of the procedures used in developing the weights for PISA is provided in the PISA 2003 Technical Report (OECD, 2005, Chapter 8)

29
(http://www.pisa.oecd.org/document/13/0,2340,en_32252351_32236173_35188685_1_1_1_1,00.html) and in the PISA Data Analysis Manual (OECD, 2005, Chapters 2 and 3) (http://www.pisa.oecd.org/document/18/0,2340,en_32252351_32236173_35016146_1_1_1_1,00.html). The second aspect also stems from the sampling design and bears on the calculation of standard errors. Since the sample design is complex, most software packages, operating on the assumption of a simple random sample, will produce biased estimates of standard errors. Special procedures are called for and these are described in detail in the PISA 2003 Data Analysis Manual (OECD, 2005, Chapters 3 and 6). These procedures are implemented in several stand-alone software packages (WesVar, AM and SUDAAN, for example) and can also be implemented in SAS or SPSS using macros included in this package. Detailed descriptions of the macros and how to use them are provided in the PISA 2003 Data Analysis Manual (OECD, 2005, Chapter 15) (http://www.pisa.oecd.org/document/18/0,2340,en_32252351_32236173_35016146_1_1_1_1,00.html).
The third complexity arising from the design of the PISA assessment refers to the use of plausible values in analysis. In PISA, as in many national assessments, students do not take every assessment item. Each item then has missing student responses, though these are missing at random by design. As a consequence, students do not have a single test score but rather five plausible estimates of their test score known as plausible values. What this means in effect is that any analyses involving the achievement scores must be done five times, once for each plausible value, and the results averaged. A special provision also needs to be made in the estimation of the standard errors. These issues are described in PISA 2003 Data Analysis Manual (OECD, 2005, Chapters 5 and 7) (http://www.pisa.oecd.org/document/18/0,2340,en_32252351_32236173_35016146_1_1_1_1,00.html).
5.7 Analyzing School Data
The target population for PISA was 15-year-old students and the PISA school sample was designed to optimize the selection of these students. In these circumstances it is usually recommended that school data be disaggregated across students and school attributes treated as ‘student characteristics’ for the purposes of the analyses; see PISA 2003 Data Analysis Manual (OECD, 2005, Chapter 9). This disaggregation can be accomplished by merging the school-level data to the student file by schoolid and the resulting file analyzed at the student level using the student-level weight w_fstuwt.
30
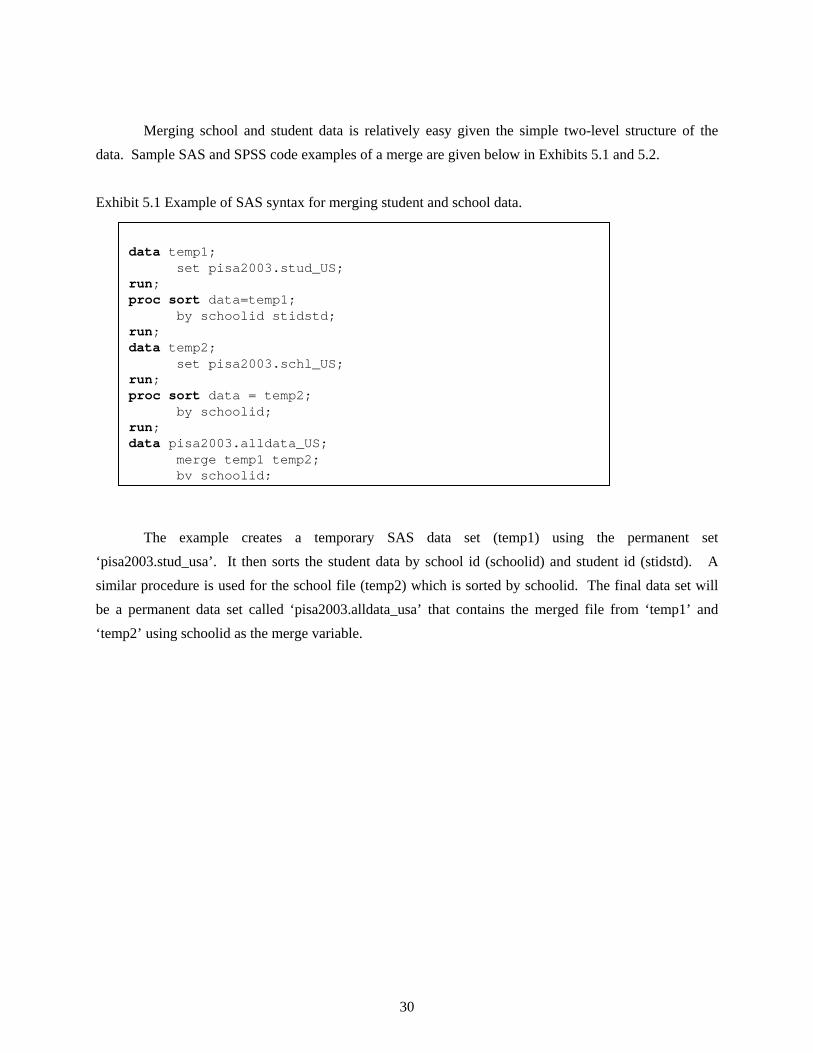
Merging school and student data is relatively easy given the simple two-level structure of the data. Sample SAS and SPSS code examples of a merge are given below in Exhibits 5.1 and 5.2. Exhibit 5.1 Example of SAS syntax for merging student and school data.
The example creates a temporary SAS data set (temp1) using the permanent set ‘pisa2003.stud_usa’. It then sorts the student data by school id (schoolid) and student id (stidstd). A similar procedure is used for the school file (temp2) which is sorted by schoolid. The final data set will be a permanent data set called ‘pisa2003.alldata_usa’ that contains the merged file from ‘temp1’ and ‘temp2’ using schoolid as the merge variable.
data temp1; set pisa2003.stud_US; run; proc sort data=temp1; by schoolid stidstd; run; data temp2; set pisa2003.schl_US; run; proc sort data = temp2; by schoolid; run; data pisa2003.alldata_US; merge temp1 temp2; by schoolid;

31
Exhibit 5.2 Example of SPSS syntax for merging student and school data: PISA 2003
The SPSS example works in a similar way to the SAS version in Exhibit 5.1. SPSS uses the file containing the school variables (usa_schl.sav) and concatenates the file using the string variable ‘subnatio’ then sorts the cases by ‘subnatio’ and ‘schoolid’. The file is then saved. The same procedure is used for the student data set, ‘usa_stud.sav’. The “match files” command merges the two files and the final, merged output file is saved as ‘usa_merge.sav’.
get file 'c:\pisa\data2003\usa_schl.sav'. string subnatio (a4). compute subnatio=concat(country,subnat). sort cases by subnatio schoolid. save outfile='c:\pisa\data2003\usa_schl.sav'. get file='c:\pisa\data2003\usa_stud.sav'. sort cases by subnatio schoolid. match files file=* /table='c:\pisa\data2003\usa_schl.sav' /by subnatio schoolid. Select if cnt='usa'. Save outfile='c:\pisa\data2003\usa_merge.sav'.

32
REFERENCES
Ferraro, D., Czuprynski J. and Williams, T. (2006). Program for International Student Assessment (PISA) 2003 Non-response Bias. (NCES 2006-025). U.S. Department of Education, National Center for Education Statistics. Washington, DC: U.S. Government Printing Office.
Appendix A
School and Student Questionnaires

PISA 2003
SCHOOL QUESTIONNAIRE
Project Consortium: Australian Council for Educational Research (ACER) Netherlands National Institute for Educational Measurement (CITO group) Educational Testing Service (ETS, USA) National Institute for Educational Policy Research (NIER, Japan) Westat (USA)
OMB LABEL

A-2
This questionnaire asks for information about: • The characteristics of the school; • The student body; • Teachers in the school; • Some of the pedagogical practices of the school, sometimes with
particular regard to mathematics; • The school’s resources; • Some of the administrative structures within the school.
This information may, for example, help to establish the impact of resource distribution on student achievements — both within and between countries. It may also help to establish the impact of different teaching strategies and practices on student achievement.
The questionnaire should be completed by the principal or designate.
It should take about 30 minutes to complete.
If you do not know an answer precisely, your best estimate will be adequate for the purposes of the study.
Your answers will be kept confidential. They will be combined with answers from other principals to calculate totals and averages in
which no one school can be identified.

A-3
Q1 Which of the following best describes the community in which your school is located?
(Please check only one box.)
A village, hamlet or rural area (fewer than 3,000 people) ..................... 1
A small town (3,000 to about 15,000 people) ........................................ 2
A town (15,000 to about 100,000 people) .............................................. 3
A city (100,000 to about 1,000,000 people) ........................................... 4
A large city with over 1,000,000 people ................................................ 5
Q2 As of March 1, 2003, what was the total school enrollment (number of students)?
(Please write a number in each row. Write 0 (zero) if there are none.)
a) Number of boys: _____________________
b) Number of girls: _____________________

A-4
Q3 Is your school a public or a private school?
(Please check only one box.)
A public school .......................................................................................
1
A private school ......................................................................................
2
Q4 About what percentage of your total funding for a typical school year comes from the following sources?
(Please write a number in each row. Write 0 (zero) if no funding comes from that source.)
%
a) Government (includes departments, local, regional, state and national) ........................................................................... ___________
b) Student fees or school charges paid by parents (e.g. fees paid for books, locker fees, field trips, etc.) ........................... ___________
c) Benefactors, donations, bequests, sponsorships, parent fund raising ............................................................................. ___________
d) Other ....................................................................................... ___________
Total 100%

A-5
Q5 Are the following grade levels found in your school?
(Please check one box on each row.)
Yes No
a) Kindergarten.............. 1 2
b) Grade 1 ...................... 1 2
c) Grade 2 ...................... 1 2
d) Grade 3 ...................... 1 2
e) Grade 4 ...................... 1 2
f) Grade 5 ...................... 1 2
g) Grade 6 ...................... 1 2
h) Grade 7 ...................... 1 2
i) Grade 8 ...................... 1 2
j) Grade 9 ...................... 1 2
k) Grade 10 .................... 1 2
l) Grade 11 .................... 1 2
m) Grade 12 .................... 1 2
n) Grade 13 .................... 1 2
o) Ungraded school........ 1 2

A-6
Q6 About what percentage of students in your school repeated a grade, at the middle/junior high school level (grades 7-9) and the high school level (grades 10-12), last academic year?
(Please write a number in each row. Write 0 (zero) if nobody repeated a grade. Check the not applicable box if the grade level does not appear in your school.)
% Not applicable
The approximate percentage of students repeating a grade at the middle or junior high school level (grades 7-9) in this school last year was: ........................................................................ ________
997 The approximate percentage of students repeating a grade at the high school level (grades 10-12) in this school last year was: ....................... ________
997
Q7 As of March 1, 2003, what percentage of students at this school were eligible for free or reduced price school lunches through the National School Lunch Program?
(Please write a number in each row. Write 0 (zero) if there are none.)
Percentage of students : ________________
Q8 How many instructional days are in the school year?
Number of instructional days : _________________________________
A-7
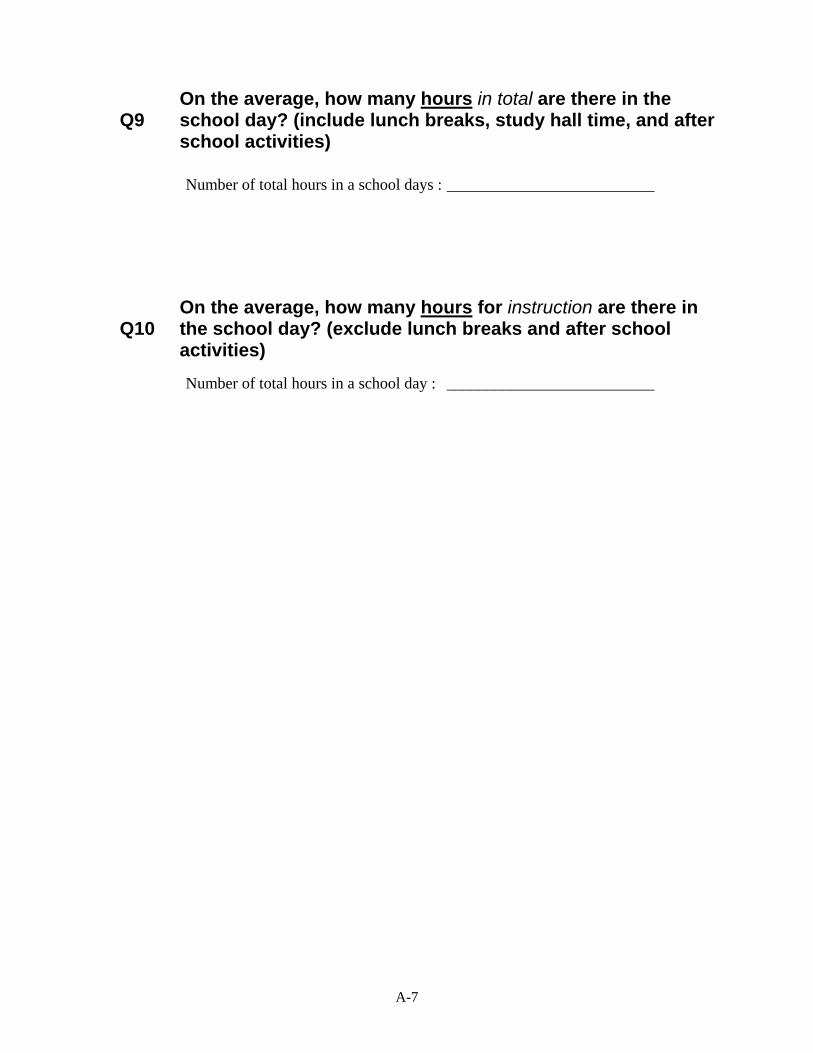
Q9 On the average, how many hours in total are there in the school day? (include lunch breaks, study hall time, and after school activities)
Number of total hours in a school days : __________________________
Q10 On the average, how many hours for instruction are there in the school day? (exclude lunch breaks and after school activities)
Number of total hours in a school day : __________________________

A-8
Q11 Is your school’s capacity to provide instruction hindered by a shortage or inadequacy of any of the following?
(Please check one box in each row.)
Not at all
Very little
To some extent A lot
a) Availability of qualified mathematics teachers ......................................................... 1 2 3 4
b) Availability of qualified science teachers .... 1 2 3 4
c) Availability of qualified English teachers .... 1 2 3 4
d) Availability of qualified foreign language teachers ......................................................... 1 2 3 4
e) Availability of experienced teachers ............ 1 2 3 4
f) Availability of substitute/replacement teachers ......................................................... 1 2 3 4
g) Availability of instructional support personnel (including technical or lab support) ......................................................... 1 2 3 4
h) Instructional materials (e.g. textbooks) ........ 1 2 3 4
i) Budget for supplies (e.g. paper, pencils) ...... 1 2 3 4
j) School buildings and grounds ...................... 1 2 3 4
k) Heating/cooling and lighting systems .......... 1 2 3 4
l) Instructional space (e.g. classrooms) ............ 1 2 3 4
m) Special equipment for disabled students ...... 1 2 3 4
n) Computers for instruction ............................. 1 2 3 4
o) Computer software for instruction ............... 1 2 3 4
A-9
Not at all
Very little
To some extent A lot
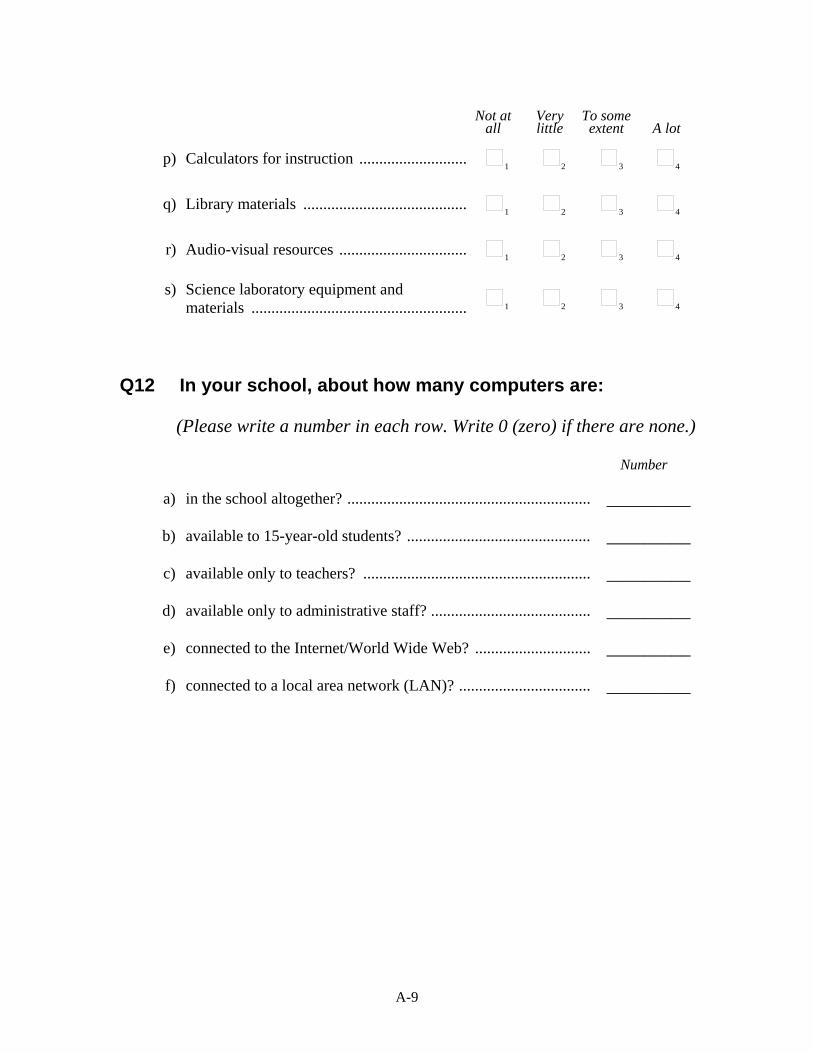
p) Calculators for instruction ............................ 1 2 3 4
q) Library materials .......................................... 1 2 3 4
r) Audio-visual resources ................................. 1 2 3 4
s) Science laboratory equipment and materials ....................................................... 1 2 3 4
Q12 In your school, about how many computers are:
(Please write a number in each row. Write 0 (zero) if there are none.)
Number
a) in the school altogether? ............................................................. _________
b) available to 15-year-old students? .............................................. _________
c) available only to teachers? ......................................................... _________
d) available only to administrative staff? ........................................ _________
e) connected to the Internet/World Wide Web? ............................. _________
f) connected to a local area network (LAN)? ................................. _________

A-10
Q13 How much consideration is given to the following factors when students are admitted to your school?
(Please check one box in each row.) Prerequisite
High priority Considered
Not considered
a) Residence in a particular area .... 1 2 3 4
b) Student’s academic record (including placement tests) ........ 1 2 3 4
c) Recommendation of feeder schools ....................................... 1 2 3 4
d) Parents’ endorsement of the instructional or religious philosophy of the school ............ 1 2 3 4
e) Student need or desire for a special program ......................... 1 2 3 4
f) Attendance of other family members at the school (past or present) ......................... 1 2 3 4

A-11
Q14 Think about the students in your school. How much do you agree with the following statements?
(Please check one box in each row.)
Strongly agree Agree Disagree
Strongly disagree
a) Students enjoy being in school. ..................... 1 2 3 4
b) Students work with enthusiasm. .................... 1 2 3 4
c) Students take pride in this school. .................1 2 3 4
d) Students value academic achievement. .........1 2 3 4
e) Students are cooperative and respectful. . ...... 1 2 3 4
f) Students value the education they can receive in this school. .............................. 1 2 3 4
g) Students do their best to learn as much as possible. ...................................... 1 2 3 4
Q15 Generally, in your school, how often are 15-year-old students assessed using:
(Please check only one box in each row.)
Never
1 – 2 times a
year
3 – 5 times a
year Monthly
More than
once a month
a) Standardized tests? ........................... 1 2 3 4 5
b) Teacher-developed tests? ................. 1 2 3 4 5
c) Teachers’ evaluations of students? ... 1 2 3 4 5
d) Student portfolios? ........................... 1 2 3 4 5
e) Student assignments/ projects/homework? ......................... 1 2 3 4 5

A-12
Q16 In your school, are assessments of 15-year-old students used for any of the following purposes?
(Please check only one box in each row.)
Yes No
a) To inform parents about their child’s progress. ......................... 1 2
b) To make decisions about students’ retention or promotion. ...... 1 2
c) To group students for instructional purposes. ............................ 1 2
d) To compare the school to national, state or district performance. ............................................................................... 1 2
e) To monitor the school’s progress from year to year. ................. 1 2
f) To make judgements about teachers’ effectiveness. ................... 1 2
g) To identify aspects of instruction or the curriculum that could be improved. .............................................................. 1 2
h) To compare the school with other schools. ................................ 1 2
Q17 About how many 15-year-old students in your school have a first language that is not English?
(Please check only one box.)
a) 40% or more ................................................. 1
b) 20% or more but less than 40% .................... 2
c) 10% or more but less than 20% .................... 3
d) Less than 10% .............................................. 4

A-13
Q18 Schools with students whose first language is not English sometimes offer specific language options to these students. Does your school offer any of the following options to 15-year-old students whose first language is not English?
(Please check one box in each row.)
No, not for any
languages Yes for one language
Yes for 2 or more
languages Not
applicable
a) Instruction in their native language is offered as a separate subject specifically for these students (e.g. Spanish language/literature for native Spanish speakers). ..................... 1 2 3 4
b) Instruction in their native language is offered as a separate subject for students who wish to learn the language (e.g. Spanish language/literature for students who want to learn or improve Spanish). ...................... 1 2 3 4
c) Instruction in other parts of the curriculum is offered in their language (e.g. mathematics course taught in Spanish). ....... 1 2 3 4

A-14
Q19 Schools sometimes organize instruction differently for students with different abilities and interests in mathematics. Which of the following options describe what your school does for 15-year-old students in mathematics?
(Please check one box in each row.)
For all classes
For some classes
For no classes
a) Mathematics classes study similar content, but at different levels of difficulty. ............... 1 2 3
b) Different classes study different content or sets of mathematics topics that have different levels of difficulty. ......................... 1 2 3
c) Students are grouped by ability within their mathematics classes. ............................ 1 2 3
d) Students are not grouped by ability in mathematics. ................................................. 1 2 3
Q20 In your school, do any of the following activities to promote engagement with mathematics occur?
(Please check one box in each row)
Yes No
a) Enrichment mathematics .............................. 1 2
b) Remedial mathematics ................................. 1 2
c) Mathematics competitions ............................ 1 2
d) Mathematics clubs ........................................ 1 2
e) Computer clubs (specifically related to mathematics) ................................................ 1 2

A-15
Q21 How many of the following are on the staff of your school?
Include both full-time and part-time teachers. A full-time teacher is employed at least 90% of the time as a teacher for the full school year. All other teachers should be considered part-time.
(Please write a number in each space provided. Write 0 (zero) if there is none.)
Full time
Part Time
a) Teachers in TOTAL ............................................................ ____ ____
b) Teachers with a regular or standard state certificate or advanced professional certificate ......................................... ____ ____
c) Teachers with a probationary certificate (the initial certificate issued after satisfying all requirements except the completion of a probationary period.) ........................... ____ ____
d) Teachers with provisional or other type of certification given to persons who are still participating in what the state calls an “alternative certification program.” ................ ____ ____
e) Teachers with a temporary certificate (requires some additional college coursework and/or student teaching before regular certification can be obtained.)....................... ____ ____
f) Teachers with an emergency certificate or waiver (issued to persons with insufficient teacher preparation who must complete a regular certification program in order to continue teaching.) .............................................................. ____ ____

A-16
Q22 How many of the following are on the MATHEMATICS staff of your school?
Include both full-time and part-time teachers. A full-time teacher is employed at least 90% of the time as a teacher for the full school year. All other teachers should be considered part-time.
Please count only those teachers who have taught or will teach mathematics during the current school year.
(Please write a number in each space provided. Write 0 (zero) if there are none.)
Full time
Part Time
a) Teachers of mathematics in TOTAL ................................... ____ ____
b) Teachers of mathematics with a bachelor's or master's degree with a major in mathematics, mathematics education, statistics, physics, or engineering ...................... ____ ____
c) Teachers of mathematics with a bachelor's or master's degree but not a major in mathematics, mathematics education, statistics, physics, or engineering ....................... ____ ____
d) Teachers of mathematics with a bachelor's or master's degree in education .............................................................. ____ ____
e) Teachers of mathematics with an associate’s degree but not a bachelor’s or master’s degree ..................................... ____ ____
Q23 During the last year, have any of the following been used to monitor the practice of mathematics teachers at your school?
(Please check one box in each row.)
Yes No
a) Tests or assessments of student achievement .................................................. 1 2
b) Teacher peer review (of lesson plans, assessment instruments, lessons) .................. 1 2

A-17
c) Principal or senior staff observations of lessons .......................................................... 1 2
d) Observation of classes by inspectors or other persons external to the school ............. 1 2
Q24 How much do you agree with these statements about innovation in your school?
(Please check one box in each row.) Strongly
agree Agree Disagree Strongly disagree
a) Mathematics teachers are interested in trying new methods and teaching practices. ....................................................... 1 2 3 4
b) There is a preference among mathematics teachers to stay with well-known methods and practices. ................................................ 1 2 3 4
c) There are frequent disagreements between ‘innovative’ and ‘traditional’ mathematics teachers. ........................................................ 1 2 3 4
Q25 How much do you agree with these statements about teachers’ expectations in your school?
(Please check one box in each row.) Strongly
agree Agree Disagree Strongly disagree
a) There is consensus among mathematics teachers that academic achievement must be kept as high as possible. .......................... 1 2 3 4
b) There is consensus among mathematics teachers that it is best to adapt academic standards to the students’ level and needs. ... 1 2 3 4
c) There are frequent disagreements between mathematics teachers who consider each other to be ‘too demanding’ or ‘too lax’. ..... 1 2 3 4
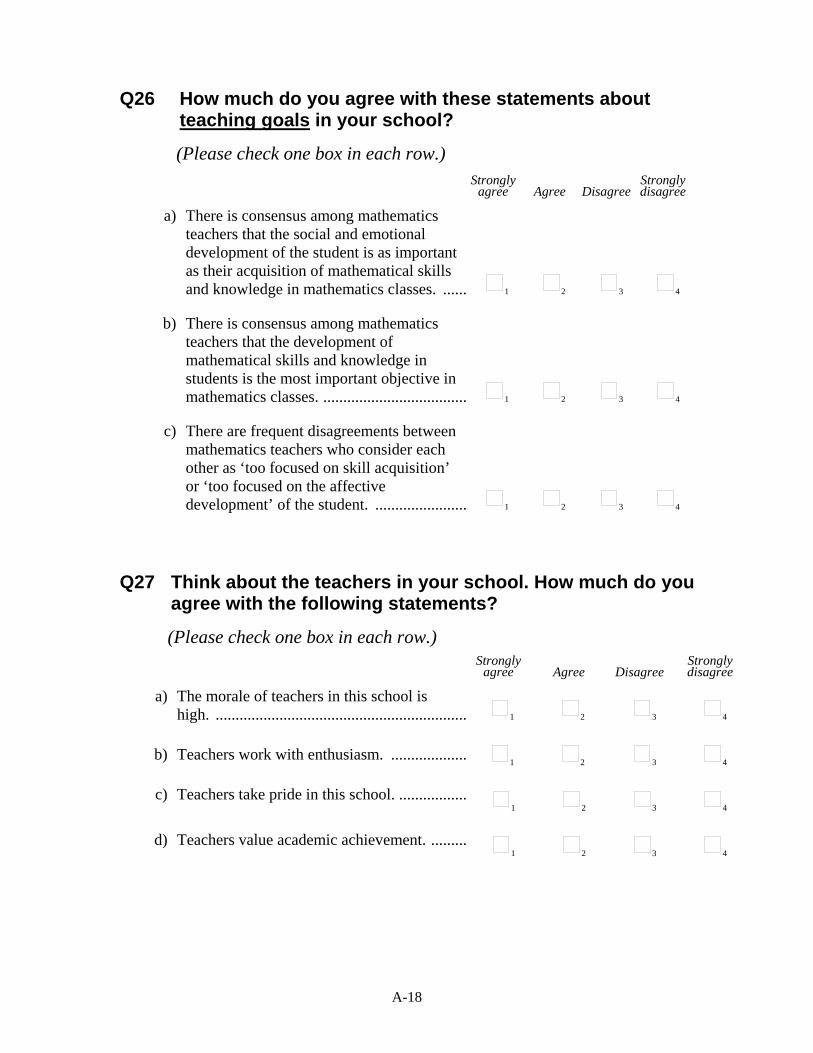
A-18
Q26 How much do you agree with these statements about teaching goals in your school?
(Please check one box in each row.) Strongly
agree Agree Disagree Strongly disagree
a) There is consensus among mathematics teachers that the social and emotional development of the student is as important as their acquisition of mathematical skills and knowledge in mathematics classes. ....... 1 2 3 4
b) There is consensus among mathematics teachers that the development of mathematical skills and knowledge in students is the most important objective in mathematics classes. ..................................... 1 2 3 4
c) There are frequent disagreements between mathematics teachers who consider each other as ‘too focused on skill acquisition’ or ‘too focused on the affective development’ of the student. ........................ 1 2 3 4
Q27 Think about the teachers in your school. How much do you agree with the following statements?
(Please check one box in each row.)
Strongly agree Agree Disagree
Strongly disagree
a) The morale of teachers in this school is high. ............................................................... 1 2 3 4
b) Teachers work with enthusiasm. ................... 1 2 3 4
c) Teachers take pride in this school. .................1 2 3 4
d) Teachers value academic achievement. .........1 2 3 4

A-19
Q28 In your school, to what extent is the learning of students hindered by:
(Please check one box in each row.)
Not at all
Very little
To some extent
A lot
a) teachers’ low expectations of students? ............................... 1 2 3 4
b) student absenteeism? ........................................................... 1 2 3 4
c) poor student-teacher relations? ............................................1 2 3 4
d) disruption of classes by students? ........................................1 2 3 4
e) teachers not meeting individual students’ needs? ................1 2 3 4
f) teacher absenteeism? ........................................................... 1 2 3 4
g) students skipping classes? ................................................... 1 2 3 4
h) students lacking respect for teachers? ................................. 1 2 3 4
i) staff resisting change? ......................................................... 1 2 3 4
j) student use of alcohol or illegal drugs? ............................... 1 2 3 4
k) teachers being too strict with students? ............................... 1 2 3 4
l) students intimidating or bullying other students? ................ 1 2 3 4
m) students not being encouraged to achieve their full potential? ............................................................................. 1 2 3 4

A-20
Q29 In your school, who has the main responsibility for:
(Please check as many boxes as appropriate in each row.) Not a main
responsibility of the school
Appointed or elected
school board Principal Department
Head Teacher(s)
a) hiring teachers? ...........1 1 1 1 1
b) firing teachers? ...........1 1 1 1 1
c) establishing teachers’ starting salaries? ......... 1 1 1 1 1
d) determining teachers’ salary increases? ......... 1 1 1 1 1
e) formulating the school budget? ............ 1 1 1 1 1
f) deciding on budget allocations within the school? .................. 1 1 1 1 1
g) establishing student disciplinary policies? .. 1 1 1 1 1
h) establishing student assessment policies? ... 1 1 1 1 1
i) approving students for admittance to the school? .............. 1 1 1 1 1
j) choosing which textbooks are used? ..... 1 1 1 1 1
k) determining course content? ...................... 1 1 1 1 1
l) deciding which courses are offered? .... 1 1 1 1 1

A-21
Q30 In your school, which of the following bodies exert a direct influence on decision making about staffing, budgeting, instructional content and assessment practices?
(Please check as many boxes as apply.) Area of influence:
Staffing Budgeting
Instructional content
Assessment practices
a) Local, state or national education authorities (e.g. Department of Education). ..... 1 1 1 1
b) Appointed or elected school board....................................... 1 1 1 1
c) Employers .............................. 1 1 1 1
d) Parent groups ......................... 1 1 1 1
e) Teacher groups (e.g. Staff Association, curriculum committees, union) ..................................... 1 1 1 1
f) Student groups (e.g. Student Association, youth organization) ................ 1 1 1 1
g) External examination boards .................................... 1 1 1 1
Thank you for completing this questionnaire.

Student Questionnaire Page 22
PISA 2003
STUDENT QUESTIONNAIRE
STOP PLEASE DO NOT TURN THE PAGE
UNTIL INSTRUCTED TO DO SO.
OECD Program for International Student Assessment 2003
A-23
In this booklet you will find questions about: • You and your family (Sections A and B). • Your education (Section C). • Your school (Section D). • Learning mathematics (Section E). • Your mathematics classes (Section F). • Your experience at school (Section G). • Information communication technology (Section H).
Please read each question carefully and answer as accurately as you can. In the test you usually circled your answers. For this questionnaire, you will normally answer by checking a box. For a few questions you will need to write a short answer.
If you make a mistake when checking a box, cross out your error and mark the correct box. If you make an error when writing an answer, simply cross it out and write the correct answer next to it.
In this questionnaire, there are no ‘right’ or ‘wrong’ answers. Your answers should be the ones that are ‘right’ for you.
You may ask for help if you do not understand something or are not sure how to answer a question.
Your answers will be combined with others to make totals and averages in which no individual can be identified. All your answers will be kept confidential.

A-24
Section A: About You
Q1a What grade are you in?
________
grade
Q2 On what date were you born?
(Please write the day, month and year you were born.)
_________ _____ 198 ___ Month Day Year
Q3a Are you female or male?
Female Male
1 2
Q3b Which best describes you?
(Please check one box only.) a) I am Hispanic or Latino. ................................ 1
b) I am not Hispanic or Latino........................... 2

A-25
Q3c
Which of these categories best indicate your race?
(Check all that apply.)
a) White .............................................................1
b) Black or African American............................ 2
c) Asian .............................................................. 3
d) American Indian or Alaska Native................4
e) Native Hawaiian or other Pacific Islander .... 5
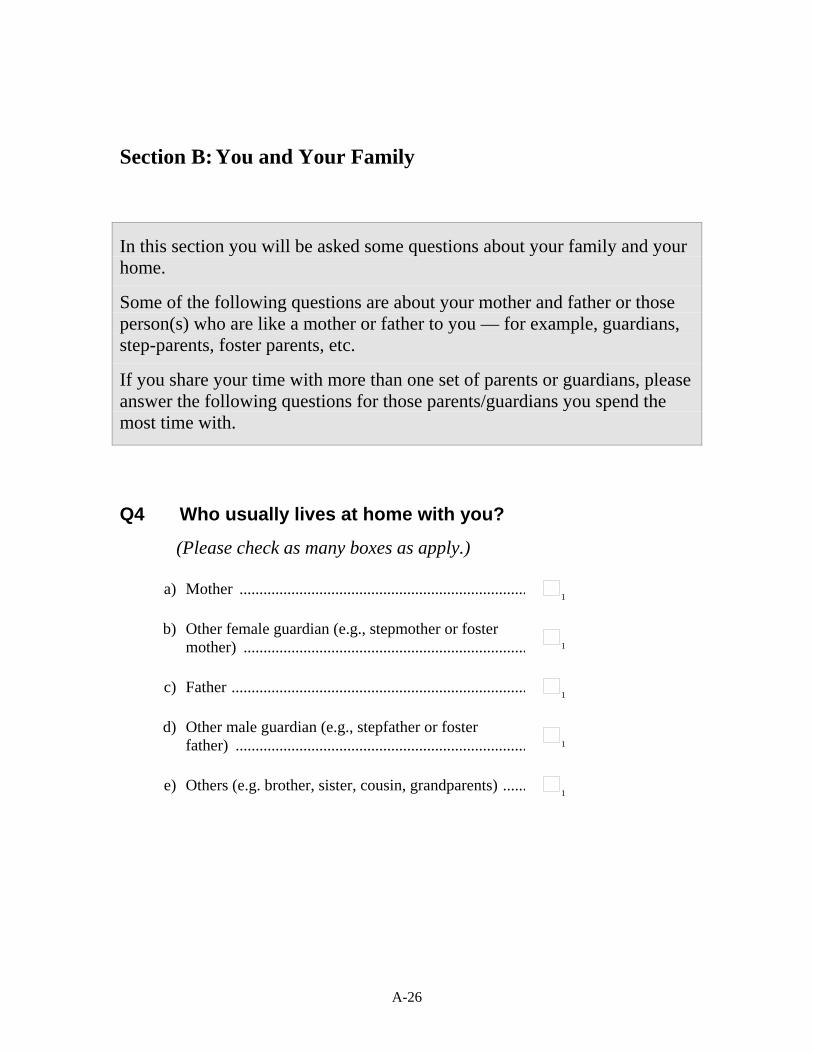
A-26
Section B: You and Your Family
In this section you will be asked some questions about your family and your home.
Some of the following questions are about your mother and father or those person(s) who are like a mother or father to you — for example, guardians, step-parents, foster parents, etc.
If you share your time with more than one set of parents or guardians, please answer the following questions for those parents/guardians you spend the most time with.
Q4 Who usually lives at home with you?
(Please check as many boxes as apply.)
a) Mother ........................................................................ 1
b) Other female guardian (e.g., stepmother or foster mother) ....................................................................... 1
c) Father .......................................................................... 1
d) Other male guardian (e.g., stepfather or foster father) ......................................................................... 1
e) Others (e.g. brother, sister, cousin, grandparents) ...... 1

A-27
Q5 What is your mother currently doing?
(Please check only one box.)
a) Working full-time for pay ............................ 1
b) Working part-time for pay ............................ 2
c) Not working, but looking for a job ............... 3
d) Other (e.g. home duties, retired) ................... 4
Q6 What is your father currently doing?
(Please check only one box.)
a) Working full-time for pay ............................ 1
b) Working part-time for pay ............................ 2
c) Not working, but looking for a job ............... 3
d) Other (e.g. home duties, retired) ................... 4

A-28
Q7 What is your mother’s main job? (e.g., school teacher, nurse, sales manager)
(If she is not working now, please tell us her last main job.)
Please write in the job title. _________________________________
Q8 What does your mother do in her main job? (e.g., teaches high school students, cares for patients, manages a sales team)
Please use a sentence to describe the kind of work she does or did in that job.
________________________________________________________
Q9 What is your father’s main job? (e.g., school teacher, carpenter, sales manager)
(If he is not working now, please tell us his last main job.)
Please write in the job title. _________________________________
Q10 What does your father do in his main job? (e.g., teaches high school students, builds houses, manages a sales team)
Please use a sentence to describe the kind of work he does or did in that job.
________________________________________________________
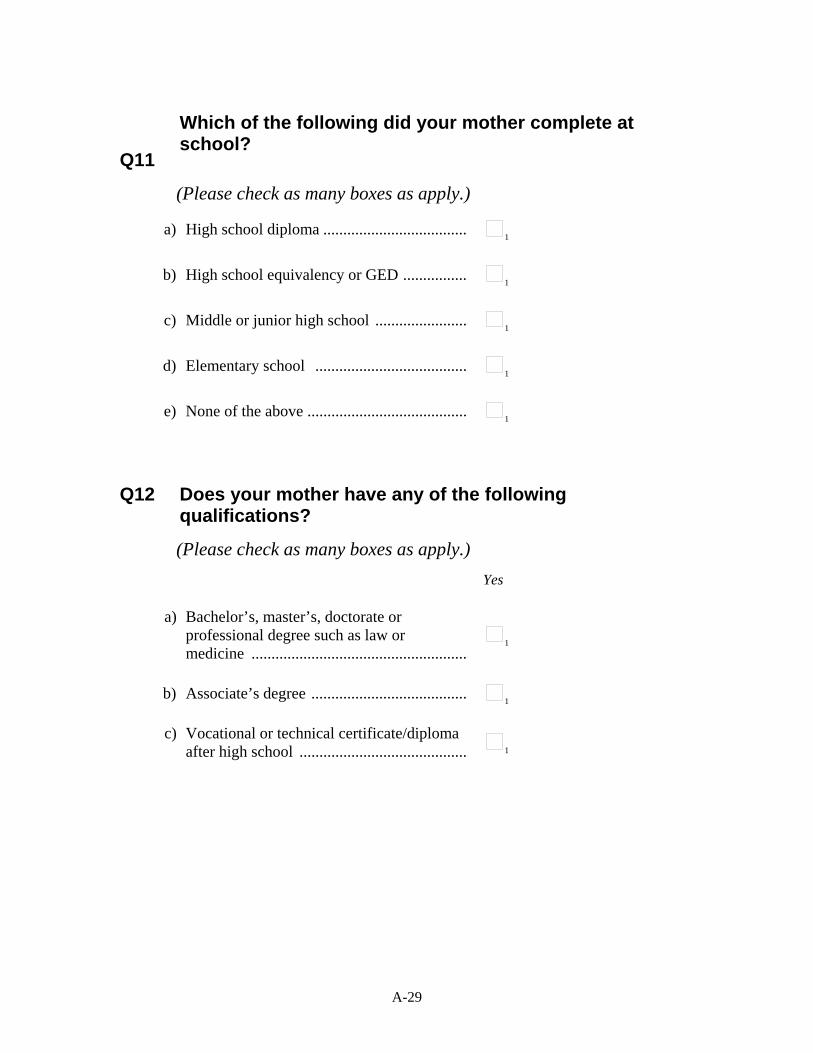
A-29
Q11
Which of the following did your mother complete at school?
(Please check as many boxes as apply.)
a) High school diploma ..................................... 1
b) High school equivalency or GED ................. 1
c) Middle or junior high school ........................ 1
d) Elementary school ....................................... 1
e) None of the above ......................................... 1
Q12 Does your mother have any of the following qualifications?
(Please check as many boxes as apply.)
Yes
a) Bachelor’s, master’s, doctorate or professional degree such as law or medicine .......................................................
1
b) Associate’s degree ........................................ 1
c) Vocational or technical certificate/diploma after high school ........................................... 1

A-30
Q13 Which of the following did your father complete at school?
(Please check as many boxes as apply.)
a) High school diploma .................................... 1
b) High school equivalency or GED ................. 1
c) Middle or junior high school ........................ 1
d) Elementary school 1
e) None of the above ......................................... 1
Q14 Does your father have any of the following qualifications?
(Please check as many boxes as apply.)
Yes
a) Bachelor’s, master’s, doctorate or professional degree such as law or medicine ........................................................
1
b) Associate’s degree......................................... 1
c) Vocational or technical certificate/diploma after high school ............................................ 1

A-31
Q15a In what country were you and your parents born?
(Please check one answer per column.)
You Mother Father
United States* ......................... 01 01 01
Other country .......................... 02 02 02
Q15b If you were NOT born in the United States*, how old were you when you arrived in the United States*?
(If you were less than 12 months old, please write zero (0).)
_________ Years *NOTE: ‘United States’ includes the 50 states and U.S. military bases abroad.
Q16 What language do you speak at home most of the time?
(Please check only one box.)
English........................................................... 01
Spanish ......................................................... 02
Other language ............................................. 03

A-32
Q17 Which of the following do you have in your home?
(Please check as many boxes as apply.)
Yes
a) A desk to study at ......................................... 1
b) A room of your own ..................................... 1
c) A quiet place to study ................................... 1
d) A computer you can use for school work ..... 1
e) Educational software .................................... 1
f) A link to the Internet .................................... 1
g) Your own calculator ..................................... 1
h) Classic literature (e.g., Shakespeare, Jane Austen, Mark Twain) ................................... 1
i) Books of poetry ............................................ 1
j) Works of art (e.g., paintings) ........................ 1
k) Books to help with your school work ........... 1
l) A dictionary .................................................. 1
m) A dishwasher ................................................ 1

A-33
Q18 How many of these do you have at your home?
(Please check only one box in each row.)
None One Two Three or
more
a) Cellular phone .......................................1 2 3 4
b) Television ..............................................1 2 3 4
c) Computer ...............................................1 2 3 4
d) Car .........................................................1 2 3 4
e) Bathroom ...............................................1 2 3 4
Q19 How many books are there in your home?
There are usually about 40 books per yard of shelving. Do not include magazines, newspapers, or your schoolbooks.
(Please check only one box.)
0-10 books ............................................. 1
11-25 books ........................................... 2
26-100 books ......................................... 3
101-200 books ....................................... 4
201-500 books ....................................... 5

A-34
More than 500 books ............................. 6
Section C: Your Education
Q20 Did you attend kindergarten?
No .................................................... 1
Yes, for one year or less .................. 2
Yes, for more than one year ............ 3
Q21 How old were you when you started elementary school?
Years
Q22 Have you ever repeated a grade?
(Please check only one box on each row.)
No, never Yes, once Yes, twice or
more
a) In elementary school ........ 1 2 3
b) In middle or junior high school................................. 1 2 3
c) In high school ................... 1 2 3

A-35
Q23 Which of the following do you expect to complete?
(Please check as many as apply.)
a) Middle or junior high school ........................ 1
b) High school.................................................... 1
c) Vocational or technical certificate after high school (such as cosmetology or auto mechanics) ....................................................
1
d) Associate’s degree......................................... 1
e) Bachelor’s degree or higher .......................... 1
Q24 Thinking about what you have learned in school: To what extent do you agree with the following statements?
(Please check only one box on each row.) Strongly
agree Agree Disagree Strongly disagree
a) School has done little to prepare me for adult life when I leave school. ..................... 1 2 3 4
b) School has been a waste of time. ................. 1 2 3 4
c) School has helped give me confidence to make decisions. ............................................ 1 2 3 4
d) School has taught me things which could be useful in a job. ......................................... 1 2 3 4

A-36
Section D: Your School
Q25 Thinking about the teachers at your school: To what extent do you agree with the following statements?
(Please check only one box in each row.) Strongly
agree Agree Disagree Strongly disagree
a) Students get along well with most teachers. ........................................................ 1 2 3 4
b) Most teachers are interested in students’ well-being. .................................................... 1 2 3 4
c) Most of my teachers really listen to what I have to say. ................................................... 1 2 3 4
d) If I need extra help, I will receive it from my teachers. .................................................. 1 2 3 4
e) Most of my teachers treat me fairly. ............. 1 2 3 4
Q26 In the last two full weeks you were in school, how many times did you arrive late for school?
(Please check only one box)
None ............................................................. 1
One or two times .......................................... 2
Three or four times ....................................... 3
Five or more times ........................................ 4

A-37
The following question asks about the time you spend studying and doing different kinds of homework outside of your regular classes. This should include all of your studying and homework.
Q27 On average, how many hours do you spend each week on the following?
When answering include time on the weekend too.
a) Homework or other study assigned by your teachers........................................................................ _____ hours per week
b) Remedial classes at school ......................................... _____ hours per week
c) Enrichment classes at school ...................................... _____ hours per week
d) Working with a tutor ................................................. _____ hours per week
e) Attending out-of-school classes ................................. _____ hours per week
f) Other study ................................................................. _____ hours per week

A-38
Section E: Learning Mathematics
Q28 Thinking about your views on mathematics: To what extent do you agree with the following statements?
(Please check only one box in each row.) Strongly
agree Agree Disagree Strongly disagree
a) I enjoy reading about mathematics. ............. 1 2 3 4
b) Making an effort in mathematics is worth it because it will help me in the work that I want to do later on. .................................... 1 2 3 4
c) I look forward to my mathematics lessons. ...................................................................... 1 2 3 4
d) I do mathematics because I enjoy it. ........... 1 2 3 4
e) Learning mathematics is worthwhile for me because it will improve my career prospects. ..................................................... 1 2 3 4
f) I am interested in the things I learn in mathematics. ................................................ 1 2 3 4
g) Mathematics is an important subject for me because I need it for what I want to study later on. .............................................. 1 2 3 4
h) I will learn many things in mathematics that will help me get a job. .......................... 1 2 3 4
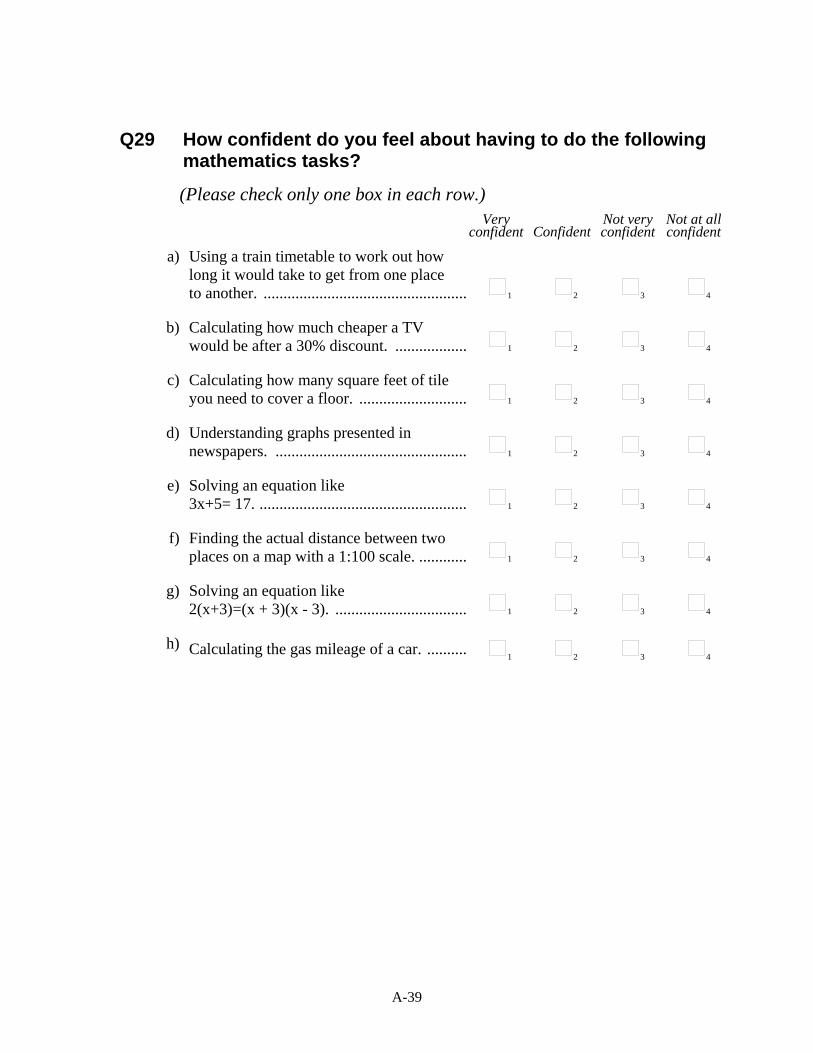
A-39
Q29 How confident do you feel about having to do the following mathematics tasks?
(Please check only one box in each row.)
Very confident Confident
Not very confident
Not at all confident
a) Using a train timetable to work out how long it would take to get from one place to another. ................................................... 1 2 3 4
b) Calculating how much cheaper a TV would be after a 30% discount. .................. 1 2 3 4
c) Calculating how many square feet of tile you need to cover a floor. ........................... 1 2 3 4
d) Understanding graphs presented in newspapers. ................................................ 1 2 3 4
e) Solving an equation like 3x+5= 17. .................................................... 1 2 3 4
f) Finding the actual distance between two places on a map with a 1:100 scale. ............ 1 2 3 4
g) Solving an equation like 2(x+3)=(x + 3)(x - 3). ................................. 1 2 3 4
h) Calculating the gas mileage of a car. .......... 1 2 3 4

A-40
Q30 Thinking about studying mathematics: To what extent do you agree with the following statements?
(Please check only one box in each row.) Strongly
agree Agree Disagree Strongly disagree
a) I often worry that it will be difficult for me in mathematics classes. .......................... 1 2 3 4
b) I am just not good at mathematics. .............. 1 2 3 4
c) I get very tense when I have to do mathematics homework. .............................. 1 2 3 4
d) I get good grades in mathematics. ............... 1 2 3 4
e) I get very nervous doing mathematics problems. ..................................................... 1 2 3 4
f) I learn mathematics quickly. ........................ 1 2 3 4
g) I have always believed that mathematics is one of my best subjects. ........................... 1 2 3 4
h) I feel helpless when doing a mathematics problem. ....................................................... 1 2 3 4
i) In my mathematics class, I understand even the most difficult work. ....................... 1 2 3 4
j) I worry that I will get poor grades in mathematics. ................................................ 1 2 3 4

A-41
The following question asks about the time you spend studying and doing mathematics homework outside of your regular Mathematics classes.
Q31 On average, how much time do you spend each week on the following?
When answering include time at the weekend too.
a) Homework or other study assigned by your mathematics teacher ................................................... _____ hours per week
b) Remedial classes in mathematics at school ................ _____ hours per week
c) Enrichment classes in mathematics at school ............. _____ hours per week
d) Working with a mathematics tutor ............................. _____ hours per week
e) Attending out-of-school mathematics classes ............ _____ hours per week
f) Other mathematics activities (e.g. mathematics competitions, mathematics club) ................................ _____ hours per week

A-42
Q32 There are different ways of studying mathematics. To what extent do you agree with the following statements?
(Please check only one box in each row.) Strongly
agree Agree Disagree Strongly disagree
a) When I study for a mathematics test, I try to figure out the most important parts to learn. ............................................................ 1 2 3 4
b) When I am solving mathematics problems, I often think of new ways to get the answer. ................................................... 1 2 3 4
c) When I study mathematics, I make myself check to see if I remember the work I have already done. ....................................... 1 2 3 4
d) When I study mathematics, I try to figure out which concepts I still have not understood properly. .................................... 1 2 3 4
e) I think about how the mathematics I have learned can be used in everyday life. ........... 1 2 3 4
f) I go over some problems in mathematics so often that I feel as if I could solve them in my sleep. .................................................. 1 2 3 4
g) When I study for mathematics, I learn as much as I can by heart. ................................ 1 2 3 4
h) I try to understand new concepts in mathematics by relating them to things I already know. ............................................... 1 2 3 4
i) In order to remember the method for solving a mathematics problem, I go through examples again and again. ............. 1 2 3 4
j) When I cannot understand something in mathematics, I always search for more information to clarify the problem. .............. 1 2 3 4

A-43
k) When I am solving a mathematics problem, I often think about how the solution might be applied to other interesting questions. ................................... 1 2 3 4
Strongly agree Agree Disagree
Strongly disagree
l) When I study mathematics, I start by figuring out exactly what I need to learn. .... 1 2 3 4
m) To learn mathematics, I try to remember every step in a procedure. ............................ 1 2 3 4
n) When learning mathematics, I try to relate the work to things I have learned in other subjects. ....................................................... 1 2 3 4

A-44
Section F: Your Mathematics Classes
The following question is about your mathematics classes: The class period is the length of time each lesson runs for on a normal day. Some classes may run for ‘double periods’, but the class period refers to the basic unit of time used to break up your day at school.
Q33a How many minutes, on average, are there in a class period?
Minutes in a class period: _________ minutes
Q33b In the last full week you were in school, how many class periods did you spend in mathematics?
Number of mathematics class periods: _________ class periods
Q33c In the last full week you were in school, how many class periods did you have in total?
Number of ALL class periods (including your mathematics classes): _________ class periods
Q34 On average, about how many students are in your mathematics class?
________ students

A-45
Q35 Thinking about your mathematics classes: To what extent do you agree with the following statements?
(Please check only one box in each row.) Strongly
agree Agree Disagree Strongly disagree
a) I would like to be the best in my class in mathematics. ................................................ 1 2 3 4
b) In mathematics I enjoy working with other students in groups. .............................. 1 2 3 4
c) I try very hard in mathematics because I want to do better on the exams than the others. .......................................................... 1 2 3 4
d) When we work on a project in mathematics, I think that it is a good idea to combine the ideas of all the students in a group. ........................................................ 1 2 3 4
e) I make a real effort in mathematics because I want to be one of the best. ........... 1 2 3 4
f) I do my best work in mathematics when I work with other students. ............................ 1 2 3 4
g) In mathematics I always try to do better than the other students in my class. ............. 1 2 3 4
h) In mathematics, I enjoy helping others to work well in a group. ................................... 1 2 3 4
i) In mathematics I learn most when I work with other students in my class. .................. 1 2 3 4
j) I do my best work in mathematics when I try to do better than others. .......................... 1 2 3 4
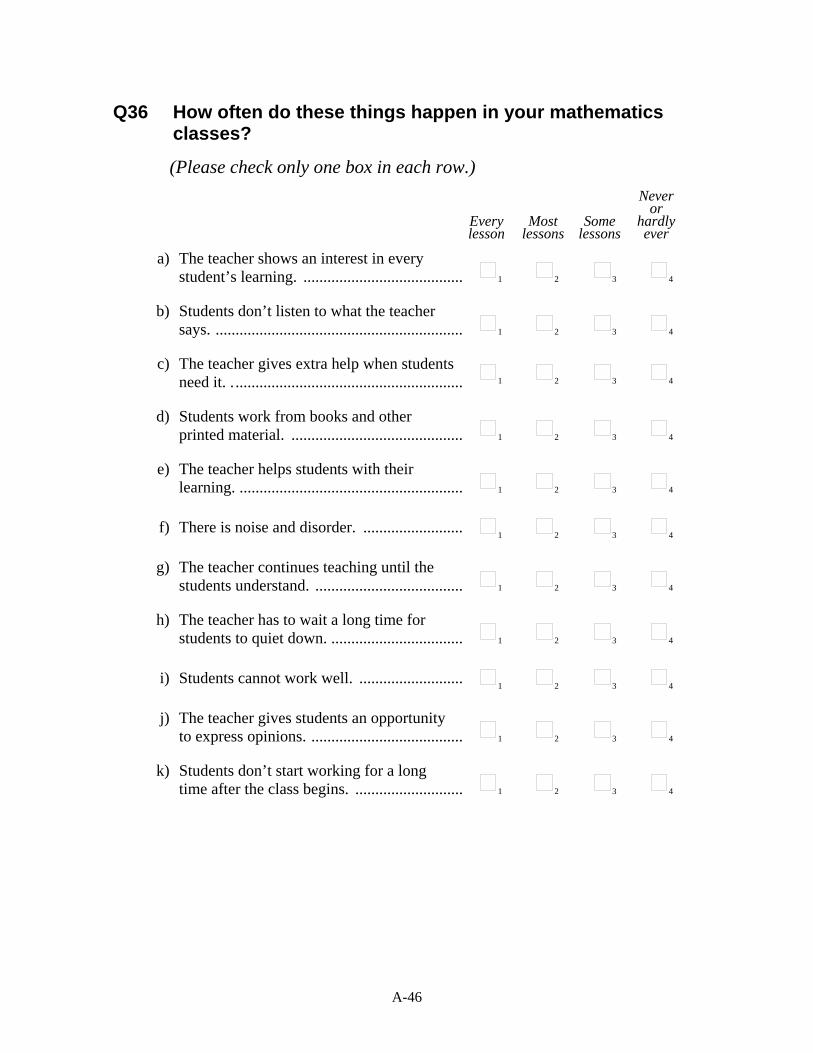
A-46
Q36 How often do these things happen in your mathematics classes?
(Please check only one box in each row.)
Every lesson
Most lessons
Some lessons
Never or
hardly ever
a) The teacher shows an interest in every student’s learning. ........................................ 1 2 3 4
b) Students don’t listen to what the teacher says. .............................................................. 1 2 3 4
c) The teacher gives extra help when students need it. . ......................................................... 1 2 3 4
d) Students work from books and other printed material. ........................................... 1 2 3 4
e) The teacher helps students with their learning. ........................................................ 1 2 3 4
f) There is noise and disorder. ......................... 1 2 3 4
g) The teacher continues teaching until the students understand. ..................................... 1 2 3 4
h) The teacher has to wait a long time for students to quiet down. ................................. 1 2 3 4
i) Students cannot work well. .......................... 1 2 3 4
j) The teacher gives students an opportunity to express opinions. ...................................... 1 2 3 4
k) Students don’t start working for a long time after the class begins. ........................... 1 2 3 4

A-47
Section G: Your experience at school
Q37 Did you ever miss two or more consecutive months of elementary school?
(Please check only one box.)
No, never ........................... 1
Yes, once ........................... 2
Yes, twice or more ............ 3
Q38 Did you ever miss two or more consecutive months of middle or junior high school?
(Please check only one box.)
No, never ........................... 1
Yes, once ........................... 2
Yes, twice or more ............ 3
Q39 Did you change schools when you were attending elementary school?
(Please check only one box.) No, I attended all of elementary school at the same school. .................................................................................. 1
Yes, I changed schools once. ............................................... 2
Yes, I changed schools twice or more. ................................. 3

A-48
Q40 Did you change schools when you were attending middle or junior high school?
(Please check only one box.) No, I attended all of middle/junior high school at the same school. ......................................................................... 1
Yes, I changed schools once. ............................................... 2
Yes, I changed schools twice or more. ................................. 3
Q41 What type of mathematics class are you taking?
(Please check only one box.) Pre-algebra or general mathematics ...................... 1
Algebra I ............................. 2
Geometry ............................ 3
Algebra II............................ 4
Precalculus or calculus ....... 5
Other .................................. 6
Q42 In your last school report, how did your grade in mathematics compare with the passing grade?
(Please check only one box.)
At or above the passing grade ...................... 1
Below the passing grade .............................. 2

A-49
Q43 What kind of job do you expect to have when you are about 30 years old?
Write the job title. ___________________________________

A-50
SECTION H: INFORMATION COMMUNICATION TECHNOLOGY
The following questions ask about computers: This does not include calculators or game consoles like a Sony PlayStation™.
Q44 Is there a computer available for you to use at any of these places?
(Please check one box on each row.)
Yes No
a) At home ........................................................ 1 2
b) At school ...................................................... 1 2
c) At other places ............................................. 1 2
Q45 Have you ever used a computer?
Yes No
1 2
If you use a computer in any setting, please continue.
If you do not, PLEASE STOP HERE.
Q46 How long have you been using computers?
(Please check only one box.)
Less than one year. ..................1
One to three years. ..................2
Three to five years. ..................3
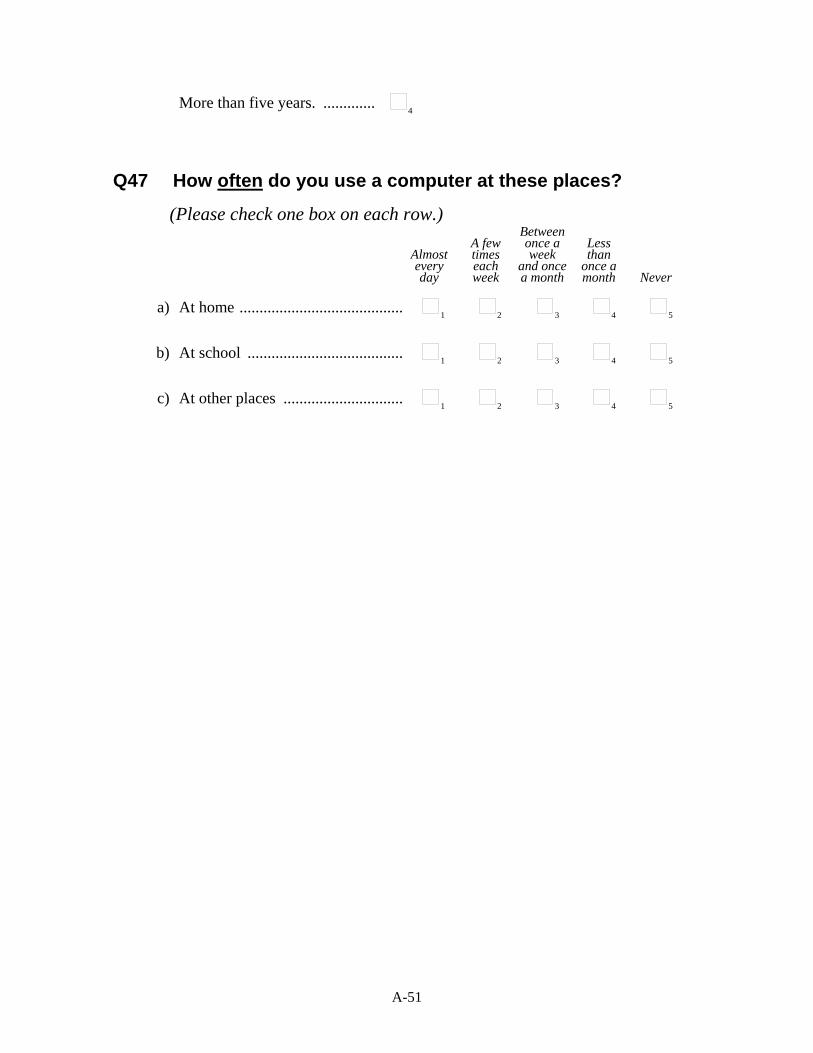
A-51
More than five years. ..............4
Q47 How often do you use a computer at these places?
(Please check one box on each row.)
Almost every day
A few times each week
Between once a week
and once a month
Less than
once a month Never
a) At home .......................................... 1 2 3 4 5
b) At school ........................................ 1 2 3 4 5
c) At other places ............................... 1 2 3 4 5
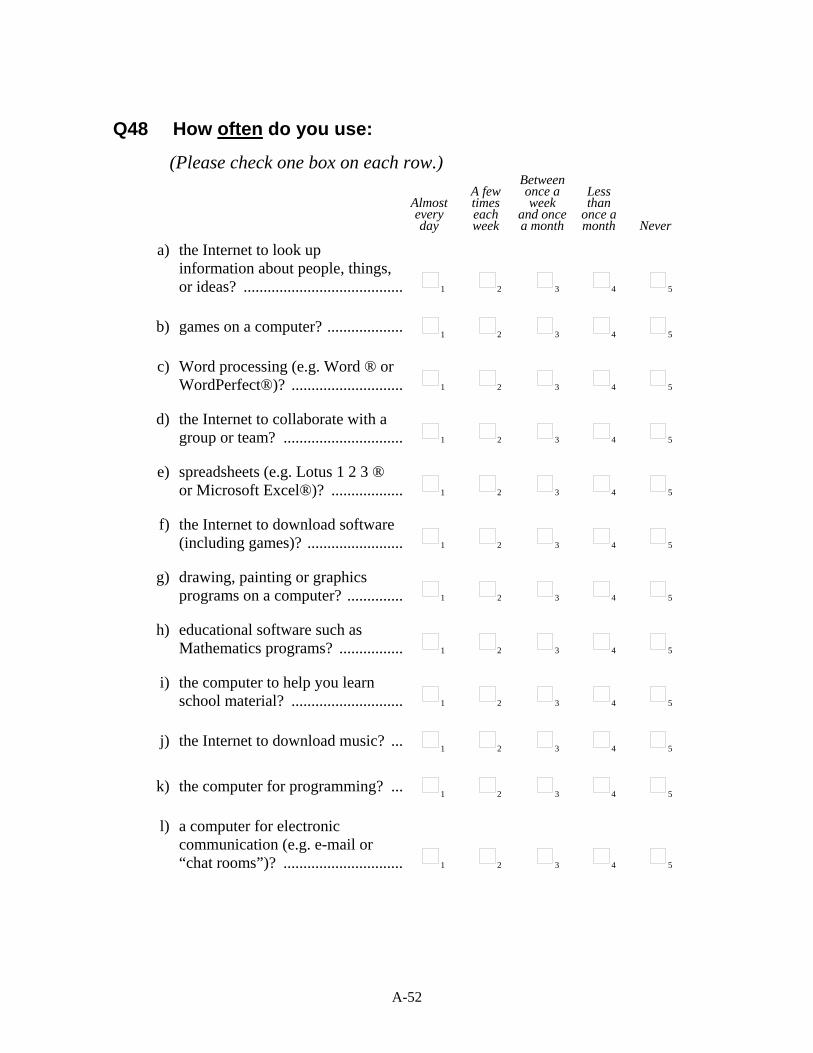
A-52
Q48 How often do you use:
(Please check one box on each row.)
Almost every day
A few times each week
Between once a week
and once a month
Less than
once a month Never
a) the Internet to look up information about people, things, or ideas? ......................................... 1 2 3 4 5
b) games on a computer? .................... 1 2 3 4 5
c) Word processing (e.g. Word ® or WordPerfect®)? ............................. 1 2 3 4 5
d) the Internet to collaborate with a group or team? ............................... 1 2 3 4 5
e) spreadsheets (e.g. Lotus 1 2 3 ® or Microsoft Excel®)? ................... 1 2 3 4 5
f) the Internet to download software (including games)? ......................... 1 2 3 4 5
g) drawing, painting or graphics programs on a computer? ............... 1 2 3 4 5
h) educational software such as Mathematics programs? ................. 1 2 3 4 5
i) the computer to help you learn school material? ............................. 1 2 3 4 5
j) the Internet to download music? .... 1 2 3 4 5
k) the computer for programming? .... 1 2 3 4 5
l) a computer for electronic communication (e.g. e-mail or “chat rooms”)? ............................... 1 2 3 4 5

A-53
Q49 How well can you do each of these tasks on a computer?
(Please check one box on each row.)
I can do this very well by myself.
I can do this with help from someone.
I know what this means but I cannot
do it.
I don’t know
what this means.
a) Start a computer game. ........................... 1 2 3 4
b) Use software to find and get rid of computer viruses. ................................... 1 2 3 4
c) Open a file. ............................................. 1 2 3 4
d) Create/edit a document. .......................... 1 2 3 4
e) Scroll a document up and down a screen. .................................................... 1 2 3 4
f) Use a database to produce a list of addresses. ............................................... 1 2 3 4
g) Copy a file from a floppy disk. .............. 1 2 3 4
h) Save a computer document or file. ......... 1 2 3 4
i) Print a computer document or file. ......... 1 2 3 4
j) Delete a computer document or file. ...... 1 2 3 4
k) Move files from one place to another on a computer. ........................................ 1 2 3 4
l) Get on to the Internet. ............................ 1 2 3 4
m) Copy or download files from the Internet. .................................................. 1 2 3 4
n) Attach a file to an e-mail message. ........ 1 2 3 4
o) Create a computer program (e.g. in Logo, Pascal, Basic). .............................. 1 2 3 4

A-54
p) Use a spreadsheet to plot a graph. .......... 1 2 3 4
q) Create a presentation (e.g. using PowerPoint). ........................................... 1 2 3 4
I can do this very well by myself.
I can do this with help from someone.
I know what this means but I cannot
do it.
I don’t know
what this means.
r) Play computer games. ............................ 1 2 3 4
s) Download music from the Internet. ....... 1 2 3 4
t) Create a multi-media presentation (with sound, pictures, video). ................ 1 2 3 4
u) Draw pictures using a mouse. ................ 1 2 3 4
v) Write and send e-mails. .......................... 1 2 3 4
w) Construct a web page. ............................ 1 2 3 4
Q50 Thinking about your experience with computers: To what extent do you agree with the following statements?
(Please check one box on each row.) Strongly
agree Agree Disagree Strongly disagree
a) It is very important to me to work with a computer. ...................................................... 1 2 3 4
b) I think playing or working with a computer is really fun. ................................. 1 2 3 4
c) I use a computer because I am very interested in computers. ................................ 1 2 3 4
d) I lose track of time when I am working with the computer. ........................................ 1 2 3 4

A-55
Q51 Who taught you most about how to use COMPUTERS?
(Please check only one box.)
My school. .................................................... 1
My friends. ................................................... 2
My family. .................................................... 3
I taught myself. ............................................ 4
Others. .......................................................... 5
Q52 Who taught you most about how to use the INTERNET?
(Please check only one box.)
I don’t know how to use the Internet. .......... 1
My school. .................................................... 2
My friends. ................................................... 3
My family. .................................................... 4
I taught myself. ............................................ 5
Others. .......................................................... 6
Thank you for completing this questionnaire.

Appendix B
U.S. Adaptations to the PISA 2003 Student and School Questionnaires

B-1
Appendix C. PISA 2003 U.S. Student and School Questionnaires
Question number_Int International text
Response code_Int Label_Int
Question number_USA U.S. text
Response code_USA Label_USA
Student QuestionnaireQ1a What <grade> are you in? ST01Q01 Q1
Q2 On what date were you born?a Day ST02Q01 b Day
b Month ST02Q02 a Month
c Year ST02Q03
Q3 Are you <female> or <male>? ST03Q01 Q3aFemale 1Male 2
Q3b Which best describes you? ST03N02
I am Hispanic or Latino 1I am not Hispanic or Latino 2
Q3c Which of these categories best indicates your race? ST03N03
White 1Black or African American 2Asian 3American Indian or Alaska Native 4Native Hawaiian or other Pacific Islander 5
Q11Which of the following did your mother complete at <school>?
a <ISCED level 3A> ST11Q01 high school diplomab <ISCED level 3B, 3C> ST11Q02 high school equivalency or GEDc <ISCED level 2> ST11Q03 middle or junior high schoold <ISCED level 1> ST11Q04 elementary schoole None of the above ST11Q05
Tick 1No tick 2
Q12Does your mother have any of the following qualifications?
a <ISCED 5A, 6> ST12Q01Bachelor's, master's , doctoral or professional degree such as law or medicine
b <ISCED 5B> ST12Q02 Associate's degree
c <ISCED 4> ST12Q03Vocational or technical certificate/diploma after high school
Tick 1No tick 2

B-2
Appendix C. PISA 2003 U.S. Student and School Questionnaires (continued)
Q13Which of the following did your father complete at <school>?
a <ISCED level 3A> ST13Q01 high school diplomab <ISCED level 3B, 3C> ST13Q02 high school equivalency or GEDc <ISCED level 2> ST13Q03 middle or junior high schoold <ISCED level 1> ST13Q04 elementary schoole None of the above ST13Q05
Tick 1No tick 2
Q14Does your father have any of the following qualifications?
a <ISCED 5A, 6> ST14Q01Bachelor's, master's , doctoral or professional degree such as law or medicine
b <ISCED 5B> ST14Q02 Associate's degree
c <ISCED 4> ST14Q03Vocational or technical certificate/diploma after high school
Tick 1No tick 2
Q15a In what country were you and your parents born?a You ST15Q01
b Mother ST15Q02
c Father ST15Q03
<Country of test> 01 United States 01<Country A> 02 DELETED<Country B> 03 DELETED<Country C> 04 DELETEDOther country 05 Other country 02
Q15bIf you were NOT born in <country of test>, how old were you when you arrived in <country of test>? ST15Q04
If you were NOT born in <the United States>, how old were you when you arrived in <the United States>?
Q16What language do you speak at home most of the time? ST16Q01
<Test language> 01 English 01<Other official national languages> 02 DELETED
<Other national dialects or languages> 03DELETED
<Other language 1> 04 Spanish 02<Other language 2> 05 DELETED<Other language 3> 06 DELETEDOther languages 07 Other 03

B-3
Appendix C. PISA 2003 U.S. Student and School Questionnaires (continued)
Q17 Which of the following do you have in your home?a A desk to study at ST17Q01
b A room of your own ST17Q02
c A quiet place to study ST17Q03
d A computer you can use for school work ST17Q04
e Educational software ST17Q05
f A link to the Internet ST17Q06
g Your own calculator ST17Q07
h Classic literature (e.g., <Shakespeare>) ST17Q08
I Books of poetry ST17Q09
j Works of art (e.g., paintings) ST17Q10
k Books to help with your school work ST17Q11
l A dictionary ST17Q12
m A dishwasher ST17Q13
n <Country-specific item 1> ST17Q14 DELETEDo < Country-specific item 2> ST17Q15 DELETEDp < Country-specific item 3> ST17Q16 DELETED
Tick 1No Tick 2
Q18 How many of these do you have at your home?a <Cellular> phone ST18Q01
b Television ST18Q02
c Computer ST18Q03
d Motor car ST18Q04 Care Bathroom ST18Q05
None 1One 2Two 3Three or more 4
Q20 Did you attend <ISCED 0>? ST20Q01 Did you attend <kindergarten>?No 1Yes, for one year or less 2Yes, for more than one year 3
Q21 How old were you when you started <ISCED 1>? ST21Q01How old were you when you started <elementary school>?
Q22 Have you ever repeated a <grade>?a At <ISCED 1> ST22Q01 In <elementary school>
b At <ISCED 2> ST22Q02 In <middle or junior high school>
c At <ISCED 3> ST22Q03 In <high school>
No, never 1Yes, once 2Yes, twice or more 3

B-4
Appendix C. PISA 2003 U.S. Student and School Questionnaires (continued)
Q23 Which of the following do you expect to complete?
a <ISCED level 2> ST23Q01 middle or junior high school
b <ISCED level 3B or C> ST23Q02
DELETED
c <ISCED level 3A> ST23Q03 High school
d <ISCED level 4> ST23Q04Vocational or technical certificate after high school (such as cosmetology or auto mechanics)
e <ISCED level 5B> ST23Q05 Associate's degreef <ISCED level 5A or 6> ST23Q06 Bachelor's degree or higher
Tick 1No tick 2
Q26Thinking about the teachers at your school: To what extent do you agree with the following statements? Q25
a Students get along well with most teachers. ST26Q01
b Most teachers are interested in students' well-being. ST26Q02
c Most of my teachers really listen to what I have to say. ST26Q03
d If I need extra help, I will receive it from my teachers. ST26Q04
e Most of my teachers treat me fairly. ST26Q05
Strongly agree 1Agree 2Disagree 3Strongly disagree 4
Q29On average, how many hours do you spend each week on the following? Q27
a Homework or other study set by your teachers ST29Q01 Homework or other study assigned by your teachers b <Remedial classes> at school ST29Q02
c <Enrichment classes> at school ST29Q03
d Working with a <tutor> ST29Q04
e Attending <out-of-school> classes ST29Q05
f Other study ST29Q06
Q30Thinking about your views on Mathematics: To what extent do you agree with the following statements? Q28
a I enjoy reading about Mathematics. ST30Q01
bMaking an effort in Mathematics is worth it because it will help me in the work that I want to do later on. ST30Q02
c I look forward to my Mathematics lessons. ST30Q03
d I do Mathematics because I enjoy it. ST30Q04
eLearning Mathematics is worthwhile for me because it will improve my career <prospects, chances>. ST30Q05
Learning mathematics is worthwhile for me because it will improve my career <prospects>.
f I am interested in the things I learn in Mathematics. ST30Q06

B-5
Appendix C. PISA 2003 U.S. Student and School Questionnaires (continued)
gMathematics is an important subject for me because I need it for what I want to study later on. ST30Q07
hI will learn many things in Mathematics that will help me get a job. ST30Q08
Strongly agree 1Agree 2Disagree 3Strongly disagree 4
Q31How confident do you feel about having to do the following Mathematics tasks? Q29
aUsing a <train timetable> to work out how long it would take to get from one place to another. ST31Q01
bCalculating how much cheaper a TV would be after a 30% discount. ST31Q02
cCalculating how many square metres of tiles you need to cover a floor. ST31Q03
Calculating how many square feet of tile you need to cover a floor.
d Understanding graphs presented in newspapers. ST31Q04
e Solving an equation like 3x+5= 17. ST31Q05
fFinding the actual distance between two places on a map with a 1:10,000 scale. ST31Q06
Finding the actual distance between two places on a map with a 1:100 scale.
g Solving an equation like 2(x+3)=(x + 3)(x - 3). ST31Q07
h Calculating the petrol consumption rate of a car. ST31Q08 Calculating the gas mileage of a car.
Very confident 1Confident 2Not very confident 3Not at all confident 4
Q32Thinking about studying Mathematics: To what extent do you agree with the following statements? Q30
aI often worry that it will be difficult for me in Mathematics classes. ST32Q01
b I am just not good at Mathematics. ST32Q02
cI get very tense when I have to do Mathematics homework. ST32Q03
d I get good <marks> in Mathematics. ST32Q04 I get good <grades> in Mathematics.
e I get very nervous doing Mathematics problems. ST32Q05
f I learn Mathematics quickly. ST32Q06
gI have always believed that Mathematics is one of my best subjects. ST32Q07
h I feel helpless when doing a Mathematics problem. ST32Q08
IIn my Mathematics class, I understand even the most difficult work. ST32Q09
j I worry that I will get poor <marks> in Mathematics. ST32Q10 I worry that I will get poor <grades> in Mathematics.
Strongly agree 1Agree 2Disagree 3Strongly disagree 4

B-6
Appendix C. PISA 2003 U.S. Student and School Questionnaires (continued)
Q33On average, how much time do you spend each week on the following? Q31
aHomework or other study set by your Mathematics teacher ST33Q01
Homework or other study assigned by your Mathematics teacher
b <Remedial classes> in Mathematics at school ST33Q02
c <Enrichment classes> in Mathematics at school ST33Q03
d Work with a <Mathematics tutor> ST33Q04 Working with a <Mathematics tutor>
e Attending <out-of-school> Mathematics classes ST33Q05
fOther Mathematics activities (e.g. <Mathematics competitions, Mathematics Club>) ST33Q06
Q34
There are different ways of studying Mathematics. To what extent do you agree with the following statements? Q32
aWhen I study for a Mathematics test, I try to work out what are the most important parts to learn. ST34Q01
When I study for a Mathematics test, I try to figure out what are the most important parts to learn.
bWhen I am solving Mathematics problems, I often think of new ways to get the answer. ST34Q02
cWhen I study Mathematics, I make myself check to see if I remember the work I have already done. ST34Q03
dWhen I study Mathematics, I try to figure out which concepts I still have not understood properly. ST34Q04
eI think how the Mathematics I have learnt can be used in everyday life. ST34Q05
I think how the Mathematics I have learned can be used in everyday life.
fI go over some problems in Mathematics so often that I feel as if I could solve them in my sleep. ST34Q06
gWhen I study for Mathematics, I learn as much as I can off by heart. ST34Q07
When I study for Mathematics, I learn as much as I can by heart.
hI try to understand new concepts in Mathematics by relating them to things I already know. ST34Q08
I
In order to remember the method for solving a Mathematics problem, I go through examples again and again. ST34Q09
jWhen I cannot understand something in Mathematics, I always search for more information to clarify the problem. ST34Q10
k
When I am solving a Mathematics problem, I often think about how the solution might be applied to other interesting questions. ST34Q11
lWhen I study Mathematics, I start by working out exactly what I need to learn. ST34Q12
When I study Mathematics, I start by figuring out exactly what I need to learn.
mTo learn Mathematics, I try to remember every step in a procedure. ST34Q13
nWhen learning Mathematics, I try to relate the work to things I have learnt in other subjects. ST34Q14
When learning Mathematics, I try to relate the work to things I have learned in other subjects.
Strongly agree 1Agree 2Disagree 3Strongly disagree 4

B-7
Appendix C. PISA 2003 U.S. Student and School Questionnaires (continued)
Q36On average, about how many students attend your <Mathematics> class? ST36Q01 Q34
On average, about how many students are in your <mathematics> class?
Q37Thinking about your <Mathematics> classes: To what extent do you agree with the following statements? Q35
a I would like to be the best in my class in Mathematics. ST37Q01
bIn Mathematics I enjoy working with other students in groups. ST37Q02
cI try very hard in Mathematics because I want to do better in the exams than the others. ST37Q03
I try very hard in Mathematics because I want to do better on the exams than the others.
d
When we work on a project in Mathematics, I think that it is a good idea to combine the ideas of all the students in a group. ST37Q04
eI make a real effort in Mathematics because I want to be one of the best. ST37Q05
fI do my best work in Mathematics when I work with other students. ST37Q06
gIn Mathematics I always try to do better than the other students in my class. ST37Q07
hIn Mathematics, I enjoy helping others to work well in a group. ST37Q08
IIn Mathematics I learn most when I work with other students in my class. ST37Q09
jI do my best work in Mathematics when I try to do better than others. ST37Q10
Strongly agree 1Agree 2Disagree 3Strongly disagree 4
Q38How often do these things happen in your <Mathematics> lessons? Q36
How often do these things happen in your <Mathematics> classes?
aThe teacher shows an interest in every student's learning. ST38Q01
b Students don't listen to what the teacher says. ST38Q02
c The teacher gives extra help when students need it. . ST38Q03
d Students work from books and other printed material. ST38Q04
e The teacher helps students with their learning. ST38Q05
f There is noise and disorder. ST38Q06
gThe teacher continues teaching until the students understand. ST38Q07
hThe teacher has to wait a long time for students to <quieten down>. ST38Q08
The teacher has to wait a long time for students to <quiet down>.
I Students cannot work well. ST38Q09
jThe teacher gives students an opportunity to express opinions. ST38Q10
kStudents don't start working for a long time after the lesson begins. ST38Q11
Students don't start working for a long time after the class begins.
Every lesson 1Most lessons 2Some lessons 3Never or hardly ever 4

B-8
Appendix C. PISA 2003 U.S. Student and School Questionnaires (continued)
Educational Career Questionnaire
Q1Did you ever miss two or more consecutive months of <ISCED 1>? EC01Q01 Q37
Did you ever miss two or more consecutive months of <elementary school>?
No, never 1Yes, once 2Yes, twice or more 3
Q2Did you ever miss two or more consecutive months of <ISCED 2> EC02Q01 Q38
Did you ever miss two or more consecutive months of <middle or junior high school>
No, never 1Yes, once 2Yes, twice or more 3
Q3Did you change schools when you were attending <ISCED 1>? EC03Q01 Q39
Did you change schools when you were attending <elementary school>?
No, I attended all of <ISCED 1> at the same school. 1No, I attended all of <elementary school> at the same school.
Yes, I changed schools once. 2Yes, I changed schools twice or more. 3
Q4Did you change schools when you were attending <ISCED 2>? EC04Q01 Q40
Did you change schools when you were attending <middle or junior high school>?
No, I attended all of <ISCED 2> at the same school. 1No, I attended all of <middle/junior high school> at the same school.
Yes, I changed schools once. 2Yes, I changed schools twice or more. 3
Q6 What type of <Mathematics class> are you taking? EC06Q01 Q41 EC06N01
<high level> 1 Pre-algebra or general mathematics 1<medium level> 2 Algebra I 2<basic level> 3 Geometry 3
Algebra II 4Precalculus or calculus 5Other 6
<Q7In your last school report, how did your <mark> in Mathematics compare with the <pass mark>? EC07Q02 Q42
In your last school report, how did your <grade> in Mathematics compare with the <passing grade>?
At or above the <pass mark> 1 At or above the <passing grade>
Below the <pass mark> 2 Below the <passing grade>
Information Communication Technology Questionnaire
Q5 How often do you use: Q48
athe Internet to look up information about people, things, or ideas? IC05Q01
b games on a computer? IC05Q02
c Word processing (e.g. <Word ® or WordPerfect®>)? IC05Q03

B-9
Appendix C. PISA 2003 U.S. Student and School Questionnaires (continued)
d the Internet to collaborate with a group or team? IC05Q04
espreadsheets (e.g. <Lotus 1 2 3 ® or Microsoft Excel®>)? IC05Q05
f the Internet to download software (including games)? IC05Q06
g drawing, painting or graphics programs on a computer? IC05Q07
h educational software such as Mathematics programs? IC05Q08
I the computer to help you learn school material? IC05Q09
j the Internet to down-load music? IC05Q10 the Internet to download music?
k the computer for programming? IC05Q11
la computer for electronic communication (e.g. e-mail or "chat rooms")? IC05Q12
Almost every day 1A few times each week 2Between once a week and once a month 3Less than once a month 4Never 5
Q6How well can you do each of these tasks on a computer? Q49
a Start a computer game. IC06Q01
b Use software to find and get rid of computer viruses. IC06Q02
c Open a file. IC06Q03
d Create/edit a document. IC06Q04
e Scroll a document up and down a screen. IC06Q05
f Use a database to produce a list of addresses. IC06Q06
g Copy a file from a floppy disk. IC06Q07
h Save a computer document or file. IC06Q08
I Print a computer document or file. IC06Q09
j Delete a computer document or file. IC06Q10
k Move files from one place to another on a computer. IC06Q11
l Get on to the Internet. IC06Q12
m Copy or download files from the Internet. IC06Q13
n Attach a file to an e-mail message. IC06Q14
oCreate a computer program (e.g. in <Logo, Pascal, Basic>). IC06Q15
p Use a spreadsheet to plot a graph. IC06Q16
q Create a presentation (e.g. using <PowerPoint>). IC06Q17
r Play computer games. IC06Q18
s Download music from the Internet. IC06Q19
tCreate a multi-media presentation (with sound, pictures, video). IC06Q20
u Draw pictures using a mouse. IC06Q21
v Write and send e-mails. IC06Q22 Write and send e-mails.
w Construct a web page. IC06Q23
I can do this very well by myself. 1I can do this with help from someone. 2I know what this means but I cannot do it. 3I don't know what this means. 4

B-10
Appendix C. PISA 2003 U.S. Student and School Questionnaires (continued)
Q7Thinking about your experience with computers: To what extent do you agree with the following statements? Q50
a It is very important to me to work with a computer. IC07Q01
b I think playing or working with a computer is really fun. IC07Q02
c I use a computer because I am very interested. IC07Q03I use a computer because I am very interested in computers.
d I lose track of time when I am working with the computer. IC07Q04
Strongly agree 1Agree 2Disagree 3Strongly disagree 4
School Questionnaire
Q2As at <March 31, 2003>, what was the total school enrolment (number of students)?
As of <March 1, 2003>, what was the total school enrollment (number of students)?
a Number of boys: SC02Q01
b Number of girls: SC02Q02
Q4
About what percentage of your total funding for a typical school year comes from the following sources?
aGovernment (includes departments, local, regional, state and national) SC04Q01
b Student fees or school charges paid by parents SC04Q02Student fees or school charges paid by parents (e.g. fees paid for books, locker fees, field trips, etc.)
cBenefactors, donations, bequests, sponsorships, parent fund raising SC04Q03
d Other SC04Q04
Q5Are the following <grade levels> found in your school?
a Kindergarten SC05N01
a <Grade 1> SC05Q01 b <Grade 1>
b <Grade 2> SC05Q02 c <Grade 2>
c <Grade 3> SC05Q03 d <Grade 3>
d <Grade 4> SC05Q04 e <Grade 4>
e <Grade 5> SC05Q05 f <Grade 5>
f <Grade 6> SC05Q06 g <Grade 6>
g <Grade 7> SC05Q07 h <Grade 7>
h <Grade 8> SC05Q08 i <Grade 8>
I <Grade 9> SC05Q09 j <Grade 9>
j <Grade 10> SC05Q10 k <Grade 10>
k <Grade 11> SC05Q11 l <Grade 11>
l <Grade 12> SC05Q12 m <Grade 12>
m <Grade 13> SC05Q13 n <Grade 13>
n <Ungraded school> SC05Q14 o <Ungraded school>
Yes 1No 2

B-11
Appendix C. PISA 2003 U.S. Student and School Questionnaires (continued)
Q6
About what percentage of students in your school repeated a <grade>, at these <ISCED levels>, last <academic> year?
About what percentage of students in your school repeated a <grade>, at the <middle/junior high school level (grades7-9) and high school level (grades 10-12)>, last <academic> year?
aThe approximate percentage of students repeating a <grade> at <ISCEDC 2> in this school last year was: SC06Q01
The approximate percentage of students repeating a <grade> at <middle/junior school level (grades 7-9> in this school last year was:
bThe approximate percentage of students repeating a <grade> at <ISCEDC 3> in this school last year was: SC06Q02
The approximate percentage of students repeating a <grade> at <the high school level (grades 10-12)> in this school last year was:
Q7
As of March 1, 2003, what percentage of students at this school were eligible for free or reduce price lunches through the National School Lunch Program? SC07N01
Q7 For each of these programmes in your school:Deleted stem and use a, b, and c as stand-alone questions
aHow many <instructional> weeks are in the school year? Q8
How many <instructional> days are in the school year? SC07N10
<prog 1> SC07Q11 DELETED
<prog 2> SC07Q12 DELETED
<prog 3> SC07Q13 DELETED
<prog 4> SC07Q14 DELETED
b
How many hours in total are there in the school week? (include lunch breaks, <study hall time>, and after school activities) Q9
How many hours in total are there in the school day? (include lunch breaks, <study hall time>, and after school activities) SC07N20
<prog 1> SC07Q21 DELETED
<prog 2> SC07Q22 DELETED
<prog 3> SC07Q23 DELETED
<prog 4> SC07Q24 DELETED
c
How many hours for <instruction> are there in the school week? (exclude lunch breaks and after school activities) Q10
How many hours for <instruction> are there in the school day? (exclude lunch breaks and after school activities) SC07N30
<prog 1> SC07Q31 DELETED
<prog 2> SC07Q32 DELETED
<prog 3> SC07Q33 DELETED
<prog 4> SC07Q34 DELETED
Q8
Is your school's capacity to provide instruction hindered by a shortage or inadequacy of any of the following? Q11
a Availability of qualified Mathematics teachers. SC08Q01
b Availability of qualified Science teachers. SC08Q02
c Availability of qualified <test language> teachers. SC08Q03
dAvailability of qualified <other national language> teachers. SC08Q04
e Availability of qualified foreign language teachers. SC08Q05
f Availability of experienced teachers. SC08Q06
g Availability of <emergency/replacement> teachers. SC08Q07 Availability of substitute/replacement teachers.
h Availability of support personnel. SC08Q08Availability of instructional support personnel (including technical or lab support).
I Instructional materials (e.g. textbooks). SC08Q09
j Budget for supplies (e.g. paper, pencils). SC08Q10

B-12
Appendix C. PISA 2003 U.S. Student and School Questionnaires (continued)
k School buildings and grounds. SC08Q11
l Heating/cooling and lighting systems. SC08Q12
m Instructional space (e.g. classrooms). SC08Q13
n Special equipment for disabled students. SC08Q14
o Computers for instruction. SC08Q15
p Computer software for instruction. SC08Q16
q Calculators for instruction. SC08Q17
r Library materials. SC08Q18
s Audio-visual resources. SC08Q19
t Science laboratory equipment and materials. SC08Q20
Not at all 1Very little 2To some extent 3A lot 4
Q10How much consideration is given to the following factors when students are admitted to your school? Q13
a Residence in a particular area. SC10Q01
b Student's academic record (including placement tests). SC10Q02
c Recommendation of feeder schools. SC10Q03
dParents' endorsement of the instructional or religious philosophy of the school. SC10Q04
e Student need or desire for a special programme. SC10Q05
fAttendance of other family members at the school (past or present). SC10Q06
g <Country specific factor>. SC10Q07 DELETEPrerequisite 1High priority 2Considered 3Not considered 4
Q12Generally, in your school, how often are <15-year-old> students assessed using: Q15
a standardised tests? SC12Q01
b teacher-developed tests? SC12Q02
c teachers' judgmental ratings? SC12Q03 teachers' evaluations of studentsd student <portfolios>? SC12Q04
e student assignments/projects/homework? SC12Q05
Never 11-2 times a year 23-5 times a year 3Monthly 4More than once a month 5
Q13In your school, are assessments of <15-year-old students> used forany of the following purposes? Q16
a To inform parents about their child's progress. SC13Q01
bTo make decisions about students' retention or promotion. SC13Q02
c To group students for instructional purposes. SC13Q03

B-13
Appendix C. PISA 2003 U.S. Student and School Questionnaires (continued)
dTo compare the school to <district or national> performance. SC13Q04
To compare the school to state, district or national performance.
e To monitor the school's progress from year to year. SC13Q05
f To make judgements about teachers' effectiveness. SC13Q06
gTo identify aspects of instruction or the curriculum that could be improved. SC13Q07
h To compare the school with other schools. SC13Q08
Yes 1No 2
Q14
About how many 15-year-old students in your school have a <first language> that is not <the test language>? SC14Q01 Q17
About how many 15-year-old students in your school have a <first language> that is not <English>?
40% or more 120% or more but less than 40% 210% or more but less than 20% 3Less than 10% 4
Q15
Schools with students whose <first language> is not <the test language> sometimes offer specific language options to these students. Does your school offer any of the following options to 15-year-old students whose <first language> is not <the test language>? Q18
Schools with students whose <first language> is not <English> sometimes offer specific language options to these students. Does your school offer any of the following options to 15-year-old students whose <first language> is not <English>?
aInstruction in their language is offered as a separate subject SC15Q01
instruction in their native language is offered as a separate subject specifically for these students (eg Spanish language/literature for native Spanish speakers)
instruction in their native language is offered as a separate subject for students who wish to learn the language (eg Spanish language/literature for students who want to learn or improve their Spanish)
SC15QN02
bInstruction in other parts of the curriculum is offered in their language SC15Q02
instruction in other parts of the curriculum is offered in their language (eg. mathematics course taught in Spanish)
No, not for any languages 1Yes for one language 2Yes for 2 or more languages 3Not applicable 4
Q16
Schools sometimes organise instruction differently for students with different abilities and interests in Mathematics. Which of the following options describe what your school does for 15-year-old students in Mathematics classes? Q19
aMathematics classes study similar content, but at different levels of difficulty. SC16Q01
bDifferent classes study different content or sets of Mathematics topics that have different levels of difficulty. SC16Q02

B-14
Appendix C. PISA 2003 U.S. Student and School Questionnaires (continued)
cStudents are grouped by ability within their Mathematics classes. SC16Q03
d
In mathematics classes, teachers use a pedagogy suitable for <students with heterogeneous abilities> (i.e. students are not grouped by ability). SC16Q04 Students are NOT grouped by ability in mathematics.
For all classes 1For some classes 2Not for any classes 3 For no classes
Q18How many of the following are on the staff of your school? Q21
a Teachers in TOTAL.Full time SC18Q11
Part time SC18Q21
bTeachers fully certified by <the appropriate authority>.
Teachers with a regular of standard state certificate or advanced professional certificate
Full time SC18Q12 Full time SC18N12
Part time SC18Q22 Part time SC18N22
cTeachers with an <ISCED5A> qualification in <pedagogy>.
Teachers with a probationary certificate (the initial certificate issued after satisfying all requirements except the completion of a probationary period).
Full time SC18Q13 Full time SC18N13
Part time SC18Q23 Part time SC18N23
d
Teachers with provisional or other type given to persons who are still participating in what the state calls an "alternative certification program."
Full time SC18N14
Part time SC18N24
e
Teachers with a temporary certificate (requires some additional college coursework and/or student teaching before regular certification can be obtained)Full time SC18N15
Part time SC18N25
f
Teachers with an emergency certificate or waiver (issued to persons with insufficient teacher preparation who must complete a regular certification program in order to continue teaching.)Full time SC18N16
Part time SC18N26
Q19How many of the following are on the <MATHEMATICS staff> of your school? Q22
a Teachers of Mathematics in TOTAL.Full time SC19Q11
Part time SC19Q21
bTeachers of Mathematics with an <ISCED5A> qualification <with a major> in Mathematics.
Teachers of Mathematics with an <bachelor's or master's degree> <with a major> in mathematics, mathematics education, statistics, physics, or engineering.
Full time SC19Q12 Full time
Part time SC19Q22 Part time

B-15
Appendix C. PISA 2003 U.S. Student and School Questionnaires (continued)
cTeachers of Mathematics with an <ISCED5A> qualification <but not a major> in Mathematics.
Teachers of Mathematics with an <bachelor's or master's degree> <but not a major> in mathematics, mathematics education, statistics, physics, or engineering.
Full time SC19Q13 Full time
Part time SC19Q23 Part time
dTeachers of Mathematics with an <ISCED5A> qualification in <pedagogy>.
Teachers of Mathematics with an <bachelor's or master's degree> in <education>.
Full time SC19Q14 Full time
Part time SC19Q24 Part time
eTeachers of Mathematics with an <ISCED5B> but not an <ISCED 5A> qualification.
Teachers of mathematics with an <associates's degree> but not an <bachelor's or master's degree>.
Full time SC19Q15 Full time
Part time SC19Q25 Part time
Q26 In your school, who has the main responsibility for: Q29a selecting teachers for hire? SC26Q01 hiring teachers?
Not a main responsibility of the school SC26Q01A
School's <governing board> Appointed or elected school board SC26Q01B
Principal SC26Q01C
<Department Head> SC26Q01D
Teacher(s) SC26Q01E
Tick 1No tick 2
b firing teachers? SC26Q02
Not a main responsibility of the school SC26Q02A
School's <governing board> Appointed or elected school board SC26Q02B
Principal SC26Q02C
<Department Head> SC26Q02D
Teacher(s) SC26Q02E
Tick 1No tick 2
c establishing teachers' starting salaries? SC26Q03
Not a main responsibility of the school SC26Q03A
School's <governing board> Appointed or elected school board SC26Q03B
Principal SC26Q03C
<Department Head> SC26Q03D
Teacher(s) SC26Q03E
Tick 1No tick 2
d determining teachers' salary increases? SC26Q04
Not a main responsibility of the school SC26Q04A
School's <governing board> Appointed or elected school board SC26Q04B
Principal SC26Q04C
<Department Head> SC26Q04D
Teacher(s) SC26Q04E
Tick 1No tick 2

B-16
Appendix C. PISA 2003 U.S. Student and School Questionnaires (continued)
e formulating the school budget? SC26Q05
Not a main responsibility of the school SC26Q05A
School's <governing board> Appointed or elected school board SC26Q05B
Principal SC26Q05C
<Department Head> SC26Q05D
Teacher(s) SC26Q05E
Tick 1No tick 2
f deciding on budget allocations within the school? SC26Q06
Not a main responsibility of the school SC26Q06A
School's <governing board> Appointed or elected school board SC26Q06B
Principal SC26Q06C
<Department Head> SC26Q06D
Teacher(s) SC26Q06E
Tick 1No tick 2
g establishing student disciplinary policies? SC26Q07
Not a main responsibility of the school SC26Q07A
School's <governing board> Appointed or elected school board SC26Q07B
Principal SC26Q07C
<Department Head> SC26Q07D
Teacher(s) SC26Q07E
Tick 1No tick 2
h establishing student assessment policies? SC26Q08
Not a main responsibility of the school SC26Q08A
School's <governing board> Appointed or elected school board SC26Q08B
Principal SC26Q08C
<Department Head> SC26Q08D
Teacher(s) SC26Q08E
Tick 1No tick 2
i approving students for admittance to the school? SC26Q09
Not a main responsibility of the school SC26Q09A
School's <governing board> Appointed or elected school board SC26Q09B
Principal SC26Q09C
<Department Head> SC26Q09D
Teacher(s) SC26Q09E
Tick 1No tick 2
j choosing which textbooks are used? SC26Q10
Not a main responsibility of the school SC26Q10A
School's <governing board> Appointed or elected school board SC26Q10B
Principal SC26Q10C

B-17
Appendix C. PISA 2003 U.S. Student and School Questionnaires (continued)
<Department Head> SC26Q10D
Teacher(s) SC26Q10E
Tick 1No tick 2
k determining course content? SC26Q11
Not a main responsibility of the school SC26Q11A
School's <governing board> Appointed or elected school board SC26Q11B
Principal SC26Q11C
<Department Head> SC26Q11D
Teacher(s) SC26Q11E
Tick 1No tick 2
l deciding which courses are offered? SC26Q12
Not a main responsibility of the school SC26Q12A
School's <governing board> Appointed or elected school board SC26Q12B
Principal SC26Q12C
<Department Head> SC26Q12D
Teacher(s) SC26Q12E
Tick 1No tick 2
Q27
In your school, which of the following <bodies> exert a direct influence on decision making about staffing, budgeting, instructional content and assessment practises? Q30
aRegional or national education authorities (e.g. inspectorates). SC27Q01
Local, state or national education authorities (e.g. Department of Education).
Staffing SC27Q01A
Budgeting SC27Q01B
Instructional content SC27Q01C
Assessment practises SC27Q01D
Tick 1No tick 2
b The school's <governing board>. SC27Q02 Appointed or elected school board
Staffing SC27Q02A
Budgeting SC27Q02B
Instructional content SC27Q02C
Assessment practises SC27Q02D
Tick 1No tick 2
c Employers. SC27Q03
Staffing SC27Q03A
Budgeting SC27Q03B
Instructional content SC27Q03C
Assessment practises SC27Q03D
Tick 1No tick 2

B-18
Appendix C. PISA 2003 U.S. Student and School Questionnaires (continued)
d Parent groups. SC27Q04
Staffing SC27Q04A
Budgeting SC27Q04B
Instructional content SC27Q04C
Assessment practises SC27Q04D
Tick 1No tick 2
eTeacher groups (e.g. Staff Association, curriculum committees, trade union). SC27Q05
Teacher groups (e.g. Staff Association, curriculum committees, union).
Staffing SC27Q05A
Budgeting SC27Q05B
Instructional content SC27Q05C
Assessment practises SC27Q05D
Tick 1No tick 2
fStudent groups (e.g. Student Association, youth organisation). SC27Q06
Staffing SC27Q06A
Budgeting SC27Q06B
Instructional content SC27Q06C
Assessment practises SC27Q06D
Tick 1No tick 2
g External examination boards. SC27Q07
Staffing SC27Q07A
Budgeting SC27Q07B
Instructional content SC27Q07C
Assessment practises SC27Q07D
Tick 1No tick 2

Appendix C
PISA 2003 Sampling and Data Collection Forms

School Cooperation Form
C-1
.1 PISA 2003 School Cooperation Form
(Complete with principal) School participating in: {PISA}
Work Area: {work area}
Verify Update
District/Diocese name: {district/diocese name} School Name: {school name} [ ] _________________ School ID: {school ID} Address: {Street address 1} [ ] _________________ {Street address 2} {City, State Zip} _________________ Phone Number: {school phone number} [ ] _________________ School Principal: {title}{first, last} [ ] _________________ School Principal Direct Line: {direct phone number} [ ] _________________ PART 1:
Hi, this is [YOUR NAME] The Program For International Student Assessment,
sponsored by the National Center of Educational Statistics, which is part of the
Department of Education. Your school was selected to participate in the study through a
random sample selection and I am calling to discuss this study with you.
Q.1. Did you receive the PISA information package?
1. YES 2. NO (COMPLETE RE-MAIL FORM AND SCHEDULE A FOLLOW-UP CALL)
(CODE CASE A “9”)
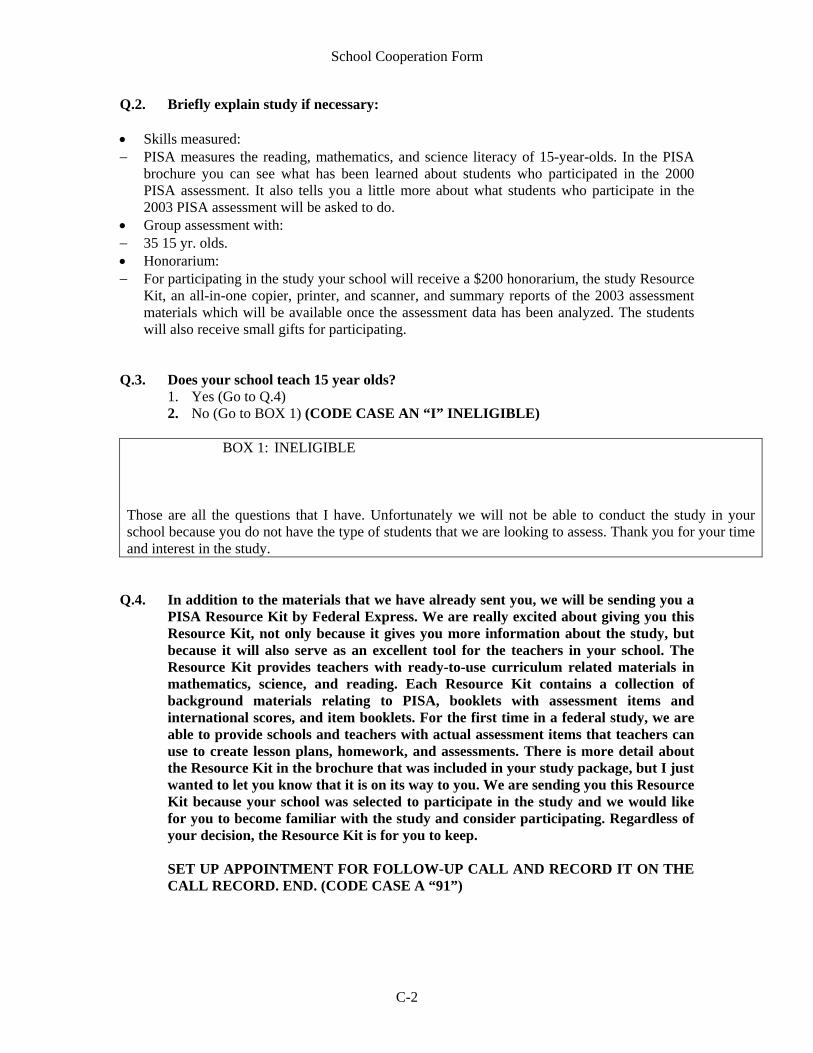
School Cooperation Form
C-2
Q.2. Briefly explain study if necessary: • Skills measured: − PISA measures the reading, mathematics, and science literacy of 15-year-olds. In the PISA
brochure you can see what has been learned about students who participated in the 2000 PISA assessment. It also tells you a little more about what students who participate in the 2003 PISA assessment will be asked to do.
• Group assessment with: − 35 15 yr. olds. • Honorarium: − For participating in the study your school will receive a $200 honorarium, the study Resource
Kit, an all-in-one copier, printer, and scanner, and summary reports of the 2003 assessment materials which will be available once the assessment data has been analyzed. The students will also receive small gifts for participating.
Q.3. Does your school teach 15 year olds?
1. Yes (Go to Q.4) 2. No (Go to BOX 1) (CODE CASE AN “I” INELIGIBLE)
BOX 1: INELIGIBLE
Those are all the questions that I have. Unfortunately we will not be able to conduct the study in your school because you do not have the type of students that we are looking to assess. Thank you for your time and interest in the study.
Q.4. In addition to the materials that we have already sent you, we will be sending you a
PISA Resource Kit by Federal Express. We are really excited about giving you this Resource Kit, not only because it gives you more information about the study, but because it will also serve as an excellent tool for the teachers in your school. The Resource Kit provides teachers with ready-to-use curriculum related materials in mathematics, science, and reading. Each Resource Kit contains a collection of background materials relating to PISA, booklets with assessment items and international scores, and item booklets. For the first time in a federal study, we are able to provide schools and teachers with actual assessment items that teachers can use to create lesson plans, homework, and assessments. There is more detail about the Resource Kit in the brochure that was included in your study package, but I just wanted to let you know that it is on its way to you. We are sending you this Resource Kit because your school was selected to participate in the study and we would like for you to become familiar with the study and consider participating. Regardless of your decision, the Resource Kit is for you to keep.
SET UP APPOINTMENT FOR FOLLOW-UP CALL AND RECORD IT ON THE
CALL RECORD. END. (CODE CASE A “91”)

School Cooperation Form
C-3
PART 2: Q.5. Did you receive the PISA resource kit?
1. YES 2. NO (END. START TRACKING FEDEX PACKAGE)
Q.6. Do you have any questions about the Resource Kit or how to use it?
1. YES (DISCUSS RESOURCE KIT AS NECESSARY) 2. NO
Q.7. REVIEW PISA AS NEEDED. • Skills measured: − PISA measures the reading, mathematics, and science literacy of 15-year-olds. • Group assessment with: − 35 15 yr. Olds. • Assessment session includes: − Designed to last about 3 hours, two sessions of 60 minutes each and a third session of 30
minutes to complete the Supplemental Student Questionnaire. There is 30-minute break between the first and second assessment sessions.
• Assessment is paper and pencil and administered by trained field supervisors. • Assessment schedule determined with school-will only take 1 day (or 2 if make-up is needed) • Questionnaires: − There is a school administrator questionnaire.
In appreciation for your cooperation, if you agree to participate, your school will receive an honorarium of $200, the study resource kit, which you have received, and an all in one copier, printer, and scanner. Students will receive small gifts. We will also send you summary reports once the PISA 2003 items are analyzed.
Q.8. We would like to ask for your participation with PISA and your permission to come into your school to conduct the assessment.
1. Yes (Go to Q.9) 2. No (Go to Q.10)
Q.9. In each school we would like to have a school contact who will serve as the liaison
between the school and the study. We will work with this person to set the assessment date, the sample of students, and notify parents, and appropriate teachers and students of the study. Who would you prefer to be our contact?
IF SCHOOL PRINCIPAL WILL BE OUR SCHOOL CONTACT, CHECK BOX [ ]
INFORM PRINCIPAL THAT A WELCOME PACKAGE WILL BE SENT AND YOU WILL GO OVER IT DURING THE FOLLOW-UP CALL. SCHEDULE A FOLLOW-UP CALL WITH THE PRINCIPAL TO DISCUSS THE ARRANGEMENTS OF THE ASSESSMENT.

School Cooperation Form
C-4
IF OTHER THAN PRINCIPAL: WRITE DOWN THE NAME AND TELEPHONE NUMBER OR EXTENSION OF THE PERSON THE PRINCIPAL ASSIGNS TO BE THE SCHOOL CONTACT.
____________________________________ First and Last name ____________________________________ Title _____________________________________ Telephone number or extension (if other than school number) _____________________________________ Address if different
END 1: I want to thank you for your time and cooperation with the PISA
study. Your support is critical for the success of the study. We look forward to visiting your
school and working with you. END. (CODE CASE A “PC” AND COMPLETE SCHOOL
PERMISSION FORM)
Q.10. ATTEMPT REFUSAL CONVERSION. Are there any additional
materials I can send you to review about the study? Perhaps after you have some time to review
the materials I can give you a call back and we can further discuss the study and how important
your participation is.
1. YES (COMPLETE RE-MAIL FORM AND SCHEDULE APPOINTMENT FOR
FOLLOW-UP CALL) (CODE CASE A “92” ) 2. NO (GO TO Q.11)
Q.11. Do you have a minute to answer a few questions on your reasons for not
participating in the study?

School Cooperation Form
C-5
1. YES (COMPLETE THE NIRF FORM IN THE FOLDER AND END) 2. NO (GO TO END 2)
END 2: Thank you for your time and consideration. Please feel free to
contact us at 1-888-243-0343 if you have any questions in the future about our study. END.
(CODE CASE A “2”)

School Information Form
C-6
.2 PISA 2003 School Information Form
(Complete with School Contact) School participating in: {PISA} Work Area: {work area} District/Diocese name: {district/diocese name} School Name: {school name} School ID: {school ID} Address: {Street address 1} {Street address 2} {City, State Zip} Phone Number: {school phone number} School Principal: {title}{First, Last} School Principal Direct Line: {direct phone number} School Contact Name: ____________________________________ School Contact Phone Number: ( ) - Q.1. Did you receive the PISA welcome package?
1. Yes 2. No (COMPLETE RE-MAIL FORM AND SCHEDULE A FOLLOW-UP CALL)
(CODE CASE A “93”)
Q.2. REVIEW PISA AS NECESSARY.
• Skills measured: − PISA measures the reading, mathematics, and science literacy of 15-year-olds.
• Group assessment with:
− 35 15 yr. Olds.
• Sampling: − List of all 15 year olds in the school by the time the assessment takes place
regardless of grade. We will discuss this in more detail shortly.
• Assessment session includes:

School Information Form
C-7
− Designed to last about 3 hours, two sessions of 60 minutes each and a third session of 30 minutes to complete the Supplemental Student Questionnaire. There is 30-minute break between the first and second assessment sessions.
• Assessment is paper and pencil and administered by trained field supervisors. • Assessment schedule determined with school-will only take 1 day (or 2 if make-up is
needed) • Questionnaires:
− There is a school administrator questionnaire about the environment structure of the school.
Q.3. Included in the package was a page titled “Summary of Activities for Schools”
which described the study and the tasks we will need to work with you to complete. These include collecting basic information about your school, setting an assessment space and date, sampling students, and notifying parents, teachers, and students. Do you have any questions?
(ANSWER QUESTIONS AS NECESSARY. REFER TO “SUMMARY OF ACTIVITIES FOR SCHOOLS” TAB ON YOUR JOB AID)
Q.4. Let’s talk for a minute about the sampling, which we would like you to work on
now. We will select 35 15 year olds in the school to participate in the study. We will need to do some sampling and we know how busy you are, so we will do that here. However, we will need you to complete some forms so we can randomly select the students.
Enclosed in your welcome package was a form called “PISA Student Listing Form”. This is the main form we want you to complete so we can begin the sampling process. Do you have this form nearby so we can look at it together? The front of this form is where you should list each 15-year-old in your school, along with their grade, gender, and birth date. The back of the form provides more detailed instructions. You can see that we would like you to enter the names of all the 15 year old students in your school who were born in 1987 regardless of their grade. You can give us a computer-generated list or a hardcopy list. The email address and fax number are listed on the form. 1. Ok with providing student names
2. Problem with providing student names (GO BOX 4a)

School Information Form
C-8
BOX 4a Since you can not disclose the names of the students we will need you to create an ID for each student that we can use to identify them. You will send us the ID in place of the student name along with the necessary information (sex, date of birth). It is important that you keep a list with the names of the students with their ID numbers in order to be able to identify them.
Q.5. Do you have a preferred way for us to work with you on sampling?
1. Email
• Enter email address:
______________________________________________________________ ______________________________________________________________
2. Fax
• Enter fax number:
______________________________________________________________
3. Mail (Confirm mailing address on top of form)
4. Telephone
• Enter number if different from school’s:
_____________________________________________________________
Q.6. Once we have the sampling list back from you, we will select a random sample of 35 15
year olds in your school. We will let you know the names or ID numbers of the selected students.
Some students may need to be excluded from the study due to disabilities, but we can talk about that in more detail once the students are selected. As mentioned in the PISA welcome package, we have a school questionnaire that will need to be completed by the school principal. We will be sending you the questionnaire and ask you to please give it to the school principal. The questionnaires will be collected on assessment day.
Do you have any questions about the sampling process? (DISCUSS AS
NECESSARY. REFER TO “PISA STUDENT LISTING FORM” TAB ON YOUR JOB AID)

School Information Form
C-9
Q.7. Now I have a few basic questions about your school: What is the last day of school?
______/______/______ Month Day Year Q.8. What time does school begin each morning? ___________a.m. Hour Q.9. What time does school end each afternoon? __________p.m. Hour Q.10. For the 2002-2003 school year, when will your school be in Spring Break? ______________________________________________________________________ Q.11. Beginning in April 2003 through the end of May 2003, what are the holidays or
other days besides Spring Break when the school will be closed? (RECORD BELOW)
Good Friday: Friday, April 15, 2003 ________________________________________________________________________ ________________________________________________________________________

School Information Form
C-10
Q.12. Are there any other activities, beginning in April 2003 through the end of May 2003, that
the PISA staff member should know about when scheduling and conducting assessments? This could include field trips, testing, or school assemblies. (RECORD BELOW)
Q.13. What time do these students go to lunch and for how long? _____________/___________ Hour Length Q.14. Now I have some questions about the assessment date:
My colleague, to whom I will transfer you at the end of our conversation, will do the actual scheduling of your school’s assessment. But is there a day in between April 7th and May 16th, 2003 that I can tell her would be better for your school’s schedule?
ENTER PREFERRED ASSESSMENT DATE(S): ___________________________
Q.15. Where will the assessments take place? REVIEW SPACE REQUIREMENTS AND
LENGTH OF ASSESSMENT AS NECESSARY. PISA will assess 35 15 year olds. Possible Locations:
1. Band/Orchestra/Chorus Room
2. Library/Media Center
3. Gymnasium
4. Auditorium
5. Classroom(Specify)
____________________________________________________________________ 6. Other (Specify)
____________________________________________________________________ FOR SCHEDULER USE ONLY: After reviewing scheduling requirements (questions 7 through 14) schedule assessment. IF SCHOOL CONTACT HAS GIVEN US A DATE FOR THE ASSESSMENT IT MUST BE

School Information Form
C-11
COMPLETED ON THAT DATE (see question 14). Enter Date of Assessment: _______/_______/_______ Month Day Year Enter Time of Assessment: ______________________ (AFTER ASSESSMENT DATE IS SCHEDULED CODE CASE A “C”) Q.16. Once the sampling has been completed and we know which students have been
selected, I’ll send you some materials about the study that the parents will find interesting.
1. Parent notification only (GO TO Q.19) 2. School contact raises parent consent (GO TO Q.17)
Q.17. We have two types of consent, informed consent and signed permission form.
Informed consent means that the parents sign and return a consent form only if the parent objects to the child’s participation. If the parent does not return the signed consent form by a particular date, we consider the parent’s consent obtained.
Signed permission form means that the parent signs and returns a consent form, which indicates that permission for the child’s participation in the study is either granted or denied. We ask the parent to return the form by a particular date, and after that date, we follow-up with the parent in order to obtain the signed consent form.
Which type of consent form would you prefer to use? 1. Informed consent 2. Signed permission form
Q.18. After we have selected the students for the study, we can provide you with parent letters
and the consent form. How would you prefer the parent letters and consent forms be distributed?
1. Yes, school distributes (Go to Box 1) 2. No, wants Westat to distribute them (Go to Box 2) 3. No, other (Go to Box 3)

School Information Form
C-12
BOX 1 We will send the parent consent forms to you, along with a form that you can use to keep track of the returned parent consent forms. We will be contacting you periodically to get a list of the returned consent forms. Go to Q.19.
.2.1 BOX 2
Along with the consent form we would like to send a letter to inform parents of the sampled children about the study. We will send you a copy of the letter, the consent form and a list of the parents from who we are expecting consent. We will need to get the parent’s addresses from you at that time. Go to Q.19.
.2.2 BOX 3
Special instructions for obtaining/mailing parent letter and/or consent forms. _____________________________________________________________________________ _____________________________________________________________________________ _____________________________________________________________________________ _____________________________________________________________________________

School Information Form
C-13
Q.19. What can I tell the supervisor is the best way to get to your school? Q.20. Where should the PISA staff park? Where is the school entrance? I want to thank you for your time and cooperation with the PISA study. Please complete and return the Student Listing form by email or fax as soon as you can, so that we can select the students. We look forward to working with you and your school. Now I will transfer you to the assessment scheduler. (IF CONTACT, NOT BEING TRANSFERRED, END CALL AND CODE CASE A “PC”.

Student Listing Form
C-14
PISA STUDENT LISTING FORM Country Name: United States of America (USA) School ID: ___________________________________________ School Name: ___________________________________________ Address: ___________________________________________ ___________________________________________ List Prepared by: ___________________________________________ Telephone #: ___________________________________________ Date List Prepared: ___________________________________________ Total # of Students Listed ___________________________________________ For Sampling Only
Selected Student Enter “S”
Student Name Grade Sex (M/F)
Birth Date (mm/yr)

Student Listing Form
C-15
PISA INSTRUCTIONS AND DEFINITIONS
A. Instructions for Preparing a List of Eligible Students 1) Please prepare a list of ALL students enrolled in your school who were BORN between
January 1st and December 31st 1987 using the most current enrollment records available. 2) Include on the list students who typically may be excluded from other testing programs
(such as some students with disabilities or limited English language proficiency). 3) Please include on this list, the complete name, current grade, sex, and birth date of each
eligible student. 4) If confidentiality is a concern in listing student names, then a unique student identifier
may be substituted. Because some students may have the same or similar names, it is important to include a birth date for each student.
5) The list may be computer generated or prepared manually using the PISA Student Listing
Form. A copy of the PISA Student Listing Form is on the reverse side of these instructions. You may copy this form if you need additional pages (See directions in part B).
If you prefer to produce a computer-generated list, please follow the instructions in part C. 6) If you use the Student Listing Form on the reverse side of this page, please leave the “For
Sampling Only” column blank. 7) Once the list is prepared, please fax it back to us at (301) 294-2038.
B. Please enter the following information for ALL the students BORN between January 1st and
December 31st 1987 who are enrolled in your school: STUDENT NAME: Enter the first name, middle initial, and last name of the student. GRADE: Enter the grade the student is currently enrolled in. SEX: Enter the sex of the student. M=Male or F=Female. BIRTH DATE: Enter the month, day, and year of the student’s birth date.
C. Instructions for Preparing Computer Generated Lists.
Write the school name and address on the list. List students in alphabetical order by last name. Include current grade, gender, and date of birth. Double-space the list if possible. Allow a left-hand margin of at least two inches. Include the date the printout was prepared. Define any special codes. Include preparer’s name and telephone number.

Student Tracking Form
C-16
SAMPLE PISA STUDENT TRACKING FORM Page 1 of 1
Country Name: United States Stratum ID: School Name: School ID:
SAMPLING INFORMATION (A)
# Students Age 15
(B) # Students Listed
for Sampling
(C) Sample Size
(D) Random Number
(E) Sampling Interval
(F) First Line #
Selected [(Box D X Box E) + 1]
Participation Status
(11) Original Session
(12) Follow-up Session
(1)
ID #
(2)
Line # (Sample)
(3)
Student Name
(4)
Grade
(5)
Gender F=1; M=2
(6)
Birth Date (MM-YY)
(7)
Study Program
(8)
SEN Code
(9)
Inclusion Code
(10)
Booklet Number Booklet SQ Booklet SQ
1 2 3 4 5 6 7 8 9
10 11 12 13 14

Sampling Contingency Plan Form
C-17
Sampling Contingency Plan Form
A. Total number of students = B. Sample size = 35
C. Sampling Interval (A/C) =
KEEP 4 PLACES PAST THE DECIMAL, 0.0000 D. Random number (from table) = 0. EXPRESSED AS A DECIMAL, 0.RANDOMNUMBER
E. Sample start number (D*C +1) =
HIGHLIGHT THIS NUMBER ON THE LIST F. ADD THE SAMPLING INTERVAL (line C) TO THE SAMPLE START NUMBER (line E) AND CIRCLE THE LINE NUMBER (of C+E). CONTINUE TO ADD THE SAMPLING INTERVAL TO THE LINE NUMBERS, KEEPING THE 4 DECIMAL PLACES UNTIL YOU HAVE SELECTED 35 STUDENTS.
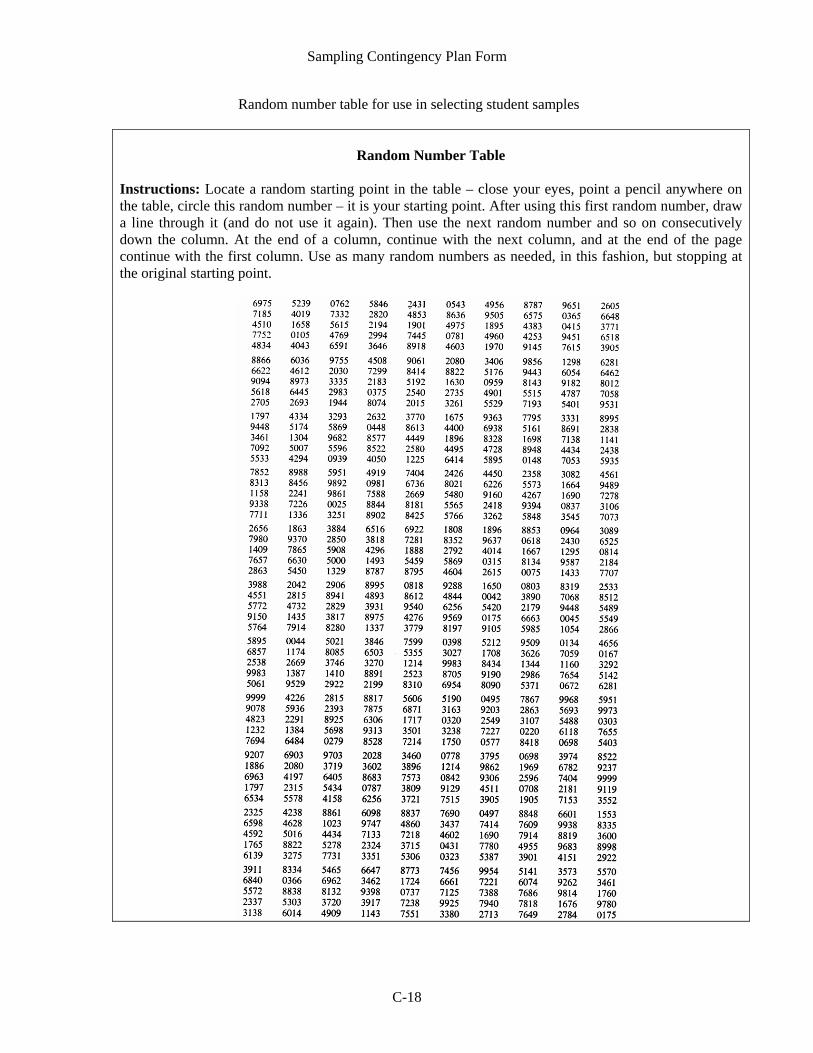
Sampling Contingency Plan Form
C-18
Random number table for use in selecting student samples
Random Number Table
Instructions: Locate a random starting point in the table – close your eyes, point a pencil anywhere on the table, circle this random number – it is your starting point. After using this first random number, draw a line through it (and do not use it again). Then use the next random number and so on consecutively down the column. At the end of a column, continue with the next column, and at the end of the page continue with the first column. Use as many random numbers as needed, in this fashion, but stopping at the original starting point.

Instructions for Defining Students with Special Education Needs (SEN)
C-19
Instructions for Defining Students with Special Education Needs (SEN)
The following guidelines define general categories for the definition of students with special needs within schools. These guidelines need to be carefully implemented within the context of each educational system. In general, use these codes for students who have been formally identified as needing special or additional educational services. The numbers in the left column are codes to be entered in column 8 of the Student Tracking Form to identify students with special needs.
Code for Column 8 Meaning of Code
0 No special education needs.
1 Functional disabled students – These are students who are permanently physically disabled (for example, having visual, hearing, or orthopedic impairments) who receive special education services.
2 Intellectual disability – These are students who are considered in the professional opinion of the school principal or by other qualified staff to have a mental or emotional disability or who have been psychologically tested and identified with a specific learning or cognitive disability and who receive special education services.
3 Students with limited proficiency in the test language – Limited English proficient students may be students who were not born in the United States or whose native language is not English, who have been identified by the school as needing language assistance services.
It is important that these criteria be followed strictly for the study to be comparable within and across countries. Students who receive codes 1 or 2 are most likely students with an IEP. Once you have determined a student has a special education need, then you must decide whether or not to include that student in the assessment (column 9 of the Student Tracking Form).

Instructions for Including/Excluding Students form
C-20
Instructions for Including/Excluding Students form
The following guidelines define general categories for the inclusion or exclusion of students in the PISA assessment. In general, students who will be included in state or local assessment programs should be included in PISA if possible. The numbers in the left column are codes to be entered in column 9 of the Student Tracking Form to code the reason for a student’s exclusion.
Code for Column 9 Meaning of Code
0 Students will be included in the assessment (use this code even if a student has been identified as having a special need in column 8, but will be included in the assessment).
1 Student will be excluded because of a functional disability. These are students who are permanently physically disabled in such a way that they cannot perform in the PISA testing situation. Functionally disabled students who can respond to the test should be included in the testing. If a student received code 1 in column 8 and will not be included in the assessment, use code 1 in column 9.
2 Student will be excluded because of an intellectual disability. These are students who are considered in the professional opinion of the school principal or by other qualified staff to have a mental or emotional disability or who have been psychologically tested as such and they cannot perform in the PISA testing situation. This includes students who are emotionally or mentally unable to follow even the general instructions of the test. However, students should not be excluded solely because of poor academic performance or disciplinary problems. If a student received code 2 in column 8 and will not be included in the assessment, use code 2 in column 9.
3 Student will be excluded because of limited proficiency in the test language. These are students who are unable to read or speak English and would be unable to overcome the language barrier in the PISA test situation. Typically, a student who has received less than 1 year of instruction in English should be excluded. If a student received code 3 in column 8 and will not be included in the assessment, use code 3 in column 9.
4 Home-schooled 5 Student transferred out of this school to another school. 6 Student no longer is school, but it is not known if he or she is attending
school elsewhere. 7 Student is not age 15, that is not born in 1987.
It is important that these criteria be followed strictly for the study to be comparable within and across countries. Once you have determined if a student has a special education need, then you must decided whether or not to include that student in the assessment. When in doubt, include the student.
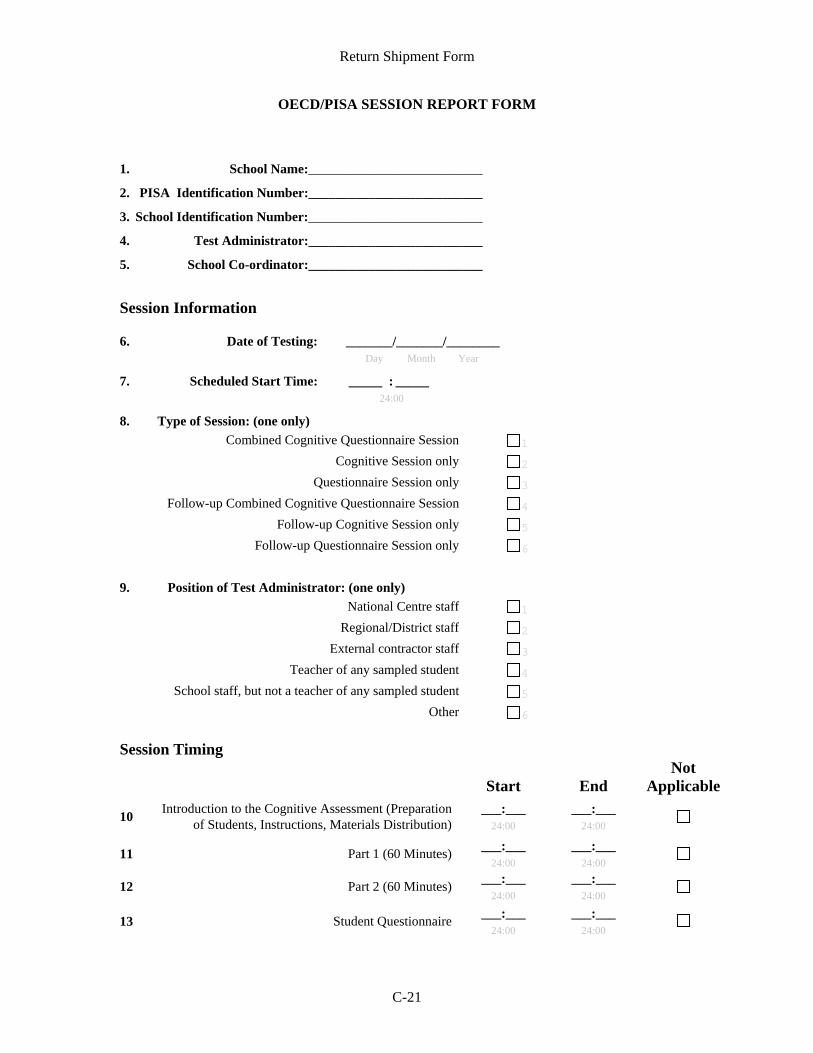
Return Shipment Form
C-21
OECD/PISA SESSION REPORT FORM
1. School Name:__________________________
2. PISA Identification Number:__________________________
3. School Identification Number:__________________________
4. Test Administrator:__________________________
5. School Co-ordinator:__________________________
Session Information
6. Date of Testing: _______/_______/________
Day Month Year
7. Scheduled Start Time: _____ : _____ 24:00
8. Type of Session: (one only) Combined Cognitive Questionnaire Session 1 Cognitive Session only 2 Questionnaire Session only 3 Follow-up Combined Cognitive Questionnaire Session 4 Follow-up Cognitive Session only 5 Follow-up Questionnaire Session only 6
9. Position of Test Administrator: (one only) National Centre staff 1 Regional/District staff 2 External contractor staff 3 Teacher of any sampled student 4 School staff, but not a teacher of any sampled student 5 Other 6 Session Timing
Start End Not
Applicable
10 Introduction to the Cognitive Assessment (Preparation of Students, Instructions, Materials Distribution)
___:___ 24:00
___:___ 24:00
11 Part 1 (60 Minutes) ___:___ 24:00
___:___ 24:00
12 Part 2 (60 Minutes) ___:___ 24:00
___:___ 24:00
13 Student Questionnaire ___:___ 24:00
___:___ 24:00

Return Shipment Form
C-22
14. Were any of the following present during the testing session? Yes No a) The School Coordinator 1 2 b) An assistant to the Test Administrator 1 2 c) School or District Staff 1 2 d) Government Official 1 2 e) PISA Quality Monitor 1 2 f) Other 1 2 Student Behaviour No Some Most Students Students Students
15. How many students talked to other students before the end of the test session? 1 2 3
16. How many students complained or argued with the test administrator? 1 2 3
17. How many students made noise or moved around unnecessarily disrupting other students concentrating on the test? 1 2 3
18. How many students became restless towards the end of the session? 1 2 3
Disruptions 19. Did any of the following affect the test session? Yes No a) Announcements over the loudspeaker 1 2 b) Alarms 1 2 c) Class changeover in the school 1 2 d) Other students not participating in the test session 1 2 f) Students or Teachers visiting the testing room 1 2
continued next page…

Return Shipment Form
C-23
Assessment Booklet Format and Content
20. Were there any problems with the Assessment Booklets (e.g. errors or omissions, unclear directions, confusing format, too long, too hard, boring, tiring etc.)? ( )No ( )Yes. Specify _______________________________________________________________________________________________ _______________________________________________________________________________________________ _______________________________________________________________________________________________
21. Were there any problems with specific test items? ( )No ( )Yes. Specify (include booklet number and item number):
BOOK# ITEM# PROBLEM ___________ __________ ______________________________________________________________________ ___________ __________ ______________________________________________________________________ ___________ __________ ______________________________________________________________________ ___________ __________ ______________________________________________________________________ ___________ __________ ______________________________________________________________________ ___________ __________ ______________________________________________________________________ ___________ __________ ______________________________________________________________________ ___________ __________ ______________________________________________________________________ ___________ __________ ______________________________________________________________________
Student Questionnaire Format and Content
23. Were there any problems with the Student Questionnaires (e.g. errors or omissions, unclear directions, confusing format, too long, too hard, boring, tiring, etc.)? ( )No ( )Yes. Specify _______________________________________________________________________________________________
24. Were there any problems with specific questions? ( )No ( )Yes. Specify (include the item number):
ITEM# PROBLEM ___________ __________________________________________________________________________________ ___________ __________________________________________________________________________________ ___________ __________________________________________________________________________________ ___________ __________________________________________________________________________________ ___________ __________________________________________________________________________________ ___________ __________________________________________________________________________________ ___________ __________________________________________________________________________________

Return Shipment Form
C-24
Other Comments 25. Please note other comments that you think would help improve the assessment:
_______________________________________________________________________________________________ _______________________________________________________________________________________________ _______________________________________________________________________________________________ _______________________________________________________________________________________________ _______________________________________________________________________________________________
THANK YOU VERY MUCH
Appendix D
Other PISA 2003 Reports and References

D-1
Currently, several documents are available to analysts interested in analyzing PISA data. The following is a comprehensive listing of both NCES and OECD publications that are publicly available to users.
International Publications
The following international publications are available at http://www.pisa.oecd.org. Data Analysis Manuals and Technical Reports Adams, R (ed). (2003). PISA 2000 Technical Report. Paris: Organization for Economic Cooperation and Development (OECD). Adams, R (ed). (2005). PISA 2003 Technical Report. Paris: Organization for Economic Cooperation and Development (OECD). Organization for Economic Cooperation and Development (OECD). (2002). Programme for International Student Assessment (PISA): Manual for the PISA 2000 Database. Paris:Author. Organization for Economic Cooperation and Development (OECD), (2005). PISA 2003 Data Analysis Manual. Paris: Organization for Economic Cooperation and Development (OECD). Summary and Achievement Reports Organization for Economic Cooperation and Development (OECD). (2001). Knowledge and Skills for Life: First Results from the OECD Programme for International Student Assessment. Paris:Author. Organization for Economic Cooperation and Development (OECD). (2004). Learning for Tomorrow’s World: First Results from PISA 2003. Paris:Author. Organization for Economic Cooperation and Development (OECD). (2004). Messages from PISA 2000. Paris:Author. Thematic Reports Artelt, C., Baumert, J., Julius-McElvany, N. & Peschar, J. (2003) Learners for Life: Student Approaches toLearning. Results from PISA 2000. Paris: OECD. Kirsch, I., de Jong, J., Lafontaine, D., McQueen, J., Mendelovits, J., and Monseur, C. (2002). Reading for Change: Performance and Engagement Across Countries. Results from PISA 2000. Paris: OECD. Willms, J.D. (2003). Student Engagement in School: A Sense of Belonging and Participation. Results from PISA 2000. Paris: OECD.

D-2
Frameworks Organization for Economic Cooperation and Development (OECD). (2000). Measuring Student Knowledge and Skills: The PISA 2000 Assessment of Reading, Mathematical and Scientific Literacy. Paris: Author. Organization for Economic Cooperation and Development (OECD). (1999). Measuring Student Knowledge and Skills: A New Framework for Assessment. Paris:Author. Organization for Economic Cooperation and Development (OECD). (2002). Sample Tasks from the PISA 2000 Assessment: Reading, Mathematical and Scientific Literacy. Paris:Author. Organization for Economic Cooperation and Development (OECD). (2002). Programme for International Student Assessment (PISA): PISA 2003 Assessment Framework :Mathematics, Reading, Science and Problem Solving Knowledge and Skills. Paris:Author. NCES Publications The following NCES publications are available at http://nces.ed.gov/surveys/pisa. Data Products U.S. Department of Education, National Center for Education Statistics. (2004). Program for International Student Assessment (PISA) 2000 Data File (NCES 2004–006). Summary Reports Lemke, M., Calsyn, C., Lippman, L., Jocelyn, L., Kastberg, D., Liu,Y., Roey, S.,Williams, T., Kruger,T., and Bairu, G. (2001). Highlights from the 2000 Program for International Student Assessment (NCES 2002–116). U.S. Department of Education, NCES.Washington, DC: U.S. Government Printing Office. Lemke, M., Calsyn, C., Lippman, L., Jocelyn, L., Kastberg, D., Liu,Y., Roey, S.,Williams, T., Kruger, T., Bairu, G. (2001). Outcomes of Learning: Results from the 2000 Program for International Student Assessment of 15-Year-Olds in Reading,Mathematics, and Science Literacy (NCES 2002–115).U.S. Department of Education, NCES.Washington, DC: U.S. Government Printing Office. Thematic Reports Lemke, M., Sen, A., Pahlke, E., Williams, T., Kastberg, D., and Jocelyn, L. (forthcoming). Characteristics of U.S. 15-Year-Old Low Achievers in an International Context: Findings from PISA 2000 (NCES 2005–019). U.S. Department of Education, NCES.Washington, DC: U.S. Government Printing Office.


