Embed Size (px)
Citation preview
March 2017
U.S. Department of Health and Human Services Substance Abuse and Mental Health Services Administration Center for Substance Abuse Prevention
Form Approved
OMB No. 0930-0348 Expiration Date 04/30/2018
Program Evaluation for Prevention: Partnerships for Success
Community-Level Instrument Revised Guidance Manual

[This page intentionally left blank.]

Program Evaluation for Prevention: Partnerships for Success Community-Level Instrument Revised Guidance Manual
Program Evaluation for Prevention Contract – March 2017 Contents — iii
Contents 1. Community-Level Instrument Revised (CLI-R) Overview ...................................................... 1-1
1.1 What Is the Purpose of the CLI-R? ................................................................................... 1-1 1.2 How Is the CLI-R Administered? ...................................................................................... 1-2 1.3 Who Is Responsible for Completing the CLI-R? ......................................................... 1-2 1.4 Subrecipient Staff Contact Information and Log-ins ............................................... 1-3 1.5 How Often, and When, Will I Be Asked to Complete the CLI-R? ......................... 1-3 1.6 How Do You Submit the CLI-R? ......................................................................................... 1-4 1.7 What Happens After the Data Are Accepted by the Grantee? .............................. 1-5 1.8 What Do We Do if We Are a Single-Community Grantee? ..................................... 1-6
2. CLI-R Content Guidance .......................................................................................................................... 2-1
2.1 Administrative Survey .......................................................................................................... 2-1 2.2 Strategic Prevention Framework ..................................................................................... 2-1
2.2.1 Needs and Resources Assessment .................................................................... 2-1 2.2.2 Capacity Building ...................................................................................................... 2-3 2.2.3 Strategic Plan Development ................................................................................. 2-5 2.2.4 Prevention Intervention Implementation ..................................................... 2-5 2.2.5 Monitoring and Evaluation ................................................................................ 2-43
2.3 Contextual Factors ............................................................................................................... 2-43 2.4 Closing Questions ................................................................................................................. 2-44
3. Guidance for Grantees in Overseeing the CLI-R ........................................................................... 3-1
3.1 Grantee Role and Responsibilities for the CLI-R ....................................................... 3-1 3.2 Grantee Checklist for Reviewing the CLI-R .................................................................. 3-2 3.3 CLI-R Data Reports and Extracts ...................................................................................... 3-4
4. Getting Help ................................................................................................................................................. 4-1
4.1 Whom Can I Contact for Help? ........................................................................................... 4-1
Appendices
A Sample Implemented Interventions Tables ............................................................................... A-1
B Intervention Reporting Worksheet................................................................................................ B-1
Program Evaluation for Prevention: Partnerships for Success Community-Level Instrument Revised Guidance Manual
Program Evaluation for Prevention Contract – March 2017 Contents — iv
List of Exhibits 1 Sample Intervention Service Type Names .................................................................................. 2-7
2 CSAP Strategy Type Definitions and Examples ......................................................................... 2-9
3 Critical Checklist for Reviewing the CLI-R .................................................................................. 3-2

Program Evaluation for Prevention: Partnerships for Success Community-Level Instrument Revised Guidance Manual
Program Evaluation for Prevention Contract – March 2017 1-1
1. Community-Level Instrument Revised (CLI-R) Overview
The purpose of this document is to describe the Partnerships for Success (PFS) CLI-
R requirements and provide guidance to PFS grantees about providing appropriate
data to satisfy these requirements.
Note that the term “grantee” is used to refer to the state/tribal entity/jurisdiction
receiving the PFS grant from CSAP. The term “subrecipients” refers to the
community entities that receive funds from the grantee to carry out SPF PFS
activities at the community level. Some tribal and non-state jurisdiction grantees are
considered single-community grantees, and may not have subrecipients—see the
support document CLI-R Single-Community Grantee Supplement for additional
information.
1.1 What Is the Purpose of the CLI-R? The purpose of the CLI-R is to:
• Assess community implementation of the SPF process, changes in community capacity, and types of interventions implemented.
• Assess obstacles to the implementation of the SPF-PFS and prevention interventions.
• Identify characteristics of community-level interventions and approaches that are most effective in producing improvements in community outcomes.
• Assist CSAP policymakers as they design and implement future initiatives.
• Examine the cost effectiveness of the interventions along with the funding and leveraged funding.
• Examine collaborations that supported successful interventions.
Program Evaluation for Prevention: Partnerships for Success Community-Level Instrument Revised Guidance Manual
Program Evaluation for Prevention Contract – March 2017 1-2
1.2 How Is the CLI-R Administered? The CLI-R is administered online through the PEP-C Management Reporting Tool
(MRT). Features of the online tool include:
• As you enter your data, you will be able to save your work and come back to it at another time.
• Items to be completed vary by reporting period.
– On the electronic (or hard copy) version of the CLI-R, items are marked as Baseline (B), Annual (A), Every time (E; semiannual), or Final (F).
• Skip patterns are used to automatically take you to the appropriate question based on your responses and the reporting period.
• If desired, you may write your responses to open-ended questions in advance using a word processor and copy and paste them into the MRT.
• A pdf version of the CLI-R is available in the PEP-C Knowledge Base (https://pep-c.rti.org/HERO/KB/PEP-C-KB-HERO/Default.htm) to assist subrecipients in planning responses and collecting the necessary information prior to entering data into the MRT. To access the CLI-R pdf, follow this path: Community-Level Instrument - Revised (CLI-R) → Community-Level Instrument – Revised.
1.3 Who Is Responsible for Completing the CLI-R? The CLI-R submission process is a two-step process involving subrecipient and
grantee staff members.
• Step 1: Subrecipient community staff members are responsible for entering the CLI-R data and submitting to the grantee.
– Subrecipients are encouraged to obtain input from others involved with the SPF-PFS-funded project. For example, we recommend getting help from grantee staff or evaluator, especially for challenging sections such as reporting interventions and costs.
– Grantee staff and evaluator can view, edit, and enter data as needed to assist subrecipients.
• Step 2: The grantee Project Director, Project Coordinator, or Project Evaluator is responsible for reviewing and accepting the CLI-R for final submission.
Program Evaluation for Prevention: Partnerships for Success Community-Level Instrument Revised Guidance Manual
Program Evaluation for Prevention Contract – March 2017 1-3
1.4 Subrecipient Staff Contact Information and Log-ins • The grantee Project Director or Project Coordinator is responsible for adding
subrecipient staff members in the MRT on the Contact Information → Subrecipient Staff page.
• When entered into the MRT, subrecipient staff members automatically will be sent MRT log-in names and passwords via email from [email protected].
– Check your spam filter if you do not receive an email notifying you that you can access the MRT.
– If you do receive an email to your inbox or spam folder, please complete the following steps:
o Go to the MRT (https://pep-c.rti.org/).
o Click the "Password Reset" button on the login page.
o A notification will be sent to the system to send you an email with a link that you must follow to reset your password. Please note that the link provided in the email is only good for 2 hours.
• After receiving access to the system, subrecipient staff members can add and edit their community’s subrecipient staff information in the MRT.
1.5 How Often, and When, Will I Be Asked to Complete the CLI-R?
The CLI-R is submitted twice per year on June 1 and December 1. Subrecipients
must complete their first CLI-R for the reporting period that they began receiving
PFS funds. Grantees need to add the subrecipient’s date funded on the Contact
Information → Subrecipients page of the MRT for each of their subrecipients.
Completing the date funded field will trigger the first CLI-R reporting period. For
example, if the subrecipient date funded is 10/1/2012, the first CLI-R due will be
June 1, 2013 (for the time period from 10/1/2012 through 3/31/2013).
Subrecipients will click the CLI-R link to see a list of any previously submitted CLI-R
reporting periods (if applicable) as well as the next available unsubmitted reporting
period. Subrecipients must complete their CLI-R for the reporting periods in
sequential order because the responses from previous reporting periods pre-
Program Evaluation for Prevention: Partnerships for Success Community-Level Instrument Revised Guidance Manual
Program Evaluation for Prevention Contract – March 2017 1-4
populate into the next reporting period. A subrecipient’s final CLI-R will be due for
the reporting period which covers the date the subrecipient completes all of their
intervention activities and PFS funding. In the list of submitted and active CLI-R
reporting periods, subrecipients should check the box that indicates this is their
final CLI-R so that the PEP-C knows that no further CLI-R reporting periods are
expected.
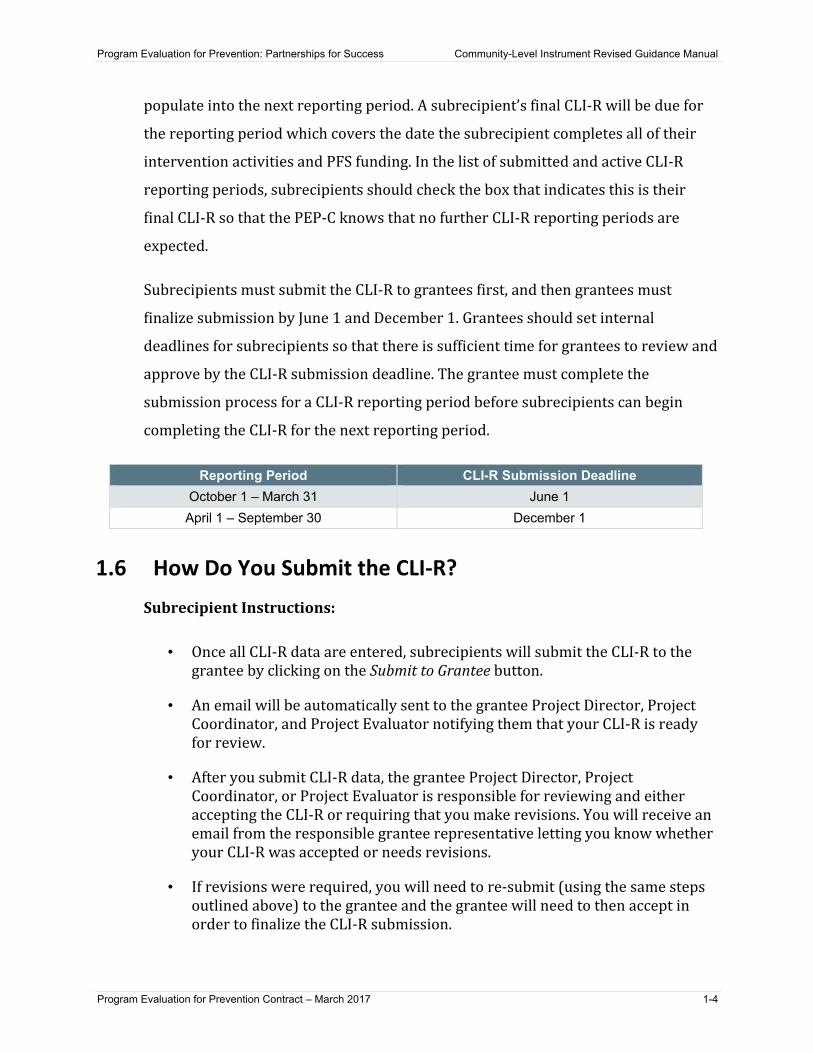
Subrecipients must submit the CLI-R to grantees first, and then grantees must
finalize submission by June 1 and December 1. Grantees should set internal
deadlines for subrecipients so that there is sufficient time for grantees to review and
approve by the CLI-R submission deadline. The grantee must complete the
submission process for a CLI-R reporting period before subrecipients can begin
completing the CLI-R for the next reporting period.
Reporting Period CLI-R Submission Deadline October 1 – March 31 June 1
April 1 – September 30 December 1
1.6 How Do You Submit the CLI-R? Subrecipient Instructions:
• Once all CLI-R data are entered, subrecipients will submit the CLI-R to the grantee by clicking on the Submit to Grantee button.
• An email will be automatically sent to the grantee Project Director, Project Coordinator, and Project Evaluator notifying them that your CLI-R is ready for review.
• After you submit CLI-R data, the grantee Project Director, Project Coordinator, or Project Evaluator is responsible for reviewing and either accepting the CLI-R or requiring that you make revisions. You will receive an email from the responsible grantee representative letting you know whether your CLI-R was accepted or needs revisions.
• If revisions were required, you will need to re-submit (using the same steps outlined above) to the grantee and the grantee will need to then accept in order to finalize the CLI-R submission.
Program Evaluation for Prevention: Partnerships for Success Community-Level Instrument Revised Guidance Manual
Program Evaluation for Prevention Contract – March 2017 1-5
Grantee Instructions:
• Grantees need to complete the following steps to request revisions or accept the CLI-R:
1. The grantee Project Director, Project Coordinator, and Project Evaluator will receive an email alert that a subrecipient has submitted their CLI-R. (The grantee determines who is responsible for reviewing the CLI-R.)
2. Click Cross-Site Instruments on the Home Page.
3. Click Community-Level Instrument.
4. Click View/Accept CLI and select the subrecipient.
5. Select the CLI-R (listed by reporting period) you wish to view.
6. Each section of the CLI-R will appear in a table; click on each section to review. You can make corrections or edits directly, or request that the subrecipient make revisions.
7. When finished, click Open the CLI-R Acceptance Panel.
8. Click Requires Revision or Accepted.
9. If revisions are required, type in detailed notes indicating specific sections and clearly describing the requested changes and click Save. This will send an automatic email with notes to the subrecipient.
• If revisions were required, subrecipients will need to re-submit (using the same steps outlined above) to the grantee and the grantee will need to then accept in order to finalize the CLI-R submission.
1.7 What Happens After the Data Are Accepted by the Grantee?
• Following the June and December submission deadlines, the data will be processed by the PEP-C Data Cleaning and Processing Team.
• When a CLI-R submission is accepted by the grantee, this locks that data record so no further changes can be made.
• The PEP-C Data Cleaning and Processing Team will extract and review data for quality and follow-up with grantees, if necessary, via a Data Feedback Form. The Data Feedback Form will be provided via email to grantee Project Directors, Project Coordinators, Project Evaluators, and SPOs.
Program Evaluation for Prevention: Partnerships for Success Community-Level Instrument Revised Guidance Manual
Program Evaluation for Prevention Contract – March 2017 1-6
• The PEP-C Data Cleaning and Processing Team will notify the Data Collection Systems Team to open CLI-R records for data entry.
• The grantee staff will resolve listed issues, log into the MRT, and update the CLI-R.
• The grantee will resubmit the CLI-R, which locks the data record so no further changes can be made.
1.8 What Do We Do if We Are a Single-Community Grantee? Some tribal and non-state jurisdiction grantees are considered single-community
grantees, and may not have subrecipients. The CLI-R submission process will
function differently for most single-community grantees. Please see the support
document CLI-R Single-Community Grantee Supplement for additional information.
Program Evaluation for Prevention: Partnerships for Success Community-Level Instrument Revised Guidance Manual
Program Evaluation for Prevention Contract – March 2017 2-1
2. CLI-R Content Guidance 2.1 Administrative Survey
• This section asks questions that describe your subrecipient organization. Your subrecipient organization should be identified in terms of the entity that is carrying out the activities of the SPF-PFS.
• This section includes questions about previous SPF SIG funding.
• This section includes questions about how your subrecipient organization addresses cultural competence and health disparities.
– We recognize that the question about formal, written policies may not adequately capture the manner in which tribal or Pacific jurisdiction grantees might address cultural responsiveness in their organizations and communities. Please respond to the question as written with the understanding that the question does not capture the varied culturally responsive approaches of some communities. We welcome a qualitative description of how you address cultural factors and invite you to use the open text field in item 207 to provide us with more detailed information.
2.2 Strategic Prevention Framework • Each step of the Strategic Prevention Framework is addressed in this section.
• The five steps include:
– Needs and resources assessments
– Capacity building
– Strategic plan development
– Prevention intervention implementation
– Monitoring and evaluation
• You will have the opportunity to describe your activities for each of the steps you worked on during this reporting period.
2.2.1 Needs and Resources Assessment
• This section collects information on organizational and community needs and resources assessments you conducted during this reporting period. You
Program Evaluation for Prevention: Partnerships for Success Community-Level Instrument Revised Guidance Manual
Program Evaluation for Prevention Contract – March 2017 2-2
are asked whether or not the needs and resources of your organization and the community have been assessed.
DATA SOURCES
• This section provides you with an opportunity to describe the data you have available and the data you used to conduct your needs and resources assessment.
– Questions 10-13 ask about the availability of community-level alcohol- and prescription drug-related data for data-driven planning. For these questions, please focus on local data collection sources that you are able to obtain directly. Do not include local data sources that are provided to you by the state, tribal entity, or jurisdiction. Information about those data sources will be provided by grantees in the Revised Grantee-Level Instrument.
o Note that Questions 10-13 will only be completed twice: once at the beginning of the grant and once at the end.
– Question 14 asks about data that you used as part of your needs and resources assessment, including data that you obtained yourself and data that were provided to you by the state, tribal entity, or jurisdiction. The SEOW is the State Epidemiological Outcomes Workgroup for the PFS grant, and the term “provided by the SEOW” refers to any data that were provided to you by the state, tribal entity, or jurisdiction.
o Note that Question 14 will be auto-filled after initially completed but can be changed in any later reporting period.
TARGETED PFS NEEDS
• This section asks about the consumption patterns, consequences, intervening variables, and populations you identified to target for your PFS activities.
– In this section, please refer to your strategic plan (if applicable) to accurately document the consumption patterns, consequences, and intervening variables you prioritized. Do not include any targets that were not prioritized for your initiative, even if you believe they may also be affected by your efforts.
– In some cases, the prioritized consumption patterns may have been mandated by the state/grantee.
– Note that Targeted PFS Needs will be auto-filled after initially completed but can be changed in any later reporting period, if for example, your strategic plan was modified.

Program Evaluation for Prevention: Partnerships for Success Community-Level Instrument Revised Guidance Manual
Program Evaluation for Prevention Contract – March 2017 2-3
2.2.2 Capacity Building
• In this section, we ask you about your activities related to capacity and capacity building.
– Capacity refers to the quality and level of skills (e.g., workforce) and resources needed to achieve a desired outcome. For SPF-PFS, capacity refers to the demonstrated ability of subrecipients to effectively implement each SPF step (e.g., implementation of evidence-based interventions) and the resources (human, organizational, and fiscal) to support the implementation of the SPF model.
– Capacity building refers to activities conducted to improve the ability of an organization or community to deliver substance abuse prevention services, such as improving organizational resources, seeking and receiving relevant training and technical assistance (T/TA), building new relationships or strengthening existing relationships among groups and organizations involved in substance abuse prevention, and ensuring that prevention intervention activities and outcomes continue after SPF-PFS funding ends.
– Note that Question 20, which asks you to rate your organization’s capacity, will only be completed twice: once at the beginning of the grant and once at the end. In the first CLI-R that you complete, you will answer the questions with regard to your organization’s capacity at the time the PFS grant was awarded to you, even if your capacity has changed since that time. This will assist the evaluation team in determining whether your organization’s capacity changes from the beginning to the end of the PFS grant.
ORGANIZATIONAL RESOURCES
• In this section, we ask you to provide information on activities you have conducted to improve organizational resources related to PFS, including writing mission or vision statements, identifying goals and activities, hiring and training staff, identifying coalition leaders, improving cultural competency, securing additional funding, securing personal space, coordinating or improving technical resources, and coordinating data collection or management plans.
TRAINING AND TECHNICAL ASSISTANCE
• In this section, we ask you to provide information about areas in which you needed, requested, and/or received SPF-PFS-related guidance or T/TA during the past Federal fiscal year. Specifically, please select guidance and T/TA that contributed to your SPF-PFS activities.
– The Federal fiscal year is the period from October 1 through September 30.
Program Evaluation for Prevention: Partnerships for Success Community-Level Instrument Revised Guidance Manual
Program Evaluation for Prevention Contract – March 2017 2-4
– Check “Needed T/TA” if you recognized the need for T/TA in this area during the period. Check “Requested T/TA” if you made a request during the period. Check “Received T/TA” if you received the T/TA during the period. You may check all that apply: For example, if you needed, requested, and received T/TA in a specific area during the period, you may check all three boxes.
o If you received T/TA, you must provide the number of hours of T/TA that you received for that particular area.
• The T/TA areas can include needs and resource assessment, strategic plan development, building relationships, intervention selection, participant recruitment, intervention implementation, cultural competence, health disparities, evaluation, and sustainability.
RELATIONSHIP BUILDING
• This section collects information on partners you have identified to join your SPF-PFS partnership or participate in the planning and prevention activities, such as youth groups/representations, schools/school districts, parents/ family/caregiver groups, law enforcement agencies, and mental health professionals/agencies.
• In Question 25, you will provide information on the stakeholders that participate in your PFS activities.
– First you will report the number of representatives from each sector that are stakeholders or partner members in your PFS activities.
– Next you will report how many of these representatives were active during the 6-month reporting period. Note that this number should be smaller than or equal to the overall number of representatives for this sector that you reported in the previous field.
– Finally, you will report the average level of involvement during the 6-month period among these active members. (Note that you will report only on the involvement of those you reported as “active.”)
o Mark “Low” to indicate nominal activity during the 6 months, such as irregular meeting attendance or lending support on request. Mark “Medium” to indicate consistent and active participation in meetings or initiative support. Mark “High” to indicate active leadership, substantial contributions outside of meetings, or active involvement in intervention implementation.
DATA INFRASTRUCTURE
• This section collects information on which local data-related resources are available for your PFS efforts, such as local database to house community, program, or participant data, procedures for access to a state/jurisdiction/
Program Evaluation for Prevention: Partnerships for Success Community-Level Instrument Revised Guidance Manual
Program Evaluation for Prevention Contract – March 2017 2-5
tribal grantee database, and expertise of local stakeholders in understanding and using data.
• These may include resources that were developed through PFS as well as resources that existed before or were developed outside PFS efforts.
• Note that Questions 26 and 27 will only be completed twice: once at the beginning of the grant and once at the end. In the first CLI-R that you complete, you will answer the questions with regard to your local data-related resources and efforts at the time the PFS grant was awarded to you, even if your data resources have changed since that time. This will assist the evaluation team in determining whether your data infrastructure changes from the beginning to the end of the PFS grant.
SUSTAINABILITY
• In this section, you will be asked to provide information about things you have done to ensure that prevention intervention activities and outcomes continue once SPF-PFS funding ends.
• These efforts might focus on ensuring continued funding, structures, networks, partnerships, leadership, and resources.
2.2.3 Strategic Plan Development
This section collects information on the completion of your SPF-PFS strategic plan,
and whether the plan is revised during the PFS grant.
2.2.4 Prevention Intervention Implementation
This section collects information about the prevention interventions you
implemented as part of your PFS initiative in your community during the 6-month
reporting period. If you have not begun intervention implementation, you will check
“No” to Question 32 and skip the remainder of this section.
DETAILED GUIDANCE FOR REPORTING PREVENTION INTERVENTIONS
• If you and/or your partners delivered prevention interventions for your PFS initiative during the 6-month reporting period, you will first complete Question 33 (a-i). You will then be asked to complete a detailed sub-form for each of the intervention service types you reported.
• Note: We strongly advise that grantees have subrecipients complete a CLI-R Q33 worksheet in advance of entering Question 33 data into the PEP-C MRT
Program Evaluation for Prevention: Partnerships for Success Community-Level Instrument Revised Guidance Manual
Program Evaluation for Prevention Contract – March 2017 2-6
so that grantee staff or evaluator can review. It will be much easier to catch errors in advance, and some errors may hard for subrecipients to correct. A fillable Word document form for Question 33 is available on the Knowledge Base.
• First, you will need to determine which activities to report as interventions in the CLI-R. A prevention intervention is an activity or set of activities to which a group or community is exposed to change their behavior. For SPF-PFS, these activities should aim to prevent or lower the rate of underage alcohol use, prescription drug misuse, and related problems. If you are uncertain whether an activity is an intervention, Exhibit 2 provides examples of interventions for each of the CSAP Strategy Types, and more information can be found below that exhibit on types of activities that can be considered interventions within the CLI-R.
• The interventions reported in the CLI-R should be those that were selected and implemented for your PFS initiative.
– The interventions selected for PFS implementation fill gaps in existing resources and are typically funded through the PFS. However in some cases, an intervention could be selected for the PFS initiative, but as part of a sustainability effort the community has identified a way to supplant PFS funding for the intervention with external funds. This intervention would continue to be included in the CLI-R as long as it remains part of your PFS initiative, even if PFS no longer needs to contribute funds.
Q33a, b, c: Intervention Name, Service Type, and Service Type Name
• You will complete a separate CLI-R Prevention Intervention sub-form for each of the intervention service types you implement. It is important to list overall intervention service types, rather than listing each of your community’s activities (e.g., events, presentations, education program sessions) as separate prevention interventions or intervention service types.
– Remember that more does not equal better! In Q33 (a-i), do not list each cycle/location/activity connected with an intervention service type as a separate intervention or intervention service type.
– A key reason not list each cycle/location/activity as a separate intervention or intervention service type is that you must complete an entire separate sub-form for each intervention service type. This will be very burdensome and time-consuming for you, and at data cleaning you will be asked by the PEPC-C evaluation team to consolidate these into single intervention service type listings, creating additional work for you.
– If you are implementing an intervention multiple times, in multiple locations, or through multiple activities, do not worry: items within the sub-form will allow you to record this information. These items will allow
Program Evaluation for Prevention: Partnerships for Success Community-Level Instrument Revised Guidance Manual
Program Evaluation for Prevention Contract – March 2017 2-7
the evaluation to account for the related higher dosage or reach of your intervention.
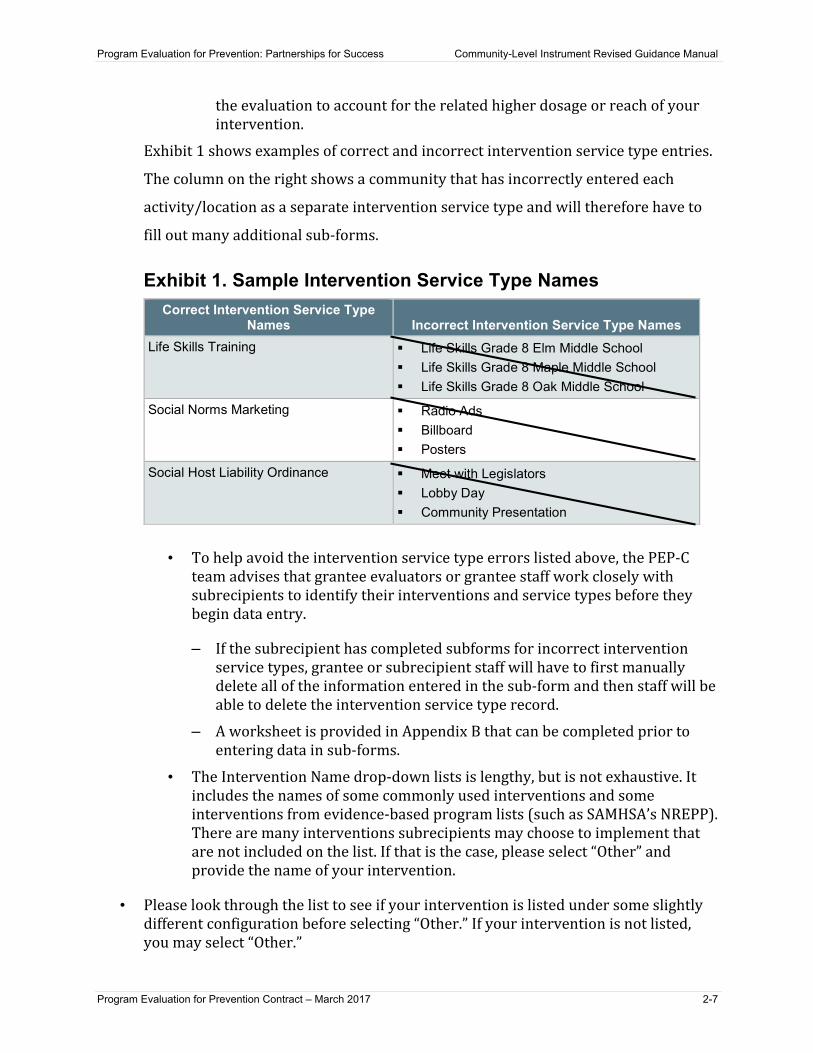
Exhibit 1 shows examples of correct and incorrect intervention service type entries.
The column on the right shows a community that has incorrectly entered each
activity/location as a separate intervention service type and will therefore have to
fill out many additional sub-forms.
Exhibit 1. Sample Intervention Service Type Names
• To help avoid the intervention service type errors listed above, the PEP-C team advises that grantee evaluators or grantee staff work closely with subrecipients to identify their interventions and service types before they begin data entry.
– If the subrecipient has completed subforms for incorrect intervention service types, grantee or subrecipient staff will have to first manually delete all of the information entered in the sub-form and then staff will be able to delete the intervention service type record.
– A worksheet is provided in Appendix B that can be completed prior to entering data in sub-forms.
• The Intervention Name drop-down lists is lengthy, but is not exhaustive. It includes the names of some commonly used interventions and some interventions from evidence-based program lists (such as SAMHSA’s NREPP). There are many interventions subrecipients may choose to implement that are not included on the list. If that is the case, please select “Other” and provide the name of your intervention.
• Please look through the list to see if your intervention is listed under some slightly different configuration before selecting “Other.” If your intervention is not listed, you may select “Other.”
Correct Intervention Service Type Names Incorrect Intervention Service Type Names
Life Skills Training Life Skills Grade 8 Elm Middle School Life Skills Grade 8 Maple Middle School Life Skills Grade 8 Oak Middle School
Social Norms Marketing Radio Ads Billboard Posters
Social Host Liability Ordinance Meet with Legislators Lobby Day Community Presentation
Program Evaluation for Prevention: Partnerships for Success Community-Level Instrument Revised Guidance Manual
Program Evaluation for Prevention Contract – March 2017 2-8
• Most often, the Intervention Name and Service Type Name will be the same. For example, for an evidence-based curriculum such as Life Skills Training, the name of the intervention (Life Skills Training) is also the Service Type Name. Similarly, for interventions such as media campaigns or compliance checks, the Intervention Name and Service Type Name will generally be the same.
• The Intervention Name and Service Type Name will only differ when an intervention is a multiple-component intervention that consists of activities of differing service types.
– For example, interventions such as Community Trials Intervention to Reduce High-Risk Drinking, Communities Mobilizing for Change on Alcohol (CMCA), and Communities that Care are planning model interventions that involve selecting and implementing specific intervention service types that each need to be reported in a separate sub-form.
– Through CMCA, for example, a community may decide to implement a media campaign, a retailer compliance check initiative, and a parenting program. Each of these would be reported as distinct intervention service types in separate subforms.
• See Appendix A for an example Q33 interventions table.
Q33d: Date Started
• In the Date Started field, record the date that you began committing resources to the intervention service type as part of your PFS initiative.
– This can include dedicating funding, resources, or time to activities to start up or prepare for the intervention (e.g. developing campaign materials, participating in training, hiring related personnel, obtaining materials, developing support).
– Note that if the intervention existed in the community prior to PFS, you will record the date started as part of your PFS initiative rather than the earlier date the intervention service type started in the community (e.g., through SPF SIG or other funds).
• What if no local PFS funds have been allocated for the intervention service type? For example, let’s say the state created media ads that they provided to the community, and the community garnered donated media outlet time.
– The intent is to record the date that local resources were first allocated. Resources may include salary costs, so those who contributed local staff time to implementing the media campaign should record the date these resources were allocated. If no local resources were allocated, just insert
Program Evaluation for Prevention: Partnerships for Success Community-Level Instrument Revised Guidance Manual
Program Evaluation for Prevention Contract – March 2017 2-9
the date the service type began local implementation as part of the PFS initiative.
• The accuracy of the Date Started field is important because the date will be used in a number of PFS analyses. For example, this date will be used to calculate the amount of time from the date subrecipients received PFS funding to the start of the first intervention. The date started also provides information about whether the community’s epidemiological data (Community Outcomes) timepoints (e.g., the date that a community’s student survey was administered) occur after or before the subrecipient began interventions.
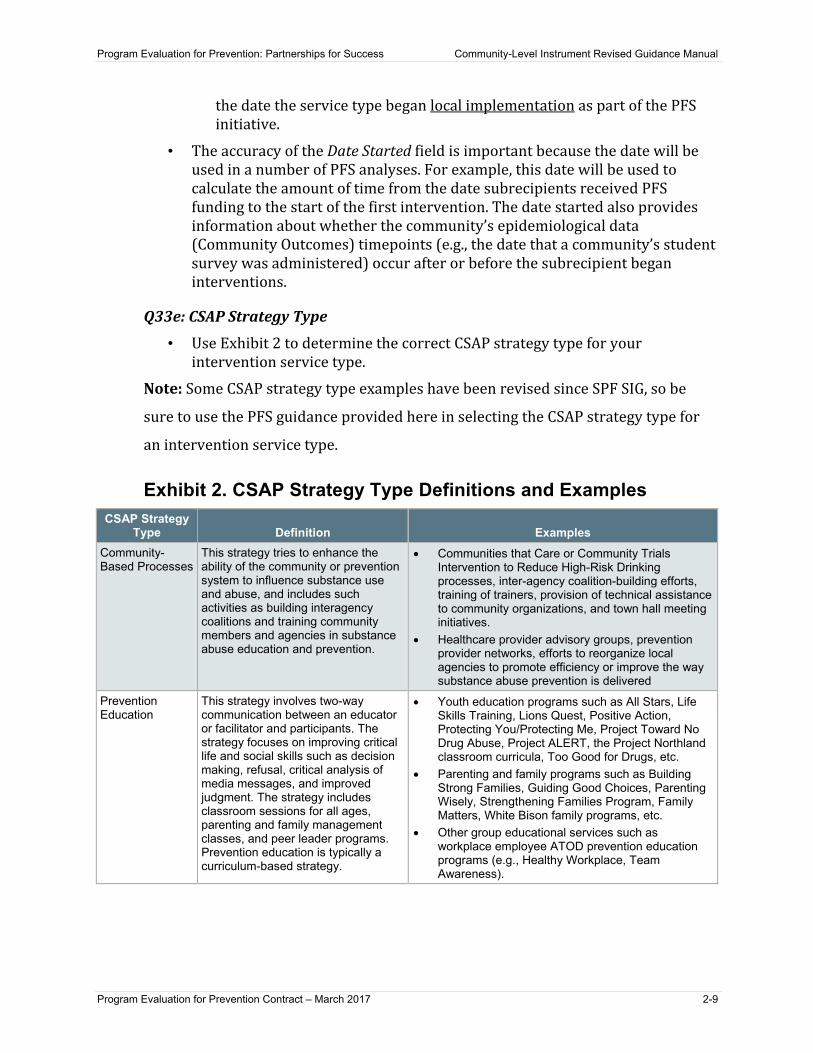
Q33e: CSAP Strategy Type
• Use Exhibit 2 to determine the correct CSAP strategy type for your intervention service type.
Note: Some CSAP strategy type examples have been revised since SPF SIG, so be
sure to use the PFS guidance provided here in selecting the CSAP strategy type for
an intervention service type.
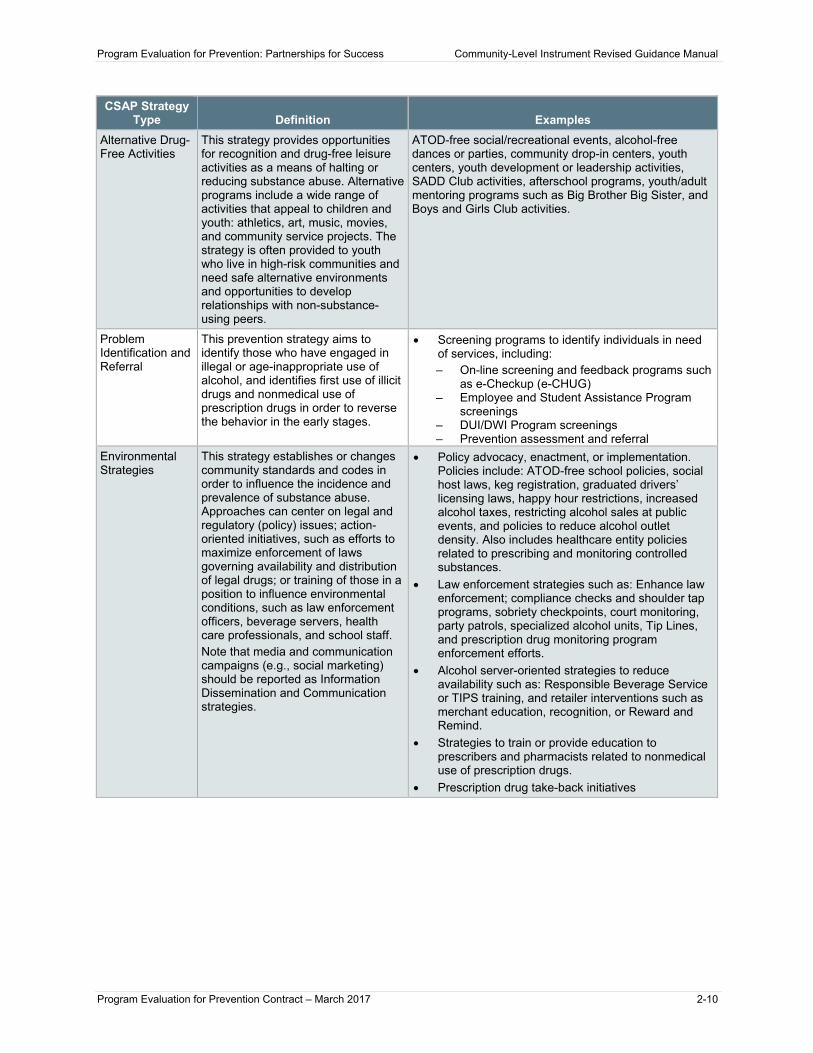
Exhibit 2. CSAP Strategy Type Definitions and Examples CSAP Strategy
Type Definition Examples Community-Based Processes
This strategy tries to enhance the ability of the community or prevention system to influence substance use and abuse, and includes such activities as building interagency coalitions and training community members and agencies in substance abuse education and prevention.
• Communities that Care or Community Trials Intervention to Reduce High-Risk Drinking processes, inter-agency coalition-building efforts, training of trainers, provision of technical assistance to community organizations, and town hall meeting initiatives.
• Healthcare provider advisory groups, prevention provider networks, efforts to reorganize local agencies to promote efficiency or improve the way substance abuse prevention is delivered
Prevention Education
This strategy involves two-way communication between an educator or facilitator and participants. The strategy focuses on improving critical life and social skills such as decision making, refusal, critical analysis of media messages, and improved judgment. The strategy includes classroom sessions for all ages, parenting and family management classes, and peer leader programs. Prevention education is typically a curriculum-based strategy.
• Youth education programs such as All Stars, Life Skills Training, Lions Quest, Positive Action, Protecting You/Protecting Me, Project Toward No Drug Abuse, Project ALERT, the Project Northland classroom curricula, Too Good for Drugs, etc.
• Parenting and family programs such as Building Strong Families, Guiding Good Choices, Parenting Wisely, Strengthening Families Program, Family Matters, White Bison family programs, etc.
• Other group educational services such as workplace employee ATOD prevention education programs (e.g., Healthy Workplace, Team Awareness).
Program Evaluation for Prevention: Partnerships for Success Community-Level Instrument Revised Guidance Manual
Program Evaluation for Prevention Contract – March 2017 2-10
CSAP Strategy Type Definition Examples
Alternative Drug-Free Activities
This strategy provides opportunities for recognition and drug-free leisure activities as a means of halting or reducing substance abuse. Alternative programs include a wide range of activities that appeal to children and youth: athletics, art, music, movies, and community service projects. The strategy is often provided to youth who live in high-risk communities and need safe alternative environments and opportunities to develop relationships with non-substance-using peers.
ATOD-free social/recreational events, alcohol-free dances or parties, community drop-in centers, youth centers, youth development or leadership activities, SADD Club activities, afterschool programs, youth/adult mentoring programs such as Big Brother Big Sister, and Boys and Girls Club activities.
Problem Identification and Referral
This prevention strategy aims to identify those who have engaged in illegal or age-inappropriate use of alcohol, and identifies first use of illicit drugs and nonmedical use of prescription drugs in order to reverse the behavior in the early stages.
• Screening programs to identify individuals in need of services, including: ‒ On-line screening and feedback programs such
as e-Checkup (e-CHUG) ‒ Employee and Student Assistance Program
screenings ‒ DUI/DWI Program screenings ‒ Prevention assessment and referral
Environmental Strategies
This strategy establishes or changes community standards and codes in order to influence the incidence and prevalence of substance abuse. Approaches can center on legal and regulatory (policy) issues; action-oriented initiatives, such as efforts to maximize enforcement of laws governing availability and distribution of legal drugs; or training of those in a position to influence environmental conditions, such as law enforcement officers, beverage servers, health care professionals, and school staff. Note that media and communication campaigns (e.g., social marketing) should be reported as Information Dissemination and Communication strategies.
• Policy advocacy, enactment, or implementation. Policies include: ATOD-free school policies, social host laws, keg registration, graduated drivers’ licensing laws, happy hour restrictions, increased alcohol taxes, restricting alcohol sales at public events, and policies to reduce alcohol outlet density. Also includes healthcare entity policies related to prescribing and monitoring controlled substances.
• Law enforcement strategies such as: Enhance law enforcement; compliance checks and shoulder tap programs, sobriety checkpoints, court monitoring, party patrols, specialized alcohol units, Tip Lines, and prescription drug monitoring program enforcement efforts.
• Alcohol server-oriented strategies to reduce availability such as: Responsible Beverage Service or TIPS training, and retailer interventions such as merchant education, recognition, or Reward and Remind.
• Strategies to train or provide education to prescribers and pharmacists related to nonmedical use of prescription drugs.
• Prescription drug take-back initiatives
Program Evaluation for Prevention: Partnerships for Success Community-Level Instrument Revised Guidance Manual
Program Evaluation for Prevention Contract – March 2017 2-11
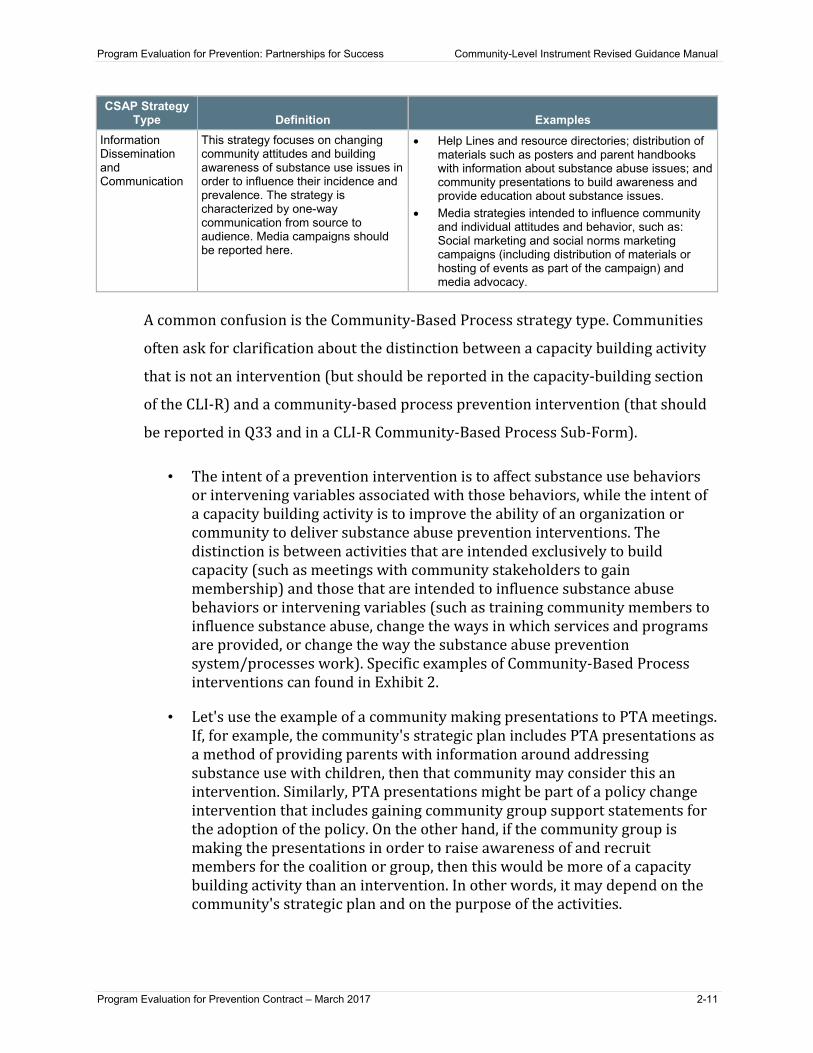
CSAP Strategy Type Definition Examples
Information Dissemination and Communication
This strategy focuses on changing community attitudes and building awareness of substance use issues in order to influence their incidence and prevalence. The strategy is characterized by one-way communication from source to audience. Media campaigns should be reported here.
• Help Lines and resource directories; distribution of materials such as posters and parent handbooks with information about substance abuse issues; and community presentations to build awareness and provide education about substance issues.
• Media strategies intended to influence community and individual attitudes and behavior, such as: Social marketing and social norms marketing campaigns (including distribution of materials or hosting of events as part of the campaign) and media advocacy.
A common confusion is the Community-Based Process strategy type. Communities
often ask for clarification about the distinction between a capacity building activity
that is not an intervention (but should be reported in the capacity-building section
of the CLI-R) and a community-based process prevention intervention (that should
be reported in Q33 and in a CLI-R Community-Based Process Sub-Form).
• The intent of a prevention intervention is to affect substance use behaviors or intervening variables associated with those behaviors, while the intent of a capacity building activity is to improve the ability of an organization or community to deliver substance abuse prevention interventions. The distinction is between activities that are intended exclusively to build capacity (such as meetings with community stakeholders to gain membership) and those that are intended to influence substance abuse behaviors or intervening variables (such as training community members to influence substance abuse, change the ways in which services and programs are provided, or change the way the substance abuse prevention system/processes work). Specific examples of Community-Based Process interventions can found in Exhibit 2.
• Let's use the example of a community making presentations to PTA meetings. If, for example, the community's strategic plan includes PTA presentations as a method of providing parents with information around addressing substance use with children, then that community may consider this an intervention. Similarly, PTA presentations might be part of a policy change intervention that includes gaining community group support statements for the adoption of the policy. On the other hand, if the community group is making the presentations in order to raise awareness of and recruit members for the coalition or group, then this would be more of a capacity building activity than an intervention. In other words, it may depend on the community's strategic plan and on the purpose of the activities.
Program Evaluation for Prevention: Partnerships for Success Community-Level Instrument Revised Guidance Manual
Program Evaluation for Prevention Contract – March 2017 2-12
Q33f: Institute of Medicine (IOM) Category
Universal direct interventions serve an identifiable group of participants (thus, the
interventions are direct) who have not been targeted on the basis of individual risk
(thus, interventions are universal). Universal direct interventions may involve
interpersonal and ongoing/repeated contact. Examples include school curricula,
afterschool programs, and parenting programs.
Universal indirect interventions also serve persons who have not been targeted on
the basis of individual risk, and thus are universal. However these interventions
affect populations as a whole (e.g., through Environmental Strategies or Information
Dissemination), rather than serving an identifiable group of participants (thus, the
interventions are indirect). Examples of universal indirect interventions include
establishing ATOD policies, conducting media campaigns, and modifying ATOD
advertising practices.
Selective interventions are targeted to individuals or a subgroup of the population
whose risk of developing substance abuse problems is significantly higher than
average. An example of a selective intervention is peer support groups for young
people with a history of family substance abuse.
Indicated interventions are designed for persons who are identified as having
minimal but detectable signs or symptoms or precursors of some illness or
condition, but whose condition is below the threshold of a formal diagnosis of the
condition. An example of an indicated population with respect to alcohol abuse
prevention would be students who have initiated binge drinking, because they are
at specific risk for developing long term substance abuse problems.
Q33g: Intervention Targets
The Intervention Targets field refers to the social sphere on which the intervention
is focused. For example, does the intervention work on changing individual young
people’s knowledge, skills, or attitudes? Does it instead try to change the people that
influence them (such as their parents or peers/friends)? Does it focus on
Program Evaluation for Prevention: Partnerships for Success Community-Level Instrument Revised Guidance Manual
Program Evaluation for Prevention Contract – March 2017 2-13
institutional or organizational change (e.g. changing school policies, educating
health care providers in medical organizations)? Does it focus on changing
community norms (e.g. with a social norms campaign)? Does it focus directly on
changing laws or policies?
Q33h: Status
The Status field serves an important function within the online system: Designation
of an intervention service type as “Active” lets the system know that you need to
enter CLI-R data for this intervention service type during that reporting period.
• Active: If you implemented the intervention service type during this reporting period, the status will need to be “Active” in order for the system to allow you to enter CLI-R data. Likewise, the system will not allow you to submit your CLI-R if you have failed to complete a subform for an intervention service type listed as “Active.”
• Inactive: If in a future reporting period, you have no CLI-R data to report for an intervention service type because it was not implemented during the period, then you will need to change the designation to “Inactive.” For example, a student prevention education program may be offered in November of each school year. The Status field should be set to “Active” when submitting the October-March CLI-R reporting period (due June 1) and set to “Inactive” when submitting the April-September CLI-R reporting period (due December 1). Recall that if an intervention began with PFS support but is now being implemented through funding from a different source, it should still be considered active for PFS.
• Completed: If you have no CLI-R data to report for an intervention service type because the implementation of the service type for your initiative was completed prior to the reporting period, and you will no longer be implementing the service type, set the status to “Completed.” For example, you may have implemented a policy change initiative and the policy was successfully implemented such that you do not anticipate any further work on this intervention service type. Recall that if an intervention began with PFS support but is now being implemented through funding from a different source, it should still be considered active for PFS.
• Discontinued: If you have no CLI-R data to report for an intervention service type because the intervention service type has been discarded as part of your PFS initiative, set the status to “Discontinued.”
Program Evaluation for Prevention: Partnerships for Success Community-Level Instrument Revised Guidance Manual
Program Evaluation for Prevention Contract – March 2017 2-14
Q33 Example Table
See Appendix A for an example table showing completed fields for Q33 (a-i).
FUNDING INFORMATION
Questions 34a-m address funding your organization received for substance abuse
prevention in the past Federal fiscal year (from October 1 to September 30). Note
that this section is not specific to the interventions reported in Q33, but rather
addresses funding received for your substance abuse prevention efforts as a whole.
First you will report the total dollar amount your organization received for
substance use prevention from each funding source (if applicable). For each
relevant funding source, you will then report whether any of the total funding was
used for PFS activities, and if so, the amount used for PFS activities. Note that the
amount of the funding source used for PFS activities should be smaller than or equal
to the total amount your organization received for substance use prevention from
that funding source.
In questions 34a-m, do not include funding received by other organizations in your
coalition or group unless those funds are used for PFS activities. You will include
funding that your partner organizations have received that is used specifically for
your PFS initiative’s activities. If you are reporting funding received by a partner
organization, you will report only the amount used for PFS activities; therefore the
amounts reported in the first column (total amount) and the third column (amount
used for PFS) will be identical.
PREVENTION INTERVENTION INFORMATION
In this section, you will provide information about the prevention targets (for
example, consumption patterns) targeted by the intervention, evidence base for the
intervention, and history of the intervention in your community. Questions 35-38
will be reported for the intervention as a whole rather than for each intervention
service type separately.

Program Evaluation for Prevention: Partnerships for Success Community-Level Instrument Revised Guidance Manual
Program Evaluation for Prevention Contract – March 2017 2-15
In Questions 39a-g, you will address each intervention service type separately, and
will report the location(s) targeted by the intervention service type, information
about the geographic area, and the estimated target population for the targeted
area.
Q39a: Location
In Question 39 (a-g) you will report the location or locations in which you are
implementing the intervention service type, and provide information such as the
estimated target population size for each location. For example, let’s say you are
implementing a youth prevention curriculum for students in Grades 7 and 8 in four
schools in your community. You would list each school as a separate location, and
under Q39g (estimated target population size) you would record the number of
Grade 7 and 8 students (combined) for each of the schools.
For population-based intervention service types (such as Environmental Strategies),
delineating locations and estimating target population sizes may challenging, and
communities should work with their grantee evaluator to complete this section as
accurately as possible. If you are implementing a countywide policy change
initiative, for example, you may record only one location—X county—whereas if you
are implementing a policy change initiative in three communities within a county,
you would record each of the three communities as a separate location.
Let’s take another example: let’s say you are implementing an intervention service
type of alcohol retailer compliance checks. In this case, rather than list each retail
outlet that received a compliance check as a separate location, you will list each
targeted geographic area (which could be an entire county, an entire town, or could
be specific neighborhoods within a city) as a location.
Q39g: Estimated Target Population Size
Question 39g is an important field for the cross-site evaluation, and one that may
require some research and assistance from your evaluator to complete. For each
location reported in Q39a, you will record the estimated size of the population you
Program Evaluation for Prevention: Partnerships for Success Community-Level Instrument Revised Guidance Manual
Program Evaluation for Prevention Contract – March 2017 2-16
are targeting with the intervention service type. This information will help the
cross-site evaluation calculate penetration rates for the intervention service type: in
other words, this number tells us how many people you would like to reach (or
could possibly reach) with the intervention service type, and later in the CLI you will
tell us how many of those you actually reached.
How you go about estimating the target population size will vary depending on your
intervention service type and the data you have available. For example, a school
district can provide you with enrollment numbers for each of the schools you are
reaching with a prevention education curriculum. You may be able to use Census
information to estimate the targeted population within your geographic area(s), or
information may be available from local partner agencies, government entities, or
the grantee’s Epidemiological Outcomes Workgroup. Remember that you are
reporting a separate target population size for each location that you listed.
Keep in mind that the target population of the intervention service type area(s) is
likely smaller than the total population in the community. For example, if 10,000
individuals live in the area (total population), but only 3,000 of those are in the
target 12- to 20-year-old age group for this intervention service type, your
estimated target population is 3,000. If your target population for this intervention
service type is more specific (e.g., Hispanic high school students or non-college
youth aged 18 to 20), your target population number would be even smaller (e.g.,
200). Your grantee evaluator may be able to assist you with locating appropriate
sources of information for your local estimates.
Q39a-g Example Tables
Below we provide examples of completed tables for a number of different
intervention service types.
Youth Curriculum Example. The community below is a county that is implementing
a youth prevention curriculum for students in specific grades in four schools in the
county. They have listed each school as a separate location. They received
Program Evaluation for Prevention: Partnerships for Success Community-Level Instrument Revised Guidance Manual
Program Evaluation for Prevention Contract – March 2017 2-17
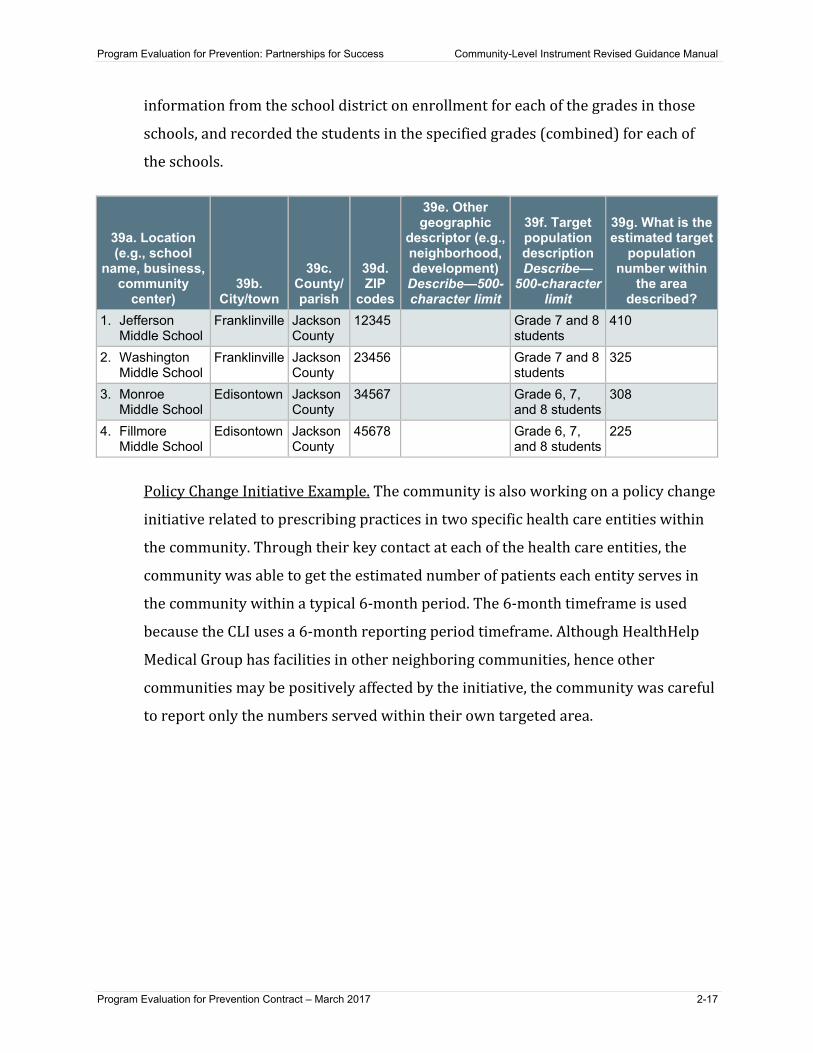
information from the school district on enrollment for each of the grades in those
schools, and recorded the students in the specified grades (combined) for each of
the schools.
39a. Location (e.g., school
name, business, community
center) 39b.
City/town
39c. County/ parish
39d. ZIP
codes
39e. Other geographic
descriptor (e.g., neighborhood, development)
Describe—500-character limit
39f. Target population description Describe—
500-character limit
39g. What is the estimated target
population number within
the area described?
1. Jefferson Middle School
Franklinville Jackson County
12345 Grade 7 and 8 students
410
2. Washington Middle School
Franklinville Jackson County
23456 Grade 7 and 8 students
325
3. Monroe Middle School
Edisontown Jackson County
34567 Grade 6, 7, and 8 students
308
4. Fillmore Middle School
Edisontown Jackson County
45678 Grade 6, 7, and 8 students
225
Policy Change Initiative Example. The community is also working on a policy change
initiative related to prescribing practices in two specific health care entities within
the community. Through their key contact at each of the health care entities, the
community was able to get the estimated number of patients each entity serves in
the community within a typical 6-month period. The 6-month timeframe is used
because the CLI uses a 6-month reporting period timeframe. Although HealthHelp
Medical Group has facilities in other neighboring communities, hence other
communities may be positively affected by the initiative, the community was careful
to report only the numbers served within their own targeted area.

Program Evaluation for Prevention: Partnerships for Success Community-Level Instrument Revised Guidance Manual
Program Evaluation for Prevention Contract – March 2017 2-18
39a. Location (e.g., school
name, business, community
center) 39b.
City/town
39c. County/ parish
39d. ZIP
codes
39e. Other geographic
descriptor (e.g., neighborhood, development)
Describe—500-character limit
39f. Target population description Describe—
500-character
limit
39g. What is the estimated target
population number within
the area described?
1. HealthHelp Medical Group
Franklinville Jackson County
12345 Patients served by HealthHelp in Franklinville
550
2. Goodcare Medical Center
Edisontown Jackson County
34567 Patients served by Goodcare in Edisontown
120
Alcohol Retail Compliance Check Example. Finally, the community is also
implementing a retailer compliance check initiative throughout two towns, with the
goal of reducing retail access to alcohol among youth aged 15-20. They listed each
town as a separate location. With help from their evaluator, they located Census
information on the Census FactFinder website
(http://factfinder.census.gov/faces/nav/jsf/pages/index.xhtml) and estimated the
number of youth in each community in that age range. Because the Census age
ranges do not match their target age for this intervention service type, they needed
to make some calculations. The Census reports numbers for age 15-19 and for age
20-24. To estimate the number of youth age 20, they divided the number in the age
20-24 category by 5 (since 5 ages are represented). They then added this
approximate number of youth aged 20 to the number of youth in the age 15-19
category.
39a. Location (e.g., school
name, business, community
center) 39b.
City/town
39c. County/ parish
39d. ZIP
codes
39e. Other geographic
descriptor (e.g., neighborhood, development)
Describe—500-character limit
39f. Target population description Describe—
500-character
limit
39g. What is the estimated target
population number within
the area described?
1. Franklinville Franklinville Jackson County
12345 Implemented throughout town
Youth aged 15-20
3,640
2. Edisontown Edisontown Jackson County
34567 Implemented throughout town
Youth aged 15-20
1,572
Program Evaluation for Prevention: Partnerships for Success Community-Level Instrument Revised Guidance Manual
Program Evaluation for Prevention Contract – March 2017 2-19
Media Campaign Example. The community is also implementing a media campaign
aimed at parents of high school-aged youth throughout the entire county. The school
district does have information on the approximate number of parents of high-school
aged students, but this county has very high dropout rates and the community also
has concerns about the accuracy of the parent information since only parents with
email addresses were included. The community decided to use Census data to
estimate the target population, using estimates of the number of youth aged 14-18
in the community and then multiplying by .5 to approximate the number of parents
of these children. Census data show that in the U.S. the average number of children
per two-parent family is two, while the average number of children per single-
parent family is somewhat lower, around 1.75
(https://www.census.gov/topics/families/families-and-households.html). Because
the community has large numbers of single-parent families and somewhat larger
family size, they have multiplied by .5, indicating their estimate that there are
approximately two children in the target age group per parent.
With help from their evaluator, the community located Census information on the
Census FactFinder website
(http://factfinder.census.gov/faces/nav/jsf/pages/index.xhtml) and estimated the
number of youth aged 14-18. Because the Census age ranges do not match this
target age, they needed to make some calculations.
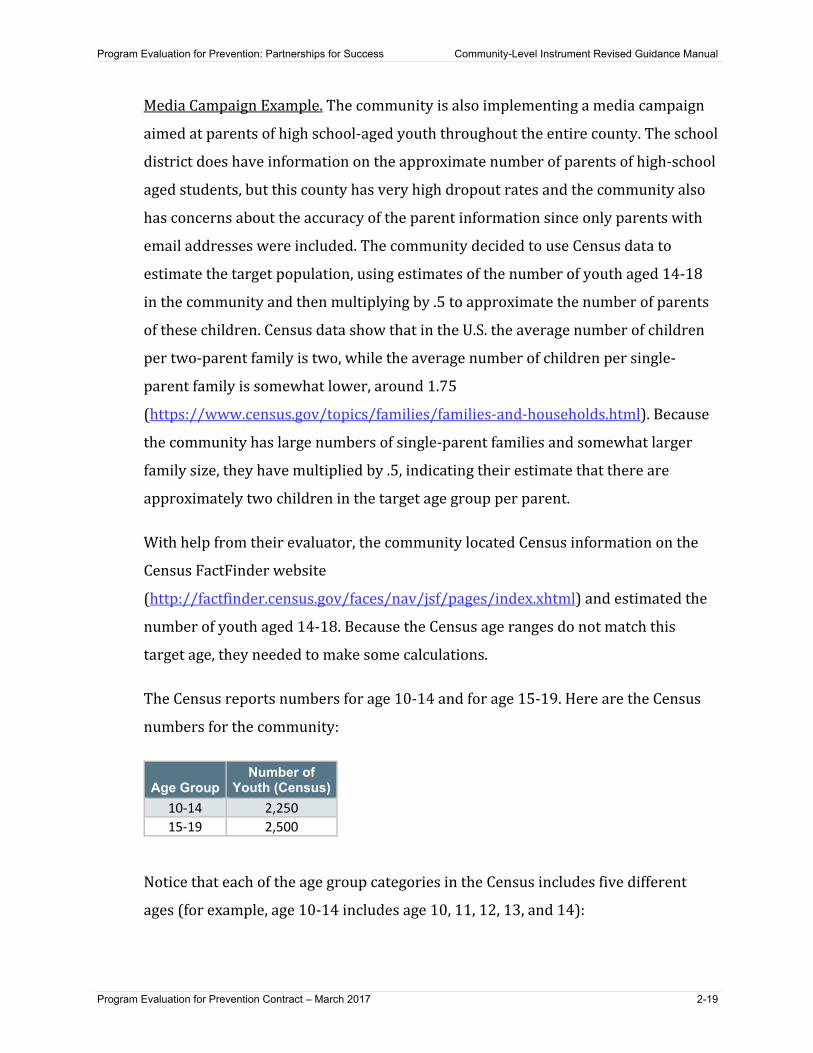
The Census reports numbers for age 10-14 and for age 15-19. Here are the Census
numbers for the community:
Age Group Number of
Youth (Census) 10-14 2,250 15-19 2,500
Notice that each of the age group categories in the Census includes five different
ages (for example, age 10-14 includes age 10, 11, 12, 13, and 14):

Program Evaluation for Prevention: Partnerships for Success Community-Level Instrument Revised Guidance Manual
Program Evaluation for Prevention Contract – March 2017 2-20
Age Group Number of Ages
within this Age Group Number of
Youth (Census) 10-14 5 2,250 15-19 5 2,500
First, the community divided the number of youth in the age group (third column)
by the number of ages in the age group (second column) to get an estimated number
of youth per age.
Age Group Number of Ages
within this Age Group Number of
Youth (Census) Estimated Number of Youth Per Age
10-14 5 2,250 450 15-19 5 2,500 500
Next they added together the estimated number of youth in each of the ages from
age 14 to 18. As seen below, they estimated that the number of youth aged 14-18 is
2,450.
Age/Age Group
Number of Youth (Census)
14 450 15 500 16 500 17 500 18 500
14-18 2,450
Finally, the community multiplied the number of youth aged 14-18 (2,450) times .5,
to approximate the number of parents per youth.
39a. Location (e.g., school
name, business,
community center)
39b. City/town
39c. County/ parish
39d. ZIP
codes
39e. Other geographic
descriptor (e.g., neighborhood, development)
Describe—500-character limit
39f. Target population description Describe—
500-character limit
39g. What is the estimated target
population number within
the area described?
1. Countywide Jackson County
Implemented throughout the entire county
Parents of high school-aged youth
1,225
Program Evaluation for Prevention: Partnerships for Success Community-Level Instrument Revised Guidance Manual
Program Evaluation for Prevention Contract – March 2017 2-21
DEMOGRAPHICS ITEMS IN THE CLI-R SUB-FORMS
Within each of the CLI-R sub-forms you will report the number of people served (for
individual direct service interventions) or estimate the number of people reached or
affected (for population-based interventions). More detail about reporting numbers
served or reached can be found in the guidance for each sub-form below. If you are
reaching people through population-based interventions (such as Environmental
Strategies), you will need to use your best judgment about the demographics of the
population (for example, racial/ethnic identity) based on the available data sources
and what you know of the service area targeted by your intervention service type.
Remember that you need to report this information in terms of the number reached
for each of those demographic groups (not percentages). The total that you report
for each demographic variable should equal the reported total number of new
participants reached or affected by that particular intervention service type during
the past 6 months. See the “Example Race and Ethnicity Demographics Items”
below.
• Estimates based on Census information may be a helpful source (http://factfinder.census.gov/faces/nav/jsf/pages/index.xhtml) for information about gender and racial and ethnic identity.
– You will need to use the Advanced Search section for the more detailed racial subcategories for Asian and Native Hawaiian populations (and these estimates may not be available for all communities).
– Age grouping will need to be estimated since the age categories in the Census do not match those in the CLI-R.
– The American Community Survey (available through the Census factfinder link) provides information about language spoken at home. For the item about how well English is spoken, only the “Very Well” category is provided (and all other categories are combined); you may insert the number in the “Very Well” category and put the remainder of the population in the Unknown category.
– The Advanced Search section will provide information about specific disability categories for many communities.
– Military status is not provided in the level of detail reflected in the CLI-R.
– Note that most of the more detailed information (such as disability status) is provided for the general population or for adults and children
Program Evaluation for Prevention: Partnerships for Success Community-Level Instrument Revised Guidance Manual
Program Evaluation for Prevention Contract – March 2017 2-22
separately rather than for specific targeted age groups, so these general estimates will need to be used.
• Information about military status in your community may be available from military and veteran- serving institutions in your community (for example, the Veteran’s Administration, veteran’s service organizations or clubs),
• If you are implementing a media campaign, the media companies involved (e.g., radio or television station, newspaper) may have demographic information for their audience.
If you are implementing individual direct service interventions (such as Prevention
Education), your best source of information will likely be gathering demographic
information directly from intervention participants.
In the past, some tribal grantees have reported that many of the people served are
of mixed heritage, such as Native American and White. In the words of one grantee:
Since it’s clear from the instructions that we cannot put participants in more than one
race category in filling out this section, we are not sure what to do. We are concerned
that categorizing our service recipients as Multiracial makes them invisible as Native
Americans.
• The demographics items are intended to capture participants’ primary self-identification, rather than a more detailed breakdown of their heritage. If participants self-identify as Multiracial, this would be an appropriate category for those individuals. Participants who self-identify as Native American should be included in the American Indian/Alaska Native category regardless of other factors (e.g., blood quantum, CDIB, or enrollment in a federally recognized tribe).
Example Race and Ethnicity Demographics Items
Let’s say your community is implementing alcohol retailer compliance checks (an
Environmental Strategy) and has reported in Question 133b reaching or affecting
5,620 young people in the targeted age group during the reporting period. (Question
133a provides the estimated total during the first half of the fiscal year, while
Question 133b will appear in the second half of the fiscal year as the total new to the
period.) Next, you will report demographics estimates, including items on race and
Hispanic ethnicity. Remember that the total across all categories (not including
Program Evaluation for Prevention: Partnerships for Success Community-Level Instrument Revised Guidance Manual
Program Evaluation for Prevention Contract – March 2017 2-23
subcategories such as the specific Asian nationalities) will need to equal 5,620, the
number reached in Question 133b.
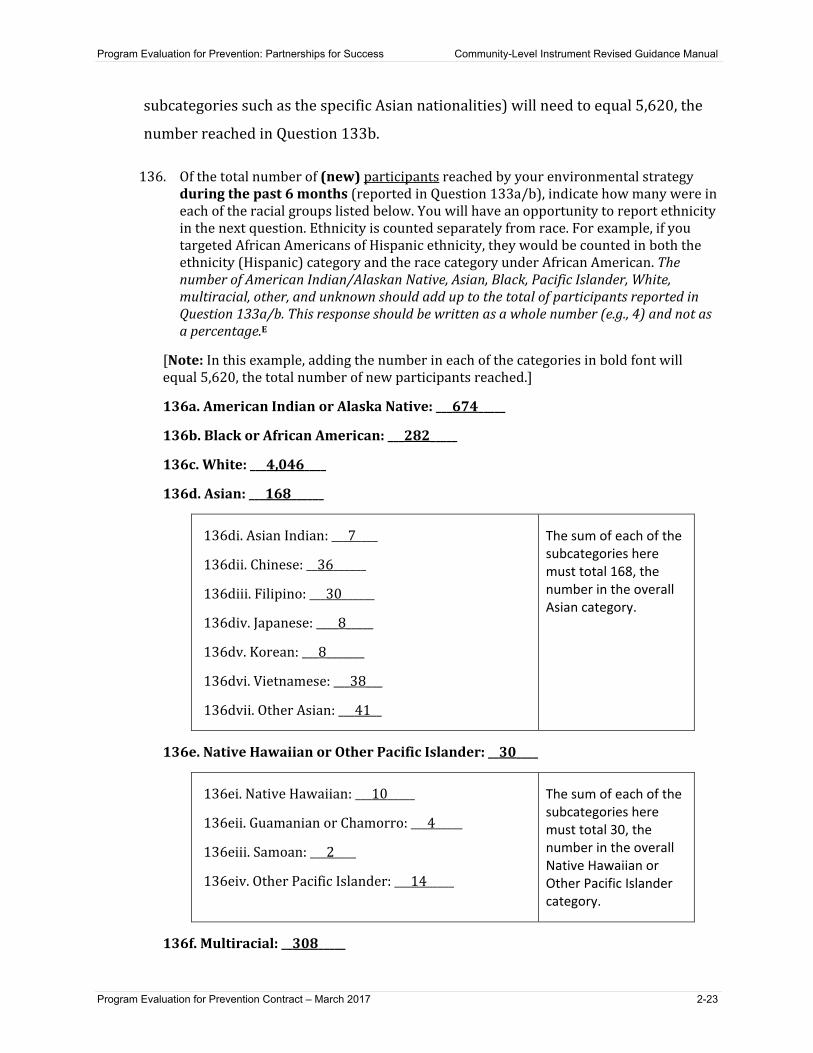
136. Of the total number of (new) participants reached by your environmental strategy during the past 6 months (reported in Question 133a/b), indicate how many were in each of the racial groups listed below. You will have an opportunity to report ethnicity in the next question. Ethnicity is counted separately from race. For example, if you targeted African Americans of Hispanic ethnicity, they would be counted in both the ethnicity (Hispanic) category and the race category under African American. The number of American Indian/Alaskan Native, Asian, Black, Pacific Islander, White, multiracial, other, and unknown should add up to the total of participants reported in Question 133a/b. This response should be written as a whole number (e.g., 4) and not as a percentage.E
[Note: In this example, adding the number in each of the categories in bold font will equal 5,620, the total number of new participants reached.]
136a. American Indian or Alaska Native: ___674_____
136b. Black or African American: ___282_____
136c. White: ___4,046____
136d. Asian: ___168______
136di. Asian Indian: ___7____
136dii. Chinese: __36______
136diii. Filipino: 30___ ______
136div. Japanese: ____8_____
136dv. Korean: ___8_______
136dvi. Vietnamese: ___38___
136dvii. Other Asian: ___41__
The sum of each of the subcategories here must total 168, the number in the overall Asian category.
136e. Native Hawaiian or Other Pacific Islander: 30 __ ____
136ei. Native Hawaiian: ___10_____
136eii. Guamanian or Chamorro: ___4_____
136eiii. Samoan: ___2____
136eiv. Other Pacific Islander: ___14_____
The sum of each of the subcategories here must total 30, the number in the overall Native Hawaiian or Other Pacific Islander category.
136f. Multiracial: __308_____
Program Evaluation for Prevention: Partnerships for Success Community-Level Instrument Revised Guidance Manual
Program Evaluation for Prevention Contract – March 2017 2-24
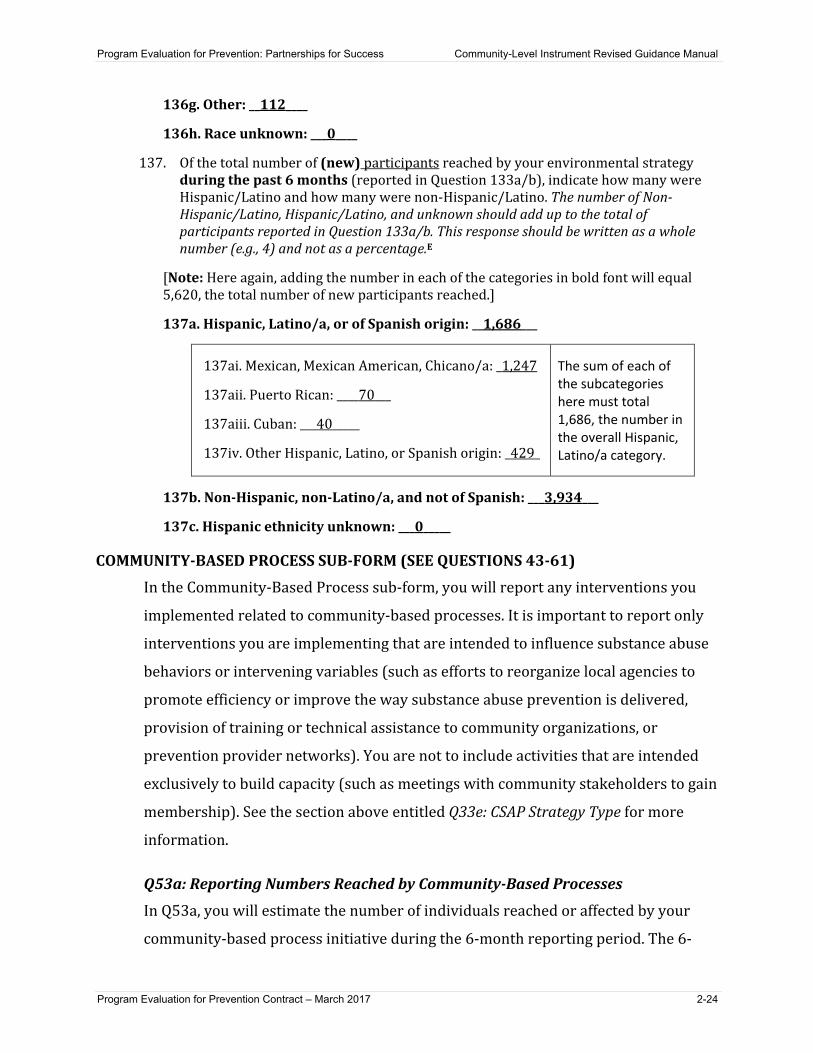
136g. Other: __112____
136h. Race unknown: ___0____
137. Of the total number of (new) participants reached by your environmental strategy during the past 6 months (reported in Question 133a/b), indicate how many were Hispanic/Latino and how many were non-Hispanic/Latino. The number of Non-Hispanic/Latino, Hispanic/Latino, and unknown should add up to the total of participants reported in Question 133a/b. This response should be written as a whole number (e.g., 4) and not as a percentage.E
[Note: Here again, adding the number in each of the categories in bold font will equal 5,620, the total number of new participants reached.]
137a. Hispanic, Latino/a, or of Spanish origin: 1,686 __ ___
137ai. Mexican, Mexican American, Chicano/a: _1,247
137aii. Puerto Rican: 70____ ___
137aiii. Cuban: ___40_____
137iv. Other Hispanic, Latino, or Spanish origin: _429_
The sum of each of the subcategories here must total 1,686, the number in the overall Hispanic, Latino/a category.
137b. Non-Hispanic, non-Latino/a, and not of Spanish: ___3,934___
137c. Hispanic ethnicity unknown: ___0_____
COMMUNITY-BASED PROCESS SUB-FORM (SEE QUESTIONS 43-61)
In the Community-Based Process sub-form, you will report any interventions you
implemented related to community-based processes. It is important to report only
interventions you are implementing that are intended to influence substance abuse
behaviors or intervening variables (such as efforts to reorganize local agencies to
promote efficiency or improve the way substance abuse prevention is delivered,
provision of training or technical assistance to community organizations, or
prevention provider networks). You are not to include activities that are intended
exclusively to build capacity (such as meetings with community stakeholders to gain
membership). See the section above entitled Q33e: CSAP Strategy Type for more
information.
Q53a: Reporting Numbers Reached by Community-Based Processes
In Q53a, you will estimate the number of individuals reached or affected by your
community-based process initiative during the 6-month reporting period. The 6-

Program Evaluation for Prevention: Partnerships for Success Community-Level Instrument Revised Guidance Manual
Program Evaluation for Prevention Contract – March 2017 2-25
month reporting periods are October 1-March 31 and April 1-September 30. The
number reached goes beyond the individual community members who participated
in these activities to the targeted community members affected by the related
changes. Unlike direct service types (e.g., prevention education curricula), which
reach individual participants, community-based process initiatives are intended to
affect populations, and therefore the numbers affected will be estimates rather than
exact counts.
• In Q53a, you will record the estimated number in the target population expected to be affected by the intervention service type. For example, let’s say your community is implementing a college collaboration task force to improve communication between a local college, law enforcement, and neighboring businesses with the goal of reducing binge drinking among college students. The number reached or affected would be the estimated target population size: the number of college students attending the targeted college.
• Note that the number reached by a single intervention service type should generally be smaller than or equal to the estimated target population you reported earlier in Q39g. For example, let’s say that adding across all of the locations you reported in Q39, the estimated target population size was 4,500. You would generally expect that the largest number you would reach in this target population with this intervention service type would be 4,500.
Q53b: Number of New Individuals Reached by Community-Based Processes
In the CLI-R submission for the second half of the Federal fiscal year (the period
April 1-Sept 30; CLI-R due December 1), Question 53b must also be answered. The
item asks, of the total reached or affected by the intervention service type (the total
reported in Q53a), how many of these were new to this second half of the Federal
fiscal year.
• The intent of this item is to enable the cross-site evaluation to calculate within each intervention service type a cumulative, unduplicated number of individuals who received or were affected by the intervention service type during the Federal fiscal year.
• For example, let’s say your community is implementing a college collaboration task force to improve communication between a local college, law enforcement, and neighboring businesses with the goal of reducing binge drinking among college students. The target population is the number of

Program Evaluation for Prevention: Partnerships for Success Community-Level Instrument Revised Guidance Manual
Program Evaluation for Prevention Contract – March 2017 2-26
students attending the college: 1,500. The initiative was implemented in both reporting periods of the Federal fiscal year (October-March and April-September). In the CLI-R for the first half of the fiscal year (October-March), you report in Q53a that you reached 1,500 with this intervention service type. In the CLI-R for the second half of the fiscal year (April-September), you would again report in Q53a that you reached 1,500 with this intervention service type. Next you would report in Q53b that you reached 0 new individuals, since you already reported reaching (approximately) the same 1,500 people last period.
– If the initiative was expanded in April–September to include a neighboring community college that enrolls 500, then you would report 2,000 in Q53a and in Q53b you would report 500 new people reached. In this instance, you would also need to remember to add the additional college to the Prevention Intervention Information section, Q39a-g.
– If, on the other hand, the intervention service type just started in the second half of the fiscal year, so this is the first time you are reporting reaching that 1,500 in Q53a, then Q53b would be 1,500 (all are "new" to you).
PREVENTION EDUCATION SUB-FORM (SEE QUESTIONS 62-77)
In the Prevention Education sub-form, you will report education programs that are
designed to reduce substance use risk or enhance protective factors, for example
through youth, parent, or employee curricula.
Q69a: Reporting Numbers Reached by Prevention Education
In Q69a, you will report the number of individuals served by your prevention
education program during the 6-month reporting period. The 6-month reporting
periods are October 1-March 31 and April 1-September 30.
• In Q69a, you will record the number served by the intervention service type. For example, let’s say your community is implementing an evidence-based curriculum for students in grade 9 in two schools, and the program served 200 students during the reporting period across the two schools. In Q69a, you would report 200 as the number served.
• Note that the number reached by a single intervention service type should generally be smaller than or equal to the estimated target population you reported earlier in Q39g. For example, let’s say that adding across all of the locations you reported in Q39, the target population size (e.g., the number of grade 9 students at the targeted high schools) was 400. You would generally
Program Evaluation for Prevention: Partnerships for Success Community-Level Instrument Revised Guidance Manual
Program Evaluation for Prevention Contract – March 2017 2-27
expect that the largest number you would reach in this target population with this intervention service type would be 400.
Q69b: Number of New Individuals Reached by Prevention Education
In the CLI-R submission for the second half of the Federal fiscal year (the period
April 1-Sept 30; CLI-R due December 1), Question 69b must also be answered. The
item asks, of the total served by the intervention service type (the total reported in
Q69a), how many of these were new to this second half of the Federal fiscal year.
• The intent of this item is to enable the cross-site evaluation to calculate within each intervention service type a cumulative, unduplicated number of individuals who received the intervention service type during the Federal fiscal year.
• For example, let’s say your community is implementing an evidence-based curriculum for students in grade 9 in two schools, and the program was provided to 200 students in the first half of the Federal fiscal year (October-March) and a different 100 students in the second half of the Federal fiscal year (April-September). In the CLI-R for the first half of the fiscal year (October-March), you reported in Q69a that you served 200 with this intervention service type. In the CLI-R for the second half of the fiscal year (April-September), you reported in Q69a that you served 100 with this intervention service type. Next you would report in Q69b that you served 100 new individuals, since the 100 served in the second half of the fiscal year are not the same grade 9 students who received the program in the first half of the fiscal year.
– If, on the other hand, the intervention service type just started in the second half of the fiscal year, so this is the first time you are reporting serving that 100 in Q69a, then Q69b would be 100 (all are "new" to you).
– If the initiative was expanded in April–September to include a third school you will also need to remember to add the additional school to the Prevention Intervention Information section, Q39a-g.
ALTERNATIVE DRUG-FREE ACTIVITIES SUB-FORM (SEE QUESTIONS 78-97)
In the Alternative Drug-Free Activities sub-form, you will report intervention
service types designed to provide drug-free social and recreational activities. The
intervention service type may be targeted to identifiable participants, such as
through an ongoing afterschool club or mentoring program, or it may be delivered
to populations as a whole rather than identifiable participants, such as through a
series of events or fairs.
Program Evaluation for Prevention: Partnerships for Success Community-Level Instrument Revised Guidance Manual
Program Evaluation for Prevention Contract – March 2017 2-28
• Recall that if you are implementing a series of single (one-time) events for your target population, you will record these as one intervention service type in Q33 and complete one sub-form, rather than listing each event as a separate intervention service type. You will be able to report on the overall number of events in Q84 and in Q88.
Q89a: Reporting Numbers Reached by Alternative Drug-Free Activities
In Q89a, you will report the number of individuals served or reached by your
alternative drug-free activities initiative during the 6-month reporting period. The
6-month reporting periods are October 1-March 31 and April 1-September 30. If you
are implementing an alternative activities initiative that reaches populations rather
than identifiable participants, the numbers served or reached may be estimates
rather than exact counts.
• In Q89a, you will record the number served or reached by the intervention service type. For example, let’s say your community is implementing an afterschool club for middle school youth in two schools, and the club served 250 students during the reporting period across the two schools. In Q89a, you would report 250 as the number served.
• Note that the number reached by a single intervention service type should generally be smaller than or equal to the estimated target population you reported earlier in Q39g. For example, let’s say that adding across all of the locations you reported in Q39, the target population size (e.g., the number of students at the targeted middle schools) was 4,500. You would generally expect that the largest number you would reach in this target population with this intervention service type would be 4,500.
Q89b: Number of New Individuals Reached by Alternative Drug-Free Activities
In the CLI-R submission for the second half of the Federal fiscal year (the period
April 1-Sept 30; CLI-R due December 1), Question 89b must also be answered. The
item asks, of the total served or reached by the intervention service type (the total
reported in Q89a), how many of these were new to this second half of the Federal
fiscal year.
• The intent of this item is to enable the cross-site evaluation to calculate within each intervention service type a cumulative, unduplicated number of individuals who received the intervention service type during the Federal fiscal year.
Program Evaluation for Prevention: Partnerships for Success Community-Level Instrument Revised Guidance Manual
Program Evaluation for Prevention Contract – March 2017 2-29
• For example, let’s say your community is implementing an afterschool club for middle school youth in two schools, and the club served 250 students throughout the school year. The club was implemented in both reporting periods of the Federal fiscal year (October-March and April-September). In the CLI-R for the first half of the fiscal year (October-March), you reported in Q89a that you served 250 with this intervention service type. In the CLI-R for the second half of the fiscal year (April-September), you again reported in Q89a that you served 250 with this intervention service type. Next you would report in Q89b that you served 0 new individuals, since you already reported serving the same 250 youth last period.
– If the initiative was expanded in April–September to include a third school in which 50 students participated in the club, then you would report 300 in Q89a and in Q89b you would report 50 new youth served. In this instance, you would also need to remember to add the additional school to the Prevention Intervention Information section, Q39a-g.
– If, on the other hand, the intervention service type just started in the second half of the fiscal year, so this is the first time you are reporting serving that 250 in Q89a, then Q89b would be 250 (all are "new" to you).
PROBLEM IDENTIFICATION AND REFERRAL SUB-FORM (SEE QUESTIONS 98-111)
In the Problem Identification and Referral sub-form, you will report services or
programs to identify those in need of intervention to change problem substance use
behaviors in the early stages. Such services may include on-line screening and
feedback programs often used with college populations, Employee and Student
Assistance Program screenings, and other prevention intervention assessment and
referral initiatives.
Q103a: Reporting Numbers Reached by Problem Identification and Referral Services
In Q103a, you will report the number of individuals who received your problem
identification and referral services during the 6-month reporting period. The 6-
month reporting periods are October 1-March 31 and April 1-September 30.
• In Q103a, you will record the number served by the intervention service type. For example, let’s say your community is implementing an online alcohol use screening and feedback program through a local college, and 200 students participated during the reporting period. In Q103a, you would report 200 as the number receiving the services.
Program Evaluation for Prevention: Partnerships for Success Community-Level Instrument Revised Guidance Manual
Program Evaluation for Prevention Contract – March 2017 2-30
• Note that the number reached by a single intervention service type should generally be smaller than or equal to the estimated target population you reported earlier in Q39g. For example, let’s say that adding across all of the locations you reported in Q39, the target population size (e.g., the number of students at the participating colleges) was 4,500. You would generally expect that the largest number you would reach in this target population with this intervention service type would be 4,500.
Q103b: Number of New Individuals Reached by Problem Identification and Referral Services
In the CLI-R submission for the second half of the Federal fiscal year (the period
April 1-Sept 30; CLI-R due December 1), Question 103b must also be answered. The
item asks, of the total receiving the intervention service type (the total reported in
Q103a), how many of these were new to this second half of the Federal fiscal year.
• The intent of this item is to enable the cross-site evaluation to calculate within each intervention service type a cumulative, unduplicated number of individuals who received the intervention service type during the Federal fiscal year.
• For example, let’s say your community is implementing an online alcohol use screening and feedback program through a local college, and the program was provided to 200 students in the first half of the Federal fiscal year (October-March) and a different 100 students in the second half of the Federal fiscal year (April-September). In the CLI-R for the first half of the fiscal year (October-March), you reported in Q103a that 200 received this intervention service type. In the CLI-R for the second half of the fiscal year (April-September), you reported in Q103a that 100 received this intervention service type. Next you would report in Q103b that you served 100 new individuals, since the 100 served in the second half of the fiscal year are not the same college students who received the program in the first half of the fiscal year.
– If, on the other hand, the intervention service type just started in the second half of the fiscal year, so this is the first time you are reporting serving that 100 in Q103a, then Q103b would be 100 (all are "new" to you).
– If the initiative was expanded in April–September to include an additional college, you will also need to remember to add the additional college to the Prevention Intervention Information section, Q39a-g.
Program Evaluation for Prevention: Partnerships for Success Community-Level Instrument Revised Guidance Manual
Program Evaluation for Prevention Contract – March 2017 2-31
ENVIRONMENTAL STRATEGIES SUB-FORM (SEE QUESTIONS 112-141)
In the Environmental Strategies sub-form, you will report intervention service types
involving: 1) training of environmental influencers (those who are in a position to
affect substance abuse through influencing the environment); 2) policy enactment,
establishment or implementation; or 3) enforcement efforts. Trainings of
environmental influencers include law enforcement officer or beverage server
trainings, and physician trainings related to prescription drug monitoring practices.
Policy efforts include initiatives to change policies related to retail or social access,
public consumption, advertising, organizational policies, etc. Enforcement efforts
include enhancement or implementation of sobriety checkpoints, compliance
checks, neighborhood surveillance, party patrols, etc.
You will also be able to report Environmental Strategies that do not fit into these
three categories, such as implementing prescription drug take-backs. In the
Environmental Strategies sub-form, implementation of prescription drug take-backs
should be reported as “Other environmental interventions” in Q132, as this service
type does not fall in the categories of policy, enforcement, or training of
environmental influencers. Note that policy change efforts to enable or enhance
prescription drug take-backs can be reported in the policy section, questions 121-
126.
Note that communication initiatives such as media campaigns or educational
material distribution should be reported in the Information Dissemination and
Communication sub-form.
Q133a: Reporting Numbers Reached by Environmental Strategies
In Q133a, you will estimate the number of individuals reached or affected by your
environmental strategy during the 6-month reporting period. The 6-month
reporting periods are October 1-March 31 and April 1-September 30. Unlike direct
service strategies (e.g., prevention education curricula), environmental strategies
are intended to influence the environment of the targeted population, and therefore
the numbers affected will be estimates rather than exact counts.
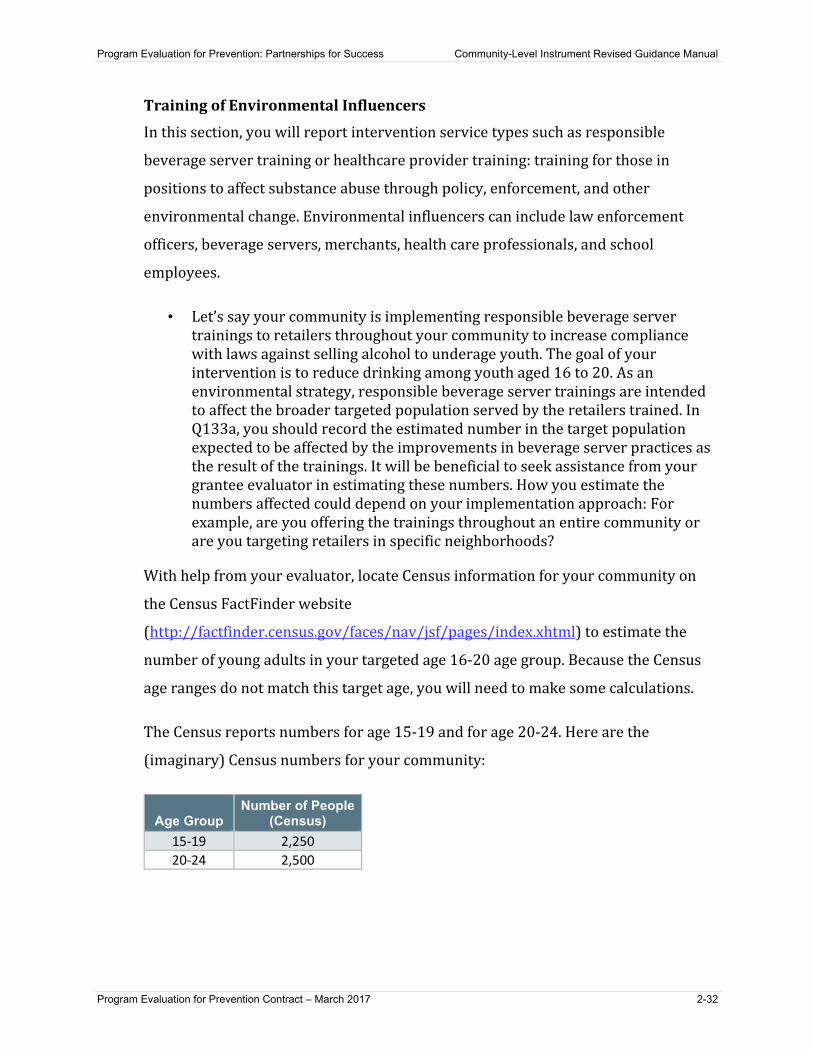
Program Evaluation for Prevention: Partnerships for Success Community-Level Instrument Revised Guidance Manual
Program Evaluation for Prevention Contract – March 2017 2-32
Training of Environmental Influencers
In this section, you will report intervention service types such as responsible
beverage server training or healthcare provider training: training for those in
positions to affect substance abuse through policy, enforcement, and other
environmental change. Environmental influencers can include law enforcement
officers, beverage servers, merchants, health care professionals, and school
employees.
• Let’s say your community is implementing responsible beverage server trainings to retailers throughout your community to increase compliance with laws against selling alcohol to underage youth. The goal of your intervention is to reduce drinking among youth aged 16 to 20. As an environmental strategy, responsible beverage server trainings are intended to affect the broader targeted population served by the retailers trained. In Q133a, you should record the estimated number in the target population expected to be affected by the improvements in beverage server practices as the result of the trainings. It will be beneficial to seek assistance from your grantee evaluator in estimating these numbers. How you estimate the numbers affected could depend on your implementation approach: For example, are you offering the trainings throughout an entire community or are you targeting retailers in specific neighborhoods?
With help from your evaluator, locate Census information for your community on
the Census FactFinder website
(http://factfinder.census.gov/faces/nav/jsf/pages/index.xhtml) to estimate the
number of young adults in your targeted age 16-20 age group. Because the Census
age ranges do not match this target age, you will need to make some calculations.
The Census reports numbers for age 15-19 and for age 20-24. Here are the
(imaginary) Census numbers for your community:
Age Group Number of People
(Census) 15-19 2,250 20-24 2,500
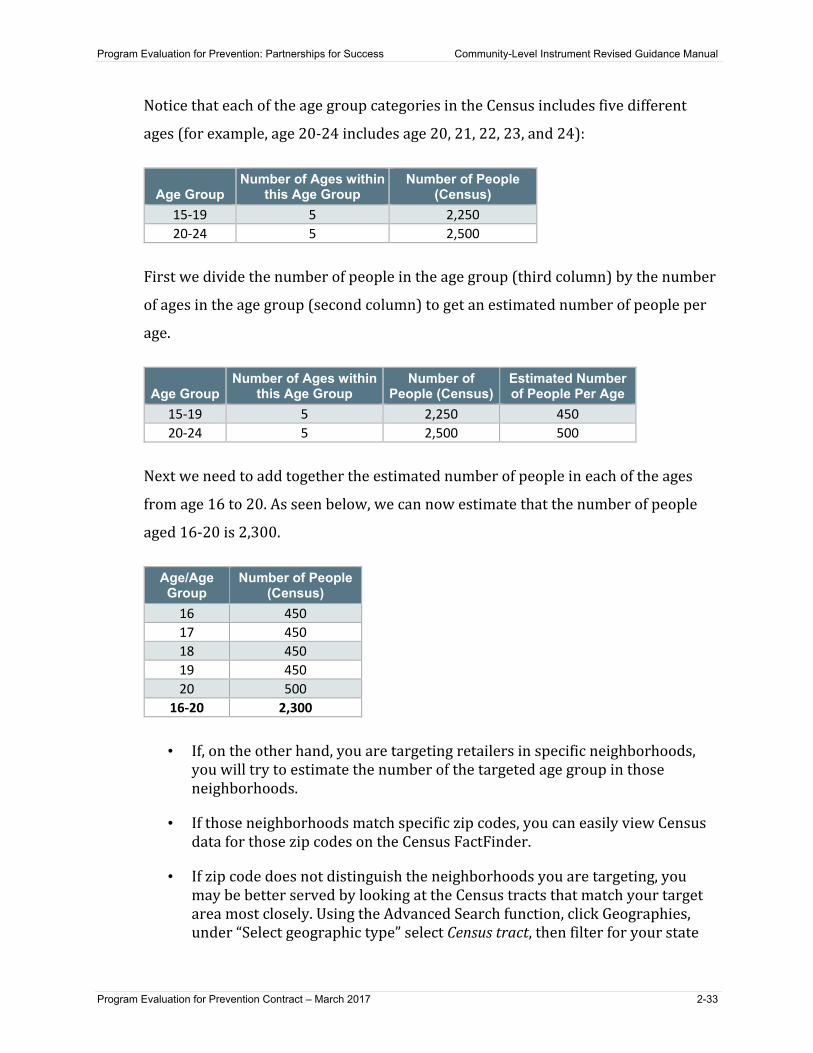
Program Evaluation for Prevention: Partnerships for Success Community-Level Instrument Revised Guidance Manual
Program Evaluation for Prevention Contract – March 2017 2-33
Notice that each of the age group categories in the Census includes five different
ages (for example, age 20-24 includes age 20, 21, 22, 23, and 24):
Age Group Number of Ages within
this Age Group Number of People
(Census) 15-19 5 2,250 20-24 5 2,500
First we divide the number of people in the age group (third column) by the number
of ages in the age group (second column) to get an estimated number of people per
age.
Age Group Number of Ages within
this Age Group Number of
People (Census) Estimated Number of People Per Age
15-19 5 2,250 450 20-24 5 2,500 500
Next we need to add together the estimated number of people in each of the ages
from age 16 to 20. As seen below, we can now estimate that the number of people
aged 16-20 is 2,300.
Age/Age Group
Number of People (Census)
16 450 17 450 18 450 19 450 20 500
16-20 2,300
• If, on the other hand, you are targeting retailers in specific neighborhoods, you will try to estimate the number of the targeted age group in those neighborhoods.
• If those neighborhoods match specific zip codes, you can easily view Census data for those zip codes on the Census FactFinder.
• If zip code does not distinguish the neighborhoods you are targeting, you may be better served by looking at the Census tracts that match your target area most closely. Using the Advanced Search function, click Geographies, under “Select geographic type” select Census tract, then filter for your state
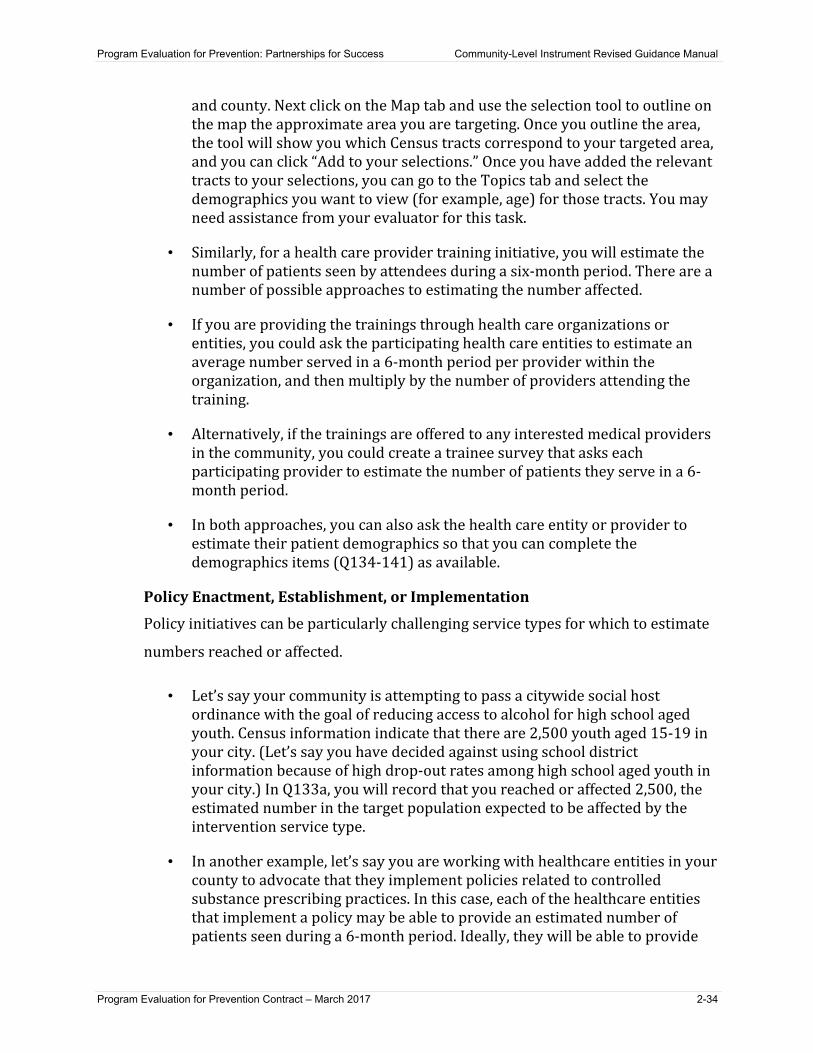
Program Evaluation for Prevention: Partnerships for Success Community-Level Instrument Revised Guidance Manual
Program Evaluation for Prevention Contract – March 2017 2-34
and county. Next click on the Map tab and use the selection tool to outline on the map the approximate area you are targeting. Once you outline the area, the tool will show you which Census tracts correspond to your targeted area, and you can click “Add to your selections.” Once you have added the relevant tracts to your selections, you can go to the Topics tab and select the demographics you want to view (for example, age) for those tracts. You may need assistance from your evaluator for this task.
• Similarly, for a health care provider training initiative, you will estimate the number of patients seen by attendees during a six-month period. There are a number of possible approaches to estimating the number affected.
• If you are providing the trainings through health care organizations or entities, you could ask the participating health care entities to estimate an average number served in a 6-month period per provider within the organization, and then multiply by the number of providers attending the training.
• Alternatively, if the trainings are offered to any interested medical providers in the community, you could create a trainee survey that asks each participating provider to estimate the number of patients they serve in a 6-month period.
• In both approaches, you can also ask the health care entity or provider to estimate their patient demographics so that you can complete the demographics items (Q134-141) as available.
Policy Enactment, Establishment, or Implementation
Policy initiatives can be particularly challenging service types for which to estimate
numbers reached or affected.
• Let’s say your community is attempting to pass a citywide social host ordinance with the goal of reducing access to alcohol for high school aged youth. Census information indicate that there are 2,500 youth aged 15-19 in your city. (Let’s say you have decided against using school district information because of high drop-out rates among high school aged youth in your city.) In Q133a, you will record that you reached or affected 2,500, the estimated number in the target population expected to be affected by the intervention service type.
• In another example, let’s say you are working with healthcare entities in your county to advocate that they implement policies related to controlled substance prescribing practices. In this case, each of the healthcare entities that implement a policy may be able to provide an estimated number of patients seen during a 6-month period. Ideally, they will be able to provide
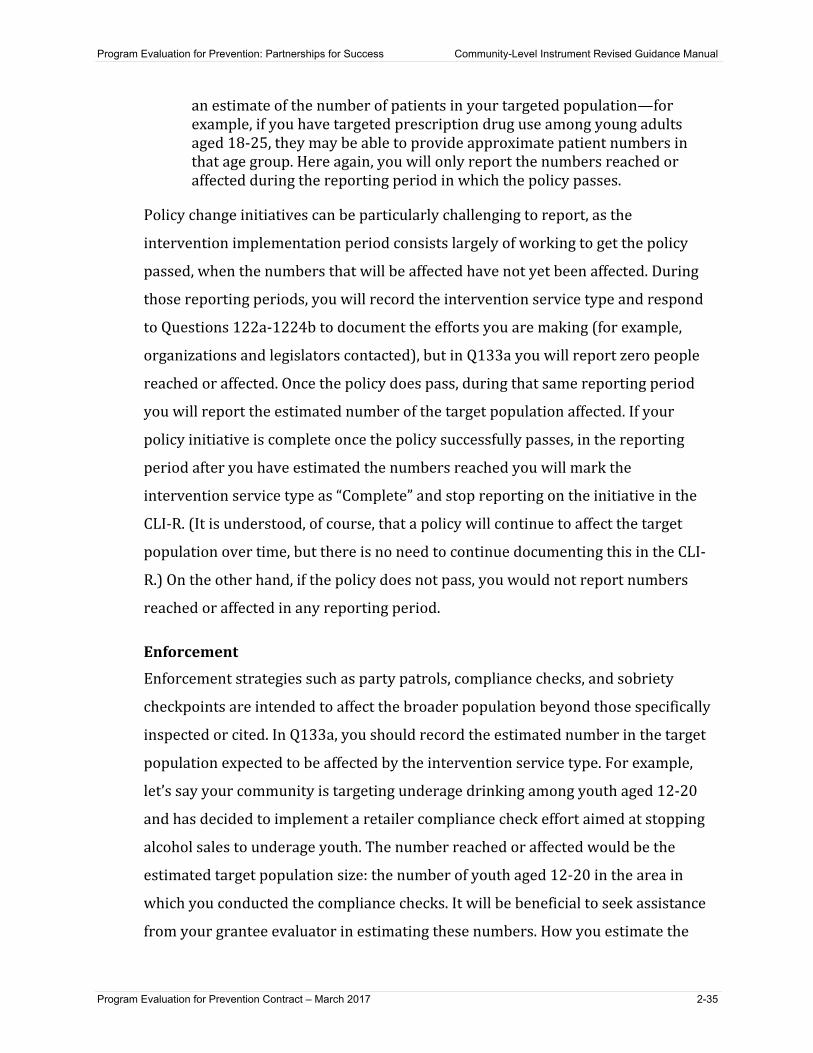
Program Evaluation for Prevention: Partnerships for Success Community-Level Instrument Revised Guidance Manual
Program Evaluation for Prevention Contract – March 2017 2-35
an estimate of the number of patients in your targeted population—for example, if you have targeted prescription drug use among young adults aged 18-25, they may be able to provide approximate patient numbers in that age group. Here again, you will only report the numbers reached or affected during the reporting period in which the policy passes.
Policy change initiatives can be particularly challenging to report, as the
intervention implementation period consists largely of working to get the policy
passed, when the numbers that will be affected have not yet been affected. During
those reporting periods, you will record the intervention service type and respond
to Questions 122a-1224b to document the efforts you are making (for example,
organizations and legislators contacted), but in Q133a you will report zero people
reached or affected. Once the policy does pass, during that same reporting period
you will report the estimated number of the target population affected. If your
policy initiative is complete once the policy successfully passes, in the reporting
period after you have estimated the numbers reached you will mark the
intervention service type as “Complete” and stop reporting on the initiative in the
CLI-R. (It is understood, of course, that a policy will continue to affect the target
population over time, but there is no need to continue documenting this in the CLI-
R.) On the other hand, if the policy does not pass, you would not report numbers
reached or affected in any reporting period.
Enforcement
Enforcement strategies such as party patrols, compliance checks, and sobriety
checkpoints are intended to affect the broader population beyond those specifically
inspected or cited. In Q133a, you should record the estimated number in the target
population expected to be affected by the intervention service type. For example,
let’s say your community is targeting underage drinking among youth aged 12-20
and has decided to implement a retailer compliance check effort aimed at stopping
alcohol sales to underage youth. The number reached or affected would be the
estimated target population size: the number of youth aged 12-20 in the area in
which you conducted the compliance checks. It will be beneficial to seek assistance
from your grantee evaluator in estimating these numbers. How you estimate the

Program Evaluation for Prevention: Partnerships for Success Community-Level Instrument Revised Guidance Manual
Program Evaluation for Prevention Contract – March 2017 2-36
numbers affected could depend on your implementation approach: For example, are
you conducting the compliance checks throughout an entire county, throughout one
town, or targeting retailers in specific neighborhoods within a town?
• Let’s say you are conducting the compliance checks throughout your community. With help from your evaluator, locate Census information on the Census FactFinder website (http://factfinder.census.gov/faces/nav/jsf/pages/index.xhtml) to estimate the number of young adults in your targeted age 12-20 age group. Because the Census age ranges do not match the target age, you will need to make some calculations. The Census reports numbers for age 15-19 and for age 20-24. To estimate the number of youth aged 20, divide the number in the age 20-24 category by 5 (since 5 ages are represented). Then add this approximate number of youth aged 20 to the number of youth in the age 15-19 category.
• If, on the other hand, you are targeting retailers in specific neighborhoods, you will try to estimate the number of the targeted age group in those neighborhoods. If those neighborhoods match specific zip codes, you can easily view Census data for those zip codes on the Census FactFinder. If zip code does not distinguish the neighborhoods you are targeting, you may be better served by looking at the Census tracts that match your target area most closely. Using the Advanced Search function, click Geographies, under “Select geographic type” select Census tract, then filter for your state and county. Next click on the Map tab and use the selection tool to outline on the map the approximate area you are targeting. Once you outline the area, the tool will show you which Census tracts correspond to your targeted area, and you can click “Add to your selections.” Once you have added the relevant tracts to your selections, you can go to the Topics tab and select the demographics you want to view (for example, age) for those tracts. You may need assistance from your evaluator for this task.
• Note that you will report the target area/location and target population size in Q39a-g and you will report the number of compliance checks conducted in Q128b.
• Note that the number reached by a single intervention service type should generally be smaller than or equal to the estimated target population you reported earlier in Q39g. For example, let’s say that adding across all of the locations you reported in Q39, the estimated target population size was 4,500. You would generally expect that the largest number you would reach in this target population with this intervention service type would be 4,500.
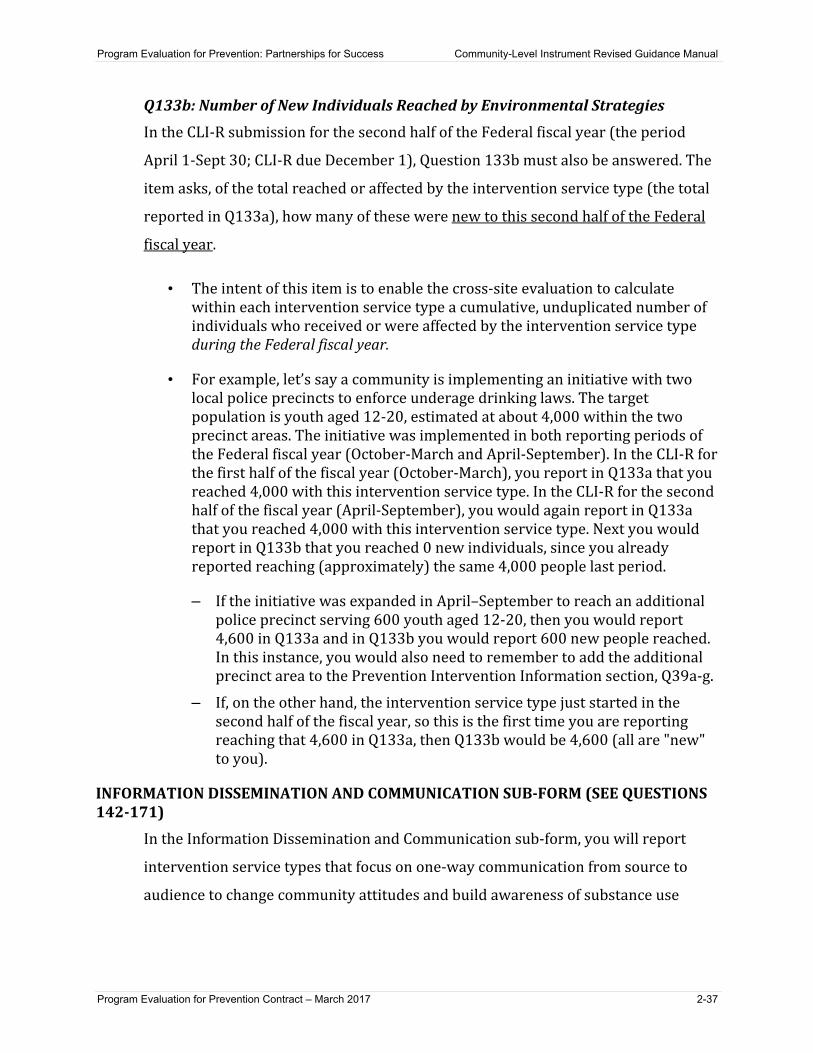
Program Evaluation for Prevention: Partnerships for Success Community-Level Instrument Revised Guidance Manual
Program Evaluation for Prevention Contract – March 2017 2-37
Q133b: Number of New Individuals Reached by Environmental Strategies
In the CLI-R submission for the second half of the Federal fiscal year (the period
April 1-Sept 30; CLI-R due December 1), Question 133b must also be answered. The
item asks, of the total reached or affected by the intervention service type (the total
reported in Q133a), how many of these were new to this second half of the Federal
fiscal year.
• The intent of this item is to enable the cross-site evaluation to calculate within each intervention service type a cumulative, unduplicated number of individuals who received or were affected by the intervention service type during the Federal fiscal year.
• For example, let’s say a community is implementing an initiative with two local police precincts to enforce underage drinking laws. The target population is youth aged 12-20, estimated at about 4,000 within the two precinct areas. The initiative was implemented in both reporting periods of the Federal fiscal year (October-March and April-September). In the CLI-R for the first half of the fiscal year (October-March), you report in Q133a that you reached 4,000 with this intervention service type. In the CLI-R for the second half of the fiscal year (April-September), you would again report in Q133a that you reached 4,000 with this intervention service type. Next you would report in Q133b that you reached 0 new individuals, since you already reported reaching (approximately) the same 4,000 people last period.
– If the initiative was expanded in April–September to reach an additional police precinct serving 600 youth aged 12-20, then you would report 4,600 in Q133a and in Q133b you would report 600 new people reached. In this instance, you would also need to remember to add the additional precinct area to the Prevention Intervention Information section, Q39a-g.
– If, on the other hand, the intervention service type just started in the second half of the fiscal year, so this is the first time you are reporting reaching that 4,600 in Q133a, then Q133b would be 4,600 (all are "new" to you).
INFORMATION DISSEMINATION AND COMMUNICATION SUB-FORM (SEE QUESTIONS 142-171)
In the Information Dissemination and Communication sub-form, you will report
intervention service types that focus on one-way communication from source to
audience to change community attitudes and build awareness of substance use
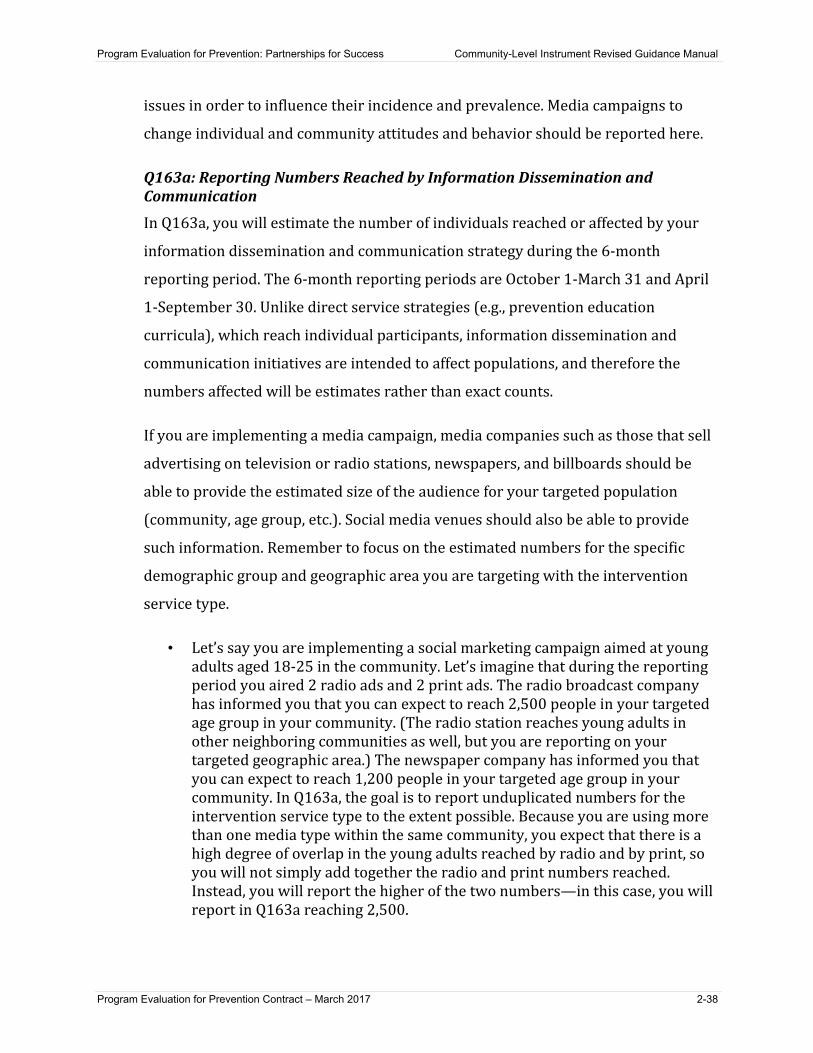
Program Evaluation for Prevention: Partnerships for Success Community-Level Instrument Revised Guidance Manual
Program Evaluation for Prevention Contract – March 2017 2-38
issues in order to influence their incidence and prevalence. Media campaigns to
change individual and community attitudes and behavior should be reported here.
Q163a: Reporting Numbers Reached by Information Dissemination and Communication
In Q163a, you will estimate the number of individuals reached or affected by your
information dissemination and communication strategy during the 6-month
reporting period. The 6-month reporting periods are October 1-March 31 and April
1-September 30. Unlike direct service strategies (e.g., prevention education
curricula), which reach individual participants, information dissemination and
communication initiatives are intended to affect populations, and therefore the
numbers affected will be estimates rather than exact counts.
If you are implementing a media campaign, media companies such as those that sell
advertising on television or radio stations, newspapers, and billboards should be
able to provide the estimated size of the audience for your targeted population
(community, age group, etc.). Social media venues should also be able to provide
such information. Remember to focus on the estimated numbers for the specific
demographic group and geographic area you are targeting with the intervention
service type.
• Let’s say you are implementing a social marketing campaign aimed at young adults aged 18-25 in the community. Let’s imagine that during the reporting period you aired 2 radio ads and 2 print ads. The radio broadcast company has informed you that you can expect to reach 2,500 people in your targeted age group in your community. (The radio station reaches young adults in other neighboring communities as well, but you are reporting on your targeted geographic area.) The newspaper company has informed you that you can expect to reach 1,200 people in your targeted age group in your community. In Q163a, the goal is to report unduplicated numbers for the intervention service type to the extent possible. Because you are using more than one media type within the same community, you expect that there is a high degree of overlap in the young adults reached by radio and by print, so you will not simply add together the radio and print numbers reached. Instead, you will report the higher of the two numbers—in this case, you will report in Q163a reaching 2,500.
Program Evaluation for Prevention: Partnerships for Success Community-Level Instrument Revised Guidance Manual
Program Evaluation for Prevention Contract – March 2017 2-39
• Remember that you will also report within the sub-form the number of individual times the ads were aired, for how many weeks, and across how many media outlets, such that the additional efforts you made to reach your target population through a number of different media will be captured. These items will help the evaluation team calculate the campaign dosage, or the degree of exposure to the message among those reached.
• In another example, let’s say your intervention service type consists of a newspaper insert on prescription drug safety, and the targeted population for the campaign is parents of youth aged 12-17. The newspaper’s circulation is about 20,000 individuals in the community. The newspaper has information about age groups, but not exactly what you need, which is the percent of newspaper recipients that are parents of youth aged 12-17. In this case, you will need to estimate based on age groupings. The age groupings provided allow you to determine that 10,000 newspaper recipients are in the 35-55 age group, which you have decided is the closest match for the age of parents of youth aged 12-17 in your community.
• Note that the number reached by a single intervention service type should generally be smaller than or equal to the estimated target population you reported earlier in Q39g. For example, let’s say that adding across all of the locations you reported in Q39, the estimated target population size was 4,500. You would generally expect that the largest number you would reach in this target population with this intervention service type would be 4,500.
Q163b: Number of New Individuals Reached by Information Dissemination and Communication
In the CLI-R submission for the second half of the Federal fiscal year (the period
April 1-Sept 30; CLI-R due December 1), Question 163b must also be answered. The
item asks, of the total reached or affected by the intervention service type (the total
reported in Q163a), how many of these were new to this second half of the Federal
fiscal year.
• The intent of this item is to enable the cross-site evaluation to calculate within each intervention service type a cumulative, unduplicated number of individuals who received or were affected by the intervention service type during the Federal fiscal year.
• Let’s use the example of the intervention service type that consists of a newspaper insert on prescription drug safety. The targeted population for the campaign was parents of youth aged 12-17. The newspaper insert was distributed in both reporting periods of the Federal fiscal year (October-March and April-September), and you are estimating that the inserts reached
Program Evaluation for Prevention: Partnerships for Success Community-Level Instrument Revised Guidance Manual
Program Evaluation for Prevention Contract – March 2017 2-40
10,000 individuals in the target population. In the CLI-R for the first half of the fiscal year (October-March), you report in Q163a that you reached 10,000 with this intervention service type. In the CLI-R for the second half of the fiscal year (April-September), you would again report in Q163a that you reached 10,000 with this intervention service type. Next you would report in Q163b that you reached 0 new individuals, since you already reported reaching (approximately) the same 10,000 people last period.
– If for some reason the paper’s distribution grew by 1,000 since the last period, out of which an estimated 500 are in the targeted population of parents of youth aged 12-17, then you would report 10,500 in Q163a and in Q163b you would report 500 new people reached.
– Or, if the campaign was expanded in April–September to reach an additional town with a newspaper that reached 2,000 people in the targeted population, then you would report 12,000 in Q163a and in Q163b you would report 2,000 new people reached. In this instance, you would also need to remember to add the additional town to the Prevention Intervention Information section, Q39a-g.
o If, on the other hand, the intervention service type just started in the second half of the fiscal year, so this is the first time you are reporting reaching that 10,000 in Q163a, then Q163b would be 10,000 (all are "new" to you).
PREVENTION INTERVENTION COSTS
In this section, you will provide information on the costs involved in implementing
the intervention on which you are reporting. You will only be asked to report costs
on an annual basis (in the CLI-R that is due in December, covering the period
October 1-September 30), and at the point (if applicable) that you list an
intervention as completed or discontinued. Note that in this section you will report
costs by intervention rather than by intervention service type. So, for example, if
you are implementing an intervention such as Community Trials Intervention to
Reduce High-Risk Drinking that consists of multiple service types, you will report
costs for the intervention as a whole (Community Trials Intervention) rather than
for each service type associated with the intervention. (In many cases, of course, the
intervention and the intervention service type are one and the same.)
Program Evaluation for Prevention: Partnerships for Success Community-Level Instrument Revised Guidance Manual
Program Evaluation for Prevention Contract – March 2017 2-41
• Intervention costs will be reported in three distinct sections:
– Ongoing implementation-related costs (Questions 172-180). Do not include in-kind resources or start-up costs.
– In-kind resources for the intervention (Questions 181-182)
– Start-up intervention costs (Questions 183-188)
• In reporting ongoing implementation costs (Questions 172-180) and start-up intervention costs (Questions 183-188), keep in mind the following guidelines:
– Include all of the implementation costs for this intervention regardless of whether the funds are from PFS or other sources, such as if your organization has braided funding from Drug Free Communities, other grant funding, or local contributions for the intervention. Focus on local organizational costs.
– Do not include costs of the state/grantee, for example if the state provided media materials or ads for subrecipients to use in their local campaigns, or developed an education program that subrecipients use. Instead record only your local community costs.
• In reporting in-kind contributions (Questions 181-182), include in-kind contributions such as school partners providing staff to implement an EBP, or law enforcement personnel providing time to implement underage alcohol sale compliance checks. In Q182, you will report non-labor in-kind contributions such as donated supplies and equipment.
It is important to differentiate between start-up costs and implementation costs so
that you can report these numbers in the appropriate section. Start-up costs
typically are costs incurred in the very beginning of implementation and are the
initial expenses necessary to get an implementation started, such as planning
meetings, development of intervention procedures, materials or promotional
activities, expenses related to setting up necessary IT systems, and expenses related
to initial hiring and staff training. Some categories of costs (e.g., training) may occur
during start-up but also after start-up is over. Typically, the initial expenses for
these types of costs are considered start-up while ongoing expenses are considered
ongoing operating costs.
Intervention service types such as policy change initiatives may pose challenges in
differentiating start-up and ongoing costs. In general, costs related to an initial
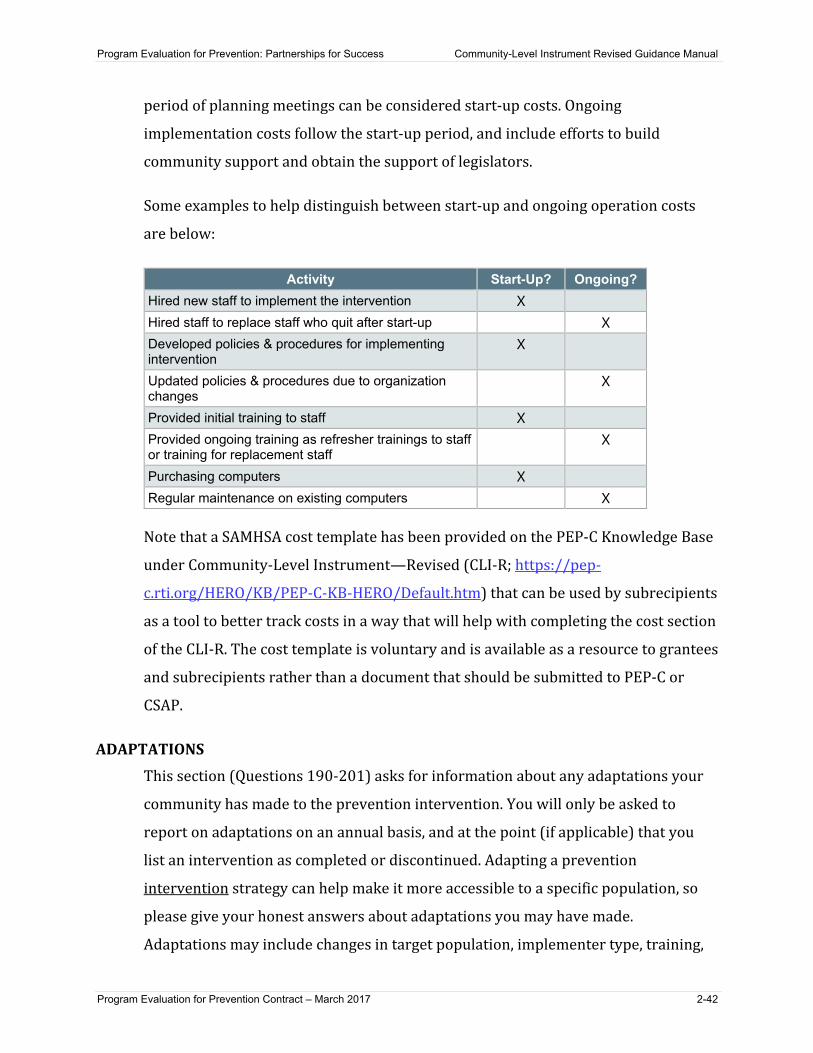
Program Evaluation for Prevention: Partnerships for Success Community-Level Instrument Revised Guidance Manual
Program Evaluation for Prevention Contract – March 2017 2-42
period of planning meetings can be considered start-up costs. Ongoing
implementation costs follow the start-up period, and include efforts to build
community support and obtain the support of legislators.
Some examples to help distinguish between start-up and ongoing operation costs
are below:
Activity Start-Up? Ongoing? Hired new staff to implement the intervention X Hired staff to replace staff who quit after start-up X Developed policies & procedures for implementing intervention
X
Updated policies & procedures due to organization changes
X
Provided initial training to staff X Provided ongoing training as refresher trainings to staff or training for replacement staff
X
Purchasing computers X Regular maintenance on existing computers X
Note that a SAMHSA cost template has been provided on the PEP-C Knowledge Base
under Community-Level Instrument—Revised (CLI-R; https://pep-
c.rti.org/HERO/KB/PEP-C-KB-HERO/Default.htm) that can be used by subrecipients
as a tool to better track costs in a way that will help with completing the cost section
of the CLI-R. The cost template is voluntary and is available as a resource to grantees
and subrecipients rather than a document that should be submitted to PEP-C or
CSAP.
ADAPTATIONS
This section (Questions 190-201) asks for information about any adaptations your
community has made to the prevention intervention. You will only be asked to
report on adaptations on an annual basis, and at the point (if applicable) that you
list an intervention as completed or discontinued. Adapting a prevention
intervention strategy can help make it more accessible to a specific population, so
please give your honest answers about adaptations you may have made.
Adaptations may include changes in target population, implementer type, training,
Program Evaluation for Prevention: Partnerships for Success Community-Level Instrument Revised Guidance Manual
Program Evaluation for Prevention Contract – March 2017 2-43
content, materials, cultural appropriateness, dosage, duration, or setting of the
prevention intervention from that recommended by the prevention intervention
developer. Adaptations can apply to formal prevention curricula, manuals, and
materials, as well as to accepted and standard practice as described in the literature
for environmental interventions.
• For example, let’s say you are serving a Hispanic population through implementing an evidence-based prevention intervention that was not designed for or tested with a Hispanic population. You may, for example, have revised the language used throughout the content to better fit your community’s Hispanic population, and you may have changed the setting to one seen as more appropriate than the setting specified by the intervention developer (e.g., from a school to a Hispanic social services organization’s location).
• In this case you would likely indicate in Q192 that you made changes to the content, indicate in Q197 that you made changes to the setting, and indicate in Q201 that you made adaptations to address cultural appropriateness.
• The cultural appropriateness question (Q197) can easily overlap with the previous adaptation questions, as it addresses the question "Why were changes made?" while the previous questions look at "In what ways was the program changed?"
2.2.5 Monitoring and Evaluation
• This section collects information on your development of an evaluation plan. You are also asked to indicate whether a final evaluation report was developed, whether analyses led to changes in your prevention interventions, and whether key findings from the evaluation were distributed to key stakeholders, key informants, or both.
2.3 Contextual Factors • Contextual factors are conditions that exist outside the scope of the
prevention intervention activities but nevertheless influence the SPF process and prevention intervention delivery. Although you can incorporate knowledge of these factors into your planning and prevention interventions, they typically cannot be changed through intervention activities.
• In Question 206, you will report any contextual factors that introduced barriers to your PFS activities during the past Federal fiscal year, and rate the degree of impact on your PFS activities due to the barrier.
Program Evaluation for Prevention: Partnerships for Success Community-Level Instrument Revised Guidance Manual
Program Evaluation for Prevention Contract – March 2017 2-44
– The Federal fiscal year is the period from October 1-September 30.
– If a listed barrier did not occur or did not affect your PFS activities, check “No impact.” If a listed barrier had a limited impact on your activities, check “Low impact.” If a barrier affected your activities but did not present a major barrier, check “Moderate impact.” If a barrier had a major impact or was a major factor affecting your activities, check “High impact.”
2.4 Closing Questions • Provide any additional comments about your SPF-PFS-related prevention
intervention activities here.
Program Evaluation for Prevention: Partnerships for Success Community-Level Instrument Revised Guidance Manual
Program Evaluation for Prevention Contract – March 2017 3-1
3. Guidance for Grantees in Overseeing the CLI-R
3.1 Grantee Role and Responsibilities for the CLI-R Grantee Project Directors, Project Coordinators, and Grantee Evaluators play a role
in assisting subrecipient communities in understanding the CLI-R and submitting
data. The PEP-C evaluation team and grantee representative responsibilities are as
follows:
• The PEP-C evaluation team will provide CLI-R webinar trainings to grantee and subrecipient staff.
• Grantee representatives (e.g., Grantee Project Director, Project Coordinator, and/or Evaluator) will provide the first line of technical assistance to their subrecipients in understanding and responding appropriately in the CLI-R.
– Grantee representatives will contact the PEP-C team with any questions for which they would like more guidance or confirmation.
– While subrecipients are encouraged to seek help first from grantee staff (since grantee staff are more familiar with their particular initiative and interventions), subrecipients may also contact the PEP-C Help Desk directly. Subrecipients should particularly contact the PEP-C Help Desk directly if they experience any technical difficulties with the data entry system.
• Grantee representatives are responsible for reviewing subrecipients’ submitted CLI-R data and accepting the CLI-R to finalize the submission.
– Grantees should set their own internal deadlines for subrecipient CLI-R submissions to ensure sufficient time to review and approve CLI-R submissions prior to the deadline.
• Grantee representatives are responsible for responding to questions in the PEP-C Data Feedback Forms, though they may communicate with subrecipients to clarify information as needed.
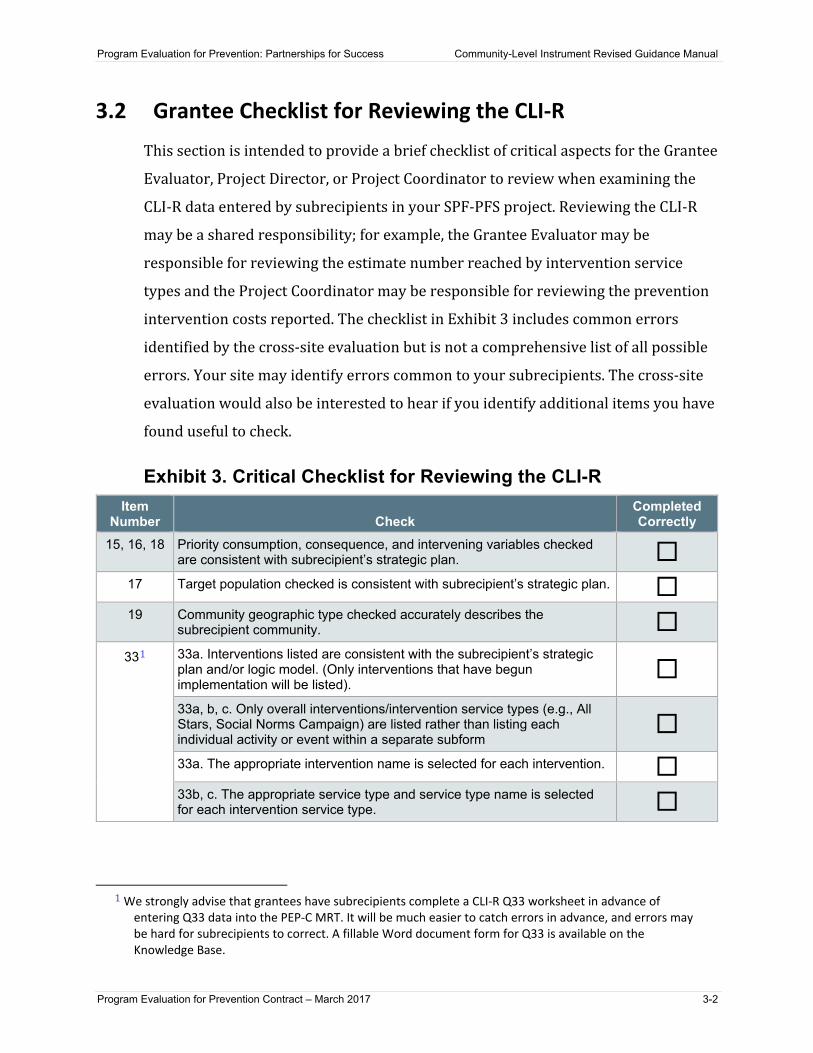
Program Evaluation for Prevention: Partnerships for Success Community-Level Instrument Revised Guidance Manual
Program Evaluation for Prevention Contract – March 2017 3-2
3.2 Grantee Checklist for Reviewing the CLI-R This section is intended to provide a brief checklist of critical aspects for the Grantee
Evaluator, Project Director, or Project Coordinator to review when examining the
CLI-R data entered by subrecipients in your SPF-PFS project. Reviewing the CLI-R
may be a shared responsibility; for example, the Grantee Evaluator may be
responsible for reviewing the estimate number reached by intervention service
types and the Project Coordinator may be responsible for reviewing the prevention
intervention costs reported. The checklist in Exhibit 3 includes common errors
identified by the cross-site evaluation but is not a comprehensive list of all possible
errors. Your site may identify errors common to your subrecipients. The cross-site
evaluation would also be interested to hear if you identify additional items you have
found useful to check.
Exhibit 3. Critical Checklist for Reviewing the CLI-R Item
Number Check Completed Correctly
15, 16, 18 Priority consumption, consequence, and intervening variables checked are consistent with subrecipient’s strategic plan.
17 Target population checked is consistent with subrecipient’s strategic plan. 19 Community geographic type checked accurately describes the
subrecipient community. 331 33a. Interventions listed are consistent with the subrecipient’s strategic
plan and/or logic model. (Only interventions that have begun implementation will be listed).
33a, b, c. Only overall interventions/intervention service types (e.g., All Stars, Social Norms Campaign) are listed rather than listing each individual activity or event within a separate subform
33a. The appropriate intervention name is selected for each intervention. 33b, c. The appropriate service type and service type name is selected for each intervention service type.
1 We strongly advise that grantees have subrecipients complete a CLI-R Q33 worksheet in advance of entering Q33 data into the PEP-C MRT. It will be much easier to catch errors in advance, and errors may be hard for subrecipients to correct. A fillable Word document form for Q33 is available on the Knowledge Base.

Program Evaluation for Prevention: Partnerships for Success Community-Level Instrument Revised Guidance Manual
Program Evaluation for Prevention Contract – March 2017 3-3
Item Number Check
Completed Correctly
33d. The date started reflects the start date for the PFS initiative implementation of the intervention (even if the intervention existed in the community previously). This date is very important because it is used to determine the earliest date PFS interventions began for this subrecipient.
33e. The appropriate CSAP strategy type is selected for each intervention service type.
39 39a. Location(s) listed are appropriate.
39f. Estimated target population number is appropriate.
53 53a. Estimated number of individuals reached by Community-Based Process is appropriate.
53b. Estimated number of new individuals reached by Community-Based Process is appropriate. (This item will not appear for the first half of the year.)
69 69a. Number of individuals reached by Prevention Education is appropriate.
69b. Number of new individuals reached by Prevention Education is appropriate. (This item will not appear for the first half of the year.)
89 89a. Estimated number of individuals reached by Alternative Activities is appropriate.
89b. Estimated number of new individuals reached by Alternative Activities is appropriate. (This item will not appear for the first half of the year.)
103 103a. Estimated number of individuals reached by Problem Identification and Referral is appropriate.
103b. Estimated number of additional individuals reached by Problem Identification and Referral is appropriate. (This item will not appear for the first half of the year.)
134 134a. Estimated number of individuals reached by Environmental Strategy is appropriate.
134b. Estimated number of new individuals reached by Environmental Strategy is appropriate. (This item will not appear for the first half of the year.)
161 161a. Estimated number of individuals reached by Information Dissemination and Communication is appropriate.
161b. Estimated number of additional individuals reached by Information Dissemination and Communication is appropriate. (This item will not appear for the first half of the year.)
172 Total costs are consistent with grantee’s understanding of the community organization’s costs (across funding sources) to implement the intervention service type.
Program Evaluation for Prevention: Partnerships for Success Community-Level Instrument Revised Guidance Manual
Program Evaluation for Prevention Contract – March 2017 3-4
3.3 CLI-R Data Reports and Extracts Grantee and subrecipient staff will be able to view and print reports displaying a
subrecipient’s response to the CLI-R for each reporting period, and will also be able
to access CLI-R datasets usable for analysis for state/local evaluation purposes. Both
functions are currently under development; an update to this document will be
provided once those functions are available.
Program Evaluation for Prevention: Partnerships for Success Community-Level Instrument Revised Guidance Manual
Program Evaluation for Prevention Contract – March 2017 4-1
4. Getting Help 4.1 Whom Can I Contact for Help?
If you need assistance:
Use the Technical Assistance link within the MRT, located in the top right corner of
the screen:
• Click the Technical Assistance link to search the project Knowledge Base or
open a TA request form
• The Help Desk will respond to the TA request form by email or phone
OR contact the Help Desk:
• Phone at 1-866-558-0724
• E-mail at [email protected]

Program Evaluation for Prevention: Partnerships for Success Community-Level Instrument Revised Guidance Manual
Program Evaluation for Prevention Contract – March 2017 4-2
[This page intentionally left blank.]

Program Evaluation for Prevention: Partnerships for Success Community-Level Instrument Revised Guidance Manual
Program Evaluation for Prevention Contract – March 2017 A-1
Appendix A: Sample Implemented Interventions Tables
Community A
33a. Intervention
name 33b. Service
Type
33c. Service
Type name
33d. Date
started 33e. CSAP
strategy type
33f. Institute of Medicine
(IOM) category
33g. Intervention
targets 33h.
Status
33i. Date completed or discontinued
Prescription Drug Drop Boxes/Take Back
Prescription Drug Drop Boxes/Take Back
Prescription Drug Drop Boxes
02/2013 Environmental Strategy
Universal indirect
Whole communities
Active NA
Guiding Good Choices
Parenting/ Family Management
Guiding Good Choices
03/2013 Prevention Education
Universal direct
Young people’s immediate social environments-family
Completed 01/2014
Other: Prescriber education on safe prescribing practices
Training/ Educating Environmental Influencers
Prescriber education on safe prescribing practices
02/2014 Environmental Strategy
Universal indirect
Institutions or organizations that serve young people
Active NA
Other: Hospital prescribing policy change
Establishing/ Reviewing/ Changing Policies in Schools, Colleges, Workplaces & Other Organizations
Hospital prescribing policy change
11/2013 Environmental Strategy
Universal indirect
Institutions or organizations that serve young people
Completed 11/2014
Community B
33a. Intervention
name 33b. Service
Type
33c. Service
Type name
33d. Date
started 33e. CSAP
strategy type
33f. Institute of Medicine
(IOM) category
33g. Intervention
targets 33h.
Status
33i. Date completed or discontinued
Communities Mobilizing for Change on Alcohol (CMCA)
Establishing/ Reviewing/ Changing Policies in Schools, Colleges, Workplaces & Other Organizations
Campus underage drinking policy change
11/2013 Environmental Strategy
Universal indirect
Institutions or organizations that serve young people
Completed 11/2014
Communities Mobilizing for Change on Alcohol (CMCA)
Compliance Checks
Retailer Compliance Checks
2/2014 Environmental Strategy
Universal indirect
Whole communities
Active NA
Communities Mobilizing for Change on Alcohol (CMCA)
Media Campaigns Most of Us social norms campaign
05/2013 Information Dissemination and Communication
Universal indirect
Young people’s immediate social environments-family
Inactive NA
Program Evaluation for Prevention: Partnerships for Success Community-Level Instrument Revised Guidance Manual
Program Evaluation for Prevention Contract – March 2017 A-2
[This page intentionally left blank.]
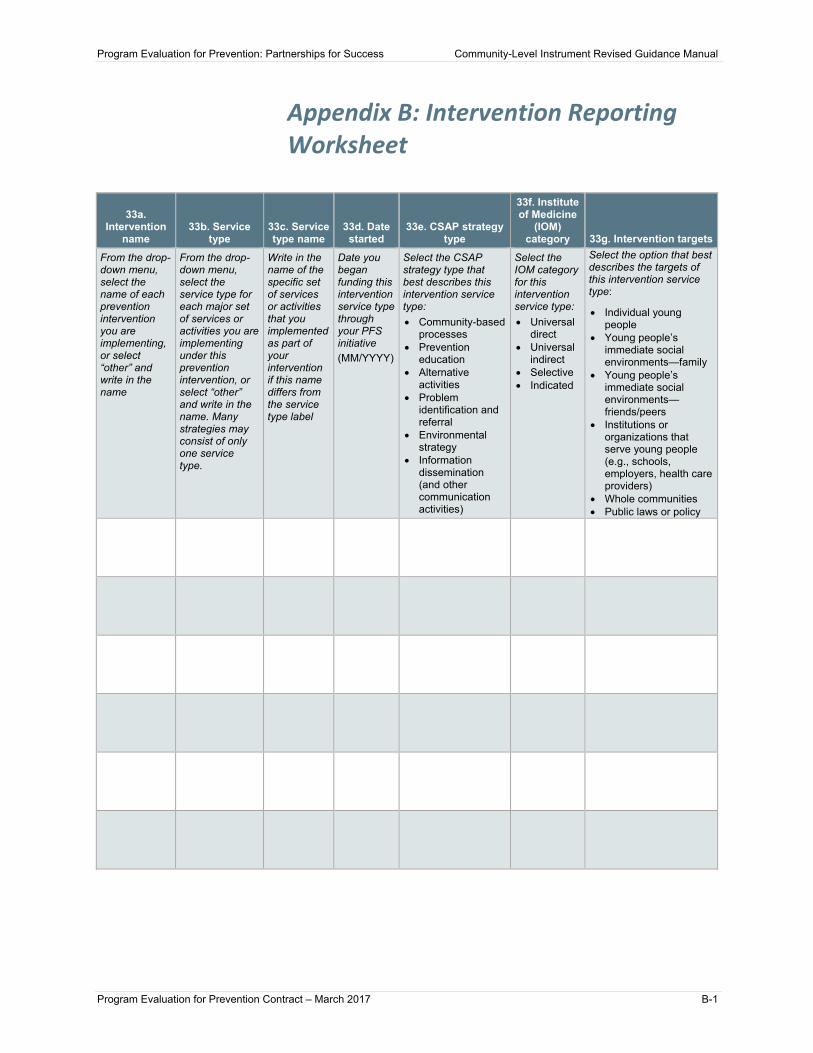
Program Evaluation for Prevention: Partnerships for Success Community-Level Instrument Revised Guidance Manual
Program Evaluation for Prevention Contract – March 2017 B-1
Appendix B: Intervention Reporting Worksheet
33a. Intervention
name 33b. Service
type 33c. Service type name
33d. Date started
33e. CSAP strategy type
33f. Institute of Medicine
(IOM) category 33g. Intervention targets
From the drop-down menu, select the name of each prevention intervention you are implementing, or select “other” and write in the name
From the drop-down menu, select the service type for each major set of services or activities you are implementing under this prevention intervention, or select “other” and write in the name. Many strategies may consist of only one service type.
Write in the name of the specific set of services or activities that you implemented as part of your intervention if this name differs from the service type label
Date you began funding this intervention service type through your PFS initiative (MM/YYYY)
Select the CSAP strategy type that best describes this intervention service type: • Community-based
processes • Prevention
education • Alternative
activities • Problem
identification and referral
• Environmental strategy
• Information dissemination (and other communication activities)
Select the IOM category for this intervention service type: • Universal
direct • Universal
indirect • Selective • Indicated
Select the option that best describes the targets of this intervention service type:
• Individual young people
• Young people’s immediate social environments—family
• Young people’s immediate social environments—friends/peers
• Institutions or organizations that serve young people (e.g., schools, employers, health care providers)
• Whole communities • Public laws or policy

Program Evaluation for Prevention: Partnerships for Success Community-Level Instrument Revised Guidance Manual
Program Evaluation for Prevention Contract – March 2017 B-2
[This page intentionally left blank.]