Embed Size (px)
Citation preview

2016Program andBudget Book
metrarail.com
Revised 11/11/2015
Winthrop Harbor
Zion
Waukegan
North Chicago
Great Lakes
Lake Bluff
Lake Forest
Fort SheridanHighwood
Highland Park
Braeside
Glencoe
Hubbard WoodsWinnetka
Indian Hill
Ravinia
KenilworthWilmette
Central St. (Evanston)
Davis St. (Evanston)
Main St. (Evanston)
Rogers Park
Ravenswood
ClybournCHICAGO
To Ken
osha
Fox LakeIngleside
Long LakeRound Lake
Grayslake
Libertyville
LakeForest
Deerfield
Lake CookRd.
Northbrook
Glenview
N. Glenview
Golf
Morton Grove
Edgebrook
Forest GlenMayfair
Irving Park
Wester
n
GraylandHealy
Harvard
McHenry
Woodstock
Crystal Lake CaryPingree Rd.
Fox River Grove
Barrington
Palatine
Arlington ParkArlington Heights
Mt. ProspectCumberland Des Plaines
Dee Road
Norwood ParkGladstone Park
Jefferson Park
Big Timber
Elgin
National St.(Elgin) B
artle
tt
Han
over
Par
k
Sch
aum
burg
Ros
elle
Med
inah
Itasc
a
Woo
d D
ale
Bens
envil
le
Man
nhei
m
Fran
klin
Park
Rive
r Gro
veEl
mwo
odPa
rkM
ont C
lare
Mar
sG
alew
ood
Hans
on P
ark
Grand/Cicero
Edison ParkRosemontSchiller ParkFranklin Park
Park Ridge
Elburn
Wes
t Chi
cago
Win
field
Whe
aton
Col
lege
Ave
.
Gle
n E
llyn
Lom
bard
Vill
a P
ark
Elm
hurs
t
Ber
kele
y
Bellw
ood
Melr
ose
Park
May
wood
Riv
erFo
rest
Oak
Park
Kedzie
Aurora Rou
te 5
9
La F
ox
Gen
eva
Nap
ervi
lle
Lisl
e
Bel
mon
t
Mai
n S
t.(D
owne
rs G
rove
)(D
owne
rs G
rove
)Fa
irvie
w A
ve.
Wes
tmon
tC
lare
ndon
Hill
sW
est H
insd
ale
Hin
sdal
eH
ighl
ands
Wes
tern
Spr
ings
Sto
ne A
ve.
Cong
ress
Par
kB
rook
field
Hol
lyw
ood
Riv
ersi
deH
arle
m A
ve.
Ber
wyn
LaVe
rgne
Cic
ero
WesternHalste
d
Joliet
Lockport
Lemont
Willow Springs
Summit55th-56th-57th St.
Laraway Road(New Lenox)
Washington St.(Grayslake)
New Lenox
Manhattan
Mokena-Front St.Hickory Creek
Tinley Park/80th Ave.
Tinley Park179th St.(Orland Park)
Oak Forest
MidlothianRobbins
Vermont St. (Blue Island)Prairie
123rd St.119th St.115th St.111th St.107th St.103rd St.
99th St.95th St.91st St.
Brainerd
153rd St.(Orland Park)
143rd St.(Orland Park)
Palos ParkPalos Heights
Worth
Chicago Ridge
OakLawn
AshburnWrightwood
University ParkRichton Park
Matteson211th St. (Lincoln Hwy.)Olympia Fields
Flossmoor
HomewoodCalumet
Hazel Crest
147th St. (Sibley Blvd.)Harvey
144th St. (Ivanhoe)
137th St. (Riverdale)
To S.Bend
Van BurenMuseum Campus/11th St.18th St.
McCormick Place27th St.
47th St.35th St./
ÒLouÓ Jones53rd St.
83rd87th91st St.95th St.
103rd St.107th St.111th St. (Pullman)115th St. (Kensington)
59th63rd
75th79th
Gresham
95th St.
WashingtonHghts.
Stony Island
Bryn Mawr
South Shore
Windsor Park
79th St.83rd St.
87th St.93rd St.
Blue
Islan
dBu
rr Oa
kAs
hland
Ave
.Ra
cine
Ave.
W. P
ullm
anSt
ewar
t Ridg
eSt
ate
St.
UP-N
MD-NUP-NW
LAKEMICHIGAN
MD-W
UP-W
BNSF
HC
RI
SWS
LAKEMcHENRY
COOK
DU PAGE
ILLINOIS / WISCONSIN STATE LINE
ILLI
NO
IS /
IND
IAN
A S
TATE
LIN
E
ME
SS
N
WILL
KANE
O'Hare Transfer
ProspectHeights
Wheeling
Buffalo GrovePrairie View
Vernon Hills
Mundelein
Prairie CrossingPrairie Crossing
Round Lake Beach
Lake Villa
Antioch NCS
La G
rang
e R
d.
Hegewisch
Martin J. Oberman ChairmanChicago
Jack E. Partelow Vice Chairman Will County
John PlanteTreasurerSuburban Cook County
Rodney S. Craig SecretarySuburban Cook County
Manuel Barbosa DirectorKane County
Romayne C. Brown DirectorCook County
Norman Carlson DirectorLake County
Don A. De Graff DirectorSuburban Cook County
Ken KoehlerDirector McHenry County
Brian K. Reaves DirectorSuburban Cook County
John P. Zediker Director DuPage County
METRA BOARD OF DIRECTORS
P R O G R A M a n d B U D G E T B O O K | 1
One and a half years have passed since Metra emerged with a new leadership team in place committed to putting our agency’s past behind us and ensuring that we are ready to provide commuter rail service that meets the needs of customers today and for generations to come.
In 2014 and 2015, our agency set out to change the way we do business, restore the public’s trust and continue to operate a commuter rail system that delivers customers to their destinations safely and efficiently.
Those familiar with how government agencies operate understand that change does not come easily to them. It takes hard work, innovation and an uncompromising commitment to make things happen.
Finding Our Path ForwardFlash forward one and a half years and you will find that Metra is a different agency than it was before – with a host of new challenges and opportunities and a new set of goals and aspirations. With this renewed spirit comes a list of accomplishments we are proud to have achieved in such a brief amount of time.
First and foremost, we have worked to adopt a more customer-focused approach to everything we do, including making investments that help our customers access the technology they want and need. In late 2015, we will unveil the Ventra App in partnership with the CTA and Pace, which will allow our customers to buy and display mobile tickets on their smartphones. We will complete installation of charging stations at all five downtown stations, and we continue to install outlets on our train cars. We will install free Wi-Fi in the waiting areas of our downtown stations, and we will be installing free Wi-Fi on 11 railcars as part of a new test. We have adjusted our website to allow customers to buy tickets with more than one form of payment, which is an important upgrade for the many riders who use pre-tax transit benefit programs. We also upgraded the schedule finder tool and train tracker on our website – and more improvements are coming. We upgraded our email alerts to make them more useful.
With our customers top of mind, we also developed a new winter plan for the agency to ensure that that we were as prepared as possible for the bite of cold and snow; became the first commuter railroad to implement a Confidential Close Call Reporting System to proactively address safety issues and create a more positive safety culture; and initiated a successful pilot program to offer weekend express service on the Rock Island Line.
To restore the public’s trust in the agency, Metra looked inward and committed itself to establishing a culture of integrity and ethics in our workplaces. We have a new Ethics Manual available to all Metra employees. We now have a training program in place to provide guidance to employees on issues such as conflicts of interest and the Freedom of Information Act and are proactively promoting the role of the state’s Office of the Inspector General to our employees and the public.
We also posted a variety of new information on the agency’s website to enhance transparency and accountability. New
information includes Metra employee compensation information, a summary of awarded contracts, a listing of the agency’s monthly expenditures, Freedom of Information Act requests, contract bid tabulations and our annual procurement plan, as well as live streaming of Board meetings and an archive of meeting videos.
Last year, the Metra Board enacted sunshine measures focusing on patronage hiring requests and imposed penalties upon employees who are complicit in them. The Board also made the decision to stop retaining outside Board counsel and transition legal work back to in-house counsel to build institutional knowledge and reduce legal expenses.
Metra also took on the challenge of restructuring its police department in 2014 and hired a new Chief of Police who has worked to decrease overtime pay costs while maintaining safe operations systemwide. In 2015, the agency hired a new Chief External Affairs Officer to reorganize its communications and government relations departments and work to evolve Metra’s brand to ensure that the agency is able to attract the next generation of commuter rail customers. Also in 2015, Metra hired a new Chief Human Resources Officer to enhance this critical agency function.
Other structural reforms implemented recently include passing an ordinance to create a new Chief Audit Officer position who reports directly to the Executive Director and the Metra Board. Today, the agency is working to develop a robust and independent audit department to improve internal processes and implement new controls aimed at making sure that Metra is operating as efficiently and effectively as possible.
In addition, Metra is currently undertaking a major initiative to replace its aging mainframe systems with an Enterprise Resource Planning (ERP) system. The new ERP, scheduled for completion by the end of 2017, will enable much-needed integration across various business functions currently supported by disparate systems, improving integration across the agency’s various departments and back-office business functions, including accounting, inventory, procurement and grant management.
And, perhaps most notably, Metra has committed itself to being a responsible steward of public funds and finding ways to continue to invest in our railroad infrastructure with increasingly limited financial resources.
Today, despite operating with the oldest fleet and on the most complex commuter rail system in North America, Metra provides the most reliable on-time service at the lowest cost of any other railroad in the nation.
Making Smart Investments in Our FutureLast year, for the first time in the agency’s history, Metra unveiled a $2.4 billion plan to modernize its rail fleet, the first long-range rolling stock plan in Metra history. To do that, Metra increased fares to address current and future operations, equipment and other critical infrastructure needs like the federally mandated Positive Train Control system rather than respond in a fiscally irresponsible manner by kicking the proverbial budget can down the road.
MESSAGE FROM OUR BOARD CHAIRMAN AND EXECUTIVE DIRECTOR/CEO
(continued)

2 | P R O G R A M a n d B U D G E T B O O K
Also for the first time, Metra released a projection for fare increases for the next 10 years to cover further financing and projected expense growth. While this action may not have been popular, we believe it demonstrates the transformation of Metra, its employees and its Board.
Over the past few months, as we looked ahead and began planning for 2016, several important themes have guided our efforts. First, we must continue to invest in infrastructure to meet our growing list of unmet capital needs – now totaling more than $11.7 billion over the next decade to achieve and maintain a state of good repair. Second, we must make good on the promise we made to our customers to focus our resources on new railcars, locomotives and continuing our work to install PTC. Third, if we can find ways to avoid higher fares, we will do it.
We also promised our customers that we would continue to review our budget to find ways to cut costs. As we began our work on the 2016 budget, our goal was to comb through our spending plans to identify additional efficiencies and to look for ways to do more with less. In September, we were pleased to announce savings and efficiencies totaling $5.7 million. These cuts are in addition to the $7.8 million in reductions achieved as part of last year’s budget process and nearly $6 million of recurring budget savings found in the years prior to 2015.
The 2016 Budget that we have approved continues to make smart investments in our agency’s future and includes $759.8 million for operations and $185.7 million for capital improvements.
Last year, Metra projected that it would likely need a 5 percent increase in fare revenue in 2016, including 3 percent to cover expected inflationary costs. By finding budget efficiencies, making management improvements and being responsible with our finances in 2015, we have determined that we can get by with a 2 percent net increase in fare revenue – $6.5 million – to pay for the new operating costs of PTC and to help fund a bare-bones capital budget. Even with this increase, Metra’s one-way and monthly fares remain the lowest of any of its peer railroads in the nation.
But, we want to be clear – without a state bond program in 2016 and due to the budget stalemate in Springfield, approximately $400 million of Metra’s capital projects are currently on hold, including improvements to 16 Metra train stations, two rail yards, a major bridge replacement program on the Union Pacific North Line and the completion of a third track on the Union Pacific West Line. Further, if the state’s bond program proceeds do not materialize in 2016, we may need an even larger-than-expected increase in fare revenue in 2017.
We hope our customers are on board with the plans we have to invest in Metra’s future in 2016. Without them, our agency would fall even further behind – and that’s not a risk we are willing to take. As we’ve said, it takes hard work, innovation and an uncompromising commitment to make things happen. We assure our customers that we are up to the challenge.
MARTIN J. OBERMAN DON ORSENOChairman Executive Director/CEO
MESSAGE FROM OUR BOARD CHAIRMAN AND EXECUTIVE DIRECTOR/CEO
(continued from page 2)

P R O G R A M a n d B U D G E T B O O K | 3
Message from Board Chairman
and Executive Director 1
Modernization Plan 4
System Overview 6
Funding Overview 7
Ridership 8
Fares 9
Organization 11
Oversight 16
Other Major Initiatives 17
Capital Program 19
Non-Capital Programs 21
2016 Budget Overview 22
Appendix 25
TABLE OF CONTENTS

4 | P R O G R A M a n d B U D G E T B O O K
In 2014, Metra unveiled a $2.4 billion plan to modernize its rail fleet. It was the first long-range rolling stock plan in Metra history. The 10-year plan calls for buying 367 new railcars and 52 new locomotives, and renovating 455 railcars and 85 locomotives. It also allows Metra to fund installation of the federally mandated and unfunded Positive Train Control (PTC) safety system.
Several factors led to the Board of Directors’ decision to move forward with the modernization plan. The first is simply that Metra’s fleet is old – we have the oldest fleet in the nation compared to our peer railroads, and some of our cars date from the Eisenhower administration. Rolling stock is not the only need, of course – we estimate we need $11.7 billion over the next decade to achieve and maintain a state of good repair on our system. Half of our assets are estimated to be in marginal or worn condition. But the Board opted to prioritize replacing railcars and locomotives because of their age and because of their critical role in allowing Metra to provide high-quality, reliable and comfortable service to customers.
The Board also decided to act after recognizing that Metra’s traditional sources for capital funds – Washington and Springfield – were falling far short of meeting our needs. Rather than sit back and accept the shortfall, the Board opted to pass an aggressive, multi-billion dollar program to begin to tackle the problem. Further, to demonstrate its commitment, the Board approved the first financing program in Metra history.
Metra intends to employ $400 million in financing to help fund the modernization program and projected that it would finance approximately $100 million in 2015, 2017, 2019 and 2022 through new bonds, loans or other innovative financing strategies. Due to uncertain market conditions and undefined funding sources, Metra made the responsible decision not to pursue its first financing in 2015. The fare revenue set aside for the debt service over the course of last year remains in place to be spent on financing costs in future years or Board-approved capital projects related to the advancement of PTC and the modernization program.
The plan anticipated that current state and federal funding sources would cover an additional $710 million of the $2.4 billion program over the next 10 years: $224.9 million from the state bond program, $30 million in RTA bonds
and $457 million in federal formula funding. With those funding sources identified, Metra still needs an additional $1.3 billion over the next decade. To cover that $1.3 billion, Metra is pursuing additional federal and state funding, new financing strategies and alternative financing mechanisms.
One year later, the modernization plan is off to a strong start. By the end of 2015, we expect to have rehabbed 30 cars at our 49th Street Shop along the Rock Island Line. The rehabilitation of 41 Budd cars built in 1974 and last renovated in the 1990s is now underway at our Kensington Yard, another Metra facility on the south side along the Metra Electric Line. The 2016 Budget includes funds to start purchasing supplies for the renovation of two more groups of railcars – the first 30 of 302 Nippon Sharyo cars built in the 2000s, and 26 Metra Electric Highliners, also built in the 2000s. We also expect to begin design work in 2016 to upgrade the 49th Street Shop so we can boost the number of cars that can be renovated there. In addition, Metra has also started upgrading 27 locomotives at our 47th Street Diesel Shop along the Rock Island Line and, in February, the Board approved a $91.1 million contract with Progress Rail to rehabilitate 41 additional locomotives. The budget also includes money to start buying new cars. Under the plan, new cars were not expected until 2018 and new locomotives were not expected until 2020.
But the future of the modernization plan is far from certain. The $224.9 million that we were expecting from the state bond program is on hold. If the state’s bond program proceeds do not materialize in 2016, we may need an even larger-than-projected increase in fare revenue in 2017. (In November 2014 we projected an 8.5 percent increase for 2017.)
MODERNIZATION PLAN UPDATE

P R O G R A M a n d B U D G E T B O O K | 5
POSITIVE TRAIN CONTROL UPDATE
Positive Train Control (PTC) is a safety system that integrates with existing train control and operating systems. PTC uses global positioning system (GPS) technology to automatically ensure the train crew’s compliance with operating instructions and speed limits on the railroad. PTC will also include a computer display to provide the train crew with additional operating information, relaying information from wayside devices about rail conditions, switch alignment and signal aspects in real time. The system will help prevent track authority violations, speed limit violations and unauthorized entry into work zones, and will have the ability to automatically slow or stop trains before an accident occurs.
PTC is a federally mandated and unfunded initiative that is expected to cost Metra more than $350 million.
Congress in October 2015 approved a three-year extension of the deadline for railroads to implement PTC. Congress had originally set a Dec. 31, 2015 deadline for implementation. However, Metra and the rest of the U.S. railroad industry had been warning for years that there are a variety of technological, operational, regulatory and financial challenges that made the 2015 deadline
unattainable. Metra had feared it may have to shut down service in January 2016 unless the deadline was extended. Metra will make every effort to meet the new deadline.
Metra would like to thank Senators Dick Durbin and Mark Kirk and Representatives Mike Quigley, Dan Lipinski and Bob Dold in particular, as well as the entire Metra congressional delegation, for their unending support during this critical time. Their strong commitment and tireless advocacy for this extension is what made the passage of this legislation possible. This news can finally put all of our minds at ease, knowing that Metra’s trains will continue operating in January.
POSTIVE TRAIN CONTROL UPDATE
SERVICE MAINTENANCE AND CAPITAL INVESTMENT
In 2012 Metra had dropped one rank position to become the agency with the oldest average fleet, a position it retained in 2013 although 56 new vehicles were brought into its fleet. However, vehicle mid-life rehabilitation and end-of-life rebuild schedules have enabled Metra to maintain its older fleet in a relative state of good repair, evidenced by its ranking in the top three for miles between major mechanical failures for the fifth consecutive year.
With an average fleet age of 29.6 years, Metra’s revenue vehicles are, on average, over 10 years older than the peer average. Metra will complete the replacement of all vehicles on its Electric District Line in 2016 and has developed its first long-term capital investment fleet modernization plan.
Exhibit 1RTA SUB-REGIONAL PERFORMANCE MEASURE (2013) AVERAGE FLEET AGE METRA VS. PEER AGENCIES
11.7 15.9 16.7 23.5 25.5 29.6
PEER AVERAGE
18.7
LIRR MNCR NJT MBTA SEPTA METRA
AVERAGE AGE (YEARS)

6 | P R O G R A M a n d B U D G E T B O O K
Metra is the largest commuter railroad in the nation based on miles of track and the second largest based on ridership, providing 300,000 rides each weekday. Metra’s primary mission is to provide safe, reliable and efficient commuter rail service that enhances the economic and environmental health of the Northeast Illinois region it serves.
In 2014, Metra provided 83.4 million passenger trips, and for 2015, Metra projects ridership will decrease 1.1 percent to 82.5 million.
The Metra service area encompasses a six-county region of more than 3,700 square miles. Metra operates 703 weekday trains on 11 rail lines that serve 241 stations. Metra owns and operates four rail lines (Rock Island, Metra Electric, Milwaukee North and Milwaukee West). Three Metra lines are operated by Metra employees over freight railroad-owned track through trackage rights or lease agreements (Heritage Corridor, North Central Service and SouthWest Service). Four additional Metra lines are operated directly by freight railroads through purchase-of-service agreements (BNSF, Union Pacific North, Union Pacific Northwest and Union Pacific West lines).
METRA BY THE NUMBERS
• 83.4 million passenger trips in 2014• 703 weekday trains, 296 Saturday trains and
163 Sunday trains• 241 stations (5 downtown, 236 outlying)• 1,155 miles of track• 488 route miles• 146 locomotives• 843 diesel passenger rail cars (includes cab
cars and trailer cars)• 185 electric propelled passenger rail cars• 821 bridges• 571 grade crossings• 24 rail yards (6 downtown, 18 outlying)• 90,634 parking spaces• 11 electrical substations• 4 electrical tie stations• 12 fuel facilities
SYSTEM OVERVIEW

P R O G R A M a n d B U D G E T B O O K | 7
FUNDING OVERVIEW
Capital: $185.7 millionOperations: $759.8 million
Metra provides a vital transportation link for 300,000 commuters each weekday. Since 1985, Metra has invested more than $6 billion to rebuild, maintain and expand the region’s passenger rail network. Public funding for transit is provided for two broad categories: operations and capital.
In the six-county region of northeast Illinois served by Metra, operations funding is provided through system-generated revenues – primarily fares – and subsidized in large part through a regional sales tax. Capital funding is provided through a variety of federal programs and state and local funding sources, including bond programs. with a small amount of fare revenue. For 2016, Metra’s total budget for operations and capital is $945.5 million. As shown in Exhibit 2 below, this total includes $759.8 million for operations and $185.7 million for capital.
Exhibit 22016 FUNDING DISTRIBUTIONTOTAL $945.5 MILLION
OPERATIONS FUNDING
Under the provisions of the Regional Transportation Authority Act, the RTA and the service boards (Metra, CTA and Pace) are required to recover a combined 50 percent of operating expenses through fares and other revenues. The RTA sets individual recovery ratios for each of the operating agencies to achieve this requirement as part of the budgeting process. The RTA revenue recovery ratio mark for Metra is 52.0 percent in 2016. Metra’s 2016 budget achieves a recovery ratio of 52.4 percent.
Metra is committed to a balanced operating budget without using capital dollars to fund operating activities. Working with RTA and other service board staff, Metra has realized additional sources of funding for 2016 and the out years of this budget. In 2016, Metra will receive funds from the RTA Innovation, Coordination & Enhancement Program (ICE). However, Metra’s operating funding needs for 2016 are larger than what is available through these funding sources. Therefore, Metra approved an increase in fare revenue of 2 percent to bridge this gap and help our capital budget. Combined, the funding and the fare increase will fully fund operations, maintenance, support and other activities critical to providing train service.
CAPITAL FUNDING
Federal State of Good Repair and Federal Formula funds, in addition to Metra’s farebox capital, are the source of funds for Metra’s 2016 Capital Program. Other funding sources that supplement Metra’s capital program include federal Congestion Mitigation and Air Quality (CMAQ) funding and RTA Innovation, Coordination & Enhancement (ICE) funds. A more detailed discussion of Metra’s 2016-2020 capital program begins on page 19. Tables and project descriptions for Metra’s 2016-2020 program are include in the Appendix of this document (pages 25-55) and show funding available from current sources.

8 | P R O G R A M a n d B U D G E T B O O K
30
40
50
60
70
80
90
83 84 85 86 87 88 89 90 91 92 93 94 95 96 97 98 99 00 01 02 03 04 05 06 07 08 09 10 11 12 13 14 *15
Pass
enge
r Trip
s (M
illion
s)
Metra’s core customers are morning commuters to Chicago’s central business district. As employment grows in the downtown area, ridership increases on Metra. This means that Metra’s future depends on a thriving downtown; but it is equally true that downtown and all communities along the commuter rail lines need Metra service to support a growing workforce.
The most recent U.S. census data on work trips and annual ridership estimates illustrate this critical relationship between a growing workforce and Metra. Between 2002 and 2011, the number of workers commuting downtown grew by 36,000, from 347,000 to 383,000. During the same period, Metra’s annual fare-paying passenger trips grew by 3.9 million, from approximately 75.5 million to 79.4 million.
In addition to downtown employment, other factors encourage or discourage ridership. Metra has control over some of these factors, such as fares, train capacity, on-time performance and general service reliability. In 2014, Metra undertook a customer satisfaction survey, an origin-destination survey, and rider boarding and alighting counts to measure how the service is used by riders and what they think of the service provided. In 2015, Metra decided to conduct additional customer satisfaction surveys to more frequently track its performance in delivering reliable and safe transportation that represents a good value to its customers. The results of this work will guide efforts to encourage more ridership.
Outside of Metra’s control, some events work in favor of ridership, such as major highway construction, highway toll increases, rises in gas prices and Chicago parking rates, and major sporting events such as the Stanley Cup or World Series. Other outside forces work against ridership, such as declining population and employment near Metra stations.
Metra is committed to growing ridership across all market segments by positioning its service as the preferred mode of travel in terms of reliability, efficiency and convenience. To deliver on this strategy, Metra needs to amply maintain its infrastructure to ensure extremely reliable service. Ongoing capital projects and funding through the State of Illinois Bond Program, the RTA State of Good Repair Bond Program, and Metra’s modernization financing program will help Metra achieve this goal. The 2016 budget forecasts ridership to decrease 0.8 percent (See Exhibit 19 on page 45).
Metra’s 2015 ridership through August is 1.2 percent lower than 2014 and 0.3 percent lower than the budgeted goal. We anticipate yearend ridership to be 82.5 million.
Exhibit 3 METRA SYSTEM ANNUAL RIDERSHIP (JANUARY-DECEMBER FREE AND REPORTED TRIPS)
RIDERSHIP
*Estimate

P R O G R A M a n d B U D G E T B O O K | 9
Metra fares are set according to travel between designated fare zones, which are established at five-mile intervals beginning at each rail line’s downtown Chicago terminal. A uniform base fare is charged for travel with a zone and increments are added to the base fare as additional fare zone boundaries are crossed. Within the general structure of zones and one-way fares, an assortment of ticket types are designed to allow flexibility in the use of Metra services; these are described in Exhibit 4 below.
Exhibit 4METRA TICKET TYPES
Ticket Type Period of Validity Number of Rides
Monthly* Calendar month and first business day of next month Unlimited
Ten-Ride* One year Ten
One-Way* 90 days One
Weekend Saturday/Sunday Unlimited
*These ticket types are offered at a reduced rate to senior citizens, persons with disabilities, children, students through high school and active duty military personnel. Restrictions and more details on these reduced fare programs can be found at www.metrarail.com.
For an additional fee, Metra monthly ticket holders can use a Link-Up pass, which allows peak-period travel on CTA and unlimited travel on Pace scheduled routes, or a PlusBus pass, which allows unlimited travel on Pace scheduled routes.
Fare Policy Principles
During the 2012 budget review process, the Metra Board adopted the following principles for fare policy:
• Consider regular fare adjustments that ensure a balanced budget, keep pace with inflation and avoid significant, infrequent fare increases.
• Allow no diversion of capital-eligible funds to the operating budget.• Acknowledge the total cost and the total value of providing services.• Maintain a fair pricing structure that maximizes revenues.• Review fare media to improve fare collection and simplify overall collection activities and reconciliation.• Minimize on-train transactions and overall transaction costs.• Recognize that convenience has a value.• Equalize fare differentials by zone over time.• Evaluate fare policies of partner and peer agencies.
FARES

1 0 | P R O G R A M a n d B U D G E T B O O K
The following fare changes were approved for 2016:
• Increase adult One-Way fares $0.25 in all zones (2.4 percent to 7.7 percent)• Increase adult 10-Ride fares $1.75 in all zones (1.9 percent to 6.0 percent)• Increase adult Monthly fares $2.50 in all zones (0.9 percent to 2.7 percent)• Increase reduced 10-Ride fares $0.75 in all zones (1.7 percent to 5.6 percent)• Increase reduced Monthly fares $1.25 in all zones (0.7 percent to 2.4 percent)
The changes result in a net increase in fare revenue of 2 percent. No changes for any other ticket types or in any ticket policies were approved. Fare tables showing fares by zone and ticket type can be found in Exhibits 23 and 24 on pages 50-51.
Exhibit 5METRA ONE-WAY FARES (ZONE E) VS. CPI & PEERS
Metra’s average fare has always been lower than its peers’ average. This difference has grown over the last 26 years as its peers have raised fares by much greater amounts. Even when the higher cost of living on the East Coast is considered (Chicago is roughly 90 percent as expensive), Metra fares are much lower. In addition, Metra fares have also not kept pace with inflation. Exhibit 5 shows the growth in the most common Metra one-way fare since 1983, as well as the growth in the consumer price index and the growth of the average of the corresponding fares for Metra’s peer railroads.
Exhibit 6 below shows a comparison of Metra monthly fares in 1990, 2010 and 2015 to those of its large peers, averaged together, for four selected zone pairs. Compared to commuter rail in the other regions, the Chicago region has always had lower average fares. In 1990, Metra fares by zone were lower than the average of our peer agencies. Since 1990, the difference between what riders pay in this region compared to the other areas has grown considerably. For example, a monthly fare for a Zone AE Metra rider in 1990 cost about $90, while the peer average for the same distance of travel was about $20 more. In 2015, Metra’s Zone AE rider pays $171, while the peer average is $252, or $81 more. Over the last 26 years, Metra’s average monthly fares increased by 83 percent, while as a group, Metra’s peers’ average fare increased by 142 percent. Exhibit 6METRA VS. PEER MONTHLY FARES
Monthly Tickets Fares by Selected Zone: 1990, 2010 & 2015Metra Distance in Effect 1990* in Effect 2010* in Effect 2015*Zone Pair (miles) Metra Avg.+ % Diff Metra Avg.+ % Diff Metra Avg.+ % DiffAB 5.1 - 10.0 $47 $69 46% $63 $141 122% $100 $171 72%AE 20.1 - 25.0 $89 $106 19% $116 $216 86% $171 $252 47%AH 35.1 - 40.0 $120 $140 17% $153 $280 84% $214 $329 54%AK 50.1 - 55.0 $151 $167 10% $190 $352 85% $264 $397 51%*2015 fares effective as of 10/1/2015. +Average of large agencies, not including Metra
Metra One-Way Fares (Zone E) vs. CPI & Peers (w/ Proposed 2016 Metra Fare)
$2.00
$3.00
$4.00
$5.00
$6.00
$7.00
$8.00
$9.00
$10.00
Metra Fare CPI Adjusted Metra FareAverage Peer Fare Proposed Metra Fare
Average Peer Fare includes MBTA (Boston), LIRR & MNR (New York) , NJT (New Jersey), and SEPTA (Philadelphia).Data not available for all peers in all years. Consumer Price Index (CPI) & Peer Fares collected from June of each year.
Average Peer Fare includes MBTA (Boston), LIRR & MNR (New York) , NJT (New Jersey), and SEPTA (Philadelphia). Data not available for all peers in all years. Consumer Price Index (CPI) & Peer Fares collected from June of each year.

P R O G R A M a n d B U D G E T B O O K | 1 1
Metra’s operations and policies are guided by an 11-member Board of Directors. The chairmen of the Boards of the counties of DuPage, Kane, Lake, McHenry and Will each appoint one director. Four additional directors are appointed by the suburban members of the Cook County Board. One director is appointed by the president of the Cook County Board and one director is appointed by the mayor of City of Chicago. The chairman of the Metra Board is elected by a vote of the board membership. Metra’s day-to-day operations are overseen by its CEO and executive team. Metra’s organizational structure is detailed in Exhibit 7.
OPERATIONS
Exhibit 7METRA ORGANIZATIONAL UNITS
BUDGET, MGMT ANALYSIS & CONTRACTSSenior Director
INFORMATION TECHNOLOGYChief Information
Officer
ACCOUNTINGController
GRANT MANAGEMENT
Senior DirectorLABOR RELATIONS
General Director
WORKFORCE ED, TRAINING & CERT
Senior Director
ENGINEERINGChief Engineering
Officer
MECHANICALChief Mechanical
Officer
TRANSPORTATIONChief Transportation
Officer
REAL ESTATE & CONTRACT
MANAGEMENTDirector
STRATEGIC CAPITAL
PLANNINGSr. Division Director
GENERAL ADMINISTRATIONSr. Division Director
EEO & DIVERSITY INITIATIVES
Senior Director
SAFETY & ENVIRONMENT
Chief Safety & Environment Officer
POLICE & SECURITY SERVICES
Chief of Police
BUSINESS DIVERSITY & CIVIL RIGHTS
Senior Director
FINANCIAL AFFAIRSChief Financial Officer
HUMAN RESOURCES Chief Human Resources
Officer
EXTERNAL AFFAIRSChief External Affairs
Officer
AUDITChief Audit Officer
LAWGeneral Counsel
DEPUTY EXECUTIVE DIRECTOROPERATIONS
EXECUTIVE DIRECTOR/CHIEF EXECUTIVE OFFICER
DONALD ORSENO
METRABOARD OF DIRECTORS
DEPUTY EXECUTIVE DIRECTORADMINISTRATION
ORGANIZATION
COMMUNICATIONSDirector
GOVERNMENT AFFAIRS
Legislative Affairs Officer
MARKETINGDirector
TREASURYDirector

1 2 | P R O G R A M a n d B U D G E T B O O K
OPERATIONS
Metra’s Operations are overseen by the Deputy Executive Director,Operations, who provides executive direction and guidance to the chief officers of Engineering, Transportation and Mechanical as well as Labor Relations andWorkforce Education Training and Certification. The division also provides executive oversight and direction to contract carriers (BNSF and Union Pacific) to ensure that rail operations are consistent with Metra’s standards and practices.
ENGINEERING
Engineering is responsible for building and maintaining the majority of Metra’s fixed assets, such as buildings, stations, bridges, track, electrical, telecommunications and signal systems. The department also monitors the condition of and assists in building and maintaining the fixed assets on the freight lines where Metra trains operate. The Engineering Department is divided into two major groups: Capital Projects and Communications and Maintenance. The department is staffed by more than 700 employees.
MECHANICAL
Mechanical coordinates and oversees the repair, inspection, cleaning, rebuilding, replacing and maintenance of 1,164 pieces of rolling stock used in commuter service. The department’s goal is to provide safe, clean and reliable service while maintaining the fleet to the standards of the Federal Railroad Administration, Association of American Railroads, American Public Transit Association and Original Equipment Manufacturer.
The Mechanical Department is also responsible for overseeing Metra’s fleet of 463 trucks and automobiles. The department employs 650 people.
TRANSPORTATION
Transportation is responsible for providing safe, efficient and dependable transportation to commuters on all Metra-operated
lines (Milwaukee District North and West, Rock Island, Metra Electric District, SouthWest Service, North Central Service and HeritageCorridor) and those operating under purchase-of service agreements (BNSF and Union Pacific lines).
In addition to all employees directly involved in providing train service, the Transportation Department also oversees the Rules Department, Dispatching Office, Crew Management Center, Station Services, Customer Service, Ticket Services and GPS Center. The department is staffed by nearly 900 employees.
LABOR RELATIONS
Metra’s Labor Relations Department is charged with the responsibility for the negotiation and administration of 17 collective bargaining agreements between the Northeast IllinoisRegional Commuter Railroad Corporation (NIRCRC d.b.a. Metra) and its employees represented by 14 unions. These responsibilities include representing Metra in arbitration with respect to minor disputes and the ongoing negotiations meant to reach amicable settlements and thus avoid a major dispute as defined by the Railway Labor Act with each of these unions. As its core mission, Labor Relations builds and maintains productive relationships with employee representatives to ensure a professional and cooperative association that ensures continuity of service and controlled adjudication of disputes.
WORKFORCE EDUCATIONTRAINING & CERTIFICATION
Metra requires a skilled workforce practicing a variety of railroad specific trades and Metra must continue training and development of employees to meet the specific needs of operating and maintaining rail service. The Workforce Education and the Training and Certification departments conduct and oversee training programs that enable current employees to meet regulatory mandates and help new employees develop necessary skills.
HUMAN RESOURCES
Metra’s Human Resources Department’s mission is to recruit and retain qualified employees in a diverse workforce; treat all employees fairly; facilitate training and professional development for career growth; effectively manage and administer compensation; negotiate and administer flexible benefit programs that provide quality and value; administer medical leaves and related services; promote wellness; provide confidential and efficient records administration; ensure that Metra’s policies and procedures comply with all laws governing employment, benefits and other ancillary services; and foster an environment of trust and mutual respect with employees as well as internal and external partners. Human Resources is staffed by 30 employees.
FINANCIAL AFFAIRS
Financial Affairs is headed by the Chief Financial Officer (CFO) and divided into five groups: Treasury; General Accounting; Budget, Management Analysis and Contracts; Grant Management; and Information Technology. The core mission of these groups is to provide accurate financial information so that Metra can run its business efficiently. Together these departments employ approximately 160 people.
TREASURY OPERATIONS
This group, headed up by the Director of Treasury, processes all collections and disbursements made by the organization. The group also invests available operating and capital funds and forecasts cash balances and cash needs for the organization.
GENERAL ACCOUNTING
Reporting to the Controller, this group is charged with the accurate and timely processing of transactions and production of financial statements. The group is divided into five sections: accounting, accounts payable, accounts receivable, payroll and revenue accounting.

P R O G R A M a n d B U D G E T B O O K | 1 3
BUDGET, MANAGEMENT ANALYSIS AND CONTRACTS
This group is divided into three sections and reports to the Senior Director of Budget, Management Analysis and Contracts. The Budget section is charged with the accurate and timely production of annual budgets and monthly variance reporting. The Management Analysis section is charged with reviewing financial statements, operating reports and invoices from freight railroads that have purchase-of-service, trackage or joint facility agreements with Metra. The Contracts section is charged with the day-to-day management and periodic renegotiation of various contracts with other railroads and with utility providers.
GRANT MANAGEMENT AND ACCOUNTING
This group is divided into four sections: development, administration, reimbursement and accounting. These sections report to the Senior Director, Grant Management and Accounting.
Grant Development coordinates program-level information for each project, creating detailed scope and account information suitable for funding agency grants and Metra’s financial accounting system, and submitting applications for capital, operating and demonstration grants to appropriate funding agencies. Grant Administration tracks approved grant contracts, sets up project budgets in Metra’s financial accounting system, provides financial oversight in project implementation, and reports project and grant level progress to the funding agencies.
Grant Reimbursement requests reimbursements from funding agencies for capital expenditures, closes out capital projects and grants after implementation, and provides information on grant-related activities for audits and funding agency reviews.
Grant Accounting develops and maintains records and reports related to fixed assets, depreciation, funding agency equity and capital grant receivables, and reconciles reimbursements with capital expenditures, fixed assets and other general ledger accounts. INFORMATION TECHNOLOGY
This group is divided into three sections: Computer Operations, Network Services and Systems Development. The group reports to the Chief Information Officer.
The Computer Operations section is charged with maintaining and supporting Metra’s major systems, including all financial systems, the revenue accounting and ticketing systems, the warranty and maintenance tracking system used by the Mechanical department to monitor federal train inspection mandates and ensure that Metra is in compliance with those mandates, and other major systems. In addition, the section is responsible for the operation of the mainframe computer, mainframe software and security, and other centralized computer equipment.
The Network Services section maintains and supports all Metra workstations and software. These systems not only include personal computers running office productivity software but also more complex systems running specific software for computer aided design (CAD) for the Engineering department. As Metra’s internal network has expanded dramatically over the past five years, this section has added staff to meet the challenge of supporting the Metra network.
The Systems Development section develops, maintains and supports all production application systems for Metra. This entails all mainframe and server-based applications, including packages and in-house systems, as well as any interfaces with outside agencies.
BUSINESS DIVERSITY & CIVIL RIGHTS
The Office of Business Diversity and Civil Rights (OBDCR) is responsible for administering the Disadvantaged Business Enterprise (DBE) and Title VI programs. Through these programs, the OBDCR works to ensure non-discrimination in the award and administration of Metra contracts, and make certain that all individuals have access to Metra’s transit services, regardless of race, color, gender or national origin.
EXTERNAL AFFAIRS
This group is divided into three sections: Marketing, Government Affairs and Communications. The group reports to the Chief External Affairs Officer.
The Marketing Department works to increase Metra’s ridership base and non-fare revenues. The group is responsible for marketing promotions, business development and overseeing advertising contracts for display advertising at Metra-owned facilities and on Metra trains.
The Government Affairs Department provides strategic advice to the Metra Board, executive director and senior staff on issues relating to Metra’s state and federal legislative agendas. The department also develops and implements Metra’s state and federal legislative programs and communicates Metra’s position on various transportation policies and legislative issues. Government Affairs staff work with members and staff of the Illinois General Assembly, executive officers of the State of Illinois, Illinois Department of Transportation, the U.S. Congress and officials of federal regulatory agencies such as the U.S. Department of Transportation, Federal Railroad Administration, Federal Transit Administration and 200 communities in Metra’s six-county service region.

1 4 | P R O G R A M a n d B U D G E T B O O K
The Communications Department acts as the agency’s primary channel to interact with the media and various stakeholder groups across the region. The team acts as the primary source for the distribution of information to the media regarding Metra services, policies and initiatives. Members of the department also respond to all customer e-mails. This team also oversees Metra’s website (www.metrarail.com), one of the primary vehicles Metra uses to communicate with the public on service and policy issues. This team works with departments across the agency as well as outside contractors to maintain accurate and updated data, develop and integrate new content, and address technical issues.
Metra’s print and design services team works with all three departments and is responsible for creating and implementing design and brand standards for all graphic materials produced for use by the agency. The department is also responsible for printing contract management and fulfillment.
POLICE & SECURITY SERVICES
The Metra Police Department serves and protects commuters using the Metra system and protects Metra’s property. The mission of the Metra Police is to safeguard the lives and property of the people they serve, to reduce the incidence and fear of crime, and to enhance public safety. Metra Police work to expedite all onboard issues with the commuting public as well as the handling of vehicle accidents and trespasser incidents on Metra railroad right-of-way and property. Metra Police actively engage and work with first responders as well as local, state and federal agencies during service disruptions and partner with these agencies on security planning. Their work ensures the safety of Metra’s passengers and employees and reduces train delays.
SAFETY
Safety is Metra’s top priority. Metra’s Safety Department is responsible for the implementation, oversight and coordination of the agency’s passenger and employee safety programs, designed to promote the safest travel and working environment possible. The department oversees Metra’s employee workplace safety programs and training, passenger safety programs, rail safety education and outreach programs, and emergency evacuation training for first responders. The department is also responsible for reporting all railroad incident and accident data to the appropriate federal and state regulatory agencies
ADMINISTRATION
Metra’s administrative activities are overseen by the Deputy Executive Director, Administration. The Administration Division is principally charged with providing support resources to the Operations employees who deliver train service to our customers. Whether engaging customers or collaborating with regional stakeholders to develop strategic transportation plans, hiring and training new personnel, managing real estate assets, or negotiating service contracts to deliver the best value for taxpayers, the employees assigned to the Administration Division play a major role in supporting Metra’s core mission of moving people safely and on time.
REAL ESTATE & CONTRACT MANAGEMENT
The core mission of the Real Estate and Contract Management Department is to maximize Metra’s non-passenger revenue and minimize its liability exposure through effective negotiation, pricing and contract administration of Metra property and real estate assets. The department’s activities support the agency’s core mission by participating in real estate/property acquisition for station and parking areas, managing station and vendor facilities and ensuring that utility easements placed in the right-of-way are in compliance with Metra’s engineering standards for safe travel.
STRATEGIC CAPITAL PLANNING
The Strategic Capital Planning group provides support services in many areas within and outside Metra. The group consists of three departments: Capital Program Development, Long-Range Planning and System Performance and Data.
The Capital Program Development Department develops the capital program and amendments and prepares all discretionary grant applications. The Long-Range Planning Department identifies new opportunities for expanding and enhancing the rail system, including line extensions, development of new routes, adding new stations on existing rail lines, and transit-oriented development in station areas. Long-Range Planning also participates in studies led by other entities that will impact Metra operations or Metra riders.
The System Performance and Data Department prepares monthly reports on system ridership, on-time performance and capacity utilization of trains, based on data from other Metra divisions. The department also manages periodic surveys, counts and analyses of our riders and monitors Metra’s adherence to Title VI and other equity standards for the provision of transportation service.
GENERAL ADMINISTRATION
General Administration consists of three divisions, Procurement, Professional Services/Contracts and Materials. The purpose of the Materials Management Department is to serve various customers within Metra by soliciting and procuring goods or services required for operations. Additionally, the department operates Metra’s four storehouses, maintaining, distributing and safeguarding the inventories contained within them.

P R O G R A M a n d B U D G E T B O O K | 1 5
EEO & DIVERSITY INITIATIVES
The Equal Employment Opportunity (EEO)/Diversity Initiatives Department works to develop and administer an effective EEO Program that will be carried out in accordance with the mandates and regulations of the FTA and other federal, state and local government statutes. The department provides counseling and mediation to managers and staff to resolve internal organizational conflicts and identify employment practices that need improvement. It also provides training in the areas of EEO and workforce diversity for supervisory and staff personnel. EEO/Diversity Initiatives strives to ensure that employees work in an environment free of discrimination and harassment.
LAW
Metra’s Law Department’s core mission is to provide legal guidance and support to the Board of Directors, the executive team, and every other department in the organization. The department focuses on preventing legal issues at every feasible level, as well as defending the corporation’s position if issues arise. The Law Department supports Metra’s transportation mission by guiding the corporation through the myriad of restrictions and mandates of federal, state and local statutes, regulations, and ordinances. The Department is comprised of three basic divisions: General Corporate/Ethics, Litigation and Risk Management and Real Estate & Grants.
AUDIT
The Audit department reports to the Chief Audit Officer who reports directly to Metra’s Board of Directors and the CEO. The department is focused on operational, financial and compliance audits and the continuous review of money-handling at the highest levels of the agency. The department is committed to ensuring absolute transparency and proper conduct by all Metra employees.
1 6 | P R O G R A M a n d B U D G E T B O O K
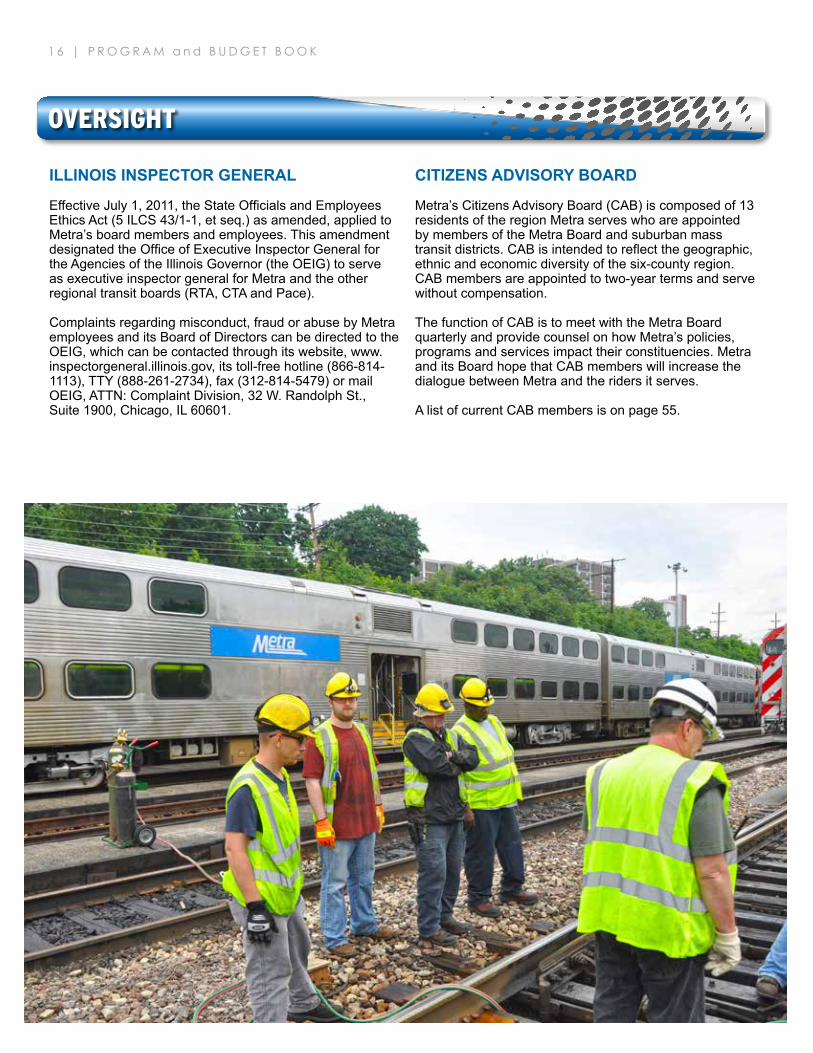
ILLINOIS INSPECTOR GENERAL
Effective July 1, 2011, the State Officials and Employees Ethics Act (5 ILCS 43/1-1, et seq.) as amended, applied to Metra’s board members and employees. This amendment designated the Office of Executive Inspector General for the Agencies of the Illinois Governor (the OEIG) to serve as executive inspector general for Metra and the other regional transit boards (RTA, CTA and Pace).
Complaints regarding misconduct, fraud or abuse by Metra employees and its Board of Directors can be directed to the OEIG, which can be contacted through its website, www.inspectorgeneral.illinois.gov, its toll-free hotline (866-814-1113), TTY (888-261-2734), fax (312-814-5479) or mail OEIG, ATTN: Complaint Division, 32 W. Randolph St., Suite 1900, Chicago, IL 60601.
CITIZENS ADVISORY BOARD
Metra’s Citizens Advisory Board (CAB) is composed of 13 residents of the region Metra serves who are appointed by members of the Metra Board and suburban mass transit districts. CAB is intended to reflect the geographic, ethnic and economic diversity of the six-county region. CAB members are appointed to two-year terms and serve without compensation.
The function of CAB is to meet with the Metra Board quarterly and provide counsel on how Metra’s policies, programs and services impact their constituencies. Metra and its Board hope that CAB members will increase the dialogue between Metra and the riders it serves.
A list of current CAB members is on page 55.
OVERSIGHT

P R O G R A M a n d B U D G E T B O O K | 1 7
ICE-FUNDED PROJECTS
As part of our 2016 capital programming, Metra has identified the projects slated to be funded through the RTA’s Innovation, Coordination and Enhancement (ICE) program.The program provides funding assistance to enhance the coordination and integration of public transportation and to develop and implement innovations to improve the quality and delivery of public transportation. For Metra in 2016, these projects range from: customer amenities such as the mobile ticketing application; to pilot projects to test automatic passenger counting devices on trains and test new platform materials; to operational efficiencies such as improvements to our crew calling system.
Ice Funded Projects Mobile Application $2.5 millionCrew Optimization $0.5 millionAutomated Passenger Counters $1.0 millionInnovative Platforms $0.7 million
STATE BOND PROGRAM
The Illinois General Assembly passed bond programs in 2009 that provide up to $1.1 billion to supplement Metra’s core capital program. To date, Metra has received grant authority for about $800 million of the State’s Bond Program and is still waiting for the State to grant us authority to apply for the remaining $300 million, which includes $102 million for PTC, $122.9 million for rolling stock, $37.5 million for bridges, $38.7 million for stations and yards. In June 2015, the Illinois Secretary of Transportation notified the Regional Transportation Authority that the state does not have adequate cash to fund all of its grant agreements, suspending another $100 million of previously awarded State Bond funds. If the State of Illinois bond funds are not received in a timely manner; Metra will be forced to raise fares to pay for needed investment and/or push other needed system improvements into later years of the capital program in order to fund the implementation of the PTC and rolling stock modernization program,
In addition to the modernization funding plan and initiatives outlined in the first section of this document (pages 4-5), Metra is currently undertaking the following projects and initiatives.
OTHER MAJOR INITIATIVES

1 8 | P R O G R A M a n d B U D G E T B O O K
CHICAGO REGION ENVIRONMENTAL AND TRANSPORTATION EFFICIENCY(CREATE)
The Chicago Region Environmental and Transportation Efficiency (CREATE) Program is a partnership between the State of Illinois, the City of Chicago, freight railroads, Metra and Amtrak to remove and reduce train congestion throughout Chicago and the Midwest. Congestion on our rail system impacts all modes of transportation, forcing more trucks on to the highways, limiting access to airports and reducing railroad capacity.
STRATEGIC PLAN
Metra began the process of developing the agency’s first comprehensive strategic plan in 2012 with several rounds of public input and stakeholder outreach. In the course of the development of the plan, the Metra Board of Directors approved Mission and Vision Statements as well as Strategic Priorities for Capital Investment in the plan. Staff presented a set of draft goals for the plan at the August 2014 Metra Board meeting, and following feedback from the Board, Metra secured outside assistance to help with implementation of two of the five goals: Invest in Workforce and Delivery Quality Customer Service. Significant progress has been made in the areas under these two goals, and Metra continues to work to implement the remaining three goals. In addition, Metra recently initiated a consultant contract to analyze the costs and benefits of system expansion/enhancement projects that were identified in the plan development process. It is anticipated that this process will provide Metra decision-makers with a more comprehensive set of metrics to evaluate and prioritize funding for these major projects.
REGIONAL FARE PAYMENT SYSTEM
In May 2012, Metra, via its Board, adopted principles for its part of the Regional Fare Payment System to meet the intent of Illinois Public Act 097-0085, which states the following: “By January 1, 2015, the [Regional Transportation] Authority must develop and implement a regional fare payment system. The regional fare payment system must use and conform with established information security industry standards and requirements of the financial industry. The system must allow consumers to use contactless credit cards, debit cards and prepaid cards to pay for all fixed-route public transportation services.” In October 2013, Metra formally declared its intention to participate in the CTA’s and Pace’s open fare system initiative.
Metra met the State of Illinois’ deadline of January 1, 2015 for implementation of a regional fare payment system. Metra’s initial efforts consisted of the installation of new point-of-sale readers at ticket windows capable of accepting contactless credit/debit cards. A mobile ticketing option will be available via a new Ventra App that will allow riders use credit/debit cards and/or Ventra accounts to purchase and display tickets on their smartphones. Metra worked with its regional transit partners (CTA, Pace, and RTA) to develop the Ventra App. Rollout of the Ventra App is slated for fall 2015. WI-FI AND CHARGING STATIONS
In 2011, the State of Illinois passed legislation regarding the provision of wireless internet service on passenger trains, if the service could be provided with no cost to the agency. Metra twice published requests for proposals (RFPs) in 2011 and 2014 seeking solicitations from interested firms to provide, at no cost to Metra, on-board communications infrastructure to provide Wi-Fi for passengers. Both attempts were unsuccessful. In September 2015, Metra announced plans to install Wi-Fi technology on 11 railcars (one per line) as part of a new test program to provide free, onboard Wi-Fi to customers. These railcars will be retrofitted with cellular hot spots before January 2016 to determine whether the technology is financially feasible and can provide free and dependable Internet access to customers onboard Metra trains. Metra is also installing Wi-Fi hotspots in waiting areas at downtown stations, and has installed electrical outlets at downtown stations for customers to charge their mobile devices.

P R O G R A M a n d B U D G E T B O O K | 1 9
Metra’s 2016 Capital program is funded through Federal Formula/State of Good Repair funds ($156.6 million). Other sources of funds that supplement Metra’s capital program include federal CMAQ (Congestion Mitigation and Air Quality) funding ($8.8 million), and ICE funds ($4.7 million). The plan also calls for the continuation of Metra’s Capital Farebox Fund ($15.6 million). Metra’s 2016-2020 capital program tables begin on page 32 and project descriptions for Metra’s 2016-2020 program are included in the Appendix of this document (pages 34-39). Funding available from current sources is shown on page 33.
The absence of a fully authorized state capital program, delays in the renewal of a long-term federal transportation funding, and the RTA not issuing bonds in 2016 have limited the available capital dollars available for Metra to maintain infrastructure and rolling stock. The result is a continued reliance on Metra “self-help” and other local funds to support its capital funding needs and a growing backlog of capital projects.
Metra must submit to the RTA a balanced one-and five-year capital program. As part of the 2016 program, 57 percent of the capital funding will be allocated to the Modernization Program and includes the following:
Rail Car Rehabilitation $22.3 millionLocomotive Rehabilitation $35.1 millionNew Gallery Cars $15.0 millionPositive Train Control (PTC) $34.0 million
ROLLING STOCK
Metra’s fleet consists of 146 locomotives and 843 diesel coach cars as well as electric-propelled Highliner cars used on the Metra Electric District. When the current replacement program for Metra Electric Highliners is complete in early 2016, there will be 186 Highliner cars in the fleet.
Rehabilitation and replacement programs allow for our rolling stock to be modernized with better seating, lighting, climate control, bathroom facilities and electrical outlets for customers to charge their electronic items. They are critical in maintaining the service performance standards on which our customers depend.
It is critically important that Metra maintain and invest in its rolling stock in order to provide a comfortable and reliable ride for our customers. At a bare minimum, Metra should be allocating at least $150 million annually towards rehabilitation and replacement of locomotives and rail cars. In fiscal year 2013, Metra allocated $27.7 million and in 2014 Metra allocated $45.5 million. In 2015, $94 million was allocated for rolling stock.
In 2016, $85.4 million has been allocated for rolling stock and includes car and locomotive rehabilitation programs. A total of $15 million is allocated to new gallery car purchases. Metra’s five-year core capital program calls for $636.0 million for rolling stock.
TRACK & STRUCTURE
Track and structure are the foundation of the Metra system. Without the continual renewal of track components, retaining walls and bridges, Metra’s reliable on-time service would deteriorate and the wear and tear on our rail cars and locomotives would increase. Since Metra was formed, Metra has spent more than $1 billion on track and structural replacement.
To maintain a state of good repair, Metra has established a continual cycle of inspection and renewal for its track and structures. Metra currently replaces 80,000 ties and 25 rail crossings annually. Ballast and track resurfacing is performed on a 4-year cycle, and since 1980, 83 bridges on the Metra system have been replaced. However, Metra estimates that to achieve a state of good repair for these assets; Metra would need to replace or rehab eight bridges, and replace 111,000 ties and 105 grade crossings annually.
Track and structure projects highlighted in the 2016-2020 capital program include over $214.1million for this asset category.
SIGNAL, ELECTRICAL & COMMUNICATIONS
Signal, electrical and communications systems are vital to safe railroad operation. Since Metra’s formation, we have invested $796.1 million to upgrade signal systems. The Metra system has 571 highway grade crossings, 148 of them interconnected with traffic signals. The 2016-2020 program also includes $192.2 million for signal, electrical and communication. In 2016 alone, Metra will invest $36.9 million. Of the total, $34 million (more than 90 percent) has been included for PTC.
CAPITAL PROGRAM

2 0 | P R O G R A M a n d B U D G E T B O O K
FACILITIES & EQUIPMENT
Metra has 24 rail yards and seven maintenance facilities. When Metra took over commuter rail operations in Northeast Illinois, most of these facilities were out of date and inefficient. To date, $565.3 million has been spent to modernize the rail yards and shops. The majority of these capital expenditures occurred more than a decade ago. Equipment and vehicles have reached the end of their useful life and must be replaced.
Upgrades and expansions are also necessary to accommodate future system needs. These projects can have an immediate impact on Metra’s operating budget since operating costs increase when equipment does not perform at optimum efficiency. The five-year core program includes $97.9 million for support facilities and equipment.
STATIONS & PARKING
Station and parking improvements are some of the most visible capital improvements to our customers. Metra has invested $1,091.5 million since 1985 to improve our stations and parking facilities. To maintain a state of good repair, Metra estimates that we would need to rehab or replace five stations and 20 platforms annually.
The majority of our station and parking projects over the last few years and going forward were funded by the State of Illinois bond programs that have now been suspended by the state. The 2016-2020 core capital program allocates $43.7 million for station and parking improvements

P R O G R A M a n d B U D G E T B O O K | 2 1
ADA
In compliance with the requirements of the Americans with Disabilities Act, the majority of stations on all 11 lines in the Metra system, plus the South Shore Line operated by the Northern Indiana Commuter Transportation District, are fully accessible to customers with disabilities. Metra has modified railcars and made accessible most of its busiest train stations to accommodate individuals with hearing, vision, and mobility disabilities. Metra currently has 181 fully accessible stations and 16 partially accessible stations located throughout the six-county region. These represent our busiest stations used by more than 93 percent of our customer base. As a service to our customers who are disabled, Metra offers a large print system map, a braille rider and station guide and a video to acquaint customers who are disabled with the rail system.
SAFETY FIRST
The safety of our employees, passengers and the general public is Metra’s number one priority. Metra’s ongoing efforts to improve safety throughout our system are overseen by our Safety Department and include numerous programs which incorporate education, engineering and enforcement activities.
Metra will continue its partnership with Operation Lifesaver, a national organization created in 1986 to educate people of all ages on the dangers of disobeying railroad warning devices and trespassing along the railroad right-of-way. Metra has partnered with Operation Lifesaver since 1992 and offers free train safety presentations to schools, professional drivers, bus companies, community organizations and emergency responders.
Metra will also continue its Safety Poster and Essay Contest in 2016. In its tenth year, the contest, which is overseen by the Communications group, is a key part of our ongoing outreach to school-age children to educate them about safe behaviors near trains and railroad tracks.
In April 2015, Metra and some of its unions announced the creation of a “Confidential Close Call Reporting System,” which is designed to proactively address safety issues and create a more positive safety culture. Metra became the first commuter railroad in the country to adopt C3RS, which also involves the Federal Railroad Administration and NASA. The system complements existing safety programs, builds a positive safety culture, creates an early warning system, focuses on problems instead of people, provides an incentive for learning from errors and targets the root cause of an issue, not the symptom.
NON-FARE REVENUE
Metra, through its Marketing Department, actively pursues and develops partnerships with the business community to grow ridership and/or provide sources of non-fare revenue. Marketing works with its advertising partner Clear Channel Outdoor to maximize advertising revenue opportunities on our trains and at stations. The department also directly offers advertising opportunities on the agency website, the commuter newsletter, mailing inserts and on train schedules to mitigate production costs.
Unrelated to advertising revenue opportunities, Metra continues to generate revenue from property, such as income from parking locations that we own and right-of-way usage from other railroads. These activities are overseen by the Real Estate Department. In 2016, Metra will continue to identify and pursue various advertisers, partnerships and sponsorships to increase non-ridership revenue.
WEBSITE
In 2009, Metra launched a redesigned, more customer-oriented website, providing train service alerts via e-mail and Twitter as well as the ability to purchase monthly passes and 10-ride tickets online with credit cards. The site’s customizable “My Metra” feature also enables users to create accounts tailored to their train schedules and enables them to automate recurring ticket purchases. In 2014, Metra introduced “Customize Your Commute,” which allows My Metra account holders greater flexibility in choosing a time range when they want to receive service alerts for their rail line.
The Website Group in conjunction with the Operations Department also worked to improve and expand the functionality of the website’s “Rail-Time Tracker” feature, which enables the user to see when the next train is scheduled to arrive at their station. The improvements incorporate General Transit Feed Specifications and give Metra the ability to update schedules in “real time” and improve passenger information during service disruptions or special events. More improvements to the tracker are coming in 2016.
In addition, the ability to pay for ticket orders with more than one credit or debit card was added in September 2015. That feature is especially useful to customers who participate in pre-tax transit benefits programs, because it allows them to buy monthly tickets in part with their benefits and in part with a regular credit or debit card.
NON-CAPITAL PROGRAMS

2 2 | P R O G R A M a n d B U D G E T B O O K
2016 BUDGET OVERVIEWMetra’s 2016 operating budget and 2017-2018 financial plan meets the RTA’s revenue recovery ratio and deficit funding requirements. The RTA’s projection of operating funding available in 2016 is 3.5 percent higher than the 2015 budget. For 2017, the RTA estimates that available funding will increase by 2.9 percent over 2016. For 2018, the RTA estimates an increase of 3.2 percent from the prior year.
The budget and financial plan presented in this document is based upon the terms of contractual agreements and reasonable estimates from currently available information. Additional information about revenues and expenses is provided on the following pages and in the Appendix pages 25-55.
For the period 2016 through 2018, expenses are estimated to increase in accordance with the terms of current contracts and agreements, or with projections of market indices, as applicable. Staff will continue to examine all aspects of Metra operations, including those of the contract carriers, for cost efficiencies. All parties are expected to cut or contain costs wherever possible.

P R O G R A M a n d B U D G E T B O O K | 2 3
OPERATIONS AND MAINTENANCE
The 2016 budget for Operations and Maintenance, which represents about 75 percent of Metra’s operating costs, is projected to increase by $35.5 million or 6.7 percent over2015. This category includes the operation of 703 weekday trains, the maintenance and inspection of more than 1,100 pieces of equipment, 241 stations, 1,100 miles of track, 800 bridges, 2,000 signals and other infrastructure.
With an aging system and the slow growth in available capital funds, more and more of the cost of maintaining the equipment and infrastructure is borne by the operating budget. While Metra is constantly looking for efficiencies and other cost-saving measures within its operations, there is an overwhelming burden related to the shortfall in the overall funding to meet a state of good repair. This consistent shortfall means that meeting the daily demands of having enough equipment and a safe infrastructure to move customers is becoming more expensive each year.
Operations and Maintenance for 2017 is projected to grow by 2.9 percent over the 2016 budget and for 2018 to grow by 3.0 percent over the 2017 plan.
PASSENGER REVENUE Passenger revenue for 2016 is expected to be higher than the 2015 budget by $4.1 million or 1.2 percent. This increase reflects that the 2016 Budget will receive higher funds related to a net fare increase of 2 percent effective Feb.1, 2016. The increase is expected to generate approximately $6.5 million over the 11-month period, after a $0.5 million provision for elasticity loss in ridership due to the fare increase. We are also projecting that some riders will switch to their cars due to lower gas prices, reducing overall fare revenue by $2.4 million.
REDUCED FARE REIMBURSEMENT
Reduced Fare Reimbursement is budgeted to be $3.1 million for 2016 at the same level as the 2015 Budget.
CAPITAL CREDITS, LEASES AND OTHERCONTRACTS The 2016 budget for capital credits, leases and other contracts, has been decreased by $5.4 million or 15.2 percent versus 2015, reflecting an anticipated decline in billable items, primarily crossing project work on behalf of the state that is not considered a Metra asset.
TOTAL OPERATING EXPENSES
The 2016 budget projects an increase of $6.7 million or 0.9 percent compared to the 2015 budget. Train service levels are unchanged in both years, therefore, the budget expense increase represents projected price increases in labor, benefits, rents, materials and other costs associated with operating the service and meeting the maintenance and inspection requirements related to the equipment and infrastructure.
BUDGET OVERVIEW

2 4 | P R O G R A M a n d B U D G E T B O O K
ADMINISTRATION
The 2016 budget for administration, which represents about 12 percent of Metra’s operating costs, is projected to increase by $1.9 million or 2.1 percent compared to 2015. For the plan years of 2017 and 2018, administration costs are projected to grow by 3.0 percent in 2017 over the 2016 budget and by 2.8 percent in 2018 over the 2017 plan.
DIESEL FUEL
Diesel fuel for 2016 is budgeted at $60.4 million, representing a $20.1 million reduction from the 2015 budget. Metra entered into a supply contract beginning January 2016 for a portion of the 2016 diesel fuel. For 2017 and 2018, Metra’s projected expense for diesel fuel is $65.5 million and $70 million, respectively. METRA ELECTRIC ELECTRICITY
Metra Electric electricity for 2016 is budgeted at $6.4 million, which is $2 million or 23.8 percent lower than the 2015 budget. The reduction is due to lower prices from a new supply contract. Metra is projecting price increases for 2017 and 2018 at 3.0 percent and 3.1 percent, respectively.
CLAIMS AND INSURANCE Claims and insurance for 2016 is budgeted at $15.4 million, which is a $0.4 million or 2.5 percent reduction from the 2015 budget. This area realized a $0.4 million 2016 efficiency due to anticipated lower claims amounts and insurance premiums. For 2017 and 2018, expenses in this category are projected to be $15.9 million and $16.4 million, respectively.
DOWNTOWN STATIONS
For 2016, the downtown stations category, which includes charges for Chicago Union Station, LaSalle Street Station and the Ogilvie Transportation Center, is budgeted at $16.4 million. This is a $.2 million increase over the 2015 budget. The station rents are covered by long-term leases that have annual inflators. Additionally, the charges include a share of the maintenance and utility costs for the facilities, which are expected to increase for 2016. For 2017 and 2018, the budget projections for this line item are $16.6 million and $17.0 million, respectively.
SUMMARY
Exhibit 10 on page 27 presents Metra’s 2016 budget while Exhibit 11 on page 28 summarizes Metra’s 2016 budget and its 2017-2018 financial plan. Metra’s budget and financial plan are presented in a manner consistent with its financial statements, with adjustments in format made, as appropriate, for illustrative purposes. Revenues are recognized when earned and expenses are recorded in the period in which goods and services are used. Metra’s 2016 projected cash flow summary is included in the Appendix on pages 30-31 as Exhibit 12.
P R O G R A M a n d B U D G E T B O O K | 2 5
Operating Budget Comparisons 26
Calculation of 2016–2018 Farebox Recovery Ratios 26
2016 Budget by Carrier & Type of Expense 27
2016 Budget Summary & 2017-2018 Financial Plan 28
2016 Projected Cash Flow Summary 30
Capital Program 2016 32
Capital Program Sources 2016-2020 33
2016 Capital Program Project Element Descriptions 34
2016 - 2020 Core Capital Program 41
State of Illinois Bond Programs 42
Physical Description 43
Operating & Service Characteristics 44
Forecasted Ridership and Vehicle Miles 45
Commuter Rail Stations by Fare Zone 46
Ridership-Related Statistics 48
Ticket Sales by Ticket Type 49
2016 Adult Fares 50
2016 Special User Fares 51
Public Notice 52
Public Hearing Schedule 53
County Board Presentations 53
Commuter Rail Board Ordinance No. MET 15-15 54
Notice of Title VI Protection 55
Citizens Advisory Board 55
APPENDIX

2 6 | P R O G R A M a n d B U D G E T B O O K
Exhibit 8METRA OPERATING BUDGET COMPARISONS 2015 BUDGET & 2016 BUDGET($ in millions)
2015 Budget 2016 Budget GrowthAmt. %
RevenuesPassenger Revenue $337.3 $341.4 4.1 1.2%
Reduced Fare Subsidy 3.1 3.1 0.0 0.0%
Capital Credits, Leases, etc. 35.5 30.1 (5.4) -15.2%
Total Revenues 375.9 374.6 (1.3) -0.3%
Operating Expenses
Transportation 240.0 256.0 16.0 6.7%
Maintenance of Way 130.0 140.5 10.5 8.1%
Maintenance of Equipment 162.0 171.0 9.0 5.6%
Subtotal - Operations 532.0 567.5 35.5 6.7%
Administration 92.0 93.9 1.9 2.1%
Metra Debt Service 8.4 0.0 (8.4)
Diesel Fuel 80.5 60.4 (20.1) -25.0%
Metra Electric District Electricity 8.4 6.4 (2.0) -23.8%
Claims & Insurance 15.8 15.4 (0.4) -2.5%
Downtown Stations 16.0 16.2 0.2 1.3%
Total Operating Expenses 753.1 759.8 6.7 0.9%
Total Funded Deficit 377.2 385.2 8.0 2.1%
Metra Sales Taxes 377.7 397.3 19.6 5.2%
Add: RTA Fund Balance for Operations 6.0 0.0 (6.0)
Add: ICE Funding for Operations 1.5 1.5 0.0
Add: Security Grant 2.0 2.0 0.0 0.0%
Total Funds for Operating 387.2 400.8 13.6 3.5%
Capital Fare Funding (10.0) (15.6) (5.6) 56.0%
Total Funds Available for Operating 377.2 385.2 8.0 2.1%
Excess / (Shortfall) of Funds 0.0 0.0 0.0
Recovery Ratio 53.6% 52.4%
Recovery Ratio Additions 1.9 2.0
Recovery Ratio Exclusions 48.4 40.5
Year 2016 2017 2018
System-Generated Revenues 374.6 384.6 397.3
Additions to Recovery Ratio Revenues 2.0 2.1 2.2
Farebox Recovery Ratio Revenue 376.6 386.7 399.5
Total Operating Expenses 759.8 785.3 811.0
Exclusions from Recovery Ratio Expenses 40.5 41.0 42.0
Farebox Recovery Ratio Expenses 719.3 744.3 769.0
Revenue Recovery Ratio 52.4% 52.0% 52.0%
Exhibit 9CALCULATION OF 2016 - 2018 FAREBOX RECOVERY RATIOS($ in millions)

P R O G R A M a n d B U D G E T B O O K | 2 7
Exhibit 102016 BUDGET BY CARRIER AND TYPE OF EXPENSE($ in millions)
NIRCRC UnionPacific
BNSFRailway
TotalMetra
Revenues:
Passenger Revenue 149.5 121.0 70.9 341.4
Reduced Fare Subsidy 3.1 0.0 0.0 3.1
Capital Credits, Leases, etc. 29.7 0.4 0.0 30.1
Total Revenues 182.3 121.4 70.9 374.6
Operating Expenses
Transportation 141.6 84.7 29.7 256.0
Maintenance of Way 89.2 44.9 6.4 140.5
Maintenance of Equipment 87.4 57.1 26.5 171.0
Subtotal - Operations 318.3 186.7 62.5 567.5
Administration 89.1 4.8 0.0 93.9
Metra Debt Service 0.0 0.0 0.0 0.0
Diesel Fuel 24.5 24.3 11.6 60.4
Metra Electric District Electricity 6.4 0.0 0.0 6.4
Claims & Insurance 15.4 0.0 0.0 15.4
Downtown Stations 8.5 1.7 6.0 16.2
Total Operating Expenses 462.2 217.5 80.1 759.8
Total Funded Deficit 279.9 96.1 9.2 385.2
Metra Sales Taxes 397.3
Add: RTA Fund Balance for Operations 0.0
Add: ICE Funding for Operations 1.5
Add: Security Grant 2.0
Less: Capital Fare Funding (15.6)
Total Funds Available for Operating 385.2
Excess / (Shortfall) of Funds 0.0
Revenue Recovery Ratio 52.4%
Recovery Ratio Additions 2.0
Recovery Ratio Exclusions 40.5
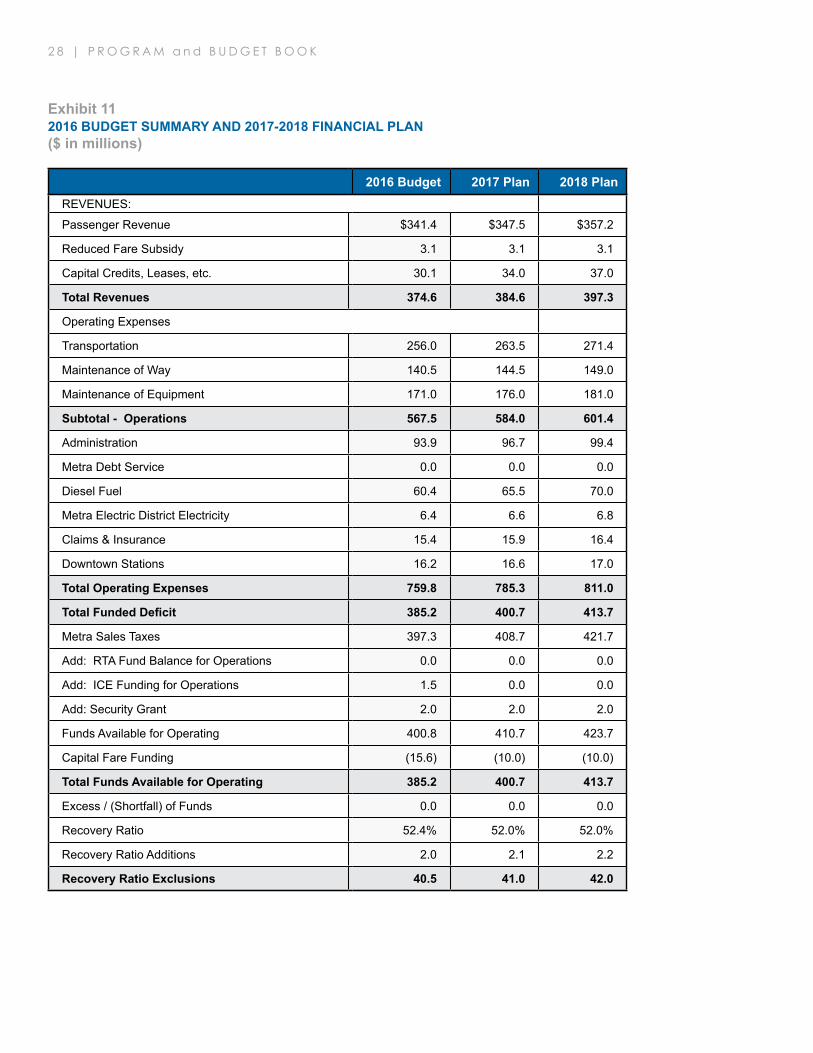
2 8 | P R O G R A M a n d B U D G E T B O O K
Exhibit 112016 BUDGET SUMMARY AND 2017-2018 FINANCIAL PLAN($ in millions)
2016 Budget 2017 Plan 2018 PlanREVENUES:
Passenger Revenue $341.4 $347.5 $357.2
Reduced Fare Subsidy 3.1 3.1 3.1
Capital Credits, Leases, etc. 30.1 34.0 37.0
Total Revenues 374.6 384.6 397.3
Operating Expenses
Transportation 256.0 263.5 271.4
Maintenance of Way 140.5 144.5 149.0
Maintenance of Equipment 171.0 176.0 181.0
Subtotal - Operations 567.5 584.0 601.4
Administration 93.9 96.7 99.4
Metra Debt Service 0.0 0.0 0.0
Diesel Fuel 60.4 65.5 70.0
Metra Electric District Electricity 6.4 6.6 6.8
Claims & Insurance 15.4 15.9 16.4
Downtown Stations 16.2 16.6 17.0
Total Operating Expenses 759.8 785.3 811.0
Total Funded Deficit 385.2 400.7 413.7
Metra Sales Taxes 397.3 408.7 421.7
Add: RTA Fund Balance for Operations 0.0 0.0 0.0
Add: ICE Funding for Operations 1.5 0.0 0.0
Add: Security Grant 2.0 2.0 2.0
Funds Available for Operating 400.8 410.7 423.7
Capital Fare Funding (15.6) (10.0) (10.0)
Total Funds Available for Operating 385.2 400.7 413.7
Excess / (Shortfall) of Funds 0.0 0.0 0.0
Recovery Ratio 52.4% 52.0% 52.0%
Recovery Ratio Additions 2.0 2.1 2.2
Recovery Ratio Exclusions 40.5 41.0 42.0

P R O G R A M a n d B U D G E T B O O K | 2 9

3 0 | P R O G R A M a n d B U D G E T B O O K
Exhibit 12METRA 2016 PROJECTED CASHFLOW SUMMARY($ in millions)
January February March April MayBeginning Balance $120,000 $119,556 $122,138 $135,013 $124,642 Operating Revenue 28,262 27,976 29,519 29,850 30,468Capital Farebox Revenue 1,300 1,300 1,300 1,300 1,300Total Operating Revenue $29,562 $29,276 $30,819 $31,150 $31,768RTA Sales Tax Month Paid 37,989 38,190 44,849 21,387 27,367ICE For Operating 125 125 125 125 125RTA Sales Tax / State PTF 38,114 38,315 44,974 21,512 27,492Security Grant 167 167 167 167 167Capital Grants:FTA 13,046 13,046 13,046 13,046 13,046RTA 4,742 0 0 0 0IDOT 0 0 0 0 0Metra Financing 0 0 0 0 0Subtotal $17,788 13,046 13,046 13,046 13,046Total Cash Receipts $85,631 $80,804 $89,006 $65,875 $72,473Operating Expenses $66,987 $63,876 $61,785 $61,900 $63,630Capital Farebox Expenses 0 0 0 0 0Total Operating Expenses 66,987 63,876 61,785 61,900 63,630Capital Projects:FTA/RTA/IDOT $17,788 $13,046 $13,046 $13,046 $13,046Metra Financing 0 0 0 0 0Metra 1,300 1,300 1,300 1,300 1,300Total Capital Projects 19,088 14,346 14,346 14,346 14,346Total Cash Disbursements 86,075 78,222 76,131 76,246 77,976Ending Balance $119,556 $122,138 $135,013 $124,642 $119,140

P R O G R A M a n d B U D G E T B O O K | 3 1
June July August September October November December Total$119,140 $119,673 $118,581 $120,097 $120,476 $119,046 $122,088
31,175 32,397 31,544 29,744 31,181 29,830 27,054 359,0001,300 1,300 1,300 1,300 1,300 1,300 1,300 $15,600
$32,475 $33,697 $32,844 $31,044 $32,481 $31,130 $28,354 $374,60031,462 30,667 33,391 33,037 31,351 33,108 32,648 395,446
125 125 125 125 125 125 125 1,50031,587 30,792 33,516 33,162 31,476 33,233 32,773 396,946
167 167 167 167 167 167 163 2,000
13,046 13,046 13,046 13,046 13,046 13,046 13,046 156,5520 0 0 0 0 0 0 4,7420 0 0 0 0 0 0 00 0 0 0 0 0 0 0
$13,046 $13,046 $13,046 $13,046 $13,046 $13,046 $13,046 $161,294$77,275 $77,702 $79,573 $77,419 $77,170 $77,576 $74,336 $934,840$62,395 $64,448 $63,711 $62,693 $64,255 $60,188 $63,932 $759,800
0 0 0 0 0 0 0 062,395 64,448 63,711 62,693 64,255 60,188 63,932 759,800
$13,046 $13,046 $13,046 $13,046 $13,046 $13,046 $13,046 $161,2940 0 0 0 0 0 0 0
1,300 1,300 1,300 1,300 1,300 1,300 1,300 15,60014,346 14,346 14,346 14,346 14,346 14,346 14,346 176,89476,741 78,794 78,057 77,039 78,601 74,534 78,278 936,694
$119,673 $118,581 $120,097 $120,476 $119,046 $122,088 $118,146

3 2 | P R O G R A M a n d B U D G E T B O O K
Exhibit 13CAPITAL PROGRAM 2016($ in millions)
PE Description RR Source Amount
Rolling Stock
4810 USED LOCOMOTIVES MET f3 $1,000,000
4806 LOCOMOTIVE MID-LIFE REHAB 401-427 MET f9 $10,000,000
5001 TRACTION MOTORS MET f3 $1,600,000
4510 CAR REHAB (41 BUDD CARS) MET f3 $4,000,000
5002 LOCOMOTIVE AND CAR IMPROVEMENTS MET f3 $2,000,000
4705 EMERGENCY CAR LIGHTING MET mt $1,500,000
5004 HVAC REFRIGERANT CONVERSION MET f9 $500,000
5003 WHEEL REPLACEMENT MET f3 $3,300,000
4805 EVENT RECORDERS MET mt $500,000
4507 LOCOMOTIVE REHABILITATION (174-214) MET f3 $13,100,000
5005 LOCOMOTIVE REHABILITATION (174-214) MET fc $8,800,000
4507 LOCOMOTIVE REHABILITATION (174-214) MET mt $2,200,000
5006 NEW GALLERY CARS PURCHASE MET f9 $15,000,000
4910 CAR REHAB (AMERAIL CARS P6) MET f3 $5,733,000
4909 CAR REHAB (NIPPON SHARYO P-1) MET f3 $6,625,000
5009 CAR REHAB (NIPPON SHARYO HIGHLINERS) MED f3 $6,000,000
5010 DVR AND CAMERAS MET f9 $3,000,000
5008 MU CAR IMPROVEMENTS MED f9 $515,000
Rolling Stock Sub-Total $85,373,000
Track & Structure
5015 TIES, BALLAST, & SW HEATERS BNS f3 $2,765,000
5012 TIES AND BALLAST MED f3 $2,000,000
5018 TIES AND BALLAST RID f3 $2,000,000
5021 RAIL GRINDING MET f3 $300,000
5027 RAIL BNS f3 $2,188,000
5025 UNDERCUTTING & SURFACING MET f3 $550,000
5026 UNDERCUTTING & SURFACING MWD f3 $500,000
5033 RAIL REPLACEMENT MWD f9 $2,500,000
5028 RAIL REPLACEMENT MET f9 $1,500,000
5020 NCS IMPROVEMENTS NCS mt $780,000
5023 CROSSINGS (ROAD & TRACK) MET f3 $3,000,000
5024 CROSSINGS (ROAD & TRACK) MWD f3 $900,000
5038 BRIDGES & RETAINING WALLS BNS f3 $1,177,000
5036 BRIDGE IMPROVEMENTS MET f3 $500,000
5039 BRIDGE IMPROVEMENTS MWD f9 $400,000
5040 63rd and 67th STREET BRIDGE IMPROVEMENTS MED f9 $1,200,000
5037 BRIDGE IMPROVEMENTS UPR f3 $500,000
5048 RIGHT OF WAY FENCING UPR f9 $100,000
5029 CATENARY STRUCTURE REHABILITATION MED f3 $1,000,000
Track & Structure Sub-Total $23,860,000
Signal, Electrical & Communications
4343 POSITIVE TRAIN CONTROL MET f9 $34,000,000
5056 SIGNAL SYSTEM UPGRADES MET f9 $1,500,000
4744 PROTECTIVE RELAY REPLACEMENT MED f3 $400,000
4746 IMPEDANCE BONDS MED f9 $300,000
5032 SWITCH HEATERS MED f9 $200,000
4742 STRAY CURRENT PROTECTION MED f9 $500,000
Signal, Electrical & Communications Sub-Total $36,900,000
PE Description RR Source Amount
Facilities & Equipment
5053 YARD IMPROVEMENTS BNS f3 $600,000
4965 YARD IMPROVEMENTS RID f3 $2,000,000
5076 YARD IMPROVEMENTS MWD f3 $500,000
5072 YARD IMPROVEMENTS RID f3 $1,500,000
5065 RIGHT OF WAY EQUIPMENT MET f3 $1,000,000
5066 OFFICE EQUIPMENT MET f9 $275,000
5068 EQUIPMENT & VEHIC MECH MET f9 $2,200,000
5064 IT COMPONENTS & SERVICES MET f9 $500,000
5064 IT COMPONENTS & SERVICES MET mt $2,500,000
5091 MOBILE APPLICATION MET ri $2,500,000
5061 CREW OPTIMIZATION MET ri $500,000
5062 AUTOMATED PASSEGER COUNTER MET ri $1,000,000
4852 FINANCIAL SYSTEM REPLACEMENT MET f9 $1,000,000
4743 547 BUILDING IMPROVEMENTS MET f9 $250,000
4771 547 BUILDING UPGRADES MET f9 $250,000
5070 POLICE VEHICLES MET f9 $500,000
Facilities & Equipment Sub-Total $17,075,000
Stations & Parking
5077 STATION SIGNS MET f9 $550,000
5078 SYSTEMWIDE STATION IMPROVEMENTS MET f9 $1,000,000
5079 STATION FAC IMPROVEMENTS MET f9 $1,000,000
5067 ADA IMPROVEMENTS MET f3 $3,000,000
5075 INNOVATIVE PLATFORMS MET ri $742,000
4878 WEST CHICAGO STATION UPR f3 $3,000,000
5080 RIVERSIDE STA REHABILITATION BNS f3 $400,000
5081 WOODSTOCK STA REHABILITATION UPR f3 $1,000,000
5092 PROTECTIVE LAND ACQUSITION MET mt $2,500,000
Stations and Parking Sub-Total $13,192,000
Support Activities
5097 LOCALLY FUNDED PROJECTS / MATCH MET mt $3,250,000
5096 UNANTICIPATED CAPITAL MET mt $2,370,000
5098 PROJECT ADMINISTRATION MET f3 $400,000
5098 PROJECT ADMINISTRATION MET f9 $400,000
5099 CONTINGENCIES MET f3 $922,650
5099 CONTINGENCIES MET f9 $950,151
5094 INFRASTRUCTURE ENGINEERING MET f3 $500,000
5094 INFRASTRUCTURE ENGINEERING MET f9 $500,000
Support Activities Sub-Total $9,292,801
Grand Totals For Uses $185,692,801
Federal State of Good Repair (5337) f3 $75,960,650
Federal Formula (5307) f9 $80,590,151
Sub-Total Federal Formula f $156,550,801
CMAQ fc $8,800,000
RTA Innovation, Coordination & Enhancement ri $4,742,000
Metra Farebox Capital (Additional Requests) mt $15,600,000
TOTAL FUNDING PROGRAM $185,692,801

P R O G R A M a n d B U D G E T B O O K | 3 3
Funding Source 2016 2017-2020 Total Federal Base Program State of Good Repair (5337)/ Formula (5307) $156.6 $674.5 $831.1Sub–Total Federal Base Program $156.6 $674.5 $831.1SupplementalFederal CMAQ 8.8 4.0 12.8RTA Bond 0.0 135.5 135.5RTA Innovation, Coordination & Enhancement 4.7 10.0 14.7Metra Financing 0.0 200.0 200.0Metra Farebox Capital 15.6 40.0 55.6Sub–Total Supplemental Program $29.1 $389.5 $418.6Grand Total $185.7 $1,064.0 $1,249.7
Exhibit 14METRA CAPITAL PROGRAM SOURCES 2016 - 2020($ in millions)

3 4 | P R O G R A M a n d B U D G E T B O O K
LINE ABBREVIATIONSLine Name Shown as
BNSF Railway BNS
Heritage Corridor HC
Metra Electric District MED
Milwaukee District MWD
North Central Service NCS
Rock Island District RID
Systemwide non-line specific MET
Union Pacific UPR
2016 CAPITAL PROGRAM PROJECT ELEMENT DESCRIPTIONS
PE 4910 CAR REHABILATION AMERAIL (P6), MET
This project involves the upgrading and rehabilitation (mid-life overhaul) of the remaining commuter rail cars built by Morrison-Knudsen/Amerail not rehabilitated by one of the preceding Amerail car rehab projects. This is the next-to-last phase of this project. These cars have not undergone any type of programmed overhaul prior to this project. These cars were built between 1995 and 1998 by the Morrison Knudsen or Amerail Company. They will be 17 to 20 years old prior to rehabilitation under this project, and their major components are beginning to wear out.
PE 5001 TRACTION MOTORS-REBUILD, MET
This project funds the overhaul of traction motors and traction alternators for locomotives. This project also involves the overhaul of auxiliary generators and head-end-power alternators. The overhauled equipment will be used on locomotives operated on railroads either owned or operated by Metra. These traction motors and alternators were originally placed in service between 1974 and 2003 and are showing signs of deterioration. A basic overhaul is required to return these motors to an acceptable level of performance.
PE 5002 LOCOMOTIVE AND CAR IMPROVEMENTS, MET
This project involves various improvements to diesel-hauled and electric commuter cars, as well as locomotives. These improvements may not be identified until the start of a major rehabilitation project. The improvements also include items that were not required by federal or state law at the time the improvements were engineered, but did become a requirement before construction began.
ROLLING STOCK
PE 4507 LOCOMOTIVE REHABILITATION, MET
This project involves the second major rehabilitation of 42 locomotives (units 174-214) which were delivered between 1989 and 1992. This project is part of an ongoing program to rehabilitate locomotives. This will save fuel and reduce emissions.
PE 4510 CAR REHABILITATION, MET
This project involves the life-extending rehabilitation of up to 41 commuter cars built in 1974. The Chicago & Northwestern Railroad last rehabilitated these cars between 1990 and 1993.
PE 4805 EVENT RECORDERS, MET
This project involves the upgraded replacement of the event recorders on Metra’s locomotives, EMUs (Highliner Cars), and cab control cars. The system will meet the FRA’s standard for crash worthiness and will include the necessary components for integration with the federally mandated Positive Train Control system. The upgrade will also make the recorders less prone to failure in the event of an accident.
PE 4806 LOCOMOTIVE MID LIFE REHAB, MET
This project is for the mid-life rehabilitation of 27 locomotives that are among those delivered new in the early 2000s. This rehabilitation will enable these locomotives to reach their useful life of 25 years with a minimum of maintenance on major components.
PE 4810 USED LOCOMOTIVES, MET This project includes the purchase of three used locomotives and any necessary spare parts. The locomotives will be used in commuter service on various railroad lines owned or operated by Metra. Metra’s spare ratio for locomotives has declined partially due to the effects of very harsh winters on aged equipment.
PE 4909 CAR REHABILIATION (NIPPON SHARYO, P1)
This project involves the mid-life rehabilitation of 302 bi-level commuter cars delivered between 2002 and 2008. This phase consists of 11 cab cars and 19 trailer/coach cars built by the Nippon-Sharyo Corporation. This is Phase I of a multi-phase project.

P R O G R A M a n d B U D G E T B O O K | 3 5
PE 5003 WHEEL REPLACEMENT, MET
This project will implement the FRA-mandated replacement of wheel sets on Metra’s fleet of locomotives and commuter cars. The replacement wheels will be used on vehicles being operated on all carriers and railroads in the Metra system as part of an ongoing program to overhaul major components on Metra’s fleet.
PE 5004 HVAC REFRIGERANT CONVERSION, MET
This project involves the conversion of the air-conditioning units from the R22 refrigerant to a more environmentally friendly R407C refrigerant on Metra’s bi-level commuter cars. This work will be done on all cab cars, trailers and EMUs. The work involves replacing the AC system and replacing the temperature control systems. The HVAC system provides heating and cooling to the car’s interior.
PE 5006 NEW GALLERY CARS, MET
The long-term proposed rail car program will purchase 367 new diesel cars to replace 318 cars with an average age of 43 years and increase the number of spare cars by 49. This would retire the oldest cars in the fleet. Under the proposed program, 106 new cars will be delivered between 2018 and 2019 and 261 cars will be delivered between 2020 and 2024.
PE 4705 EMERGENCY CAR LIGHTING, MET
This project involves the upgrading of the current lighting and emergency lighting system on cab and trailer cars. The upgrade of the lighting system includes but is not limited to the replacement of the batteries, battery chargers, battery boxes and lighting components which will allow Metra to comply with the federally-mandated 90-minute emergency light requirement. The upgrade will also include the replacement of low-level pathway markings, which is an FRA mandate.
PE 5008 MU CAR IMPROVEMENTS
This project involves the purchase of parts and equipment that will be needed for the rehabilitation and restoration of the 26 electric cars that were ordered in 2002 and delivery began in 2004 and 2005.
PE 5009 CAR REHABILITATION (NIPPON SHARYO HIGHLINERS), MET
This project involves the mid-life rehabilitation of up to 26 multiple-unit bi-level electric cars that are ADA compliant. The cars were built by the Nippon-Sharyo Corporation and delivery began in 2004 and 2005. This is the first major rehabilitation of these commuter cars.
PE 5010 DVRS AND CAMERAS, MET
This project involves the purchase of a digital video recording (DVR) system. The system will replace the 10-year old, obsolete system currently running on Metra’s rolling stock. It will allow for video recording of railroad signal aspects and incidents.
TRACK AND STRUCTURE
PE 5015 TIES AND BALLAST & SW HEATERS, BNS
PE 5012 TIES AND BALLAST, MED
PE 5018 TIES AND BALLAST, RID
These projects consist of the replacement of cross ties, switch ties and ballast. In order to maintain proper track gauge and surface, it is necessary to replace ties and ballast periodically. This improves the riding quality of the trains and reduces the incidence of slow orders, which adversely affect adherence to train schedules. These projects represent part of an ongoing program to replace ties and ballast throughout the commuter territory.
PE 5021 RAIL GRINDING, MET
This project consists of on-site grinding of rail that has been recently installed at various locations. This includes second-hand rail, corrugated rail and in-track welded rail. Grinding removes mill scale and corrects irregularities from field and plant welding. Corrugation reduces the useful life of the rail and accelerates the deterioration of the rolling stock. Grinding creates a uniform rail profile and prevents corrugation.
PE 5027 RAIL, BNS
This project will provide for the installation of rail and switches on the BNSF commuter line. The project also includes the renewal of switch points at various locations along the BNSF railroad, the replacement of switch machines and the replacement of turnouts. The high density of freight and commuter traffic, including extensive express service, requires close monitoring and periodic replacement of switches and switch machines. Turnouts must be inspected and replaced frequently to protect against derailment. While minor defects in switch points and turnouts can be remedied with field welding, replacement over time is required to ensure reliable operations.
PE 5025 UNDERCUTTING & SURFACING, MET
PE 5026 UNDERCUTTING & SURFACING, MWD
Track undercutting provides for the removal of all fouled track ballast, which is then cleaned and returned to the track bed. The major functions of ballast are to hold ties in place, prevent lateral deflections of the rail and distribute track loading. When the ballast is fouled, the load spreading capability is lost. Soggy ballast also freezes in winter, causing additional stress on the rail and tie systems. Undercutting is necessary when the ballast section has become so contaminated that normal ballasting and surfacing will no longer hold a proper track surface. The results

3 6 | P R O G R A M a n d B U D G E T B O O K
of undercutting are a smooth, well-aligned track surface, extended tie and ballast life and reduced ongoing maintenance expense.
PE 5028 RAIL REPLACEMENT, MET
This project consists of the installation of continuous welded rail on Metra-owned rail lines. Specific locations are to be determined. The existing jointed rail shows increased wear as it nears the end of its economic service life and it requires periodic replacement to maintain track speeds and on-time performance.
PE 5033 RAIL REPLACEMENT, MWD
This project consists of the installation of continuous welded rail on the Milwaukee District rail lines. Specific locations are to be determined. The existing jointed rail shows increased wear as it nears the end of its economic service life and it requires periodic replacement to maintain track speeds and on-time performance.
PE 5020 RAIL, NCS IMPROVEMENTS
This project consists of the installation of rail, ties and ballast, undercutting and other capital improvements on the North Central Servic.
PE 5023 CROSSINGS (ROAD & TRACK), MET
PE 5024 CROSSINGS (ROAD & TRACK), MWD
These projects provide for the renewal of rail highway grade crossings at various locations on the Metra commuter lines and the Milwaukee District. The specific crossings to be renewed will be based on the stage of deterioration at each crossing. The work will include, but not be limited to, replacement of cross ties, crossing material and ballast, as well as the surfacing of the track.
PE 5038 BRIDGE AND RETAINING WALLS, BNS
This project will provide for the rehabilitation of retaining walls on the BNSF commuter line. Retaining wall sections at intermittent locations along the right-of-way will be rehabilitated. This work typically includes complete reconstruction with steel sheet piling, concrete panels or bin wall to prevent retaining wall deterioration that can result in destabilization of the roadbed and in turn lead to track shifting.
PE 5039 BRIDGE IMPROVEMENTS, MWD
This project involves the rehabilitation of bridges and culverts on the Milwaukee District lines. This work typically includes complete reconstruction with steel sheet piling, concrete panels or bin wall to prevent retaining wall deterioration that can result in destabilization of the roadbed and in turn lead to track shifting. Funding will be 50/50 split with the Canadian Pacific Railroad.
PE 5036 BRIDGE IMPROVEMENTS, MET
This project involves concrete, timber and steel rehabilitation to bridges in the Metra system. Design work will also be done when necessary. Items that can be rehabilitated include timber wing walls and fencing, cracked bearing blocks and cracked and/or spalled bridge seats or abutments.
PE 5037 BRIDGE IMPROVEMENTS, UPR
This project will provide for the rehabilitation of bridges on the Union Pacific commuter lines. This work typically includes complete reconstruction with steel sheet piling, concrete panels or bin wall to prevent retaining wall deterioration that can result in destabilization of the roadbed and in turn lead to track shifting.
PE 5048 ROW FENCING, UPR
This project consists of the materials and labor necessary to erect fencing along the railroad right-of-way of the Union Pacific lines. Specific locations are determined based on field conditions and are subject to change.
PE 5029 CATENARY STRUCTURE REHAB, MED
This project involves the ongoing rehabilitation of various catenary structures on Metra Electric District subdistricts, all originating in Chicago: the University Park subdistrict, the South Chicago subdistrict and the Blue Island subdistrict. This work typically involves rehabilitating structural steel, walkways, and concrete foundation pedestals. The work will depend on the results of condition assessments and the availability of track time to do the rehabilitation.
PE 5040 63RD - 67TH STREET BRIDGES, MED
This project involves steel and concrete rehabilitation on Metra Electric District mainline bridges. This work typically involves removing deteriorated concrete from the underside of the deck, cleaning the existing structural steel and reinforcing steel and applying epoxy resin coating the underside of the deck.
SIGNAL, ELECTRICAL AND COMMUNICATIONS
PE 4343 POSITIVE TRAIN CONTROL, MET
This project consists of the development and installation of a federally mandated Positive Train Control (PTC) system that integrates new technology with existing train control and operating systems to enhance train operations. This system will help prevent track authority violations, speed limit violations and unauthorized entry into work zones. The system will monitor and ensure the train crew’s compliance with all operating instructions, while a screen-based display will provide the train crew with additional operating

P R O G R A M a n d B U D G E T B O O K | 3 7
information. The system will also query wayside devices for broken rails, proper switch alignment and signal aspects in real time to provide improved train operation.
PE 4746 IMPEDANCE BONDS, MED
This project involves replacing impedance bonds that are damaged, defective, or have insufficient negative return equipment and connections. The impedance bonds are a fundamental part of the track circuit. They control the current path and thus limit the power losses and assure proper function of the protective relays.
PE 5056 SIGNAL SYSTEM UPGRADES, MET
This project will replace various signal infrastructures such as junction boxes, electrical cabinets, wiring, LED lights, etc. on an as needed basis when some part of the signal system is determined to be substandard upon inspection or failure. A large portion of Metra’s signal system infrastructure in the field has become obsolete. It is also affected by the extremes of weather common to the Chicago region.
PE 4744 PROTECTIVE RELAY REPLACEMENT, MED
This project will replace the protective relay at all traction power substations. They will be replaced by electronic relays that are more reliable than the existing mechanical relays. The protective relay system protects the local breakers at these locations
PE 4742 STRAY CURRENT PROTECTION, MED
The purpose of the project is to re-establish a path for the stray current between the steel catenary support structures and ground. The special grounding cable may be on the mainline and the South Chicago and Blue Island branches. All structures will be connected to this grounding cable.
PE 5032 SWITCH HEATERS, MET
This project consists of 30 switch-heaters control cabinets, and associated switch heaters. The new units are replacements and are electrically powered.
FACILITIES AND EQUIPMENT
PE 5053 YARD IMPROVEMENTS, BNS
This project consists of several improvements at the 14th Street Yard and the Hill Yard. Improvements will include, but not be limited to an elevator for the 14th Street Shop building, stand by power at Hill yard and switch heaters at 14th Street Yard.
PE 4965 YARD IMPROVEMENTS, RID
This project is for the engineering and design of the 49th Street Diesel Shop on the Rock Island line to enable additional shift work for rail car and locomotive rehabilitation. Design could also include but not be limited to expanding office space, crew facilities and locker rooms. A transfer table could also be added.
PE 5076 YARD IMPROVEMENTS, MWD
This project involves work at the Western Avenue Yard. Improvements will include replacing the roof on the shop building, grating and replacing boardwalks.
PE 5072 YARD IMPROVEMENTS, RID
This project involves but not limited to replacing ties, crosswalks and platforms with steel grated platforms. Metra will purchase and install a wheel truing machine. The machine slowly rotates and grinds the surface of the rail car wheel to make them smooth and even.
PE 5070 POLICE VEHICLES, MET
This project involves the purchase of vehicles to be utilized by Metra Police at various locations throughout the Metra system. FY 2016 FTA funds will be used for purchases and is 100 percent commuter share. The current condition of the equipment that is being replaced is poor, as it has reached or surpassed its useful life.
PE 5068 EQUIPMENT & VEHICLES- MECHANICAL, MET
This project provides for the purchase and rehabilitation of vehicles and equipment to be utilized by Metra’s Mechanical and Engineering Departments. The vehicles and equipment purchased will replace various pieces of obsolete or inadequate support vehicles and equipment used to help service and maintain Metra’s fleet at the various yards. This includes but is not limited to supervisory vehicles for supervision of fieldwork, small pickup trucks, various forklift trucks and car movers. The existing equipment has surpassed its useful life.
PE 5066 OFFICE EQUIPMENT
This project consists of the purchase of various pieces of equipment and office furniture that will be utilized at Metra storehouses and at the 547 W. Jackson building.
PE 5091 MOBILE APPLICATION, MET
This project includes but is not limited to the implementation, launch and improvement of mobile applications on the Metra system that includes mobile ticketing, trip planning, account management and other related app features. This project may include the purchase of conductor handheld devices and printers, as well as training. All testing will be included in this project. It will include but not be limited to testing of onboard credit card sales and printing from home, as well as other types of app testing.

3 8 | P R O G R A M a n d B U D G E T B O O K
PE 5061 CREW OPTIMIZATION, MET
This project is for the purchase of software that uses train schedules to determine the minimum amount of crews members needed to operate service. This software will be used with the new electronic crew calling system that helps Metra better comply with Passenger Hours of Service regulations for hours of service reporting requirements.
PE 5062 AUTOMATED PASSENGER COUNTS, MET
This project is for a pilot program to guide the installation of Metra’s Automated Passenger Counting system. Metra will issue a letter of inquiry to retain a consultant that has knowledge of the state-of–the-art technology and data utilization. The project may have three components: consulting services, hardware purchases and the supporting software.
PE 5064 IT COMPONENTS & SERVICES, MET
This project covers a systems upgrade for information technology infrastructure at Metra headquarters to be integrated with the financial system replacement and upgrade.
PE 4852 FINANCIAL SYSTEM REPLACEMENT, MET
This project will provide funding for Metra to implement an Enterprise Resource Planning (ERP) system that will be compliant with current financial system “best practices.” This system will support electronic data interchange, be fully extensible and upgradeable, use integrated highly flexible analytical reporting tools and support microcomputer/network-based software productivity tools.
PE 4771 547 BUILDING UPGRADES, MET
This project will provide for various building improvements and upgrades to Metra central headquarters located at 547 W. Jackson Blvd. in Chicago. This project will improve the habitable space for visitors and workers at the building. PE 4743 547 BUILDING IMPROVEMENTS, MET
This project addresses electrical improvements at the 547 W. Jackson Building. Projects may include the installation of a stairwell pressurization system and the replacement of the building HVAC system. All work will comply with City of Chicago building code.
STATIONS AND PARKING
PE 5077 STATION SIGNS, MET
The scope of this project consists of the installation of new station signs at Metra commuter stations. The signs will provide general information, station identification, and pathfinding directional guidance. They will be designed to comply with the American with Disabilitites Act (ADA). Modifications to the building structures are not anticipated.
PE 5078 SYSTEMWIDE STATION IMPROVEMENTS, MET
This project element includes, but is not limited to, the rehabilitation of Metra station facilities, more specifically the rehabilitation or replacement of roofs, masonry, door & window replacement, concrete work, floors, ceilings, lighting, drainage, stairs, guardrails, handrails, benches, shelters, and canopies.
PE 5079 STATION FACILITY IMPROVEMENTS, MET
This project element includes, but is not limited to, the replacement and/or rehabilitation of station platforms, new lighting, and rehabilitation of access stairs, stair enclosures, shelters, and repair of warming shelters. Work to be performed may also include gatehouse/head house rehabilitation, replacement of leaking roofs, replacement of ceilings, and installation of new lighting, and other related work.
PE 5075 INNOVATIVE PLATFORM TREATMENTS, MET
This is a demonstration project for the installation of heated platform technology for snow removal. This system would be used at stations with precast or composite platforms. It does lend itself to asphalt platforms.
PE 5067 ADA PLATFORMS & RAMPS, MET
This project is part of Metra’s ongoing effort to bring commuter rail stations into compliance with the requirements of the Americans with Disabilities Act (ADA) of 1990. This project identifies, at each key station, the specific work that will be done to bring the key stations into compliance. At these stations, existing platforms will be rehabilitated in order to allow deteriorated tactile surfaces to be replaced with the ADA-compliant “truncated dome” type surfaces.
PE 4878 WEST CHICAGO STATION UPR
This project involves the rehabilitation of the West Chicago Station facility. The West Chicago Station facility is in need of rehabilitation work that includes addressing drainage and water leak issues, deteriorated platforms, lighting, ADA access rehabilitation and retaining wall work.
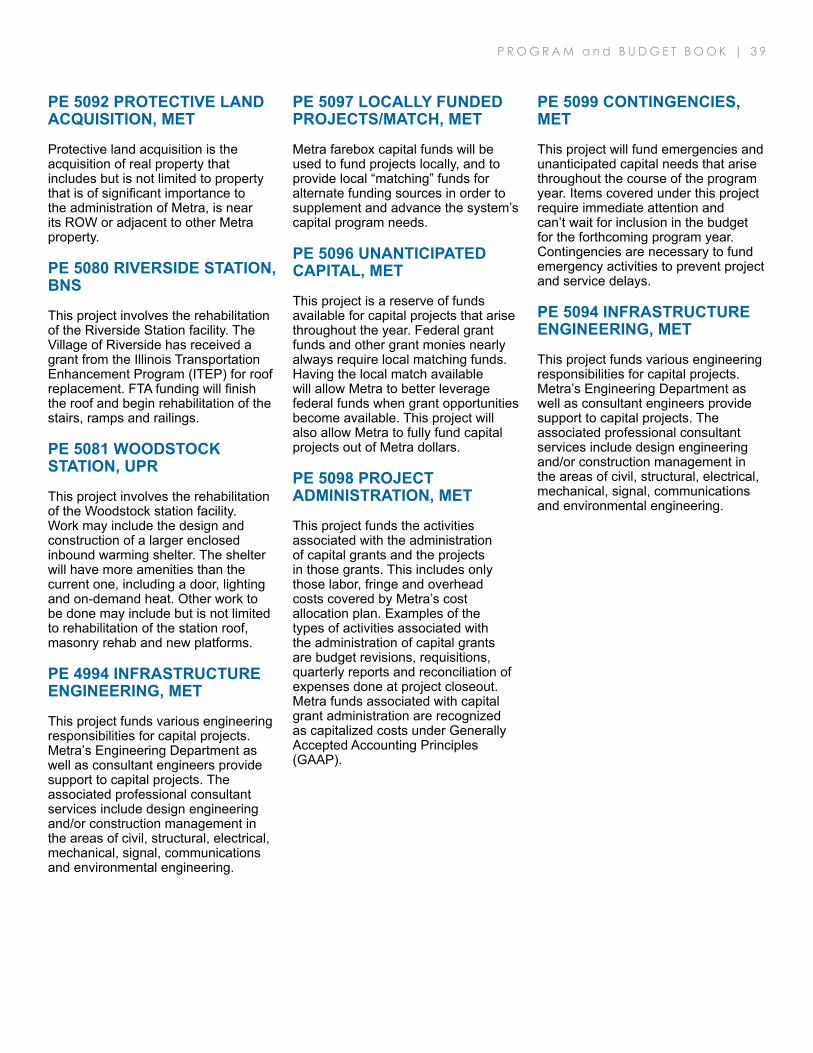
P R O G R A M a n d B U D G E T B O O K | 3 9
PE 5092 PROTECTIVE LAND ACQUISITION, MET
Protective land acquisition is the acquisition of real property that includes but is not limited to property that is of significant importance to the administration of Metra, is near its ROW or adjacent to other Metra property.
PE 5080 RIVERSIDE STATION, BNS
This project involves the rehabilitation of the Riverside Station facility. The Village of Riverside has received a grant from the Illinois Transportation Enhancement Program (ITEP) for roof replacement. FTA funding will finish the roof and begin rehabilitation of the stairs, ramps and railings.
PE 5081 WOODSTOCK STATION, UPR
This project involves the rehabilitation of the Woodstock station facility. Work may include the design and construction of a larger enclosed inbound warming shelter. The shelter will have more amenities than the current one, including a door, lighting and on-demand heat. Other work to be done may include but is not limited to rehabilitation of the station roof, masonry rehab and new platforms.
PE 4994 INFRASTRUCTURE ENGINEERING, MET
This project funds various engineering responsibilities for capital projects. Metra’s Engineering Department as well as consultant engineers provide support to capital projects. The associated professional consultant services include design engineering and/or construction management in the areas of civil, structural, electrical, mechanical, signal, communications and environmental engineering.
SUPPORT ACTIVITIES
PE 5097 LOCALLY FUNDED PROJECTS/MATCH, MET
Metra farebox capital funds will be used to fund projects locally, and to provide local “matching” funds for alternate funding sources in order to supplement and advance the system’s capital program needs.
PE 5096 UNANTICIPATED CAPITAL, MET
This project is a reserve of funds available for capital projects that arise throughout the year. Federal grant funds and other grant monies nearly always require local matching funds. Having the local match available will allow Metra to better leverage federal funds when grant opportunities become available. This project will also allow Metra to fully fund capital projects out of Metra dollars.
PE 5098 PROJECT ADMINISTRATION, MET
This project funds the activities associated with the administration of capital grants and the projects in those grants. This includes only those labor, fringe and overhead costs covered by Metra’s cost allocation plan. Examples of the types of activities associated with the administration of capital grants are budget revisions, requisitions, quarterly reports and reconciliation of expenses done at project closeout. Metra funds associated with capital grant administration are recognized as capitalized costs under Generally Accepted Accounting Principles (GAAP).
PE 5099 CONTINGENCIES, MET
This project will fund emergencies and unanticipated capital needs that arise throughout the course of the program year. Items covered under this project require immediate attention and can’t wait for inclusion in the budget for the forthcoming program year. Contingencies are necessary to fund emergency activities to prevent project and service delays.
PE 5094 INFRASTRUCTURE ENGINEERING, MET
This project funds various engineering responsibilities for capital projects. Metra’s Engineering Department as well as consultant engineers provide support to capital projects. The associated professional consultant services include design engineering and/or construction management in the areas of civil, structural, electrical, mechanical, signal, communications and environmental engineering.

4 0 | P R O G R A M a n d B U D G E T B O O K

P R O G R A M a n d B U D G E T B O O K | 4 1
Exhibit 15CAPITAL PROGRAM 2016-2020 CORE PROGRAM($ in millions)
Description 2016 2017 2018 2019 2020 TotalRolling StockLocomotive Improvements $35,100 $62,020 $16,200 $16,000 $20,738 $150,058Car Rehabilitation 22,358 66,350 32,250 40,250 35,375 $196,583New Rolling Stock 15,000 35,300 6,500 105,600 78,000 $240,400MU Car Improvements 515 0 546 500 580 $2,141Fleet Component Overhaul 11,900 7,224 7,848 9,306 10,084 $46,362HVAC Refrigerant Conversion 500 0 0 0 0 $500
Sub-Total 85,373 170,894 63,344 171,656 144,777 636,044Track & StructureTies and Ballast 6,765 3,670 5,250 6750 7,000 29,435Rail 8,418 7,040 6,035 6,815 8,465 36,773Crossings (Road and Track) 3,900 3,500 1,925 2,825 3,825 15,975Bridges 2,600 12,100 66,850 22,600 18,600 122,750Retaining Wall Rehabilitation 1,177 500 500 750 750 3,677Structural Upgrades 1,000 1,000 1,150 1,150 1,150 5,450
Sub-Total 23,860 27,810 81,710 40890 39,790 214,060Signal, Electrical & CommunicationsSignal System Upgrades 1,500 5,700 16,500 21,500 21,630 66,830Interlockings 0 7,000 0 0 0 7,000Electrical System Improvements 1,400 6,450 8,100 7,350 4,650 27,950Communications Improvements 0 177 0 0 2,500 2,677Positive Train Control 34,000 23,700 30,000 0 0 87,700
Sub-Total 36,900 43,027 54,600 28,850 28,780 192,157Facilities & EquipmentYard Improvements 4,600 2,000 7,750 8,853 9,103 32,306Building Improvements 500 700 650 1,500 1,500 4,850Equipment and Vehicles 10,975 11,018 11,422 6,327 5,275 45,017Financial Systems Replacement 1,000 4,735 2,500 2,500 5,000 15,735
Sub-Total 17,075 18,453 22,322 19,180 20,878 97,908Stations & ParkingStations & Parking 10,192 7,000 6,250 2,000 4,250 29,692ADA Improvements 3,000 2,000 3,000 3,000 3,000 14,000
Sub-Total 13,192 9,000 9,250 5,000 7,250 43,692Support ActivitiesTechnical Studies 1,000 2,000 5,000 5,000 5,000 18,000Project Administraion 800 900 1,000 1,000 1,000 4,700Locally Funded Projects 3,250 4,580 4,283 4,653 5,135 21,901Contingencies 1,872 1,000 1,521 2,838 2,970 10,201Unanticipated Capital 2,370 2,500 2,500 2,000 1,720 11,090
Sub-Total 9,292 10,980 14,304 15,491 15,825 65,892Grand Total* $185,692 $280,164 $245,530 $281,068 $257,300 $1,249,754
*May Not Total Due to Rounding

4 2 | P R O G R A M a n d B U D G E T B O O K
Exhibit 16METRA STATE OF ILLINOIS CAPITAL BOND PROGRAM *($ in millions)
*Applied for, but not received. In additon to the more than $300 million in State Bond Funds that are outstanding, many other projects funded by the State Bond Program are currently suspended.
Capital Assets 2010 2011 2012 2013 2014 2014* Outstanding Total
Highliner Cars Replacement, MED (160) $118,800 $466,300 $0 $0 $0 $0 $0 $585,100New Locomotives $0 $0 $0 $0 $0 $0 $93,200 $93,200New Cars $0 $0 $0 $0 $0 $29,680 $0 $29,680UP-North Line Bridges $0 $0 $0 $12,000 $0 $0 $10,500 $22,500Deering Bridge $0 $0 $0 $0 $18,000 $0 $0 $18,000Fox River Bridge $0 $0 $0 $0 $0 $0 $27,000 $27,000UP West Line $0 $0 $0 $0 $44,500 $0 $0 $44,500Positive Train Control $0 $0 $0 $44,000 $0 $102,000 $0 $146,000Yard Improvements $0 $0 $0 $7,150 $0 $7,840 $0 $14,990Stations $38,200 $0 $0 $40,670 $10,000 $30,860 $0 $119,730Total Bond Program $157,000 $466,300 $0 $103,820 $72,500 $170,380 $130,700 $1,100,700
$301,080
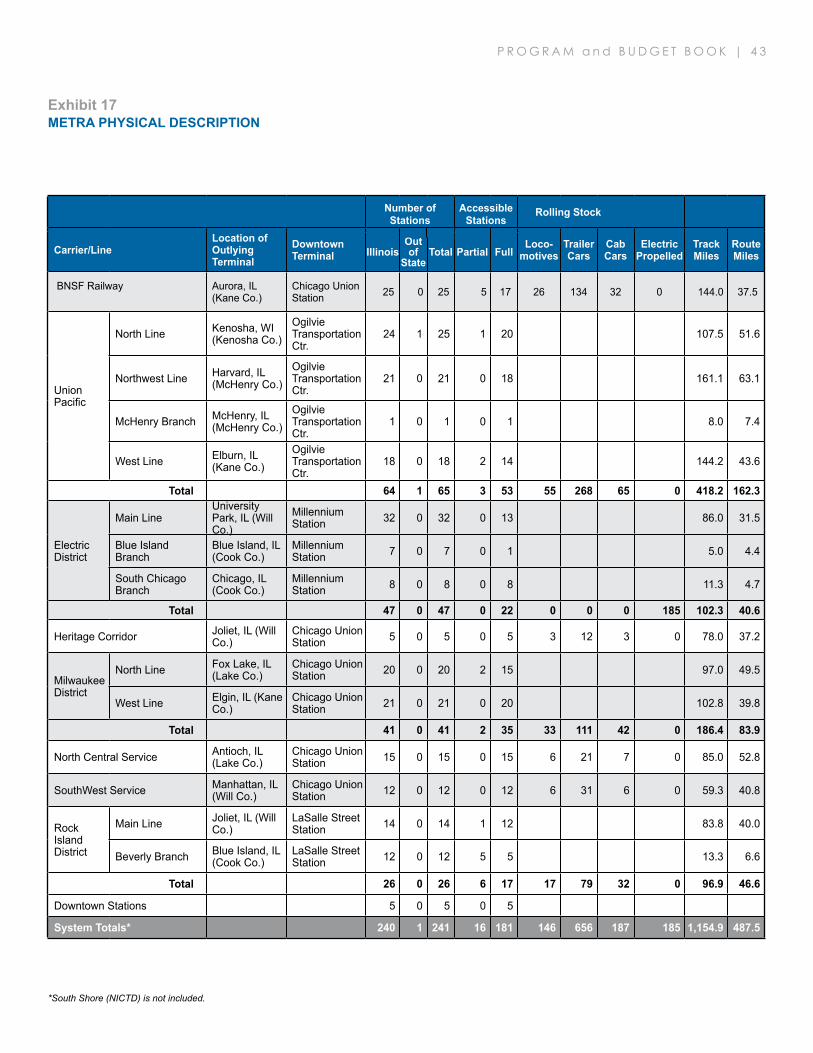
P R O G R A M a n d B U D G E T B O O K | 4 3
Exhibit 17METRA PHYSICAL DESCRIPTION
Number of Stations
AccessibleStations
Rolling Stock
Carrier/LineLocation ofOutlying Terminal
Downtown Terminal
Loco-motives
TrailerCars
CabCars
ElectricPropelled
TrackMiles
RouteMilesIllinois
Out of
StateTotal Partial Full
BNSF Railway Aurora, IL (Kane Co.)
Chicago Union Station 25 0 25 5 17 26 134 32 0 144.0 37.5
Union Pacific
North Line Kenosha, WI (Kenosha Co.)
Ogilvie Transportation Ctr.
24 1 25 1 20 107.5 51.6
Northwest Line Harvard, IL (McHenry Co.)
Ogilvie Transportation Ctr.
21 0 21 0 18 161.1 63.1
McHenry Branch McHenry, IL (McHenry Co.)
Ogilvie Transportation Ctr.
1 0 1 0 1 8.0 7.4
West Line Elburn, IL (Kane Co.)
Ogilvie Transportation Ctr.
18 0 18 2 14 144.2 43.6
Total 64 1 65 3 53 55 268 65 0 418.2 162.3
Electric District
Main LineUniversity Park, IL (Will Co.)
Millennium Station 32 0 32 0 13 86.0 31.5
Blue Island Branch
Blue Island, IL (Cook Co.)
Millennium Station 7 0 7 0 1 5.0 4.4
South Chicago Branch
Chicago, IL (Cook Co.)
Millennium Station 8 0 8 0 8 11.3 4.7
Total 47 0 47 0 22 0 0 0 185 102.3 40.6
Heritage Corridor Joliet, IL (Will Co.)
Chicago Union Station 5 0 5 0 5 3 12 3 0 78.0 37.2
Milwaukee District
North Line Fox Lake, IL (Lake Co.)
Chicago Union Station 20 0 20 2 15 97.0 49.5
West Line Elgin, IL (Kane Co.)
Chicago Union Station 21 0 21 0 20 102.8 39.8
Total 41 0 41 2 35 33 111 42 0 186.4 83.9
North Central Service Antioch, IL (Lake Co.)
Chicago Union Station 15 0 15 0 15 6 21 7 0 85.0 52.8
SouthWest Service Manhattan, IL (Will Co.)
Chicago Union Station 12 0 12 0 12 6 31 6 0 59.3 40.8
Rock Island District
Main Line Joliet, IL (Will Co.)
LaSalle Street Station 14 0 14 1 12 83.8 40.0
Beverly Branch Blue Island, IL (Cook Co.)
LaSalle Street Station 12 0 12 5 5 13.3 6.6
Total 26 0 26 6 17 17 79 32 0 96.9 46.6
Downtown Stations 5 0 5 0 5
System Totals* 240 1 241 16 181 146 656 187 185 1,154.9 487.5
*South Shore (NICTD) is not included.

4 4 | P R O G R A M a n d B U D G E T B O O K
Exhibit 18METRA OPERATING AND SERVICE CHARACTERISTICS AS OF 2015
Revenue Trains TrainMiles
CarMiles
Average Scheduled Speeds On-Time Performance
WeekdayPeak
WeekdayOff-Peak
Weekend/Holiday
2014Average
Jan-Jun15
AverageCarrier/Line Weekday Sat Sun/Hol Jul14-Jun15 Jul14-Jun15
BNSF Railway 94 28 18 948,488 6,972,911 34.9 30.5 28.0 89.7% 94.1%
Union Pacific
North 70 26 18 756,726 4,349,008 30.4 28.9 30.1 96.7% 97.6%
Northwest 65 24 15 940,321 6,283,683 33.9 32.7 34.0 95.2% 95.9%
West 59 20 18 699,299 4,734,488 31.9 30.8 30.6 94.4% 94.8%
Total 194 70 51 2,396,346 15,367,179 95.5% 96.2%
Electric District
Main Line 79 46 20 727,610 3,792,075 23.9 22.7 22.8 97.0% 96.4%
Blue Island 37 30 0 156,964 500,260 32.2 29.4 28.8 97.9% 98.0%
So Chicago 54 48 20 229,027 857,880 20.2 19.7 20.4 98.0% 98.6%
Total 170 124 40 1,113,601 5,150,215 97.5% 97.4%
Heritage Corridor 6 0 0 56,996 265,949 34.3 -- -- 91.4% 90.4%
Milwaukee DistrictNorth 60 24 20 766,136 4,682,699 32.1 30.3 31.1 91.7% 93.1%
West 58 24 18 660,459 4,534,878 29.5 29.3 29.0 93.5% 95.3%
Total 118 48 38 1,426,595 9,217,577 92.6% 94.2%
North Central Service 22 0 0 295,067 1,342,480 34.2 33.9 -- 89.9% 92.5%
SouthWest Service 30 6 0 249,285 1,826,357 27.0 27.4 28.8 92.6% 93.9%
Rock Island District 69 20 16 702,088 5,127,098 29.2 28.8 27.4 93.8% 97.6%
System Totals/Averages* 703 296 163 7,188,466 45,269,766 31.4 29.4 29.0 94.3% 95.8%
*South Shore (NICTD) is not included.
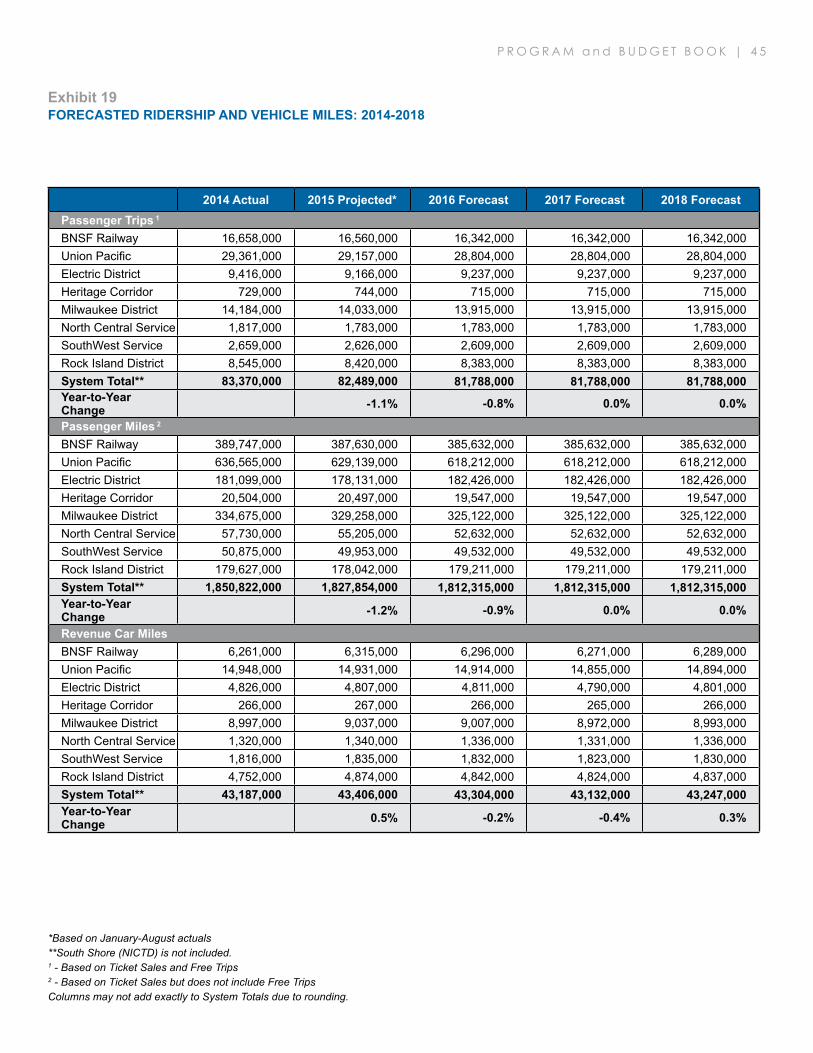
P R O G R A M a n d B U D G E T B O O K | 4 5
Exhibit 19FORECASTED RIDERSHIP AND VEHICLE MILES: 2014-2018
*Based on January-August actuals**South Shore (NICTD) is not included.1 - Based on Ticket Sales and Free Trips2 - Based on Ticket Sales but does not include Free TripsColumns may not add exactly to System Totals due to rounding.
2014 Actual 2015 Projected* 2016 Forecast 2017 Forecast 2018 ForecastPassenger Trips 1
BNSF Railway 16,658,000 16,560,000 16,342,000 16,342,000 16,342,000 Union Pacific 29,361,000 29,157,000 28,804,000 28,804,000 28,804,000 Electric District 9,416,000 9,166,000 9,237,000 9,237,000 9,237,000 Heritage Corridor 729,000 744,000 715,000 715,000 715,000 Milwaukee District 14,184,000 14,033,000 13,915,000 13,915,000 13,915,000 North Central Service 1,817,000 1,783,000 1,783,000 1,783,000 1,783,000 SouthWest Service 2,659,000 2,626,000 2,609,000 2,609,000 2,609,000 Rock Island District 8,545,000 8,420,000 8,383,000 8,383,000 8,383,000 System Total** 83,370,000 82,489,000 81,788,000 81,788,000 81,788,000 Year-to-Year Change -1.1% -0.8% 0.0% 0.0%
Passenger Miles 2
BNSF Railway 389,747,000 387,630,000 385,632,000 385,632,000 385,632,000 Union Pacific 636,565,000 629,139,000 618,212,000 618,212,000 618,212,000 Electric District 181,099,000 178,131,000 182,426,000 182,426,000 182,426,000 Heritage Corridor 20,504,000 20,497,000 19,547,000 19,547,000 19,547,000 Milwaukee District 334,675,000 329,258,000 325,122,000 325,122,000 325,122,000 North Central Service 57,730,000 55,205,000 52,632,000 52,632,000 52,632,000 SouthWest Service 50,875,000 49,953,000 49,532,000 49,532,000 49,532,000 Rock Island District 179,627,000 178,042,000 179,211,000 179,211,000 179,211,000 System Total** 1,850,822,000 1,827,854,000 1,812,315,000 1,812,315,000 1,812,315,000 Year-to-Year Change -1.2% -0.9% 0.0% 0.0%
Revenue Car Miles
BNSF Railway 6,261,000 6,315,000 6,296,000 6,271,000 6,289,000 Union Pacific 14,948,000 14,931,000 14,914,000 14,855,000 14,894,000 Electric District 4,826,000 4,807,000 4,811,000 4,790,000 4,801,000 Heritage Corridor 266,000 267,000 266,000 265,000 266,000 Milwaukee District 8,997,000 9,037,000 9,007,000 8,972,000 8,993,000 North Central Service 1,320,000 1,340,000 1,336,000 1,331,000 1,336,000 SouthWest Service 1,816,000 1,835,000 1,832,000 1,823,000 1,830,000 Rock Island District 4,752,000 4,874,000 4,842,000 4,824,000 4,837,000 System Total** 43,187,000 43,406,000 43,304,000 43,132,000 43,247,000 Year-to-Year Change 0.5% -0.2% -0.4% 0.3%

4 6 | P R O G R A M a n d B U D G E T B O O K
Exhibit 20METRA COMMUTER RAIL STATIONS BY FARE ZONE
ZONE(mile post) BNSF ELECTRIC
MAIN LINEELECTRIC
BLUE ISLANDELECTRIC
S. CHICAGO HERITAGE MILWAUKEE NORTH MILWAUKEE WEST
A(0.0-5.0)
Union Station 0.0 Millennium 0.0 Union Station 0.0 Union Station 0.0 Union Station 0.0 Halsted St 1.8 Van Buren 0.8 Western Ave 2.9 Western Ave 2.9 Western Ave 3.8 Museum
Campus/11th St1.4
18th St 2.2 McCormick Place 2.7 27th St 3.2
B(5.1-10.0)
Cicero 7.0 47th St 5.9 Stony Island 9.1 Healy 6.4 Grand/Cicero 6.5 LaVergne 9.1 53rd St 6.5 Bryn Mawr 9.7 Grayland 8.2 Hanson Park 7.7 Berwyn 9.6 56th St 7.0 South Shore 10.3 Mayfair 9.0 Galewood 8.6 Harlem Ave 10.1 59th St 7.4 Windsor Park 10.9 Mars 9.1
63rd St 7.9 79th St 11.5 Mont Clare 9.5
75th St 9.3 83rd St 12.0
79th St 10.0 87th St 12.5 93rd St 13.2
C(10.1-15.0)
Riverside 11.1 83rd St 10.4 Summit 11.9 Forest Glen 10.2 Elmwood Park 10.2 Hollywood 11.8 87th St 10.9 Edgebrook 11.6 River Grove 11.4 Brookfield 12.3 91st St 11.4 Morton Grove 14.3 Franklin Park 13.2 Congress Park 13.1 95th St 12.0 Mannheim 14.0 LaGrange Rd 13.8 103rd St 13.0 Stone Ave 14.2 107th St 13.5
111th St 14.0 Kensington 14.5
D(15.1-20.0)
Western Springs
15.5 Riverdale 17.3 State St 15.6 Willow Springs
17.5 Golf 16.2 Bensenville 17.2
Highlands 16.4 Ivanhoe 18.2 Stewart Ridge 16.0 Glenview 17.4 Wood Dale 19.1 Hinsdale 16.9 147th St 19.0 W. Pullman 16.7 Glen/N.Glenview 18.8 W. Hinsdale 17.8 Harvey 20.0 Racine Ave 17.0 Clarendon Hills 18.3 Ashland Ave 17.9 Westmont 19.5 Burr Oak 18.4
Blue Island 18.9
E(20.1-25.0)
Fairview Ave 20.4 Hazel Crest 22.3 Lemont 25.3 Northbrook 21.1 Itasca 21.1 Main St 21.2 Calumet 22.8 Lake Cook Road 23.0 Medinah 23.0 Belmont 22.6 Homewood 23.5 Deerfield 24.2 Roselle 23.9 Lisle 24.5 Flossmoor 24.9
F(25.1-30.0)
Naperville 28.5 Olympia Fields 26.6 Lake Forest 28.4 Schaumburg 26.5 211th St 27.6 Hanover Park 28.4 Matteson 28.2 Bartlett 30.1 Richton Park 29.3
G(30.1-35.0)
Route 59 31.6 University Park 31.5 Lockport 32.9
H(35.1-40.0)
Aurora 37.5 Joliet 37.2 Libertyville 35.5 National St 36.0 Prairie Crossing/ 39.2 Elgin 36.6 Libertyville Big Timber 39.8
I(40.1-45.0)
Grayslake 41.0 Round Lake 44.0
J(45.1-50.0)
Long Lake 46.0 Ingleside 47.8 Fox Lake 49.5
K(50.1-55.0)
M(60.1-65.0)

P R O G R A M a n d B U D G E T B O O K | 4 7
NORTH CENTRAL SERVICE ROCK ISLAND MAIN ROCK ISLAND BRANCH
SOUTHWEST SERVICE
UNION PACIFICNORTH
UNION PACIFICNORTHWEST
UNION PACIFIC WEST
Union Station 0.0 LaSalle St. 0.0 Union Station 0.0 Ogilvie 0.0 Ogilvie 0.0 Ogilvie 0.0 Western Ave 2.9 35th St./"Lou" Jones 3.1 Clybourn 2.9 Clybourn 2.9 Kedzie 3.6
Gresham 9.8 Ravenswood 6.5 Irving Park 7.0 Oak Park 8.5 Rogers Park 9.4 Jefferson Park 9.1 River Forest 9.7
Gladstone Park 10.1
River Grove 11.4 95th St 10.9 Brainerd 10.6 Wrightwood 11.2 Main St 11.0 Norwood Park 11.4 Maywood 10.5 Belmont Ave 13.0 Washington Hts 12.0 91st St 11.3 Ashburn 12.6 Davis St 12.0 Edison Park 12.6 Melrose Park 11.3 Schiller Park 14.8 95th St 11.7 Central St 13.3 Park Ridge 13.5 Bellwood 12.6
99th St 12.3 Wilmette 14.4 Dee Road 15.0 Berkeley 14.3 103rd St 12.8 107th St 13.3 111th St 13.8 115th St 14.3 119th St 14.8
Rosemont 15.6 Vermont St 15.7 123rd St 15.2 Oak Lawn 15.2 Kenilworth 15.2 Des Plaines 17.1 Elmhurst 15.7 O'Hare Transfer 17.1 Robbins 17.2 Prairie St 15.8 Chicago Ridge 16.8 Indian Hill 15.8 Cumberland 18.6 Villa Park 17.8
Midlothian 18.4 Vermont St 16.5 Worth 18.2 Winnetka 16.6 Mt Prospect 20.0 Lombard 19.9 Palos Heights 18.7 Hubbard
Woods17.7
Glencoe 19.2
Prospect Heights 24.0 Oak Forest 20.4 Palos Park 20.3 Braeside 20.5 Arlington Heights
22.8 Glen Ellyn 22.4
Tinley Park 23.5 143rd St 23.6 Ravinia 21.5 Arlington Park 24.4 College Ave 23.8 80th Ave 25.1 153rd St 25.2 Highland Park 23.0 Wheaton 25.0
Highwood 24.5 Wheeling 27.2 Hickory Creek 27.5 179th St 28.9 Fort Sheridan 25.7 Palatine 26.8 Winfield 27.5 Buffalo Grove 29.5 Mokena 29.6 Lake Forest 28.3 West Chicago 29.8
Prairie View 31.6 New Lenox 34.0 Lake Bluff 30.2 Barrington 31.9 Vernon Hills 33.0 Great Lakes 32.2
North Chicago 33.7 Mundelein 36.9 Joliet 40.0 Laraway Road 35.8 Waukegan 35.9 Fox River Grove 37.3 Geneva 35.5 Prairie Crossing/ 40.7 Cary 38.6 LibertyvilleWashington St 43.9 Manhattan 40.8 Zion 42.1 Pingree Road 41.7 La Fox 40.9
Winthrop Har-bor
44.5 Crystal Lake 43.2 Elburn 43.6
Round Lk Beach 45.9 Lake Villa 48.2
Antioch 52.8 Kenosha 51.5 McHenry 50.6 Woodstock 51.6 Harvard 63.1

4 8 | P R O G R A M a n d B U D G E T B O O K
Carrier/Line
Passenger Loads (conductor counts)Annual
PassengerTrips *
AnnualPassenger
Miles **
AnnualPassengerRevenue
Avg RevPer
PsngrTrip
Avg Trip
Length(miles)
Weekday AverageAvg
SaturdayAvg
SundayAvg
WeekPeak Reverse Midday Evening Total
BNSF Railway 49,600 4,100 6,900 4,300 64,900 13,700 8,900 347,100 16,594,800 387,311,500 $66,849,900 $4.03 23.3
Union Pacific
North 21,200 5,800 4,300 2,900 34,200 10,100 6,500 187,600 9,356,400 158,531,400 $33,601,500 $3.59 16.9
Northwest 29,600 2,700 4,800 2,700 39,900 12,300 7,700 219,500 11,546,500 289,416,300 $47,840,400 $4.14 25.1
West 21,800 1,500 3,100 1,700 28,100 7,100 5,500 153,100 8,436,300 186,238,200 $33,429,200 $3.96 22.1
Total 72,600 10,000 12,200 7,300 102,200 29,500 19,700 560,200 29,339,200 634,185,900 $114,871,100 $3.92 21.6
Electric District
Main Line 20,600 900 3,400 1,600 26,400 5,800 3,200 141,000 8,080,000 162,955,200 $29,977,500 $3.71 20.2
Blue Island 1,700 200 300 100 2,300 700 0 12,200 289,400 4,707,500 $958,200 $3.31 16.3
So Chicago 3,000 600 900 300 4,800 1,800 800 26,600 888,600 10,116,400 $2,098,000 $2.36 11.4
Total 25,300 1,700 4,600 2,000 33,500 8,300 4,000 179,800 9,258,000 177,779,100 $33,033,700 $3.57 19.2
Heritage Corridor 2,400 0 0 0 2,400 0 0 12,000 748,900 20,854,300 $3,177,600 $4.24 27.8
Milwaukee District
North 15,700 3,200 2,600 1,700 23,100 5,400 3,800 124,700 7,247,300 165,735,400 $29,370,700 $4.05 22.9
West 17,600 1,100 2,300 1,300 22,300 5,700 3,900 121,100 6,882,700 166,284,600 $27,923,300 $4.06 24.2
Total 33,300 4,300 4,900 3,000 45,400 11,100 7,700 245,800 14,130,000 332,020,000 $57,294,000 $4.05 23.5
North Central Service 4,700 300 500 200 5,800 0 0 29,000 1,793,800 56,958,300 $8,432,400 $4.70 31.8
SouthWest Service 8,400 100 900 500 9,900 400 0 49,900 2,646,200 50,476,600 $9,859,800 $3.73 19.1
Rock Island District 24,900 600 2,900 1,000 29,300 3,800 2,800 153,100 8,450,900 177,749,700 $31,988,900 $3.79 21.0
System Totals*** 221,300 21,000 32,900 18,300 293,600 66,900 43,300 1,576,900 82,961,700 1,837,335,300 $325,507,500 $3.92 22.1
Exhibit 21RIDERSHIP-RELATED STATISTICS: JULY 2014-JUNE 2015
Note: Columns may not add exactly to System Totals due to rounding. * Includes free trips ** Does not include free trips*** South Shore (NICTD) is not included.

P R O G R A M a n d B U D G E T B O O K | 4 9
Carrier/Line Between Chicago, IL(Cook County) and... Monthly Ten-Ride Regular
One-WayConductorOne-Way
Weekend &Special Event Link-Up PlusBus
BNSF Railway Aurora, IL (Kane County) 263,600 307,200 1,048,000 433,600 248,100 11,100 11,900
Union Pacific
North Kenosha, WI (Kenosha County) 116,100 231,400 577,800 838,000 195,800
Northwest Harvard, IL (McHenry County) 167,200 207,000 854,500 622,900 288,000
West Elburn, IL (Kane County) 121,400 159,800 632,800 433,500 193,000
Total 404,700 598,300 2,065,100 1,894,500 676,700 11,800 2,700
Electric District
Main Line University Park, IL (Will County) 116,500 129,800 1,065,200 266,500 104,600
Blue Island Blue Island, IL (Cook County) 3,600 3,500 28,000 44,800 3,600
So Chicago Chicago, IL (Cook County) 8,800 18,700 162,500 86,600 2,900
Total 128,900 152,000 1,255,700 397,800 111,100 8,800 600
Heritage Corridor Joliet, IL (Will County) 14,200 10,700 17,600 13,900 800 500 25
Milwaukee District
North Fox Lake, IL (Lake County) 98,900 153,400 499,100 447,100 183,000
West Elgin, IL (Kane County) 100,600 102,900 551,100 436,300 165,300
Total 199,500 256,200 1,050,200 883,400 348,300 7,100 900
North Central Service Antioch, IL (Lake County) 29,300 31,400 69,500 146,100 2,100 800 150
SouthWest Service Manhattan, IL (Will County) 46,800 39,900 104,700 105,900 7,200 1,900 50
Rock Island District Joliet, IL (Will County) 137,700 129,800 571,400 315,700 107,100 6,200 400
System Totals* 1,224,400 1,525,500 6,182,200 4,190,900 1,501,500 48,200 16,800
*South Shore (NICTD) is not included.Note: Columns may not add exactly to System Totals due to rounding.
Exhibit 22TICKET SALES BY TICKET TYPE: JULY 2014-JUNE 2015

5 0 | P R O G R A M a n d B U D G E T B O O K
Zone Ticket A B C D E F G H I J K M
AMonthly $95.25
Ten-Ride 31.00
One-Way 3.50
BMonthly 102.25 95.25
Ten-Ride 33.25 31.00
One-Way 3.75 3.50
CMonthly 138.00 102.25 95.25
Ten-Ride 44.50 33.25 31.00
One-Way 5.00 3.75 3.50
DMonthly 159.25 138.00 102.25 95.25
Ten-Ride 51.25 44.50 33.25 31.00
One-Way 5.75 5.00 3.75 3.50
EMonthly 173.50 159.25 138.00 102.25 95.25
Ten-Ride 55.75 51.25 44.50 33.25 31.00
One-Way 6.25 5.75 5.00 3.75 3.50
FMonthly 187.75 173.50 159.25 138.00 102.25 95.25
Ten-Ride 60.25 55.75 51.25 44.50 33.25 31.00
One-Way 6.75 6.25 5.75 5.00 3.75 3.50
GMonthly 202.00 187.75 173.50 159.25 138.00 102.25 95.25
Ten-Ride 64.75 60.25 55.75 51.25 44.50 33.25 31.00
One-Way 7.25 6.75 6.25 5.75 5.00 3.75 3.50
HMonthly 216.25 202.00 187.75 173.50 159.25 138.00 102.25 95.25
Ten-Ride 69.25 64.75 60.25 55.75 51.25 44.50 33.25 31.00
One-Way 7.75 7.25 6.75 6.25 5.75 5.00 3.75 3.50
IMonthly 237.75 216.25 202.00 187.75 173.50 159.25 138.00 102.25 95.25
Ten-Ride 76.00 69.25 64.75 60.25 55.75 51.25 44.50 33.25 31.00
One-Way 8.50 7.75 7.25 6.75 6.25 5.75 5.00 3.75 3.50
JMonthly 252.00 237.75 216.25 202.00 187.75 173.50 159.25 138.00 102.25 95.25
Ten-Ride 80.50 76.00 69.25 64.75 60.25 55.75 51.25 44.50 33.25 31.00
One-Way 9.00 8.50 7.75 7.25 6.75 6.25 5.75 5.00 3.75 3.50
KMonthly 266.25 252.00 237.75 216.25 202.00 187.75 173.50 159.25 138.00 102.25 95.25
Ten-Ride 85.00 80.50 76.00 69.25 64.75 60.25 55.75 51.25 44.50 33.25 31.00
One-Way 9.50 9.00 8.50 7.75 7.25 6.75 6.25 5.75 5.00 3.75 3.50
MMonthly 294.75 280.50 266.25 252.00 237.75 216.25 202.00 187.75 173.50 159.25 138.00 95.25
Ten-Ride 94.00 89.50 85.00 80.50 76.00 69.25 64.75 60.25 55.75 51.25 44.50 31.00
One-Way 10.50 10.00 9.50 9.00 8.50 7.75 7.25 6.75 6.25 5.75 5.00 3.50
Exhibit 232016 ADULT FARE SCHEDULE
Weekend: $8.00 On-Board Surcharge: $5.00

P R O G R A M a n d B U D G E T B O O K | 5 1
Zone Ticket A B C D E F G H I J K M
AMonthly $53.75
Ten-Ride 14.25
One-Way 1.50
BMonthly 62.50 53.75
Ten-Ride 16.50 14.25
One-Way 1.75 1.50
CMonthly 80.00 62.50 53.75
Ten-Ride 21.00 16.50 14.25
One-Way 2.25 1.75 1.50
DMonthly 97.50 80.00 62.50 53.75
Ten-Ride 25.50 21.00 16.50 14.25
One-Way 2.75 2.25 1.75 1.50
EMonthly 106.25 97.50 80.00 62.50 53.75
Ten-Ride 27.75 25.50 21.00 16.50 14.25
One-Way 3.00 2.75 2.25 1.75 1.50
FMonthly 115.00 106.25 97.50 80.00 62.50 53.75
Ten-Ride 30.00 27.75 25.50 21.00 16.50 14.25
One-Way 3.25 3.00 2.75 2.25 1.75 1.50
GMonthly 123.75 115.00 106.25 97.50 80.00 62.50 53.75
Ten-Ride 32.25 30.00 27.75 25.50 21.00 16.50 14.25
One-Way 3.50 3.25 3.00 2.75 2.25 1.75 1.50
HMonthly 132.50 123.75 115.00 106.25 97.50 80.00 62.50 53.75
Ten-Ride 34.50 32.25 30.00 27.75 25.50 21.00 16.50 14.25
One-Way 3.75 3.50 3.25 3.00 2.75 2.25 1.75 1.50
IMonthly 141.25 132.50 123.75 115.00 106.25 97.50 80.00 62.50 53.75
Ten-Ride 36.75 34.50 32.25 30.00 27.75 25.50 21.00 16.50 14.25
One-Way 4.00 3.75 3.50 3.25 3.00 2.75 2.25 1.75 1.50
JMonthly 150.00 141.25 132.50 123.75 115.00 106.25 97.50 80.00 62.50 53.75
Ten-Ride 39.00 36.75 34.50 32.25 30.00 27.75 25.50 21.00 16.50 14.25
One-Way 4.25 4.00 3.75 3.50 3.25 3.00 2.75 2.25 1.75 1.50
KMonthly 158.75 150.00 141.25 132.50 123.75 115.00 106.25 97.50 80.00 62.50 53.75
Ten-Ride 41.25 39.00 36.75 34.50 32.25 30.00 27.75 25.50 21.00 16.50 14.25
One-Way 4.50 4.25 4.00 3.75 3.50 3.25 3.00 2.75 2.25 1.75 1.50
MMonthly 176.25 167.50 158.75 150.00 141.25 132.50 123.75 115.00 106.25 97.50 80.00 53.75
Ten-Ride 45.75 43.50 41.25 39.00 36.75 34.50 32.25 30.00 27.75 25.50 21.00 14.25
One-Way 5.00 4.75 4.50 4.25 4.00 3.75 3.50 3.25 3.00 2.75 2.25 1.50
Exhibit 242016 SPECIAL USER FARE SCHEDULE
Zone Ticket A B C D E F G H I J K M
AMonthly $95.25
Ten-Ride 31.00
One-Way 3.50
BMonthly 102.25 95.25
Ten-Ride 33.25 31.00
One-Way 3.75 3.50
CMonthly 138.00 102.25 95.25
Ten-Ride 44.50 33.25 31.00
One-Way 5.00 3.75 3.50
DMonthly 159.25 138.00 102.25 95.25
Ten-Ride 51.25 44.50 33.25 31.00
One-Way 5.75 5.00 3.75 3.50
EMonthly 173.50 159.25 138.00 102.25 95.25
Ten-Ride 55.75 51.25 44.50 33.25 31.00
One-Way 6.25 5.75 5.00 3.75 3.50
FMonthly 187.75 173.50 159.25 138.00 102.25 95.25
Ten-Ride 60.25 55.75 51.25 44.50 33.25 31.00
One-Way 6.75 6.25 5.75 5.00 3.75 3.50
GMonthly 202.00 187.75 173.50 159.25 138.00 102.25 95.25
Ten-Ride 64.75 60.25 55.75 51.25 44.50 33.25 31.00
One-Way 7.25 6.75 6.25 5.75 5.00 3.75 3.50
HMonthly 216.25 202.00 187.75 173.50 159.25 138.00 102.25 95.25
Ten-Ride 69.25 64.75 60.25 55.75 51.25 44.50 33.25 31.00
One-Way 7.75 7.25 6.75 6.25 5.75 5.00 3.75 3.50
IMonthly 237.75 216.25 202.00 187.75 173.50 159.25 138.00 102.25 95.25
Ten-Ride 76.00 69.25 64.75 60.25 55.75 51.25 44.50 33.25 31.00
One-Way 8.50 7.75 7.25 6.75 6.25 5.75 5.00 3.75 3.50
JMonthly 252.00 237.75 216.25 202.00 187.75 173.50 159.25 138.00 102.25 95.25
Ten-Ride 80.50 76.00 69.25 64.75 60.25 55.75 51.25 44.50 33.25 31.00
One-Way 9.00 8.50 7.75 7.25 6.75 6.25 5.75 5.00 3.75 3.50
KMonthly 266.25 252.00 237.75 216.25 202.00 187.75 173.50 159.25 138.00 102.25 95.25
Ten-Ride 85.00 80.50 76.00 69.25 64.75 60.25 55.75 51.25 44.50 33.25 31.00
One-Way 9.50 9.00 8.50 7.75 7.25 6.75 6.25 5.75 5.00 3.75 3.50
MMonthly 294.75 280.50 266.25 252.00 237.75 216.25 202.00 187.75 173.50 159.25 138.00 95.25
Ten-Ride 94.00 89.50 85.00 80.50 76.00 69.25 64.75 60.25 55.75 51.25 44.50 31.00
One-Way 10.50 10.00 9.50 9.00 8.50 7.75 7.25 6.75 6.25 5.75 5.00 3.50
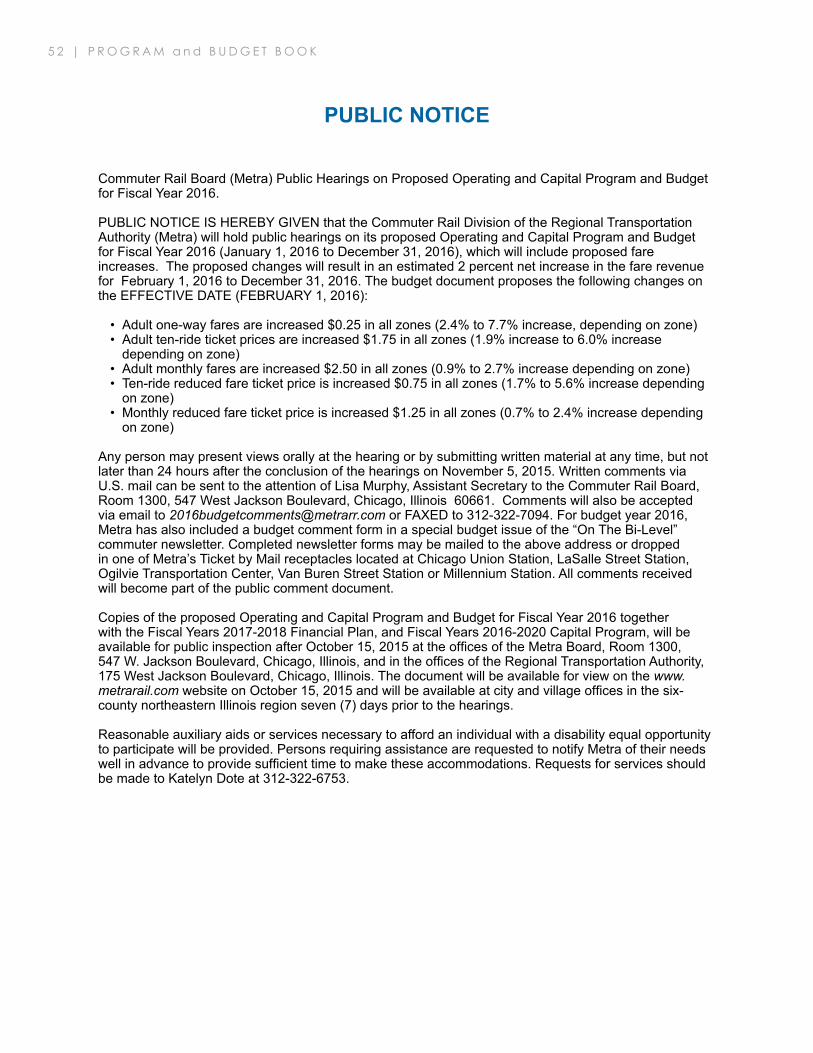
5 2 | P R O G R A M a n d B U D G E T B O O K
Commuter Rail Board (Metra) Public Hearings on Proposed Operating and Capital Program and Budget for Fiscal Year 2016.
PUBLIC NOTICE IS HEREBY GIVEN that the Commuter Rail Division of the Regional Transportation Authority (Metra) will hold public hearings on its proposed Operating and Capital Program and Budget for Fiscal Year 2016 (January 1, 2016 to December 31, 2016), which will include proposed fare increases. The proposed changes will result in an estimated 2 percent net increase in the fare revenue for February 1, 2016 to December 31, 2016. The budget document proposes the following changes on the EFFECTIVE DATE (FEBRUARY 1, 2016):
• Adult one-way fares are increased $0.25 in all zones (2.4% to 7.7% increase, depending on zone)• Adult ten-ride ticket prices are increased $1.75 in all zones (1.9% increase to 6.0% increase
depending on zone)• Adult monthly fares are increased $2.50 in all zones (0.9% to 2.7% increase depending on zone)• Ten-ride reduced fare ticket price is increased $0.75 in all zones (1.7% to 5.6% increase depending
on zone)• Monthly reduced fare ticket price is increased $1.25 in all zones (0.7% to 2.4% increase depending
on zone)
Any person may present views orally at the hearing or by submitting written material at any time, but not later than 24 hours after the conclusion of the hearings on November 5, 2015. Written comments via U.S. mail can be sent to the attention of Lisa Murphy, Assistant Secretary to the Commuter Rail Board, Room 1300, 547 West Jackson Boulevard, Chicago, Illinois 60661. Comments will also be accepted via email to [email protected] or FAXED to 312-322-7094. For budget year 2016, Metra has also included a budget comment form in a special budget issue of the “On The Bi-Level” commuter newsletter. Completed newsletter forms may be mailed to the above address or dropped in one of Metra’s Ticket by Mail receptacles located at Chicago Union Station, LaSalle Street Station, Ogilvie Transportation Center, Van Buren Street Station or Millennium Station. All comments received will become part of the public comment document.
Copies of the proposed Operating and Capital Program and Budget for Fiscal Year 2016 together with the Fiscal Years 2017-2018 Financial Plan, and Fiscal Years 2016-2020 Capital Program, will be available for public inspection after October 15, 2015 at the offices of the Metra Board, Room 1300, 547 W. Jackson Boulevard, Chicago, Illinois, and in the offices of the Regional Transportation Authority, 175 West Jackson Boulevard, Chicago, Illinois. The document will be available for view on the www.metrarail.com website on October 15, 2015 and will be available at city and village offices in the six-county northeastern Illinois region seven (7) days prior to the hearings.
Reasonable auxiliary aids or services necessary to afford an individual with a disability equal opportunity to participate will be provided. Persons requiring assistance are requested to notify Metra of their needs well in advance to provide sufficient time to make these accommodations. Requests for services should be made to Katelyn Dote at 312-322-6753.
PUBLIC NOTICE
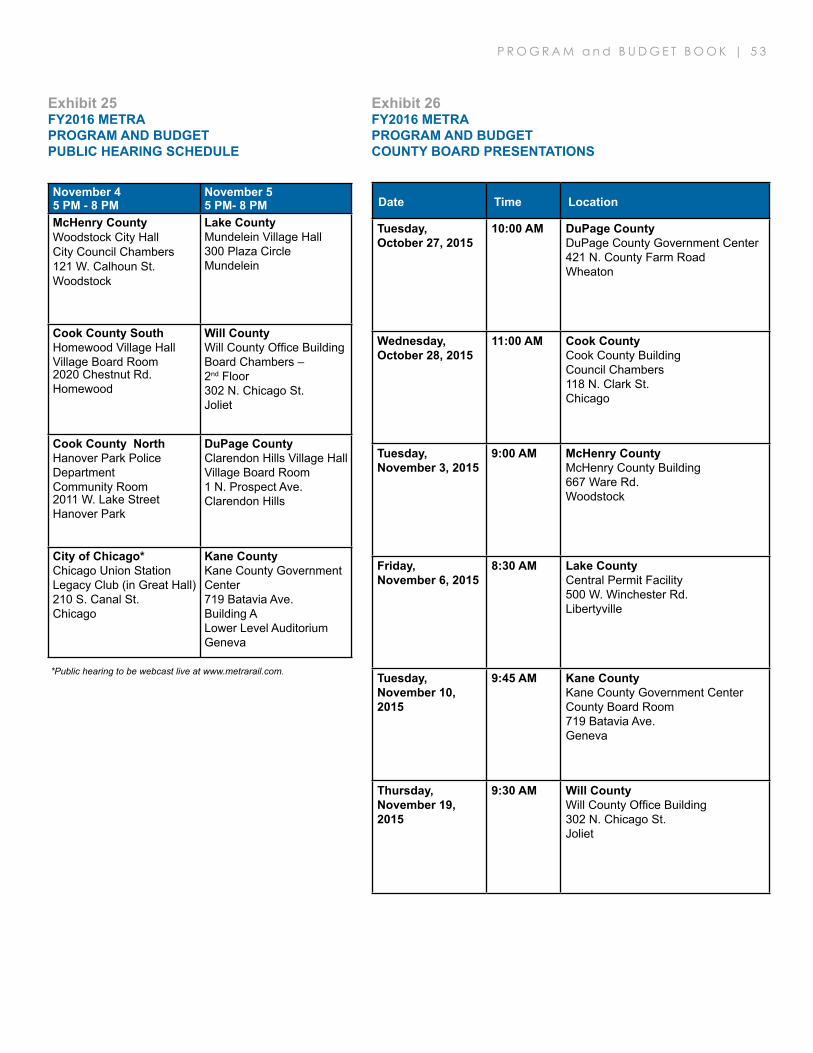
P R O G R A M a n d B U D G E T B O O K | 5 3
Tuesday, October 27, 2015
10:00 AM DuPage County DuPage County Government Center421 N. County Farm RoadWheaton
Wednesday, October 28, 2015
11:00 AM Cook CountyCook County BuildingCouncil Chambers118 N. Clark St.Chicago
Tuesday, November 3, 2015
9:00 AM McHenry CountyMcHenry County Building667 Ware Rd.Woodstock
Friday,November 6, 2015
8:30 AM Lake CountyCentral Permit Facility500 W. Winchester Rd.Libertyville
Tuesday, November 10, 2015
9:45 AM Kane CountyKane County Government CenterCounty Board Room719 Batavia Ave.Geneva
Thursday, November 19, 2015
9:30 AM Will County Will County Office Building302 N. Chicago St.Joliet
November 45 PM - 8 PM
November 55 PM- 8 PM
McHenry County Woodstock City HallCity Council Chambers121 W. Calhoun St.Woodstock
Lake CountyMundelein Village Hall300 Plaza CircleMundelein
Cook County SouthHomewood Village HallVillage Board Room2020 Chestnut Rd.Homewood
Will CountyWill County Office Building Board Chambers – 2nd Floor302 N. Chicago St.Joliet
Cook County North Hanover Park Police DepartmentCommunity Room2011 W. Lake Street Hanover Park
DuPage CountyClarendon Hills Village HallVillage Board Room1 N. Prospect Ave.Clarendon Hills
City of Chicago*Chicago Union StationLegacy Club (in Great Hall)210 S. Canal St.Chicago
Kane CountyKane County Government Center719 Batavia Ave.Building ALower Level Auditorium Geneva
Exhibit 25FY2016 METRA PROGRAM AND BUDGETPUBLIC HEARING SCHEDULE
Exhibit 26FY2016 METRA PROGRAM AND BUDGETCOUNTY BOARD PRESENTATIONS
Date Time Location
*Public hearing to be webcast live at www.metrarail.com.

5 4 | P R O G R A M a n d B U D G E T B O O K
COMMUTER RAIL BOARDORDINANCE NO. MET 15-15
2016 Preliminary Budgets
BE IT ORDAINED:
1. The Board of Directors of the Commuter Rail Division of the Regional Transportation Authority (“Commuter Rail Division”) directs staff to release the Preliminary 2016 Operating and Capital Program and Budget, the 2017-2018 Financial Plan, and the 2016-2020 Capital Program for Public Hearings and public discussion.
2. The Board of Directors of the Commuter Rail Division also authorizes said Public Hearings to be held in the City of Chicago, Suburban Cook County, DuPage County, Kane County, Lake County, McHenry County, and Will County with times and locations as specified in the Legal Notice. This is in compliance with Section 3B.10 of the Regional Transportation Authority Act, (70 ILCS 3615/3B.10).
3. The Preliminary 2016 Operating and Capital Program and Budget, the 2017-2018 Financial Plan, and the 2016-2020 Capital Program contain a fare scenario and policy changes that are being contemplated. The fare scenario and policy changes by the Board of Directors will depend, in part, upon public comments received at public hearings and County Board presentations.
Adopted: October 15, 2015

P R O G R A M a n d B U D G E T B O O K | 5 5
PROTECTING YOUR RIGHTS
Metra is committed to ensuring that no one is denied participation in, or denied the benefits of, or is otherwise discriminated against in the provision of public transportation by commuter rail because of race, color, or national origin, in accordance with Title VI of the Civil Rights Act of 1964, and pursuant to 49 CFR 21.9 (d).
Metra fully complies with Title VI of the Civil Rights Act of 1964 and related statutes, executive orders, and regulations in all programs and activities.
For additional information please contact:
Metra’s Office of BusinessDiversity & Civil Rights
Attn: Title VI547 W. Jackson Blvd., 5 WestChicago, IL [email protected] (Fax)orVisit our website at www.metrarail.com
Patricia Mahon – ChairmanAppointed by Director Don De Graff representing suburban Cook County
Thomas Brabec Appointed by the Chicago South Suburban Mass Transit District
Ray CampbellAppointed by former Director Paul Darley representing DuPage County Dr. Maria H. CoonsAppointed by Director Rodney S. Craig representing suburban Cook County
Larry FalbeAppointed by Director Norm Carlson representing Lake County
Glen R. Holland Appointed by Director Manuel Barbosa representing Kane County
Michelle Machay Appointed by Director Brian K. Reaves representing suburban Cook County Jonathan F. McCabe Appointed by the West Suburban Mass Transit District
William J. MolonyAppointed by Director Jack Partelow representing Will County George Pearce, Esq.Appointed by former Director William Widmer representing suburban Cook County Robert J. Nunamaker Appointed by former Director Jack Schafferrepresenting McHenry County Dave L. WalkerAppointed by Chairman Marty Oberman representing the City of Chicago
CITIZENS ADVISORY BOARD
TITLE VI STATEMENT

5 6 | P R O G R A M a n d B U D G E T B O O K

P R O G R A M a n d B U D G E T B O O K | 5 7
NOTES

5 8 | P R O G R A M a n d B U D G E T B O O K
NOTES

P R O G R A M a n d B U D G E T B O O K | 5 9
NOTES
547 WEST JACKSON BOULEVARD | CHICAGO, ILLINOIS 60661-5717 | WWW.METRARAIL.COM