Embed Size (px)
Citation preview

Production Cell Formation
D0394 Perencanaan Sistem Manufaktur

Cell Formation
• Definisi : Penugasan komponen dan mesin dalam suatu kelompok (group) dan cell.
• Tujuannya adalah :– Aliran komponen antar Cell minimum.– Pemanfaatan mesin dalan cell tinggi.

Production Flow Analysis (PFA)
• Production Flow Analysis (Burbidge, 1989) Dirancang untuk mendapatkan pembagian komponen dan juga pembagian mesin secara lengkap kedalam kelompoknya (famili) dengan menganalisa route proses untuk individual komponen.
• Rangka Pengkodean dan metoda pengelompokan berdasarkan jarak menekankan pada atribut komponen, membantu membentuk kelompok komponen yang serupa, akan tetapi tidak memberikan informasi mengenai mesin yang digunakan untuk proses.

Production Flow Analysis (PFA)
• Gagasan dasarnya adalah membentuk part-machine incidence matrix dan mengidentifikasi komponen tersebut yang memerlukan mesin serupa, kemudian menjadikan clusters.
• Machine-Part incidence matrix – Matrix elemen biner yang tiap baris
menyatakan mesin dan tiap kolom menyatakan komponen. Nilai 1 untuk elemen mij menunjukkan bahwa mesin i diperlukan komponen j .

Part-Machine Incidence Matrix
• Note: The P-M matrix does not explicitly consider the sequence of machine visits for the individual parts (i.e., the individual part routes)
1 2 3 4 5
1 1 0 1 0 0
2 0 1 1 0 1
3 1 0 0 1 0
4 0 0 1 0 1
Mesin (m)
KomponenKomponen 3 diproses pada mesin 1

Partitioning of the Part-Machine
Incidence Matrix
1 2 3 4 5
1 1 0 1 0 0
2 0 1 1 0 1
3 1 0 0 1 0
4 0 0 1 0 1
Exceptional Elements
Void
Voids and Exceptional Elements
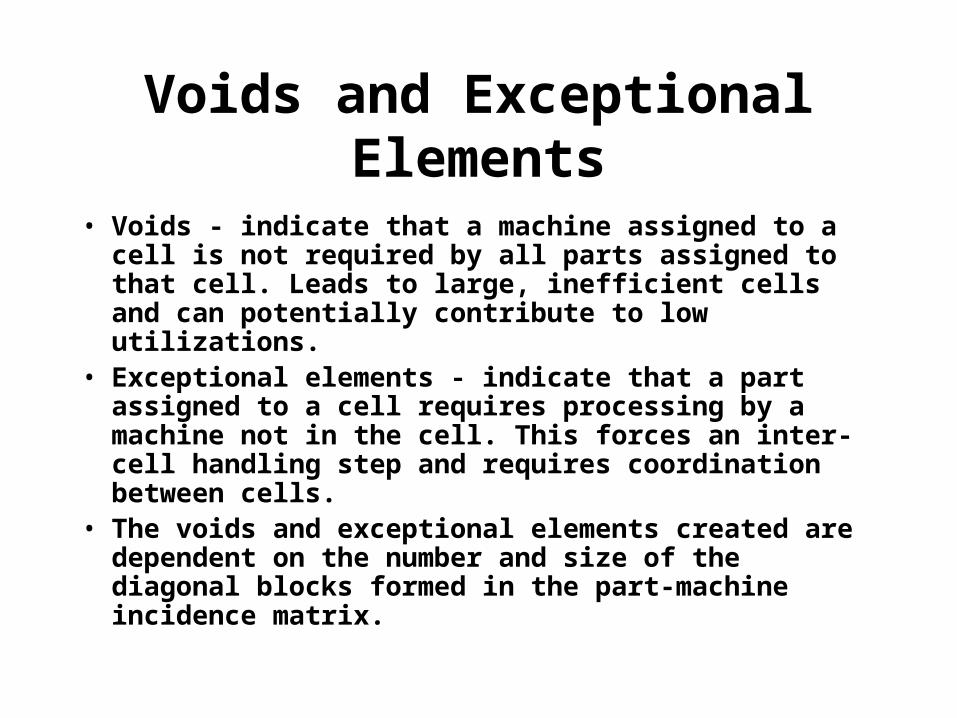
• Voids - indicate that a machine assigned to a cell is not required by all parts assigned to that cell. Leads to large, inefficient cells and can potentially contribute to low utilizations.
• Exceptional elements - indicate that a part assigned to a cell requires processing by a machine not in the cell. This forces an inter-cell handling step and requires coordination between cells.
• The voids and exceptional elements created are dependent on the number and size of the diagonal blocks formed in the part-machine incidence matrix.

Rearranged Partition
1 4 3 5 2
1 1 0 1
3 1 1
2 1 1 0
4 1 1 1
Exceptional Elements
Void

Perfect Cluster
1 4 3 5 2
1 1 1
3 1 1
2 1 1 1
4 1 1 1
No voids or exceptional elements.
Bond Energy
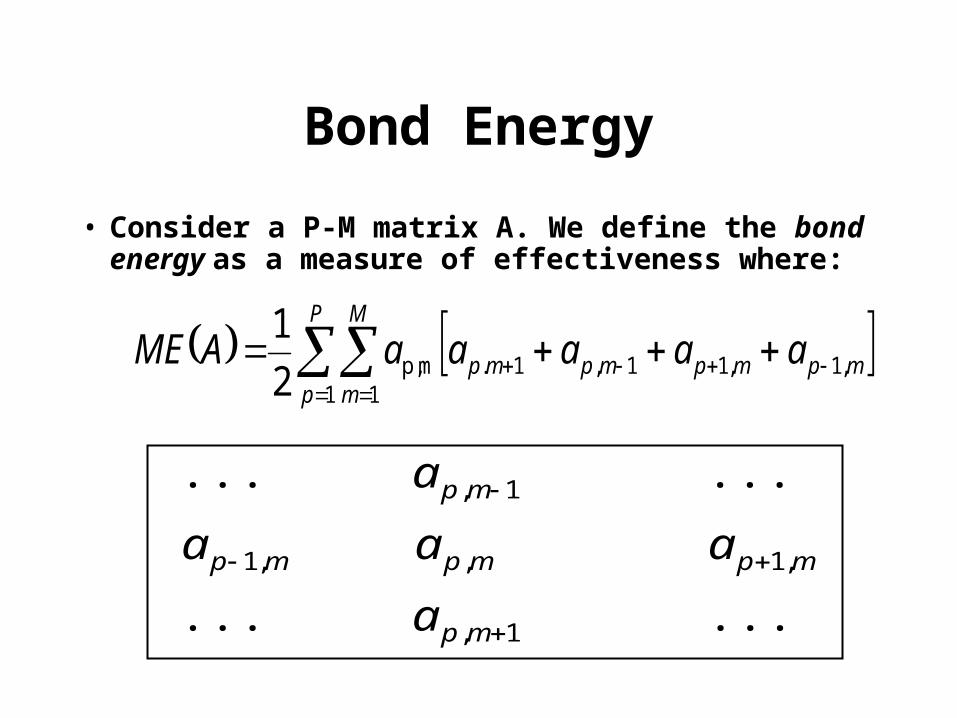
• Consider a P-M matrix A. We define the bond energy as a measure of effectiveness where:
mpmpmpmp
P
p
M
m
aaaaaAME ,1,11,1.1 1
mp, 2
1
... ...
... ...
1,
,1,,1
1,
mp
mpmpmp
mp
a
aaa
a

Contoh Perhitungan BE
1 4 3 5 2
1 1 0 1 0 0
3 1 1 0 0 0
2 0 0 1 1 1
4 0 0 1 1 0
1 2 3 4 5
1 1 0 1 0 0
2 0 1 1 0 1
3 1 0 0 1 0
4 0 0 1 0 1
ME(A) = ½ X 4 = 2 ME (A) = ½ X 14 = 7

Algoritma Bond Energy
• over all P!M! possible arrays obtained by permuting the rows and columns of A.
To maximize the bond energy, the problem decomposes into two parts: one finding the optimal column permutation, and the other finding the optimal row permutation.
mpmpmpmp
P
p
M
m
aaaaaAME ,1,11,1.1 1
mp, 2
1
1
1 1,1mp,1,
1
1 1mp,
P
p
M
mmpmp
M
m
P
p
aaaaAME

Algoritma Bond Energy• Step 1. Select a part column arbitrarily and set i
=1. Try placing each of the remaining (P-i) part columns in each of the (i+1) possible positions (to the left and right of each of the i columns already placed) and compute the contribution of each column to the ME:
,11 1
mp, mp
i
p
M
m
aaColumnME
Place the column that gives the largest ME in its best position. In case of a tie, select arbitrarily. Increment i by 1 and repeat until i=P. When all columns have been placed, go to step 2.

Algoritma Bond Energy
• Step 2. Repeat the procedure for rows, calculating the BE as
1,1 1
mp, mp
i
m
P
p
aaRowME

Binary Ordering Algorithm• Block diagonal structure
– partition the matrix such that “boxes” on the main diagonal contain 0’s and 1’s but the off-diagonal boxes contain only 0’s.
• Assuming that there are N parts and M machines.Step 1. Order rows:– For each column, k, assign weight 2N-k to column k. Evaluate
each row. Sort rows in nonincreasing order. If rows were previously ordered, and no change just occurred, stop; otherwise, goto step 2.
Step 2. Order columns:– For each row, k, assign weight 2M-k to row k. Evaluate each
column. Sort columns in nonincreasing order. If no change, stop; otherwise, goto step 1.

Contoh Binary Ordering
Mesin 1 3 4 7 2 5 6 8 Value
A 1 1 1 200
E 1 1 17
C 1 1 1 1 102
F 1 1 17
D 1 1 1 1 54
B 1 1 1 200
2N-k 128 64 32 16 8 4 2 1
Komponen
Matriks P-M

Contoh Binary Ordering
Mesin 1 3 4 7 2 5 6 8 2M-k
A 1 1 1 32
B 1 1 1 16
C 1 1 1 1 8
D 1 1 1 1 4
E 1 1 2
F 1 1 1
Value 48 56 17 7 48 12 12 3
Komponen
P-M Matrix With row reordered

Contoh Binary Ordering
Mesin 3 1 2 4 5 6 7 8 Value
A 1 1 1 224
B 1 1 1 224
C 1 1 1 1 156
D 1 1 1 1 30
E 1 1 3
F 1 1 3
2N-k 128 64 32 16 8 4 2 1
Komponen
P-M Matrix With row reordered and column reordered

Clustering
Mesin 3 1 2 4 5 6 7 8 Value
A 1 1 1 224
B 1 1 1 224
C 1 1 1 1 156
D 1 1 1 1 30
E 1 1 3
F 1 1 3
2N-k 128 64 32 16 8 4 2 1

Clustering
Mesin 3 1 2 4 5 6 7 8 Value
A 1 1 1 224
B 1 1 1 224
C 1 1 1 1 156
D 1 1 1 1 30
E 1 1 3
F 1 1 3
2N-k 128 64 32 16 8 4 2 1

Handling Exceptional Elements
• Methods to handle exceptional elements– Add extra machines of the required types
so that the machines are included in both groups.
– Redesign the parts so that they don’t require the machines not in the group.
– Route the exceptional parts to both groups.– Combine the groups into a larger group.

Askin and Standridge’s Single PassHeuristic
• Simple binary ordering ignores machine utilization and machine group sizes.
• This heuristic starts with the binary ordered matrix and sequentially assigns ordered parts (along with the required machines to machine groups).
• Replace the 1’s in the binary ordered P-M matrix with a measure of the machine utilizations associated with each part type:
Askin and Standridge’s Single PassHeuristic
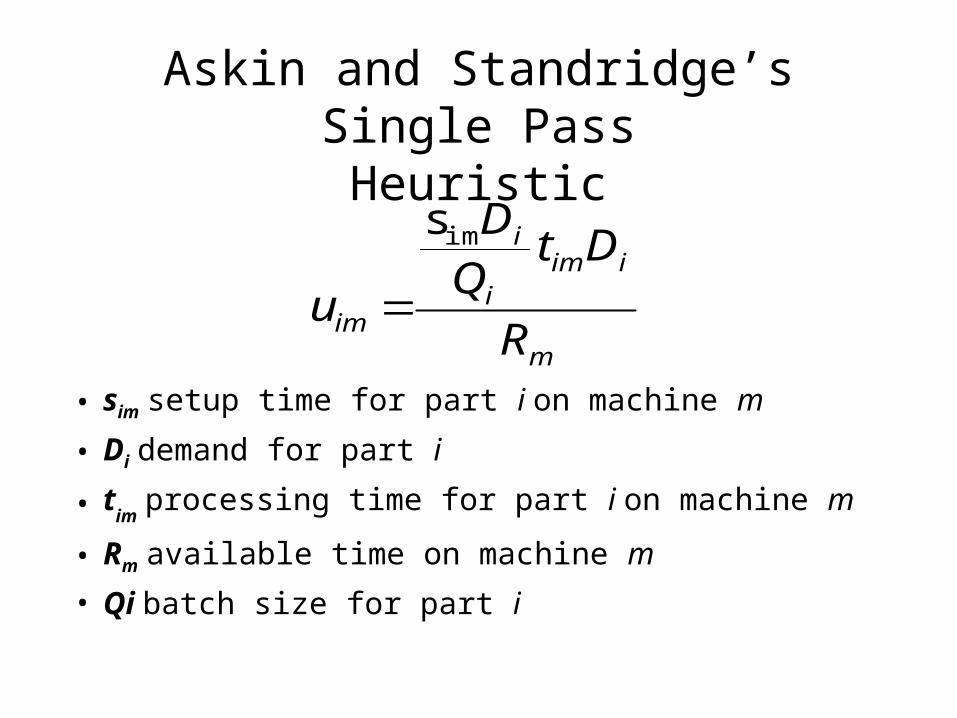
• sim setup time for part i on machine m
• Di demand for part i
• tim
processing time for part i on machine m
• Rm available time on machine m
• Qi batch size for part i
m
iimi
i
im R
DtQ
D
u
ims

Ordered P-M Matrix withUtilizations
Mesin
Komponen
Total
Utilization
Min
Mesin
1 2 3 4 5 6 7 8
A .4 .6 .7 1.1 2
B .4 .5 .2 1.7 2
C .5 .4 .2 .4 1.5 2
D .3 .1 .5 .1 1.0 1
E .5 .4 .9 1
F .6 .3 .9 1
mu = 4

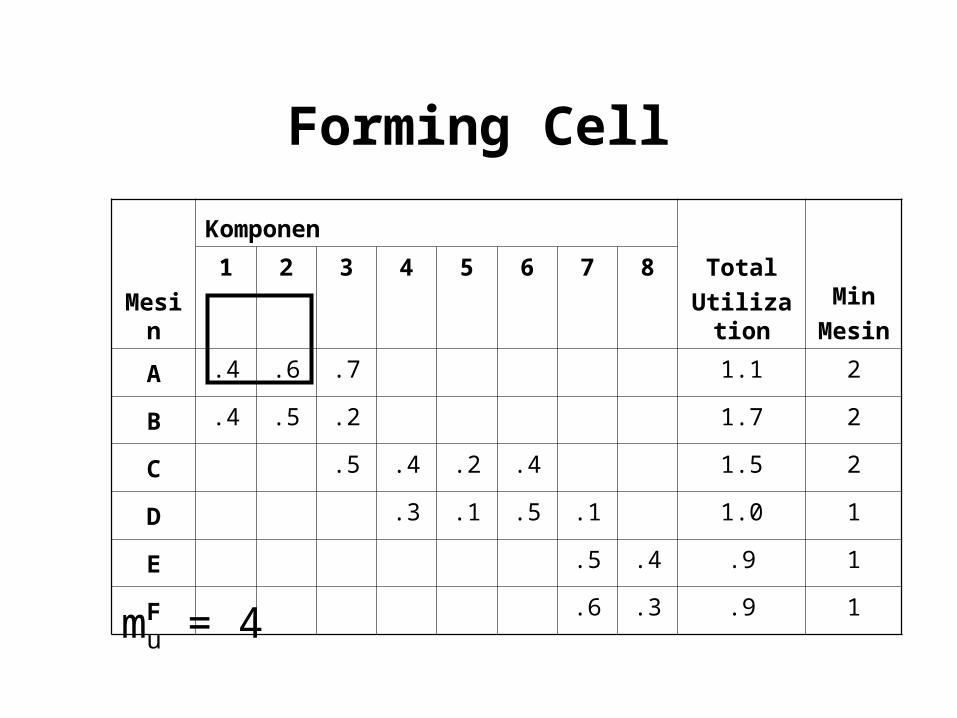
Askin and Standridge’s Single PassHeuristic
• Starting with part 1 and continuing to N– Assign the next part to the first group that
has sufficient capacity on already allocated machines
– If no group has capacity• try adding machines to the most recently created
group• if this would violate the upper limit on the
number of machines in a group, open a new group and add the required machines.

Forming Cell
Mesin
Komponen
Total
Utilization
Min
Mesin
1 2 3 4 5 6 7 8
A .4 .6 .7 1.1 2
B .4 .5 .2 1.7 2
C .5 .4 .2 .4 1.5 2
D .3 .1 .5 .1 1.0 1
E .5 .4 .9 1
F .6 .3 .9 1
mu = 4
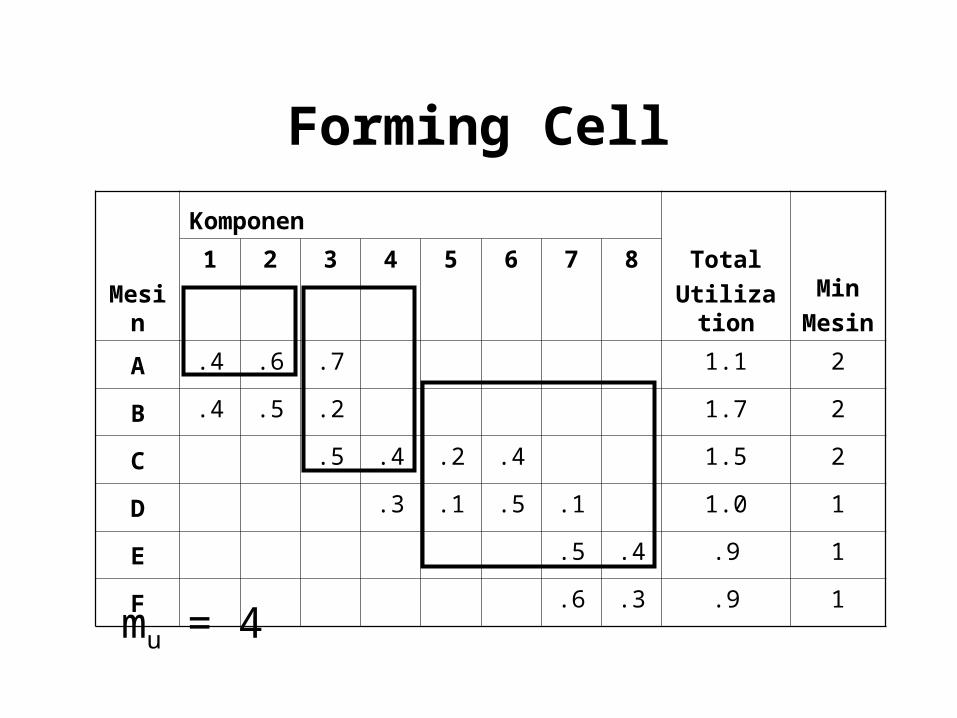
Forming Cell
Mesin
Komponen
Total
Utilization
Min
Mesin
1 2 3 4 5 6 7 8
A .4 .6 .7 1.1 2
B .4 .5 .2 1.7 2
C .5 .4 .2 .4 1.5 2
D .3 .1 .5 .1 1.0 1
E .5 .4 .9 1
F .6 .3 .9 1
mu = 4

Forming Cell
Mesin
Komponen
Total
Utilization
Min
Mesin
1 2 3 4 5 6 7 8
A .4 .6 .7 1.1 2
B .4 .5 .2 1.7 2
C .5 .4 .2 .4 1.5 2
D .3 .1 .5 .1 1.0 1
E .5 .4 .9 1
F .6 .3 .9 1
mu = 4

Forming Cell
Mesin
Komponen
Total
Utilization
Min
Mesin
1 2 3 4 5 6 7 8
A .4 .6 .7 1.1 2
B .4 .5 .2 1.7 2
C .5 .4 .2 .4 1.5 2
D .3 .1 .5 .1 1.0 1
E .5 .4 .9 1
F .6 .3 .9 1
mu = 4

Forming Cell
Mesin
Komponen
Total
Utilization
Min
Mesin
1 2 3 4 5 6 7 8
A .4 .6 .7 1.1 2
B .4 .5 .2 1.7 2
C .5 .4 .2 .4 1.5 2
D .3 .1 .5 .1 1.0 1
E .5 .4 .9 1
F .6 .3 .9 1
mu = 4
Forming Cell
Mesin
Komponen
Total
Utilization
Min
Mesin
1 2 3 4 5 6 7 8
A .4 .6 .7 1.1 2
B .4 .5 .2 1.7 2
C .5 .4 .2 .4 1.5 2
D .3 .1 .5 .1 1.0 1
E .5 .4 .9 1
F .6 .3 .9 1
mu = 4

Evaluation of Groupings
1 2 3 4 5 6 7 8
1 1 1 1 1 1 1
2 1 1 1 1 0
3 1 1 0 1 1
4 1 0 1 1
5 1 1 1 1
6 1 1 1
1 2 3 4 5 6 7 8
1 1 1 1 1 1 1
2 1 1 1 1 0
3 1 1 1 1
4 1 0 1 1
5 1 1 1 1
6 1 1 1
A B
Given a P-M matrix, what makes one partitioning better than another?

Graph Definition
• Consider a graph G = (N, A), where :– The node n N represent machine,– The arc a A represent part flow
between machine , and– The arc cost cij is some measure of
part flow between the machine represented by the node i and the machine represented by node j
• Want to partition the graph into a number subgraphs, where each subgraph identifies a group of machines and the parts assign to those machines
A
B
C F
E
Dcad
cab

Cut Costs• A cut is defined as the set
of arcs connecting nodes in different subgraphs.– if G1={A,B,D} and
G2={C,E,F}, the cut is {(B,E), (B,F)}, and the cut cost is cBE+cBF
• If p is the maximum number of nodes we want in a partition, our problem is to find a partitioning of G such that each partition has a maximum of p nodes and the cut cost is minimized.
A
B
C F
E
Dcad

Initial Graph Partitioning Problem
• Find a minimum cost partitioning of a graph of 2n nodes into two subgraphs of n nodes each.
• Let S be a set of 2n nodes, and let C = [cij] be a symmetric cost matrix where cii = 0.
• Objective: Partition S into subsets A and B such that the external cost, T, is minimized.
AXB
abC T
Sum of all Cij where I A

Initial Graph Partitioning Problem
• If A and B represent an arbitrary partitioning of S, and A* and B* represent an optimal partitioning, then there must be subsets x A and y B such that interchanging x and y produces A* and B*.
• That is, A* = A - x + y, and B* = B - y + x
• Given x and y, what is the cost benefit in swapping them?
x
xy
y
A A*
B*B

Internal and External Costs for a
By
ayC aE
aa I - E aD
Ax
axC aI
External cost asociated with a
Internal cost asociated with a
Saving if a is moved from A to B
a
x y
b
A B

Internal and External Costs for b
ax
bxC bE
bb I - E bD
By
byC bI
External cost asociated b
Internal cost asociated with b
Saving if b is moved from B to A
a
xy
b
A B

Internal and External Costs for b
Savings associated with swapping a and b = Da + Db - 2cabNeed to update the remaining Dx and Dy term after swapping a and b
b - B y ,2C - 2C D
a-A x ,2C - 2C D D
yayby'
xbxax'x
yD
a b
A B