Embed Size (px)
Citation preview

i
PRODUCTION AND EVALUATION OF BAKED AND
EXTRUDED SNACKS FROM BLENDS OF MILLET, PIGEON PEA AND CASSAVA CORTEX FLOUR
BY
OMAH, ESTHER CHINELO
PG/M.SC/08/49945
DEPARTMENT OF FOOD SCIENCE AND TECHNOLOGY
UNIVERSITY OF NIGERIA, NSUKKA
SUPERVISOR: DR. G. I. OKAFOR
SEPTEMBER, 2012

i
TITLE PAGE
PRODUCTION AND EVALUATION OF BAKED AND EXTRUDED SNACKS
FROM BLENDS OF MILLET, PIGEON PEA AND CASSAVA CORTEX
FLOUR
A THESIS SUBMITTED IN PARTIAL FULFILMENT OF THE
REQUIREMENTS FOR THE AWARD OF MASTER OF SCIENCE DEGREE
IN FOOD SCIENCE AND TECHNOLOGY, UNIVERSITY OF NIGERIA,
NSUKKA
BY
OMAH, ESTHER CHINELO
PG/M.SC/08/49945
DEPARTMENT OF FOOD SCIENCE AND TECHNOLOGY
UNIVERSITY OF NIGERIA, NSUKKA
SUPERVISOR: DR. G. I. OKAFOR
SEPTEMBER, 2012

ii
CERTIFICATION
OMAH, ESTHER CHINELO, a postgraduate student in the Department of Food
Science and Technology, Faculty of Agriculture, University of Nigeria, Nsukka has
satisfactorily fulfilled the requirements for the degree of Master of Science (M.Sc) in
Food Science and Technology. The work embodied in this project is original and has
not been submitted in part or full for any other Diploma or Degree of this or other
university.
________________________ _____________________
Supervisor Date
Dr. G. I. Okafor
___________________________ ____________________
Head of Department Date
C. S. Bhandary

iii
DEDICATION
To The Almighty God and to the blessed memory of Prof. (Mrs.) N. J. Enwere in
whose hands this work began.

iv
ACKNOWLEDGEMENTS
I wish to declare that accomplishing this project work has been by the grace and
enablement of the Most High God. All my praise goes to Him. I deeply appreciate my
former supervisor, late Prof. (Mrs.) N. J. Enwere for her tireless supervision even in
the midst of the severe ill health that finally took her life. I am also very grateful to
my supervisor, Dr. G. I. Okafor whose professionalism and experience were
generously available for the completion of this work. Many thanks to my Head of
Department, C.S. Bhandary. I am equally indebted to Prof. T. M. Okonkwo, Dr. P. I.
Akubor, Dr. (Mrs.) I. E. Nwaoha and all the academic staff of the Department of Food
Science and Technology, University of Nigeria, Nsukka; all of whose academic
counseling and tutelage have been invaluable.
I am highly indebted to my husband, Engr. A. D Omah for his moral and financial
assistance. I appreciate heartily the endurance and encouragement of my children,
Destiny, Treasure, Praise and Peace throughout the period of this work. My parents
have given me a lot of moral support and have been a lot of inspiration to me. I am
thankful to my parents-in-law for their moral and financial support. I do also
appreciate two great helps that were God-sent in the course of this work, Ogochukwu
Uzoegbunam and Charity Nnadi. My special appreciation to all my brothers and
sisters who have been great sources of encouragement to me. Many thanks to Mrs.
Ifenyinwa Asogwa for making her time available to me.
May the gracious God shower His blessings on all of you, Amen.
Omah E. C.

v
TABLE OF CONTENTS
Title page - - - - - - - - - - - - - - - - - - - - - i
Certification - - - - - - - - - - - - - - - - - - - - ii
Dedication- - - - - - - - - - - - - - - - - - - - - iii
Acknowledgements- - - - - - - - - - - - - - - - - - - iv
Table of contents- - - - - - - - - - - - - - - - - - - - v
List of Tables- - - - - - - - - - - - - - - - - - - - - x
List of Figures- - - - - - - - - - - - - - - - - - - - xi
List of Plates- - - - - - - - - - - - - - - - - - - - xii
Abstract- - - - - - - - - - - - - - - - - - - - - xiii
Chapter 1: Introduction- - - - - - - - - - - - - - - - - 1
1.1 Background of the study - - - - - 1
1.2 Problem statement - - - - - - - 2
1.3 Justification of study - - - - - - - 2
1.4 Objectives of the study - - - - - - 3
Chapter 2: Literature Review- - - - - - - - - - - - - - - - 4
2.1 Snack foods- - - - - - - - - - - - - - - - - - 4
2.1.1 Types of snack foods - - - - - - - - - - - - - - - 5
2.2 Nutritional concerns - - - - - - - - - - - - - - - 6
2.3 Food waste recovery and utilization - - - - - - - - - - - 6
2.4 Cassava plant and root - - - - - - - - - - - - - - - 7
2.4.1 Chemical composition of cassava - - - - - - - - - - - - 8
2.5 Cassava peels - - - - - - - - - - - - - - - - - 9
2.5.1 Chemical composition of cassava peels - - - - - - - - - - 10
2.6 Toxic and antinutritional factors in food - - - - - - - - - - 10

vi
2.7 Dietary fibre - - - - - - - - - - - - - - - - - 11
2.7.1 Types of dietary fibre - - - - - - - - - - - - - - - - 11
2.7.2 Sources of dietary fibre - - - - - - - - - - - - - - - - 11
2.7.3 Health benefits (physiological effects) of eating fibre - - - - - - - - 12
2.8 Legumes - - - - - - - - - - - - - - - - - - 12
2.8.1 Pigeon pea – Description - - - - - - - - - - - - - - - 13
2.8.2 Chemical composition of pigeon pea - - - - - - - - - - - 14
2.8.3 Pigeon pea utilization - - - - - - - - - - - - - - - - 14
2.8.4 Medicinal uses - - - - - - - - - - - - - - - - - 14
2.9 Cereals - - - - - - - - - - - - - - - - - - - 15
2.10 Millet - - - - - - - - - - - - - - - - - - - - 16
2.10.1 Nutritive value of millet - - - - - - - - - - - - - - - 16
2.11 Extrusion - - - - - - - - - - - - - - - - - 16
2.11.1 Advantages of extrusion cooking - - - - - - - - - - - - 17
2.12 Effects of extrusion on foods - - - - - - - - - - - - - - 18
2.12.1 Sensory characteristics - - - - - - - - - - - - - - - 18
2.12.2 Nutritional value - - - - - - - - - - - - - - - - - 18
Chapter 3: Materials and Methods - - - - - - - - - - - - - 20
3.0 Procurement of raw materials - - - - - - - - - - - - - - 20
3.1 Preparation of samples - - - - - - - - - - - - - - - 20
3.1.1 Preparation of millet flour - - - - - - - - - - - - - - - 20
3.1.2 Preparation of pigeon pea flour - - - - - - - - - - - - - 21
3.1.3 Preparation of cassava cortex flour - - - - - - - - - - - - 21
3.2 Preparation of flour blends - - - - - - - - - - - - - - - - 22
3.3 Development of products - - - - - - - - - - - - - - - 23
vii
3.3.1 Production of cookies - - - - - - - - - - - - - - - - 23
3.3.2 Production of extruded snacks - - - - - - - - - - - - - 24
3.4 Chemical analysis - - - - - - - - - - - - - - - - - 27
3.4.1 Proximate analysis - - - - - - - - - - - - - - - - 27
3.4.1.1 Determination of moisture content - - - - - - - - - - - - 27
3.4.1.2 Determination of crude protein - - - - - - - - - - - - - 27
3.4.1.3 Determination of fat - - - - - - - - - - - - - - - - 28
3.4.1.4 Determination of crude fibre - - - - - - - - - - - - - 28
3.4.1.5 Determination of carbohydrate - - - - - - - - - - - - - 29
3.4.1.6 Determination of ash content - - - - - - - - - - - - - - 29
3.4.2 Determination of calorific content - - - - - - - - - - - - 29
3.4.3 Determination of minerals - - - - - - - - - - - - - - - 30
3.4.3.1 Determination of iron - - - - - - - - - - - - - - - - 30
3.4.3.2 Determination of calcium - - - - - - - - - - - - - - - 30
3.4.3.3 Determination of phosphorus - - - - - - - - - - - - - - 30
3.4.3.4 Determination of potassium - - - - - - - - - - - - - - 31
3.4.4 Determination of vitamins - - - - - - - - - - - - - - - 31
3.4.4.1 Determination of vitamin A - - - - - - - - - - - - - - 31
3.4.4.2 Determination of vitamin E - - - - - - - - - - - - - - 32
3.4.4.3 Determination of thiamine - - - - - - - - - - - - - - 32
3.4.4.4 Determination of riboflavin - - - - - - - - - - - - - - 33
3.4.5 Determination of antinutrients - - - - - - - - - - - - - 34
3.4.5.1 Determination of tannin - - - - - - - - - - - - - - - 34
3.4.5.2 Determination of hemagglutinin - - - - - - - - - - - - - 34
3.4.5.3 Determination of phytate - - - - - - - - - - - - - - - 35
viii
3.4.5.4 Determination of hydrogen cyanide (HCN) - - - - - - - - - 35
3.4.6 Determination of functional properties - - - - - - - - - - - 36
3.4.6.1 Determination of bulk density - - - - - - - - - - - - - - 36
3.4.6.2 Determination of water absorption capacity (WAC) - - - - - - - 36
3.4.6.3 Determination of swelling capacity - - - - - - - - - - - - 37
3.4.6.4 Determination of pH - - - - - - - - - - - - - - - - 37
3.4.7 Microbial analysis - - - - - - - - - - - - - - - - - 37
3.4.7.1 Total viable count - - - - - - - - - - - - - - - - - 37
3.4.7.2 Coliform count - - - - - - - - - - - - - - - - - 37
3.4.7.3 Mould count - - - - - - - - 38
3.5 Sensory evaluation - - - - - - - - - - - - - - - - 38
3.6 Bioassay - - - - - - - - - - - - - - - - - 38
3.6.1 Blood glucose determination - - - - - - - - - - - - - - 39
3.6.2 Serum cholesterol determination - - - - - - - - - - - - - 39
3.6.3 Food, water intake and body weight of the rats - - - - - - - - - 39
3.8 Statistical analysis - - - - - - - - - - - - - - - - 39
Chapter 4: Results and Discussions - - - - - - - - - - - - 40
4.1 Effect of processing on proximate composition of unblended
flour from millet, pigeon pea and cassava cortex. - - - - - - 40
4.2 Effect of processing on selected functional properties and pH
of flour for production of cookies and extruded snacks - - - - - - - 41
4.3 Effect of processing on the micronutrient and antinutrient
composition of millet, pigeon pea and cassava cortex flour. - - - - 43
4.4 Sensory Characteristics of cookies from wheat flour and
millet –pigeon pea flour blends - - - - - 45
4.5 Effect of cassava cortex flour incorporation on the sensory
properties of cookies produced from wheat and millet-pigeon
pea composite flour - - - - - - - 45

ix
4.6 Sensory characteristics of extruded snacks made from wheat,
cassava cortex and millet-pigeon pea flour blends - - - - 47
4.7 Effect of cassava cortex flour incorporation and baking on the
chemical composition and caloric values of cookies made from wheat
and millet-pigeon pea flour blends. - - - 48
4.8 Effect of cassava cortex flour incorporation and extrusion cooking
on the chemical composition and caloric values of extruded snacks
from wheat and millet-pigeon pea flour blends - - - 51
4.9 Effect of cassava cortex flour inclusion, extrusion cooking and baking
on some mineral contents of cookies and extruded snacks made from
wheat and millet-pigeon pea flour blends - - - - 53
4.10 Effect of cassava cortex flour inclusion, extrusion cooking and baking
on some vitamin contents of cookies and extruded snacks made from
wheat and millet-pigeon pea flour blends - - - - 55
4.11 Effects of baking and extrusion cooking on the antinutrient
composition of cookies and extruded snacks formulated from
wheat, cassava cortex and millet-pigeon pea flour blends - - - - - 56
4.12 Microbial counts of cookies and extruded snacks made from
wheat, cassava cortex and millet-pigeon pea flour blends - - - - 57
4.13 Effects of cookies on the biochemical indices of rats - - - - - 58
Chapter 5: Conclusions and Recommendations - - - - - - - - - 64
References - - - - - - - - - - - - - - - - - - - - - - 65
x
LIST OF TABLES
1 Composite flour blends prepared from wheat and millet-pigeon pea flour- - 22
2 Composite flour blends prepared from wheat, millet-pigeon pea and
cassava cortex flour- - - - - - - - - - - - - - - - - 23
3 Proximate composition of unblended flour from millet, pigeon pea and
cassava cortex- - - - - - - - - - - - - - - - - - 40
4 Selected functional properties and pH of flour for production of cookies
and extruded snacks- - - - - - - - - - - 42
5 Micronutrient and antinutrient composition of flour from millet, pigeon
pea and cassava cortex- - - - - - - - - - - - - - - 43
6 Sensory scores of cookies made from wheat, cassava cortex and
millet-pigeon pea flour blends - - - - - - - - - - - - - - 45
7 Sensory scores of extruded snacks made from cassava cortex, wheat and
millet-pigeon pea flour blends - - - - - - - - - - - - 45
8 Sensory scores of extruded snacks made from cassava cortex,
wheat and millet-pigeon pea flour blends - - - - - - - - 47
9 Proximate composition of cookies made from wheat, cassava
cortex and millet-pigeon pea flour blends- - - - - - - - 48
10 Proximate composition of extruded snacks from wheat, cassava
cortex and millet-pigeon pea flour blends- - - - - - - - - 51
11 Mineral composition of cookies and extruded snacks from their
composite blends- - - - - - - - - - - - - -- 53
12 Vitamin composition of cookies and extruded snacks from their
composite blends- - - - - - - - 55
13 Antinutrients composition of cookies and extruded snacks
formulated from wheat, cassava cortex and millet-pigeon pea flour blends- 56
14 Microbial counts of cookies and extruded snacks made
from cassava cortex, wheat and millet-pigeon pea flour blends- - - - - 58
15 Effects of consumption of cookies on lipid profile of wister rats- - - - - 59
xi
LIST OF FIGURES
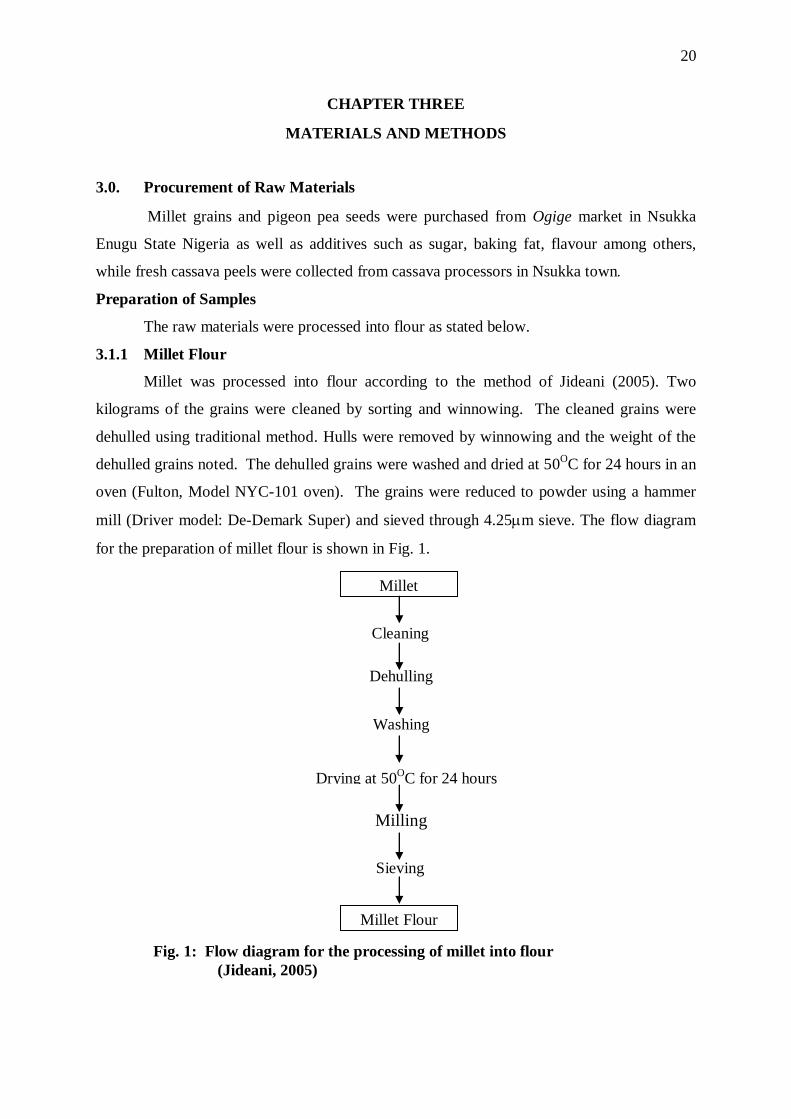
1. Flow diagram for processing of millet into flour- - - - - - - - - 20
2. Flow diagram for processing of pigeon pea into flour- - - - - - 21
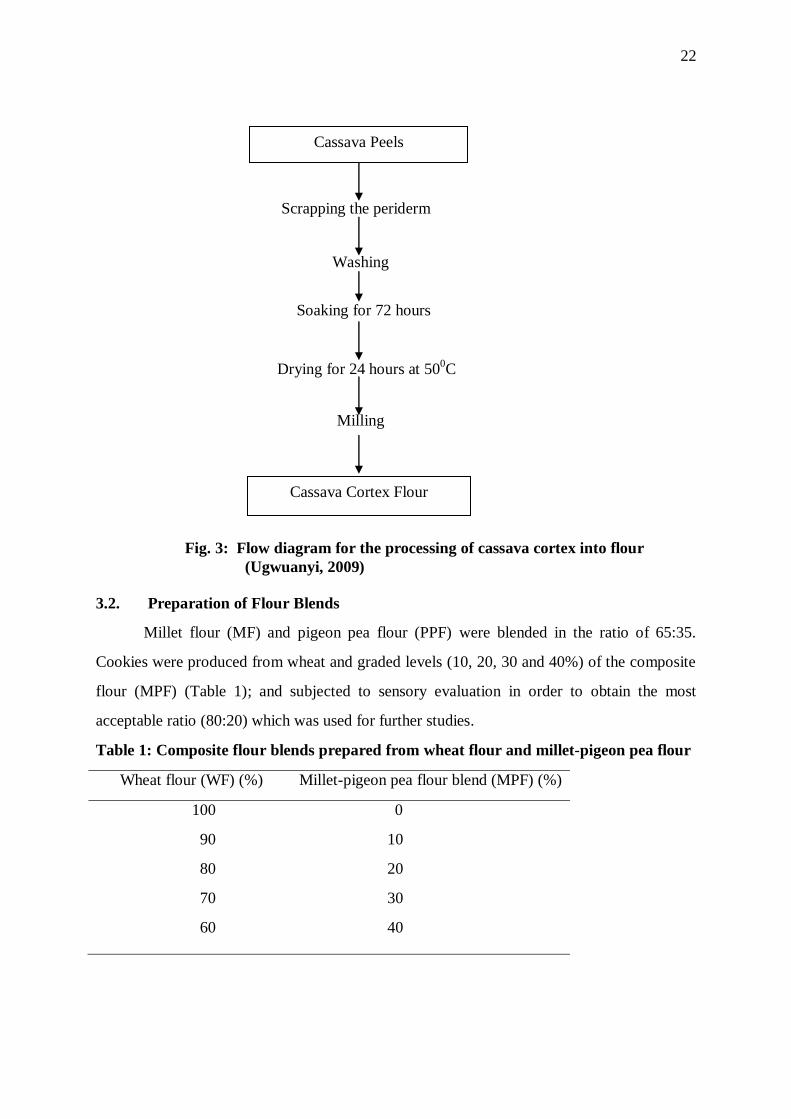
3. Flow diagram for processing of cassava cortex into flour- - - - - 22
4. Flow diagram for production of cookies- - - - - - - - - - 24
5. Flow diagram for production of extruded snacks- - - - - - - 25
6. pH values of cookies- - - - - - - - - - - - - - - - - - - - - 50
7. Energy values of cookies - - - - - - - - - - - - - - - - 50
8. pH of extruded snacks- - - - - - - - - - - - - - - - 52
9. Energy values of extruded snacks - - - - - - - - - - - - - - 53
10. Weekly changes in blood glucose level of rats fed cookies samples- - - 61
11. Weekly changes in feed intake of rats fed cookies samples- - - - - - - 62
12. Weekly changes in water intake of rats fed cookies samples- - - - - - - 62
13. Total weight gain of rats fed cookies samples- - - - - - - - - - - 63

xii
LIST OF PLATES
1: Control samples of cookies and extruded snacks - - - - - 25
2: Cookies samples with 5%, 10%, 15%
and 20% cassava cortex flour incorporation - - - - - - 26
3: Extruded Snacks samples with 5%, 10%,
15% and 20% cassava cortex flour incorporation - - - - 26

xiii
ABSTRACT
Millet flour (MF) and pigeon pea flour (PPF) were produced and blended in the
ratio of 65:35 to obtain millet-pigeon pea flour blend (MPF). Wheat flour (WF) and MPF
were used in ratios of 100: 0, 90:10, 80:20, 70: 30 and 60: 40 to produce cookies which
were subjected to sensory evaluation, to isolate the best ratio (80:20). Cassava cortex
flour (CCF) was produced and substituted wheat flour at different levels in the 80:20
(WF: MPF) blend to give various ratios of WF: MPF: CCF as 100:0:0, 80:20: 0, 75:20: 5,
70:20:10, 65:20:15, 60:20:20. These composite flour blends were used with baking
ingredients to produce cookies and extruded snacks. Millet, pigeon pea and cassava
cortex flour were analyzed for their proximate, minerals, vitamins and antinutrient
contents. The MF, PPF, CCF, MPF and WF were also analyzed for their functional
properties. The effects of cassava cortex incorporation, baking and extrusion cooking on
the nutritional, antinutritional, microbial and sensory properties of the baked and extruded
products were determined. The cookies were fed to albino rats to determine their effect on
the biochemical parameters of the animals. Results obtained indicated that the chemical
composition of the processed flour ranged from 7.35 to 9.50% moisture, 3.94 to 16.64%
protein, 1.00 to 3.00% fat, 1.25 to 3.55% ash, 0.80 to 12.07% crude fibre, 67.86 to
77.39% carbohydrate, 83.6 to 326.8mg/100g phosphorous, 1.04 to 3.40mg/100g iron,
60.0 to 620.0mg/100g calcium, 34.06 to 232.76mg/100g potassium, 83.33 to 1666.67
(IU) Vitamin A, 1.0 to 2.0mg100g Vitamin B1, 0.00 to 0.08 vitamin B2 and 0.8 to
14.2mg/100g vitamin E. Residual anitnutrients in the flour ranged from 0.11 to 0.44%
tannin, 1.0 to 1.3% phytate, 0.04 to 0.45Hu/gm hemagglutinin and 0.45 to 1.90%
hydrogen cycanide. The functional properties of the flour showed some significant
differences (p<0.05) when compared with wheat flour. Cassava cortex flour incorporation
significantly (p<0.05) improved the ash, crude fibre and vitamin B2 contents of the
cookies and extruded snacks. The protein values were reduced from 7.44% to 6.25% as
CCF incorporation increased in the baked products; while the protein values improved to
12.26% at 5% level of CCF incorporation in the extruded products. Baking and extrusion
further reduced the antinutrients in the formulated products to the following ranges 0.09
to 0.33% tannin, 0.63 to 1.13% phyate, 0.00 to 0.45 Hu/mg hemagglutinin and 0.20 to
0.73% hydrogen cyanide. The bacteria and mould count ranged from 0.2 x 10 to 0.8 x
102cfu/g, while there was no coliform growth in any of the samples. All the developed
products (cookies and extruded snacks) were acceptable to the panelists; however, the
products produced from 70:20:10 ratio of wheat flour, millet-pigeon pea composite flour
and cassava cortex flour blend were the most acceptable.

1
CHAPTER ONE
INTRODUCTION
1.1 Background of the Study
Snack foods, commonly referred to as snacks, are convenience foods which can be
eaten in-between meals. An increasing proportion of the household food budget in Nigeria is
spent on snack food items, in which convenience and quality are perceived as most important
(Lasekan and Akintola, 2002). The snack food industry is continually growing with new
products becoming available every year.
Most snacks are cereal-based, and are poor sources of protein (Brink and Belay,
2006). In developing countries, snacks are sometimes relied upon to meet the physiological
needs of the populace particularly children. Children are growing and developing rapidly,
and as such, have increased need for energy as well as other essential nutrients (Thakur and
Saxena, 2000). They need to eat more frequently to meet this need. Snacks help to bridge
the gap between meals. Healthy snacks can help to ensure that children are getting the
nutrients they need to fuel their growth and development (Thakur and Saxena, 2000).
Snacks such as biscuits, doughnuts, potato chips among others which are
carbohydrate based will invariably have low nutritional value including protein content
(Lasekan and Akintola, 2002). Proteins are essential component of the diet needed for
survival of animals and humans. One of their basic functions in nutrition is to supply
adequate amount of needed amino acids (Lasekan and Akintola, 2002). The availability of
amino acids varies with protein source, processing treatment and interaction with other
components of the diet (Friedman, 1996).
Snacks can be made with a combination of different raw materials containing
different properties. It is possible to improve the nutritional quality of cereal proteins by
combination with animal sources or with cheaper and more available plant protein sources,
such as legumes (Akpapunam and Darbe, 1994). Pigeon pea (Cajanus cajan), a leguminous
plant is considered one of the industrially under-utilized crop that has great potentials for
becoming an industrial food raw material. It contains high levels of protein and important
amino acids, such as methionine, lysine and tryptophan. Its combination with cereals makes
a well-balanced human food (Duke, 1981).
2
Healthy snacks should add other nutrients such as fibre to diet, without unwanted
calories. The health advantages of a diet containing sufficient dietary fibre are becoming
more apparent. At the same time, the health risks of fibre deficient diets are becoming
noticeable. Higher fibre diets appear to be associated with fewer digestive complaints, better
blood-sugar control, lower blood-cholesterol levels and reduced rates of colon cancer, heart
and kidney diseases (Brooks, 2011). The recognition of snacks as healthful will increase as
industry changes products from merely good taste to nutritious (Hui, 2006).
Snacks can be processed by different methods and techniques such as toasting,
flaking, roasting, and baking amongst others. Presently, traditional snack items are being
replaced by fabricated alternatives usually produced using extrusion technology (Pyke, 1982).
Extrusion is a process which combines several unit operations including mixing, cooking,
kneading, shearing, shaping and forming. Extrusion cooking, a process whereby food is
heated above 100OC for a wide variety of low density expanded snack foods, is a high-
temperature short-time (HTST) process which reduces microbial contamination, inactivates
enzymes and retains many heat sensitive components. Extrusion processing is widely used to
restructure starch – and protein – based materials to manufacture a variety of textured
convenience foods (Harper, 1986).
1.2 Problem Statement
The high rate of snack consumption in developing countries and the world over is a
major concern that draws attention to the nutritional quality of snacks, which may not meet
the demand for nutrient balance. The problem of Protein – Energy malnutrition can be solved
if food materials which are high in protein are incorporated into snack foods which are
usually carbohydrate-based. In addition, many common snack foods do not contain adequate
amounts of fibre. Addition of fibre based waste from raw materials to snack foods could beef
up the fibre content. The effective use of these wastes can help to reduce some of the
challenges associated with handling and disposal of food wastes.
1.3 Justification of Study
Large amounts of side products of the food industry evolve during production,
preparation and consumption of foods. Because of this, it is necessary to collect and use
these wastes for the production of new foods, which is important from the point of view of
environmental pollution and a country‟s economy (Yagci et al., 2009). The principle of

3
waste prevention is universally accepted, but the practice has lagged far behind. According
to Evirowise (1997), food industry will have to concentrate on waste avoidance as well as
utilization of process waste.
Environmental legislation has significantly contributed to the introduction of
sustainable waste management practices throughout the European Union. By the year 2010,
organic waste disposal had to be reduced by 80% (European Council, 1999). Considering the
challenges in the area of food industry, efforts are to be made to optimize processing
technologies to minimize the amount of waste.
During the preparation of cassava tubers for human consumption, a considerable
amount of peels are discarded as waste. With hand peeling of cassava tubers, the peels can
constitute 20 – 35% of the total weight of the tubers (Ekundayo, 1980). The wastes generated
at present pose a disposal problem and would even be more problematic in the future with
increased industrial production of cassava products such as cassava flour, “garri” and dried
cassava fufu. Since these peels could make up to 10% of the wet weight of the roots, they
constitute an important potential resource if properly harnessed (Obadina et al., 2005).
Little research effort had been directed to the possibility of using these wastes as food
for humans in the tropics. It was hoped that at the end of this research, a balanced, nutritious
snack food would be formulated with cassava peels.
1.4 Objective of the Study
The broad objective of this research was to determine the effect of baking and extrusion
cooking on the quality and sensory properties of snack foods from recovered food waste
(cassava cortex), legume (pigeon pea), and cereal (millet).
The specific objectives were to:
1. Produce flour from cassava cortex, millet and pigeon pea; and evaluate their
chemical and functional properties.
2. Use the produced flour for the production of baked and extruded snacks.
3. Determine the effect of baking and extrusion cooking on the chemical,
microbial, antinutritional and sensory properties of the developed snacks.
4. Determine the effects of the products on some biochemical indices using rat
bioassay.
4
CHAPTER TWO
LITERATURE REVIEW
2.1. Snack Foods
A snack is a portion of food oftentimes smaller than that of a regular meal, which is
generally eaten between meals. Snack foods are sometimes referred to as convenience foods
which can be eaten in-between meals. They are convenient because they are quick and easy-
to-eat (Okaka, 1997). Convenience foods can be regarded as foods which have been fully or
partially prepared in which significant preparatory input, culinary skills and energy have been
transferred from the home-maker‟s kitchen to the food processor‟s factory. Such foods may
need to be reconstituted, pre-heated in a vessel or allowed to thaw if frozen before
consumption or they may be eaten directly without further treatment. Snacks have thus come
to be regarded as the ultimate in convenience foods which is available, ready-to-be consumed
on impulse wherever that impulse strikes (Okaka, 1997).
According to Wikipedia, the Free-Encyclopedia (2009) a snack food is seen in
western culture as a type of food not meant to be eaten as a main meal of the day- breakfast,
lunch or dinner, but one rather intended to assuage a person‟s hunger between these meals,
providing a brief supply of energy for the body. The term may also refer to food item
consumed between meals purely for the enjoyment of its taste.
Traditionally, snacks were prepared from ingredients commonly available in the
home, often leftovers, sandwiches made available from cold cuts, fruits, and the like. With
the multiplication of convenience stores, packaged snack foods are now a significant
business. Snack foods are typically designed to be portable, quick and satisfying. Processed
snack foods should be less perishable, more durable, and/or more appealing than prepared
foods. They often contain substantial amount of sweeteners, preservatives and appealing
ingredients such as chocolates, peanuts and flavours. Stable snacks seen as ready-to-eat
savoury products are capable of being held at ambient temperature for a reasonable length of
time, from 6-12weeks (Okaka, 1997).
The snack food industry in market-driven societies such as the United States
generates billions of dollars in revenue each year. Snack food industry is emerging in Nigeria
and other developing countries. The market for processed snack foods is enormous, and a
number of large corporations compete rigorously to capture larger shares of the snack food
5
market (Onuh, 2007). Snack foods which are a significant part of the food industry include
candies, cookie-crackers, snack cakes, pies, potato chips, corn/tortilla chips, nut- based snack,
popcorn, beverages, milk and dairy products, dried fruits, extruded snacks, meat snack among
others (Hui, 1999).
2.1.1 Types of Snack Foods
Snack foods include everything from chips to confection, from salty to sweet (Anon,
2003). From the simplest of snack like potato chips and pop corn, through the more
complicated extruded snack, they can generally be classified into three generations of
development.
First Generation Snacks
The first generation snacks are made from a single wide ingredient. Such snacks
include potato chips, popcorn and nuts among others (Bernacchi et al., 1993). They are not
produced by extrusion.
Second Generation Snacks
These generations of snacks are created as a result of technological developments.
They differ from the first generation snacks in that they are made from one or more base
ingredients not in their whole (Banasik and Dick, 1982). Second generation snack foods may
be expanded or unexpanded. In some cases, a frying and/or a baking step are used to give the
product its final textural qualities. Examples of second generation snack include corn curds
(expanded), tortilla chips (unexpanded) (Onuh, 2007). Extrusion equipment can be used to
produce a second generation snack in the form of an expanded material. In this extrusion
process, the products are expanded, shaped and sized at the extrusion die. No further
expansion is required (Bernacchi et al., 1993).
Third Generation Snacks
According to Bernacchi et al. (1993), combining cereal products and starches into
mixtures which are subjected to successive processing stages give rise to third generation
snacks. Huber (2001) refers to this type of snacks as multidimensional.
Third generation snacks are also referred to as “half products” or pellets snack food. They are
extrusion cooked, and formed at low pressure to prevent expansion and then dried to a final
moisture content of about 10% to form a glassy pellet. Huber (2001) stated that extrusion

6
systems for the production of multidimensional third generation snacks are efficient,
economical to run and result in a product with built-in marketing flexibility due to long shelf-
life and high bulk density prior to frying or puffing. In developing third generation snacks,
“half” of the process is completed to prepare “pellets” which are shelf stable for periods of up
to a year without refrigeration provided they are properly packaged to retain their moisture
(Hui, 2006).
Many types of proteins may be added to third generation snack type recipes such as
meats (whole fresh shrimp, fresh chicken, beef among others), dairy products (cheese,
yoghurt, milk solids) and legume proteins (soy, pea, bean). Up to 30-35% levels may be
added and still maintain high quality final products (Sunderland, 1996).
Several minor ingredients have very useful effects on the texture, quality and flavour
of the final products. Salt is very useful in assisting with uniform moisture migration
throughout the third generation pellet drying, during the moisture equilibration period.
Baking soda will give special flavour and textural attributes to the finished products after
frying, puffing or microwaving. Oils or emulsifiers reduce stickiness during cutting and other
processing steps (Hui, 2006).
2.2. Nutritional Concern
Snack foods are often subjectively classified as junk food. They are said to have little
or no nutritional value, and are not seen as contributing towards general health and nutrition.
With growing concerns for diet, weight control and general health, government bodies like
Health Canada are recommending that people make conscious effort to eat more healthy
natural snacks while avoiding high-calorie, low-nutrient, junk food (Wikipedia, 2009). This
can be achieved by fortification with alternative ingredients such as vitamins, minerals,
proteins and dietary fibre.
2.3. Food Waste Recovery and Utilization
Solid waste is defined as the organic and inorganic waste materials produced by
different sources and have lost value in the eye of their owner. Management of solid waste
has become one of the biggest problems in recent times. The rapid increase in the volume of
waste is one aspect of the environmental crisis, accompanying recent global development
(Asha et al., 2008).

7
Food waste management, recovery and utilization is the series of activities where
discarded food materials are collected, sorted, processed and converted into other materials
and used in the production of new products (Anon, 2006). Reducing food waste in general
can have a number of environmental, social and economic benefits including: reducing
pollution, reducing trash collection and disposal fees for individuals and businesses; ensuring
that edible food is redistributed to those who require emergency food provision.
The California Integrated Waste Management Board emphasizes the fact that, “there
is no single strategy for diverting food discards to beneficial uses”. Food wastes can be
converted into animal feed, rendered into soap or other edible products such as edible fibre,
sugars, colouring materials, flavouring agents among others.
Strict environmental regulations and high waste discharge costs have forced food
processors to find ways to better treat and utilize processing wastes. Environmentally sound
processes which minimize the waste disposal problem as they produce marketable value-
added products are developed (Anon, 2006). Food stuff such as cassava generates waste
during processing.
2.4. Cassava Plant and Root
Cassava is a woody shrub, which belongs to the genus Manihot of the family of
euphorbiacae (Oyenuga, 1968). Cassava (Manihot esculenta crantz) root is long and tapered
with a firm homogenous flesh encased in a detachable rind, about 1mm thick, rough and
brown on the outside. Commercial varieties can be 5-10cm in diameter at the top, and 50-
80cm long. The flesh can be chalk white or yellowish. The cassava plant gives the highest
yield of food energy per cultivated area per day among crop plants except possibly for
sugarcane. It is the most important crop in Nigeria and many tropical countries (Odunfa,
1985). Cassava roots play an important role in the African diet and they are processed using
simple traditional methods into products such as garri, fufu, chips, tapioca (abacha), lafun,
flour, among others. Some of these products are fermented (Odunfa, 1985). About 10 million
tones of cassava are processed annually for garri production in Nigeria (Okafor, 1992).
Cassava is widely recognized as a cheap source of food energy on the basis of some
agronomic and economic advantages which the crop enjoys over other crops. These include
high dry matter and energy yields/hectare, low production cost and relatively low
susceptibility to insect and pest attacks (Oyenuga, 1968).
8
2.4.1 Chemical Composition of Cassava
Cassava roots are very rich in starch and contain significant amounts of calcium
(50mg/100g), phosphorus (40mg/100g) and vitamin C (25mg/100g). However, they are poor
in protein and other nutrients. In contrast, cassava leaves are a good source of protein if
supplemented with the amino acid methionine despite containing cyanide (Olsen and Schaal,
1999). The leaves cannot be eaten raw since they contain free and bound cyanogenic
glucosides. These are converted to cyanide in the presence of linamarase, a naturally
occurring enzyme in cassava.
Cassava varieties are often categorized as either “sweet” or “bitter” signifying the
absence or presence of toxic levels of cyanogenic glucosides. The so called “sweet” (actually
“not bitter”) cultivars can produce as little as 20 mg of cyanide (CN) per kilogram of fresh
roots while “bitter” ones may produce more than 50 times as much. Cassava grown during
drought is especially high in these toxins (Aregheore and Agunbiade, 1991; White et al.,
1998). One dose of pure cassava cyanogenic glucoside (40mg) is sufficient to kill a cow.
Societies which traditionally eat cassava generally understand that soaking and/or cooking
and other processing techniques are necessary to avoid getting sick.
However, problems do occur. Konzo (also called mantakassa is a paralytic
neurological disease associated with several weeks of almost exclusive consumption of
insufficiently processed bitter cassava. An Australian plant chemist, Dr. Jasson Ospina, has
developed a simple method to reduce the cyanide content of cassava flour. The method
involves mixing the flour with water into a thick paste and then letting it stand in the shade
for 5 hours in thin layer spread over a basket, allowing an enzyme in the flour to break down
the cyanide compound. The cyanide compound produces hydrogen cyanide gas, which
escapes into the atmosphere, reducing the amount of poison by up to 1/5 - 1/6th and making
the flour safe for consumption the same evening. This method is currently being promoted in
rural African communities that are dependent on cassava (Howard, 2006).
For some smaller rooted “Sweet” varieties, cooking is sufficient to eliminate all
toxicity. The larger-rooted “bitter” varieties used for production of flour or starch must be
processed to remove the cyanogenic glucosides. The large roots are peeled and then ground
into paste which is then soaked in water, squeezed dry several times and toasted. The starch
grains that float to the surface during the soaking process are also used in cooking (Padmaja,

9
1995). The traditional method used in West Africa is to peel the roots and put them into water
for some days to ferment. The roots are then dried or cooked. In Nigeria and several other
West African countries, including Ghana, Benin, Togo, Ivory Coast and Burkina Faso, they
are usually grated, fermented, dewatered and garified to preserve them. The result is a food
stuff called garri. Fermentation is also used in other places such as Indonesia. The
fermentation process also reduces the level of toxicants, making the cassava a more nutritious
food (Obah and Oladunmoye, 2007).
2.5 Cassava Peels
In the processing of cassava to fermented products, the roots are normally peeled to
remove two outer covering: a thin brown outer covering, and a thicker leathery
parenchymatous inner covering. These peels are regarded as wastes and are usually discarded
and allowed to rot (Ekundayo, 1980). Cassava peels and the sieviate (chaff that results from
processing the root into fufu), which are by-products of harvesting and processing, constitute
25% of the whole plant. In harnessing these products as poultry feed ingredients, it has been
discovered that they are high in fibre (Aderemi et al., 2004).
Over the years, there have been research studies on the utilization of cassava peels in
animal production. Walker (1951) fed cassava peels to sheep and goats in equatorial West
Africa. Krauss (1921) concluded that the feeding value of cassava peel was equal to that of
maize. Some works have also been reported on the value of cassava peels as a dietary source
for non-ruminant stock. Sonaiya and Omole (1977) fed cassava peel to finishing pigs and
Adeyanju and Pido (1978) fed the fermented cassava peel to broiler chicks. These researches
recorded significant economic benefits in reduced feed cost and increased revenue derived
from increased levels of fermented cassava peel in the diets. They could not however, feed
the peel beyond 20% level.
According to Tewe and Iyayi (1995), cassava peel has been used to replace maize as
an energy source in the diets of growing pigs; 154 weaning crossbred pigs (Landrace X large
white) were provided with either cassava- based or maize-based diets. A 40 percent level of
cassava peel in place of maize was adequate for growing pigs. Performance in terms of feed
intake and growth rate was enhanced when the diets were supplemented with plant and
animal protein sources. A dietary protein level of at least 15% was necessary for satisfactory
animal performance.

10
2.5.1 Chemical Composition of Cassava Peels
According to Obadina et al. (2005), cassava peel wastes were reported to contain
42.6% carbohydrate, 1.6% protein, 12.1% ether extract, 5.0% total ash and 22.5% crude fibre.
Cassava peel meal could serve as a cheap source of energy for farm animals but should be
fortified with additional protein source because of its low protein level (Obioha and Anikwe,
1982).
2.6 Toxic and Antinutritional Factors in Food
Cyanogenic Glucoside
Cassava peels contain toxic levels of cyanogenic glucosides (Tweyongyere and
Kantongole, 2002). Cassava peels usually have higher concentration of cyanogenic glucoside
than the parenchyma (pulp). This makes the peel unsuitable for animal and human
consumption (Oboh and Akindehunsi, 2003). However, they contain more linamarase than
the pulp. This enzyme hydrolyses the glucosides when the peel is grated or milled thereby
liberating gaseous hydrogen cyanide (HNC) which dissipates into air (Bokanga, 1990).
The widespread occurrence of cyanide in the Manihot species has been largely
documented. The role of cyanide in the etiology of diseases such as goiter, cretinism, tropical
amblyopic, ataxic neuropathy, and pancreatic diabetes has been demonstrated from clinical
and epidemiological studies. In the manifestation of some of these diseases, cyanide may act
directly or through its product thiocyanate. Most often, the ingestion of cyanide either from a
dietary source of cassava or other roots or vegetables containing cyanogenic glucosides
require its detoxification in the body to thiocynate.
The use of sulphur amino acids for the detoxification process often results in a
shortage of these amino acids. Therefore, the introduction of cyanide in situations of low or
marginal protein levels in the diets of animals can further aggravate an already critical protein
situation. Since cassava and use of its peel are now being considered extensively in animal
production programs, as well as for human consumption, it is important to elucidate the effect
of low protein intake on metabolic processes (Tewe and Iyayi, 1995).
Phytate
Phytic acid, a hexaphosphate derivative of inositol is an important storage form of
phosphorus in plant. It forms complexes with mineral elements such as calcium, iron and zinc

11
and hinders their absorption and bioavailability (Anderson and Wolf, 1995). Bishnis and
Yadav (1994) reported that soaking and cooking can reduce phytic acid.
Hemagglutinins
Hemagglutinins, also called lectins, are all proteins. Sometimes they may bear
covalently bound sugars and thus can be classified as glycoproteins (Liener, 1980). They are
found majorly in legumes; however their occurrence is not limited to legumes. They occur
also in slime moulds, lichens, other flowering plants and animals such as snails, fish eggs and
mammalian tissues (Enwere, 1998). Hemagglutinins in raw legumes are significant because
they are found in a higher concentration than in other sources. Crude raw extract of
hemagglutinin agglutinates the red blood cells of human beings and other animals if injected
directly into the blood stream. Thus it impairs the utilization of legumes such as beans,
groundnuts, cowpeas, black beans, pigeon peas among others, especially when they are not
properly processed for human or animal consumption. Detoxification of hemagglutinins is
usually achieved by the traditional methods of household cooking and industrial autoclaving
or retorting (Enwere, 1998).
2.7. Dietary Fibre
Dietary fibres are the indigestible portion of plant foods that move food through the
digestive system, absorbing water and easing defecation. Dietary fibre consists of non-starch
polysaccharides such as cellulose and many other plant components such as dextrins, inulin,
lignin, waxes, chitins, pectin, beta-glucans and oligosaccharides (IOM, 2001).
Dietary fibre has been used as a collective term for a complex mixture of substances with
different chemical and physical properties which exert different types of physiological effects
(Stacewicz-Sapuntzakis et al., 2001).
2.7.1 Types of Dietary Fibre
Fibre can be classified into two broad categories. Those that do not dissolve in water
(insoluble fibre) and those that dissolve in water (soluble fibre). Both types of fibre are
present in all plant foods with varying degrees of each according to a plant‟s characteristics
(Mayo, 2007).
2.7.2 Sources of Dietary Fibre
Insoluble fibre is mostly found in wheat bran, whole grain cereals, roots and tuber,
skins of vegetables such as nopal, green beans, potato skins, tomato peel and fruits.

12
Meanwhile, good sources of soluble fibre are legumes (lentils, chickpeas and beans), oat
bran and some fruits and vegetable such as apples, oranges and carrots (DRI, 2001).
Basically all kinds of plant oriented foods act as good sources of both types of dietary fibre.
2.7.3 Health Benefits (Physiological Effects) of Eating Fibre.
Both insoluble and soluble dietary fibre can promote a number of positive
physiological effects. Insoluble fibre possesses passive water-attracting properties that help to
increase bulk, soften stool and shorten transit time through the intestinal tract. This protects
against digestive complaints like constipation, irritable bowel syndrome (IBS), diverticulitis
(where the bowel wall becomes inflamed and ultimately damaged) and may also help lower
the risk for certain cancers such as colon cancer. Soluble fibre aids in lowering blood
cholesterol level. It slows down the process of absorption of glucose, thereby helping in
keeping the blood glucose level in control. It may also reduce the risk of developing type 2
diabetes (Anderson et al., 2009).
Other health benefits of diets naturally high in fibre are reduction of hyperlipidemia,
hypertension and other coronary heart diseases, reduction in the risk of developing some
cancers, increased satiety and hence some degree of weight management (Mickelson et al.,
1979). A high fibre diet usually has fewer calories for the same volume of food. The health
benefits of dietary fibre are definitely enough to consciously add more to one‟s daily diet.
2.8 Legumes
The legumes refer to the edible seeds of leguminous plants belonging to the family
leguminosaea. Edible legumes are either pulses (dried seeds of cultivated legumes such as
peas beans and lentils), oil bearing seeds (legume which when extracted for their oil leave
behind protein rich cakes e.g. groundnut and soybean) or fodder/ forage legume which
include such crops as alfalfa (legumes used principally as fodder or green manure cover
crops) (Okaka, 1997). Legumes rank second to the grasses as food for man but perhaps also
serve man in a greater variety of other ways than do the grasses (Enwere, 1998).
Generally, legumes contain 17-25% protein (about double that in most cereals) except
soybeans which contain about 40% protein and 40-70% carbohydrates. Legume seeds are
also good sources of minerals such as phosphorus and iron (Bressani and Elias, 1974; Siegel
and Fawcett, 1976; Ningsanond and Ooraikul, 1989). Except for soybeans and groundnuts,

13
which contain 18% and 48% oil, respectively (Muller and Tobin, 1980), legume seeds are
generally low in fats and oils.
Despite this high nutrient content of legume seeds, their utilization is impaired by
some inherent constraints such as the presence of several antinutrients and toxic components,
the types and concentration of these antinutrients vary in different legumes (Liener, 1980).
The seed proteins are also low in quality due to the deficiency of sulphur containing amino
acids such as methionine and cystine. Many of the seeds of legumes are hard to –cook,
requiring a large input of energy during the preparation of the seeds into food. However, with
adequate processing, legumes are safe and nutritious (Enwere, 1998).
Legume seeds used as food for man include cowpeas, peas, broad beans, chickpeas,
garbanzo beans, common beans, navy beans, kidney beans, lima beans or butter beans,
soybean, bambara groundnuts, African yam bean, groundnuts, pigeon pea, among others
(Enwere, 1998).
2.8.1 Pigeon Pea
Description of Pigeon Pea
The pigeon pea (Cajanus cajan) belong to the legumnioseae family of flowering
plants. It is an erect woody short perennial shrub which grows in semi-arid and sub-humid
tropics. It is grown in Africa, including Nigeria, India, the Caribbean, and South America
(Onyebuashi, 1986). In Nigeria, it is grown extensively in Enugu, Anambra and Benue
states. It is called agbugbu in Enugu State, fio-fio in Anambra State, and waken Kurawa or
otile in some northern states. Pigeon pea is remarkably drought resistant tolerating dry areas
with less than 65cm annual rainfall, even producing seed profusely under dry zone
conditions, as the crop matures early and the incidence of pest damage is low (Duke, 1981).
The pigeon pea seeds are contained in pods which are flattened and about 4-10cm in
length and about 0.6-1.5cm width. The colour of the pod is green, purple or maroon. Each
pod contains about two to eight seeds. The seeds from different varieties or cultivars vary in
shape, size and colour of testa. They may be spherical, oval or kidney shaped. The colour of
the testa of the mature dry seed may be dirty white, cream brown, dirty grayish white, pink,
purplish-black or mottled. The helium is small and usually white, sometimes with two
prominent ridges (Enwere 1998).

14
2.8.2 Chemical Composition of Pigeon Pea
Analysis of dhal (without husk) gave the following values: moisture, 15.2%; protein,
22.3g; fat (ether extract) 1.7g; mineral matter, 3. 6mg; carbohydrates, 57.2g; calcium 9.1mg;
and phosphorus, 0.26%; carotene evaluated as vitamin A, 220IU and vitamin B1 150IU per
100g. Sun dried seeds of Cajanus cajan are reported to contain per (100g), 345 calories, 9.9%
moisture, 19.5g protein, 1.3g fat, 65.5g carbohydrate, 1.3g fibre, 3.8g ash, 161mg calcium,
285mg phosphorus, 15.0 mg iron, 55ug B- carotene equivalent, 0.72mg thiamine, 0.14mg
riboflavin and 2.9mg niacin. Immature seeds of Cajanus cajan are reported to contain per
100g, 117 calories, 69.50% moisture, 7. 2g protein, 0.6g fat, 21.3g total carbohydrates, 3.3g
fibre, 1.4g ash, 29mg calcium, 135mg phosphorus, 1.3 mg iron, 5 mg sodium, 563mg
potassium, 145 ug ß-carotene equivalent, 0.40mg thiamine, 0.25mg riboflavin, 2.4mg niacin
and 26mg Ascorbic acid/100g. Of the total amino acids, 6.7% is arginine, 1.2% cystine, 3.4%
histidine, 3.8% isoleucine, 7.6% leucine, 7.0% lysine, 1.5% methionine, 8.7% phenylalanine,
3.4% threonine, 2.2% tyrosine, 5 .0% valine, 9.8% aspartic acid, 19.2% glutamic acid, 6.4%
alanine, 3.6% glucine, 4.4% proline, 5.0% serine with 0 values of canavaline, citrulline and
homoserine (Duke, 1981).
In combination with cereals, as pigeon peas are always eaten, this legume contributes
to a nutritionally balanced human food. The oil of the seeds contains 5.7% linolenic acid,
51.4% linoleic, 6. 3% oleic and 3.66% saturated fatly acids. Seeds are reported to contain
trypsin inhibitors and chymotrypsin inhibitors (Duke, 1981).
2.8.3 Pigeon Pea Utilization
The pigeon pea is usually consumed by human beings. The beans when green can be
eaten as vegetables and eaten as dry beans when dry and mature. In Nigeria, the dry mature
seeds are cooked whole until tender. They are mixed with cooked yam, maize, dried cocoyam
grits (achicha) or fresh cooked cocoyam, sweet potatoes in addition to vegetables, palm oil,
salt, pepper and other spices. They are consumed in form of pottage or ayaraya (mashed)
dish (Enwere, 1998). The ripe seeds of pigeon pea are also a source of flour (Duke, 1981).
2.8.4 Medicinal Uses
The pigeon pea seed is useful in the treatment of internal organ swelling. Some
herbal practitioners/researchers are of the opinion that it diminishes the swelling of internal

15
organ like stomach, liver, intestines among others. It is helpful in reducing wound and cancer
of these organs. It also has a new usage for the treatment of osteonecrosis of the femoral head
(http://en.Wikipedia.org/Wiki/pigeonpea, 2010). In some parts of Nigeria, especially in the
eastern states, the fresh leaves are boiled with water and used for treating measles. The
extract after boiling is drunk and used as a hot bath in the treatment of this disease (Enwere,
1998).
According to Morton (1976), there are many folk medicinal uses for pigeon pea. In
India and Java, the young leaves are applied to sores. Indochinese claim that powdered leaves
help expel bladder stones. Salted leaf juice is taken for jaundice. In Argentina the leaf
decoction is prized for genital and other skin irritations, especially in females. Floral
decoctions are used for bronchitis, coughs and pneumonia. Chinese shops sell dried roots as
an alexeritic, anthelminthic expectorant and sedative. Leaves are also used for tooth ache,
mouth wash, sore gums, child delivery, and dysentery. Scorched seeds added to coffee are
said to alleviate headache and vertigo. Fresh seeds are said to help incontinence of urine in
males, while immature fruits are believed to be of use in liver and kidney ailments
(Wikipedia, 2009).
2.7 Cereals
Cereals belong to various tribes of the grass family and they constitute important
crops which serve as industrial raw materials world over. World cultivated cereals include
wheat, rice, barley, oats, rye, sorghum, wild rice, adlay, rice grass, and millet. An important
characteristic of cereals is that it has high carbohydrate, low fat, and a fair content of protein.
However, the limitation in the use of cereals as food is that their proteins are deficient in the
amino acid lysine and sometimes tryptophan. The functionality of these components in the
different cereals determine to a large extent, their uses as food and industrial raw material
(Enwere, 1998).
Cereal grains are eaten in many ways sometimes as pastes, roasts, porridges and
pottages, or other preparations of the seeds; more often they are milled and further processed
into flour, starch bran, oil, breakfast or dinner cakes and snacks (Ihekoronye and Ngoddy,
1985).

16
2.10 Millet (Eleusine coracana)
Millet (Eleusine coracana) belongs to the tribe chlorideae as the specie of economic
importance. This plant is variously called African ragi or finger millet (Enwere 1998). The
principal use of millet grain (Eleusine coracana) is for food. The grain is ground to make
flour or meal from which unleavened bread or chapatties may be prepared, or the ground
product may be used to make a beverage. Millet is also consumed in the form of porridge
from dry parched grains (Ihekoronye and Ngoddy 1985).
2.10.1 Nutritive Value of Millet
Millet grain is not as popular as most grains. In spite of this, it has nutritive value
comparable to that of other cereals (Enwere, 1998). It appears to be higher in protein than
most cereals. Although its protein has a low lysine content; Kent (1975) noted that ragi
(finger millet) is adequate in all other essential amino acids.
Typical analytical figures for millet grains are: protein 9-10%, fat, 3-4.5%, fibre, 2%,
carbohydrate, 75-85%, ash, 1-2%, food energy, 414 calories (Ihekoronye and Ngoddy, 1985).
It is a good source of thiamine and probably contains appreciable amounts of other B-
vitamins. It runs high in ash content and contains good levels of calcium, phosphorus,
magnesium and iron. Millet has a high percentage of indigestible fibre because the seeds are
enclosed in hulls which are not removed by ordinary processing methods (Ihekoronye and
Ngoddy, 1985).
There are various processing methods used to prepare harvested food raw materials
which can alter the sensory characteristics of foods to meet the required quality. Such
processes include fermentation, blanching, sprouting (germination) and heat treatment. Some
of these processes are texturization techniques which include flaking, toasting, baking, frying,
extrusion among others. Extrusion is currently being used to produce fabricated foods (Rizvi
et al., 1995).
2.11 Extrusion
Extrusion is a process which combines several unit operations including mixing,
cooking, kneading, shearing, shaping and forming. Extruders are classified according to the
method of operation (cold extruders or extrusion cookers) and the method of construction
(single-or twin-screw extruders) (Fellows, 2000).

17
The principles of operation are similar in all types. Raw materials are fed into the
extruder barrel and the screw (s) then convey the food along it. Further down the barrel,
smaller flights restrict the volume and increase the resistance to movement of food. As a
result, it fills the barrel and the spaces between the screw flights and becomes compressed.
As it moves further along the barrel, the screw kneads that material into a semi-solid,
plasticized mass. If the food is heated above 1000C the process is known as extrusion cooking
or hot extrusion. Here, frictional heat and any additional heating that is used cause the
temperature to rise rapidly. The food is then passed to the section of the barrel having the
smallest flights where pressure and shearing are further increased. Finally, it is forced
through one or more restricted openings (dies) at the discharge end of the barrel. As the food
emerges under pressure from the die, it expands to the final shape and cools rapidly as
moisture is flashed off as steam (Fellows, 2000). A variety of shapes including rods, spheres,
doughnuts, tubers, strips, or shells can be formed. Extruded products may be subsequently
processed further by drying or packaging. Many extruded foods are also suitable for coating
or enrobing (O‟ Connor, 1987).
2.11.1 Advantages of Extrusion Cooking
(i) Product quality: extrusion cooking involves high temperatures applied for a short
time and the limited heat treatment therefore retains many heat sensitive components
(Fellows, 2000). It also reduces microbial contamination and inactivates enzymes
(Roland and Stanley, 2011).
(ii) Versatility: A very wide variety of products are possible by changing the
ingredients, the operating conditions of the extruder and the shape of the dies.
(iii) Reduced Costs: Extrusion has lower processing costs and higher productivity than
other cooking or forming processes. Some traditional processes including
manufacture of cornflakes and frankfurters are more efficient and cheaper when
replaced by extrusion.
(iv) No process effluents: Extrusion is a low moisture process that does not produce
process effluents. This eliminates water treatment costs and does not create problems
of environmental pollution.

18
(V) High production rates and automated production: Extruders operate continuously
and have high throughputs. For example, production rates of up to 315kg/h for snack
foods, 1200kg/h for low density cereals and 9000 kg/h for dry expanded pet foods are
possible (Mans, 1982).
2.12. Effects of Extrusion on Foods
2.12.1 Sensory Characteristics
Production of characteristic textures is one of the main features of extrusion
technology. The extent of changes to starch determined by the operating conditions and feed
materials, produce the wide range of product textures that can be achieved (Kulshreshtha et
al., 1995).
The high- temperature short- time conditions in extrusion cooking have only minor
effects on the natural colour and flavours of foods. However, in many foods the colour of the
product is determined by the synthetic pigments added to the feed material as water - or oil-
soluble powders or emulsions. Added flavours are mixed with ingredients before cold
extrusion; but this is largely unsuccessful in extrusion cooking as the flavours are volatilized
when the food emerges from the die. Micro-encapsulated flavours are more suitable but
expensive. Flavours are therefore more often applied to the surface of extruded foods in the
form of sprayed emulsions or viscous shines. However, this may cause stickiness in some
products and hence require additional drying (Fellows, 2000).
2.12.2 Nutritional Value
Vitamin losses in extruded foods may vary according to the type of food, the moisture
content, the temperature of processing and the holding time. Generally losses are minimal in
cold extrusion. The High temperature, Short time (HTST) conditions in extrusion cooking
and the rapid cooling as the product emerges from the die, cause relatively small losses of
most vitamins and essential amino acids. For examples at an extruder temperature of 1540C
there is 95% retention of thiamin and little loss of riboflavin, pyridoxine, niacin or folic acid
in cereals.
However, losses of ascorbic acid and β-carotene are up to 50%, depending on the
time that the food is held at the elevated temperatures (Harper, 1979), and loss of lysine,
cystine and methionine in rice products varies between 50%-90% depending on processing

19
conditions (Seiler, 1984). In soy flour the changes to proteins depend on the formulation and
processing conditions. High temperatures and the presence of sugars cause Millard browning
and a reduction in protein quality. Lower temperatures and low concentrations of sugars
result in an increase in protein digestibility, owing to rearrangement of the protein structure.
Destruction of antinutritional components in soya products improves the nutritive value of
texturized vegetable proteins (Fellows, 2000).
20
CHAPTER THREE
MATERIALS AND METHODS
3.0. Procurement of Raw Materials
Millet grains and pigeon pea seeds were purchased from Ogige market in Nsukka
Enugu State Nigeria as well as additives such as sugar, baking fat, flavour among others,
while fresh cassava peels were collected from cassava processors in Nsukka town.
Preparation of Samples
The raw materials were processed into flour as stated below.
3.1.1 Millet Flour
Millet was processed into flour according to the method of Jideani (2005). Two
kilograms of the grains were cleaned by sorting and winnowing. The cleaned grains were
dehulled using traditional method. Hulls were removed by winnowing and the weight of the
dehulled grains noted. The dehulled grains were washed and dried at 50OC for 24 hours in an
oven (Fulton, Model NYC-101 oven). The grains were reduced to powder using a hammer
mill (Driver model: De-Demark Super) and sieved through 4.25m sieve. The flow diagram
for the preparation of millet flour is shown in Fig. 1.
Millet
Cleaning
Dehulling
Washing
Drying at 50OC for 24 hours
Milling
Sieving
Millet Flour
Fig. 1: Flow diagram for the processing of millet into flour
(Jideani, 2005)

21
3.1.2 Pigeon Pea Flour
Pigeon pea was processed into flour according to the method described by Enwere et al.
(1993) for the processing of legumes into flour (Fig. 2).
3.1.3 Preparation of Cassava Cortex Flour
The outer layer of fresh cassava peels were scraped off with knife and the inner peels
(cortex) retained and washed thoroughly in clean water. The cortex was soaked in water for
72 hours. During soaking, the water was changed every 24 hours. Afterwards the cortex was
dried in an oven (Fulton, Model NYC-101 oven) at 50OC for 24 hours and milled into flour
(Ugwuanyi, 2010). The flow diagram for the preparation of cassava cortex flour is shown in
Fig. 3.
(Dehulling)
(With clean water)
(to remove stones, dirt, chaff,
weeviled seeds and weevils)
Pigeon Pea Seeds
Cleaning
Washing
Decorticating
Milling (in hammer attrition mill)
Sieving
Raw Fine Pigeon pea Flour
Fig. 2: Flow diagram for the processing of pigeon pea into flour
(Enwere et al., 1993)
Drying at 50OC for 24hours
22
3.2. Preparation of Flour Blends
Millet flour (MF) and pigeon pea flour (PPF) were blended in the ratio of 65:35.
Cookies were produced from wheat and graded levels (10, 20, 30 and 40%) of the composite
flour (MPF) (Table 1); and subjected to sensory evaluation in order to obtain the most
acceptable ratio (80:20) which was used for further studies.
Table 1: Composite flour blends prepared from wheat flour and millet-pigeon pea flour
Wheat flour (WF) (%) Millet-pigeon pea flour blend (MPF) (%)
100 0
90 10
80 20
70 30
60 40
Cassava Peels
Scrapping the periderm
Washing
Soaking for 72 hours
Drying for 24 hours at 500C
Milling
Cassava Cortex Flour
Fig. 3: Flow diagram for the processing of cassava cortex into flour
(Ugwuanyi, 2009)

23
Different levels (5, 10, 15 and 20%) of cassava cortex flour were used to substitute wheat
flour in the most acceptable ratio as shown in Table 2, to produce six samples each of the
baked (cookies) and extruded snacks.
Table 2: Composite flour blends prepared from wheat flour, millet-pigeon pea flour and
cassava cortex flour
Wheat flour (WF) (%) Millet-pigeon pea Cassava cortex flour (CCF) (%)
Flour blend (MPF) (%)
100 0 0
80 20 0
75 20 5
70 20 10
65 20 15
60 20 20
3.3. Development of Products
Twelve different formulations were developed from the flour blends in Table 2, six of which
were used for production of cookies and the other six used for production of extruded snacks.
3.3.1 Production of Cookies
The cookies were prepared using the method described by Eneche (1999) with slight
modifications. The flour (500g), sugar (150g), baking fat (190g) and salt (5g) were mixed
together manually for 5 minutes to get a creamy dough. The baking powder (2.5g) and vanilla
(5g) were then added. The measured amount of water (125ml) was gradually added using
continuous mixing until good textured, slightly firm dough was obtained. The dough was
kneaded on a clean flat surface for four minutes. It was manually rolled into sheets and cut
into shapes using the stamp cutting method. The cut dough pieces were transferred into fluid
fat greased pans and baked in an oven (Carma, Model 1945XL, Terim Group Italy) at 180ºC
for 20 minutes, cooled and packaged for further analysis. The flow diagram for the
preparation of cookies is shown in Fig. 4.

24
Fig. 4: Flow diagram for the production of cookies (Eneche, 1999)
3.3.2 Production of Extruded Snacks
The ingredients and method of mixing for production of extruded snacks were the same with
those of cookies. After mixing, the dough was extruded using a locally fabricated FST 001
single screw extruder at the Department of Food Science and Technology, University of
Nigeria, Nsukka. The dough was fed from the hopper mounted vertically above the feed end
of the extruder. The barrel temperatures were set at 80ºC, 100ºC and 150ºC for the three
heating zones respectively. The extrudates were dried for 5 minutes in an oven (Fulton,
Model NYC-101oven) at 150ºC, cooled and packaged.
Addition of other ingredients (vanilla, baking powder)
Dough mixing
Kneading
Rolling
Stamp cutting
Mixing (Flour, sugar, salt, baking fat)
Baking
Cooling
Packaging
Weighing of ingredients

25
Fig. 5: Flow diagram for the production of extruded snacks
Addition of other ingredients (Vanilla, baking powder)
Dough mixing
Extrusion cooking
Drying for 5 minutes at 1500C
Cooling
Mixing (flour, sugar, salt, baking fat)
Packaging
Weighing of ingredients

26
Plate 2: Cookie samples C, D, E and F had 5%, 10%, 15% and 20% cassava cortex
flour incorporation, respectively.
Fig. 9: Extruded snack samples I, J, K and L had 5%, 10%, 15% and 20% cassava
cortex flour incorporation, respectively.

27
3.4. Chemical Analysis
3.4.1 Proximate Analysis
3.4.1.1 Determination of Moisture Content
Moisture content was determined according to the standard methods of Association of
Official Analytical Chemists (AOAC), (2010). Stainless steel oven dishes were cleaned and
dried in the oven at 100ºC for 1 hour to achieve a constant weight. They were cooled in a
desiccator and then weighed. Two grams of sample was placed in each dish and dried in the
oven at 100ºC until constant weight was achieved. The dishes together with the samples
were cooled in a desiccator and weighed.
% moisture content = 1
100
WW
WW
12
32
Where
W1 = weight of dish
W2 = weight of dish + sample before drying
W3 = weight of dish + sample after drying
3.4.1.2 Determination of Crude Protein
Crude protein was determined using the Kjeldahl method (AOAC, 2010). Two gram
of sample was placed in the Kjeldahl flask. Anhydrous sodium sulphate (5g of Kjeldahl
catalyst) was added to the flask. Concentrated H2SO4 (25ml) was added with few boiling
chips. The flask was heated in the fume chamber until the sample solution became clear. The
sample solution was allowed to cool to room temperature, then transferred into a 250ml
volumetric flask and made up to volume with distilled water.
The distillation unit was cleaned, and the apparatus set up. Five milliliters of 2% boric
acid solution with few drops of methyl red indicator was introduced into a distillate collector
(100ml conical flask). The conical flask was placed under the condenser. Then 5ml of the
sample digest was pipetted into the apparatus, and washed down with distilled water. Five
milliliters of 60% sodium hydroxide solution was added to the digest. The sample was
heated until 100ml of distillate was collected in the receiving flask. The content of the
receiving flask was titrated with 0.049M H2SO4 to a pink coloured end point. A blank with
filter paper was subjected to the same procedure.
28
Calculation:
% Total Nitrogen =
sampleofWeight
NacidofNormalityBlanktitre 2
Nitrogen factor = 6.25
Crude protein = % total N x 6.25
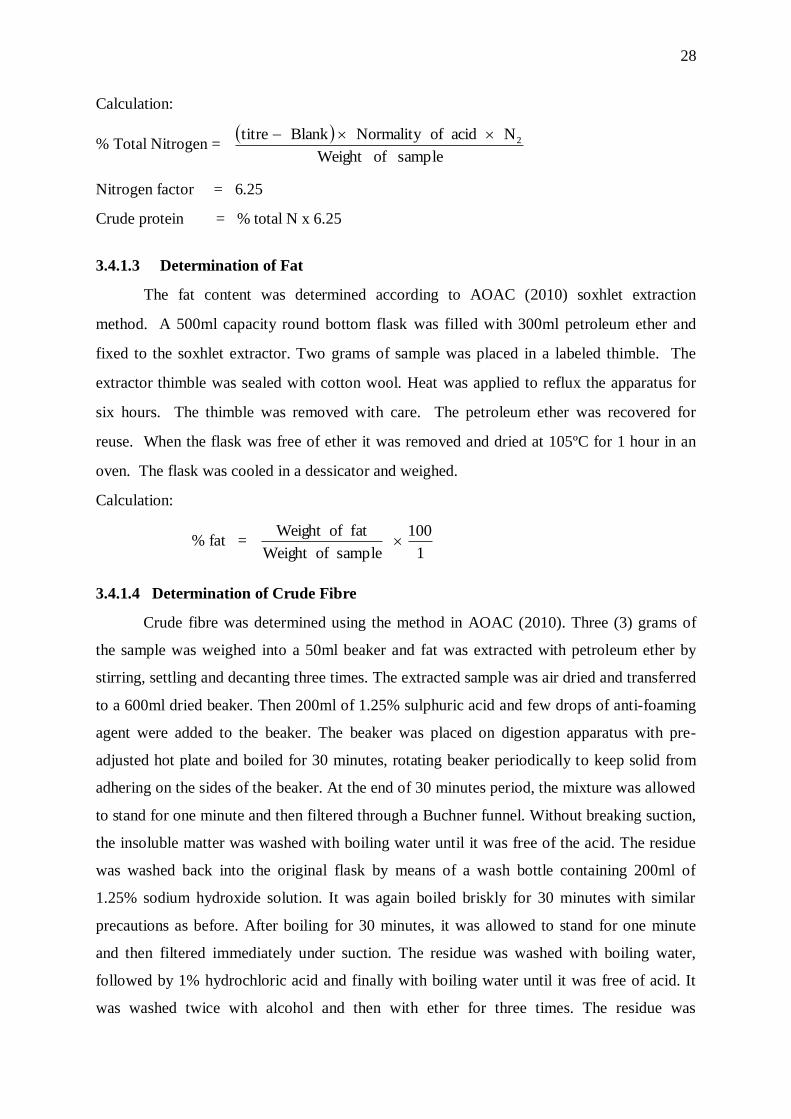
3.4.1.3 Determination of Fat
The fat content was determined according to AOAC (2010) soxhlet extraction
method. A 500ml capacity round bottom flask was filled with 300ml petroleum ether and
fixed to the soxhlet extractor. Two grams of sample was placed in a labeled thimble. The
extractor thimble was sealed with cotton wool. Heat was applied to reflux the apparatus for
six hours. The thimble was removed with care. The petroleum ether was recovered for
reuse. When the flask was free of ether it was removed and dried at 105ºC for 1 hour in an
oven. The flask was cooled in a dessicator and weighed.
Calculation:
% fat = 1
100
sampleofWeight
fatofWeight
3.4.1.4 Determination of Crude Fibre
Crude fibre was determined using the method in AOAC (2010). Three (3) grams of
the sample was weighed into a 50ml beaker and fat was extracted with petroleum ether by
stirring, settling and decanting three times. The extracted sample was air dried and transferred
to a 600ml dried beaker. Then 200ml of 1.25% sulphuric acid and few drops of anti-foaming
agent were added to the beaker. The beaker was placed on digestion apparatus with pre-
adjusted hot plate and boiled for 30 minutes, rotating beaker periodically to keep solid from
adhering on the sides of the beaker. At the end of 30 minutes period, the mixture was allowed
to stand for one minute and then filtered through a Buchner funnel. Without breaking suction,
the insoluble matter was washed with boiling water until it was free of the acid. The residue
was washed back into the original flask by means of a wash bottle containing 200ml of
1.25% sodium hydroxide solution. It was again boiled briskly for 30 minutes with similar
precautions as before. After boiling for 30 minutes, it was allowed to stand for one minute
and then filtered immediately under suction. The residue was washed with boiling water,
followed by 1% hydrochloric acid and finally with boiling water until it was free of acid. It
was washed twice with alcohol and then with ether for three times. The residue was
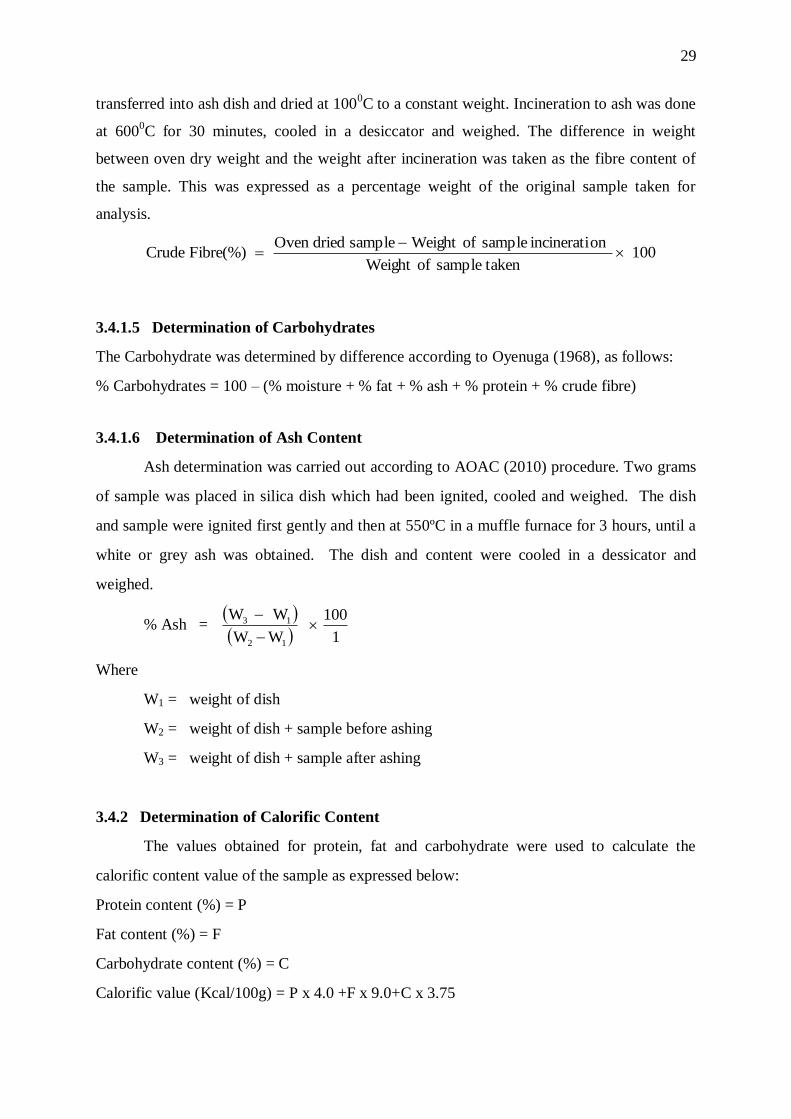
29
transferred into ash dish and dried at 1000C to a constant weight. Incineration to ash was done
at 6000C for 30 minutes, cooled in a desiccator and weighed. The difference in weight
between oven dry weight and the weight after incineration was taken as the fibre content of
the sample. This was expressed as a percentage weight of the original sample taken for
analysis.
100takensampleofWeight
onincineratisampleofWeightsampledriedOvenFibre(%)Crude
3.4.1.5 Determination of Carbohydrates
The Carbohydrate was determined by difference according to Oyenuga (1968), as follows:
% Carbohydrates = 100 – (% moisture + % fat + % ash + % protein + % crude fibre)
3.4.1.6 Determination of Ash Content
Ash determination was carried out according to AOAC (2010) procedure. Two grams
of sample was placed in silica dish which had been ignited, cooled and weighed. The dish
and sample were ignited first gently and then at 550ºC in a muffle furnace for 3 hours, until a
white or grey ash was obtained. The dish and content were cooled in a dessicator and
weighed.
% Ash = 1
100
WW
WW
12
13
Where
W1 = weight of dish
W2 = weight of dish + sample before ashing
W3 = weight of dish + sample after ashing
3.4.2 Determination of Calorific Content
The values obtained for protein, fat and carbohydrate were used to calculate the
calorific content value of the sample as expressed below:
Protein content (%) = P
Fat content (%) = F
Carbohydrate content (%) = C
Calorific value (Kcal/100g) = P x 4.0 +F x 9.0+C x 3.75

30
3.4.3 Determination of Minerals
3.4.3.1 Determination of Iron
Iron was determined following the phenanthroline method of Lee and Stumm (1960).
Five milliliters of digested sample was placed in a 50ml volumetric flask. Then 3ml of
phenanthroline solution, 2ml of hydrochloric acid and 1ml of hydroxylamine solution were
added to the sample in sequence. The sample solution was boiled for 2 minutes and 9ml of
ammonium acetate buffer solution was added to the solution. The solution was diluted with
water to 50ml volume. The absorbance was determined at 510nm wavelength.
Iron standard solution was prepared in order to plot a calibration curve to determine
the concentration of the sample. Standard solution containing 100mg/ml of ferric irons was
prepared from 1g pure iron wires. The wires were dissolved in 100ml concentrated nitric
acid, boiled in a water bath and diluted to 100ml with distilled water after cooling. Standard
solutions of known concentrations were prepared by pipetting 2, 4, 6, 8 and 10ml standard
iron solution into 100ml volumetric flasks, and made up to volume.
3.4.3.2 Determination of Calcium
Calcium was determined using the method described by Pearson (1976). Twenty-
five milliliter of the digested sample was pipetted into 250ml conical flask and a pinch of
Eriochrome Black-T- Indicator (EBT) was added. Thereafter, 2ml of 0.1N NaOH solution
was added and the mixture titrated with standard EDTA (0.01M EDTA) solution.
Ca (mg/l) = usedsampleofVolume
1000EMT
Where
T = titre value
M = Morality of EDTA
E = Equivalent weight of calcium
3.4.3.3 Determination of Phosphorus
Phosphorus in the samples was determined according to Onwuka (2005) by
molybdate method using hydroquinone as a reducing agent. Five milliliters (5ml) of the test
solution was pipetted into 50ml graduated flask. Then 10ml of molybdate mixture was added
and diluted to mark with water. It was allowed to stand for 30 minutes for colour

31
development. The absorbance was measured at 660nm against a blank. A curve relating
absorbance to mg phosphorus present was constructed. Using the phosphorus standard
solution, and following the same procedure for the test sample, a standard curve was plotted
to determine the concentration of phosphorus in the sample.
% Phosphorus = 100
volumesolution x readinggraph
3.4.3.4 Determination of Potassium
Potassium was determined by a procedure described by Osborne and Voogt (1978)
using a flame photometer. Potassium standard was prepared. The standard solution was used
to calibrate the instrument read out. The meter reading was at 100% E (emission) to aspire
the top concentration of the standards. The %E of all the intermediate standard curves were
plotted on linear graph paper with these readings. The sample solution was aspired on the
instrument and the readings (% E) were recorded. The concentration of the element in the
sample solution was read from the standard curve.
Calculation
% Potassium = million 1
DF x 100 x Ppm
3.4.4 Determination of Vitamins
3.4.4.1 Determination of Vitamin A
The AOAC (2010) method using the colorimeter was adopted. This measures the
unstable colour at the absorbance of 620nm that result from the reaction between vitamin A
and SbL3.
Pyrogallol (antioxidant) was added to 2g sample prior to saponification with 200ml alcoholic
KOH. The saponification took place in water bath for 30 minutes. The solution was
transferred to a separating funnel where water was added. The solution was extracted with 1
– 2.5ml of hexane. The extraction was washed with equal volume of water. The extract was
filtered through filter paper containing 5g anhydrous Na2SO4 into volumetric flask. The filter
paper was rinsed with hexane and made up to volume. The hexane was evaporated from the
solution and blank. About 1ml chloroform and SbL3 solution were added to the extract and

32
blank. The reading of the solution and blank was taken from the colorimeter adjusted to zero
absorbance or 100%.
Calculation
Vitamin A = A620nm x SL x (V/Wt) Mg
where
A620nm = absorbance at 620nm
SL = Slope of standard curve (Vit. A conc) + A620 reading
V = Final volume in colorimeter tube
Wt = Weight of sample
3.4.4.2 Determination of Vitamin E
Vitamin E was determined using the method described by Pearson (1976). One gram
of the sample was weighed into a 100ml flask; 10ml of absolute alcohol and 20mls of M
alcoholic tetraoxosulphate VI acid (H2SO4) were added. Ten milliliters of the clear solution
was pipetted into a test tube and heated in a water bath at 90ºC for 3mins. This was allowed
to cool. The absorbance was read in a spectrophotometer at 470nm wavelength.
Calculation:
Vitamin E in Mg/100g = a – b x c
s – b w
Where: a = absorbance of test sample
b = absorbance of the standard solution
c = concentration of standard in mg/100g
w = weight of the sample used.
3.4.4.3 Determination of Thiamine
Thiamine content was determined using the scalar analyzer method of AOAC (2010).
Five grams of each sample was homogenized in 5ml normal ethanoic sodium hydroxide
solution. The homogenate was filtered and made up to 100ml with the extract solution. A
10ml aliquot of the extract was dispensed into a flask and 10mls of potassium dichromate
solution added. The resultant solution was incubated for 15mins at room temperature (25±
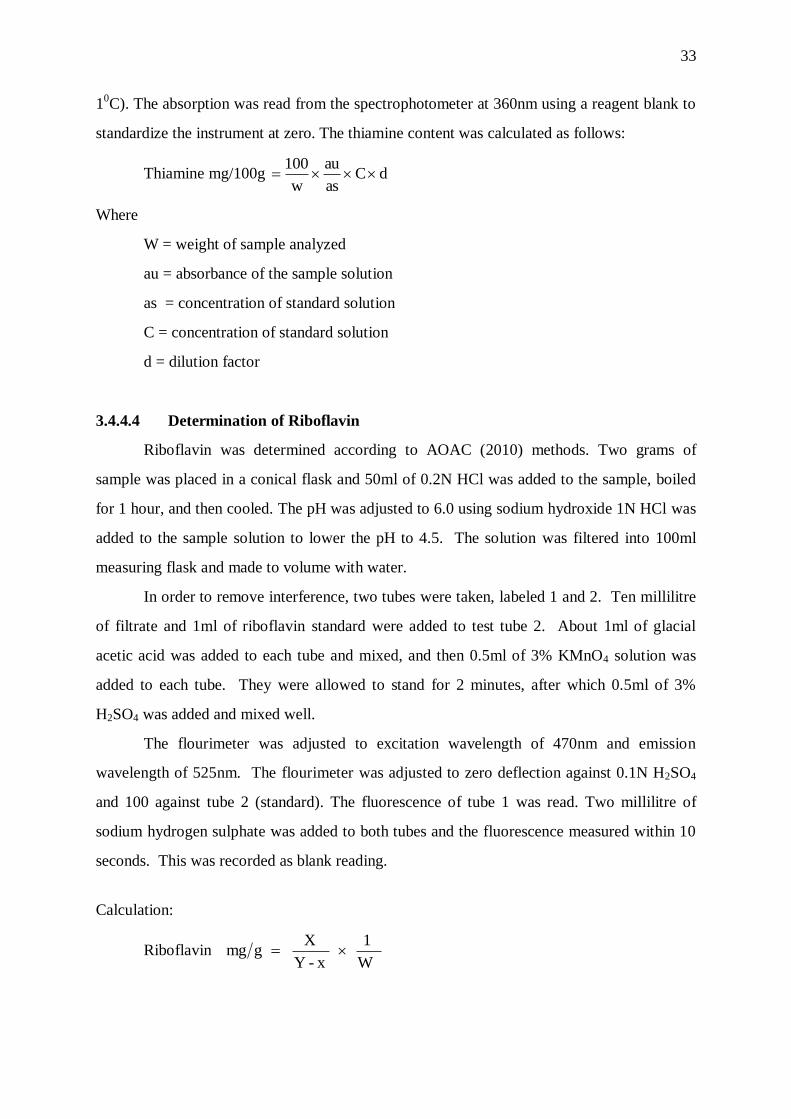
33
10C). The absorption was read from the spectrophotometer at 360nm using a reagent blank to
standardize the instrument at zero. The thiamine content was calculated as follows:
Thiamine mg/100g dCas
au
w
100
Where
W = weight of sample analyzed
au = absorbance of the sample solution
as = concentration of standard solution
C = concentration of standard solution
d = dilution factor
3.4.4.4 Determination of Riboflavin
Riboflavin was determined according to AOAC (2010) methods. Two grams of
sample was placed in a conical flask and 50ml of 0.2N HCl was added to the sample, boiled
for 1 hour, and then cooled. The pH was adjusted to 6.0 using sodium hydroxide 1N HCl was
added to the sample solution to lower the pH to 4.5. The solution was filtered into 100ml
measuring flask and made to volume with water.
In order to remove interference, two tubes were taken, labeled 1 and 2. Ten millilitre
of filtrate and 1ml of riboflavin standard were added to test tube 2. About 1ml of glacial
acetic acid was added to each tube and mixed, and then 0.5ml of 3% KMnO4 solution was
added to each tube. They were allowed to stand for 2 minutes, after which 0.5ml of 3%
H2SO4 was added and mixed well.
The flourimeter was adjusted to excitation wavelength of 470nm and emission
wavelength of 525nm. The flourimeter was adjusted to zero deflection against 0.1N H2SO4
and 100 against tube 2 (standard). The fluorescence of tube 1 was read. Two millilitre of
sodium hydrogen sulphate was added to both tubes and the fluorescence measured within 10
seconds. This was recorded as blank reading.
Calculation:
Riboflavin W
1
x- Y
Xgmg

34
Where
W = weight of sample
X = reading of sample – blank reading
Y = reading of sample + standard tube (2) – reading of
sample + standard blank.
3.4.5 Determination of Antinutrients
3.4.5.1 Determination of Tannin
Tannin content was determined by the Folis – Denis colorimetric method described by
Kirk and Sawyer (1998). Five gram sample was dispersed in 50ml of distilled water and
shaken. The mixture was allowed to stand for 30min at 28OC before it was filtered through
Whatman No 42 grade of filter paper. Two milliliters of the extract was dispersed into a
50ml volumetric flask. Similarly, 2ml standard tannin solution (tannic acid) and 2ml of
distilled water were put in separate volumetric flasks to serve as standard and reagent was
added to each of the flask and then 2.5ml of saturated Na2CO3 solution was added. The
content of each flask was made up to 50ml with distilled water and allowed to incubate at
28OC for 90min. Their respective absorbance was measured in a spectrophotometer at
260nm using the reagent blank to calibrate the instrument at zero.
3.4.5.2 Determination of Haemagglutinin
Haemagglutinins was determined by the spectrophotometric method of AOAC
(2010). Fifty milligrams (50mg) of the sample was mixed with 50ml of normal saline (0.85%
NaCl) solution buffered at pH 6.8. The Mixture was shaken for 30mins and then centrifuged
at 3500rpm for 30mins. The supernatant was filtered through Whatman no 42 grade filter
paper. The filtrate was diluted 10 times and used for analysis.
Fresh rabbit red blood cells were suspended in 10mls of each normal saline solution in two
test tubes and labeled to represent the sample and the control. Into the sample test tube, 1ml
of distilled sample extract was added while 1ml of distilled water was added into the control.
Both tubes were left to react for 90mins. Then their absorbance was measured
spectrophotometrically at 760nm wavelength. The number of hemagglutinin units contained
per gram of the sample was calculated as follows:
35
Hui/sample daaw
su 1
Where Hui = haemagglutinin unit inhibitor
au = absorbance of test sample
as = absorbance of control
w = weight of sample
d = dilution factor
3.4.5.3 Determination of Phytate
Phytate content was determined using spectrophotometric method as described by
Pearson (1976). Half gram (0.5g) of sample was weighed into a 500ml flat bottom flask. The
flask was placed in a shaker and the sample was extracted with 2.4% HCl for 1 hour. The
aliquote was filtered and 5ml of the filtrate was pipetted and diluted to 25ml with distilled
water. Fifteen millilitres of NaCl was added to 10ml of the diluted sample and this was
passed through an amplet resin (200 – 400 mesh) to elude inorganic phosphorus. About 15ml
of 0.7M sodium chloride (NaCl) was added to the solution which was mixed on a votex
mixer for 5secs. The mixture was then centrifuged for 10 minutes and the supernatant was
read at 520nm wavelength in UV spectrophotometer. The phytate concentration was read off
from a standard curve prepared with standard inositol phytate and the value expressed in
mg/l00g using the formula:
factordilution sample of weight
curve standard from (mg/l00g) phytate of Conc. (mg) hytateP
3.4.5.4 Determination of Hydrogen Cyanide (HCN)
This was determined by the alkaline picrate colorimetric method of Bradbury et al.
(1999). One gram of each sample was weighed into a conical flask and 200ml of distilled
water added to it. Each sample was thoroughly mixed. A strip of alkaline picrate paper was
suspended over the mixture, with the aid of a rubber stopper, in such a way that the paper did
not touch the surface of the mixture. The set up was incubated for 18 hours at room
temperature. At the end of the incubation period, the picrate paper was carefully removed
and placed in 60ml of distilled water. Meanwhile a standard cyanide solution was prepared
and treated as described above. The absorbance of the elutes from the standard and the

36
sample were measured in a spectrophotometer at 540nm. The cyanide content (HCN) in
mg/kg was calculated using the formula,
HCN (mg/kg) = (100/W) x Au (As)
Where
W = weight of sample analyzed (g)
Au = Absorbance of sample (nm)
As = Absorbance of the standard HCN solution (nm)
3.4.6 Determination of Functional Properties
3.4.6.1 Determination of Bulk Density
The Bulk Density of the flour sample was determined by the method of Okaka and
Potter (1979). A previously weighed measuring cylinder was filled to the 10ml mark with the
sample. The bottom of the cylinder was tapped gently but repeatedly on a laboratory bench
until there was no further reduction of the sample level at the 10ml mark. The cylinder with
the sample was weighed.
The bulk density of the samples was determined by:
V
WWgBD 123
cm
Where
BD = bulk density in g/cm3
W1 = weight of empty cylinder (g)
W2 = weight of cylinder + sample (g)
V = Volume of cylinder occupied by the sample (cm3)
3.4.6.2 Determination of Water Absorption Capacity (WAC)
This was determined using the method of Lin et al. (1974). One gram of the sample
was dispensed into a weighed centrifuge tube with 10ml of distilled water and mixed
thoroughly. The mixture was allowed to stand for 1 hour before being centrifuged at
3500rpm for 30 minutes. The excess water (unabsorbed) was decanted and the tube inverted
over an adsorbent paper to drain dry. The weight of water absorbed was determined by
difference. The water absorption capacity was calculated as:
1
100
used sample ofWeight
waterfree of Volume - used water of VolumeWAC%

37
3.4.6.3 Determination of Swelling Capacity
The method described by Ukpabi and Ndimele (1990) was used. Ten grams of the
sample was measured into a 300ml measuring cylinder. Then 150ml of distilled water was
added to the sample and allowed to stand for four hours. The final volume after swelling was
recorded. The percentage swelling was calculated as;
1
100
volumeInitial
volumeinitial - volumeFinalcapacity% Swelling
3.4.6.4 Determination of pH
The pH of the flour samples was measured in a 10% (w/v) dispersion of the samples
in distilled water. Each suspension was mixed thoroughly and a standard pH meter (Hanna
meter model H196107) was used for pH determination. The pH electrode was dipped into the
solution and after a few minutes of equilibration, the pH reading of the sample was taken.
3.4.7 Microbial Analysis
3.4.7.1 Total Viable Count
Pour plate method as described by Harrigan and McCance (1976) was used. One
gram of the sample was macerated into 9ml of Ringers solution and mixed thoroughly by
shaking. This was further diluted to obtain 10–2
and 10–3
concentration. Then 0.1ml dilution
was transferred from each dilution bottle into the corresponding plate and 15ml of sterile
nutrient agar medium was poured and mixed thoroughly with the inoculum by rocking the
plates. The plates were incubated at 38ºC for 24 hours after which the colonies formed were
counted and expressed as colony forming units per gram (cfu/g).
3.4.7.2 Coliform Count
The pour plate method of Harrigan and McCance (1976) was used. Nine milliliters of
sterilized violet red bile agar was put into each plate containing 1ml of inoculum from 10–3
dilution. The plate was shaken gently to mix the content properly, and then it was allowed to
set and subsequently incubated at 37ºC for 72 hours. After incubation the number of colonies
which appeared with dark red or pink centres was counted. This was expressed as colony
forming units per gram (cfu/g).

38
3.4.7.3 Mould Count
The pour plate method as described by Harrigan and McCance (1976) was also used.
The sample dilution weighing 0.1ml was transferred from each dilution into corresponding
plates and 15ml of sterile Sabourand Dextrose Agar (SDA) medium was poured and mixed
thoroughly with the inoculum by rocking the plates. The plates were incubated at ambient
temperature for three days after which colonies formed were counted and expressed as colony
forming units per gram (cfu/g).
3.5 Sensory Evaluation
Sensory evaluation of the cookies made from wheat and millet-pigeon pea flour
blends was conducted using twenty panel members; however, the snacks with cassava cortex
incorporation were evaluated by thirty panel members. These panelists were familiar with
quality attributes of cookies. The samples were coded and presented in identical containers. A
nine point hedonic scale as described by Ihekoronye and Ngoddy (1985) was used. The scale
ranged from like extremely (9) to dislike extremely (1) for cookies made from wheat and
millet- pigeon pea flour blends. A seven point category scale was used for cookies and
extruded snacks made from cassava cortex, wheat and millet-pigeon pea flour blends. Each of
the samples was rated for appearance, flavour, taste, texture and overall acceptability (Iwe,
2002).
3.6 Bioassay
The bioassay was carried out using 20 albino rats within the age of 6-7 weeks and
weighing between 40-50g. They were purchased from the animal house of the Faculty of
Veterinary Medicine Teaching Hospital, Nsukka. They were housed in individual cages and
fed with the finished products. The animals were fed for 35 days which comprised a 7-day
acclimatization period and a 28-day feeding period. The rats were divided randomly into four
groups of five rats each as follows:
Group A: Rats fed cookies made from 100% wheat flour
Group B: Rats fed cookies made from 80% wheat and 20% millet-pigeon pea flour blend
Group C: Rats fed cookies made from 70% wheat, 20% millet-pigeon pea and 10% cassava
cortex flour blend
Group D: Rats fed commercial rat feed (control)

39
3.6.1 Blood Glucose Determination
Blood sample was collected after overnight fasting from the rats by ocular method.
The concentration of glucose/sugar in the blood sample was determined using the one touch
glucometer and test strips (Life Scan Inc. Johnson-Johnson Company, Mulpiter California,
USA). A drop of whole blood was placed on a strip connected to the glucometer. The
glucometer automatically displayed concentration of the blood glucose, expressed in mg/dl
(ADA, 2003).
3.6.2 Serum Cholesterol Determination
Total cholesterol was determined by enzymatic analysis (Siedel et al., 1983) using the
Randox commercial kit. At the end of the experiment, blood sample was collected from the
rats by ocular method after overnight fasting. The blood sample was collected in non-EDTA
tubes. The serum collected were separated by centrifugation at 2500rpm for 15 minutes and
utilized to determine the total cholesterol, total triglyceride, high density lipoprotein (HDL),
and low density lipoprotein (LDL). The procedure as described in the kit‟s operation manual
was adopted.
3.6.3 Food, Water Intake and Body Weight of the Rats
Food and water intake were monitored daily and determined by weighing serving
dishes before and after meals. The body weight of the rats was monitored weekly and
measured in grams using weighing balance.
3.7 Statistical Analysis
The experiment was laid out in a completely randomized design (CRD). Data were
subjected to Analysis of Variance (ANOVA) using statistical package for social sciences
(SPSS) version 17.0. Duncan‟s new multiple range test (DNMRT) was used to compare the
treatment means. Statistical significance was accepted at p 0.05 (Steel and Torre, 1980).

40
CHAPTER FOUR
RESULTS AND DISCUSSION
4.1 Effect of Processing on Proximate Composition of Unblended Flour from Millet,
Pigeon Pea and Cassava Cortex
The proximate composition of flour obtained from processing millet, pigeon pea and
cassava cortex are shown in Table 3.
Table 3: Proximate composition of unblended flour from millet, pigeon pea and cassava
cortex
Sample
Flour
Moisture
(%)
Protein
(%)
Fat (%) Ash (%) Crude
fibre (%)
Carbohydrate
(%)
Millet 8.80±0.04b
8.76±0.08b
3.00±0.03a
1.25±0.10c
0.80±0.14c
77.39±0.40a
Pigeon
Pea
9.50±0.10a
16.64±1.85a
1.30±0.01b
1.30±0.00b
1.15±0.04b
67.86±1.82c
Cassava
Cortex
7.35±0.30c
3.94±0.06c
1.00±0.00c
1.95±0.01a
12.07±0.04a
73.69±0.31b
Values are means ±S.D of duplicate determinations.
Values in the same column with different superscripts were significantly (p<0.05) different
There were significant (p<0.05) differences in all the measured parameters. The
moisture content of the flour samples ranged from 7.35 to 9.50%. These values are below the
minimum limit of moisture content for flour (Ihekoronye and Ngoddy, 1985). The values are
therefore low enough for adequate shelf life stability if packaged in moisture-proof
containers.
The ash contents of the flour samples ranged from 1.25 to 1.95%; which shows the
presence of some minerals in the flour samples. The ash values for millet and pigeon pea
flour compared favorably with 1.7% and 2.9% reported by Eneche (1999), respectively.
The protein content of the flour samples ranged from 3.94 to 16.64%. Significant
(p<0.05) differences were observed among the samples. The variation in these results can be
attributed to their original raw materials. The highest protein value was observed in pigeon
pea flour. Mature pigeon pea seeds are noted to contain as much as 22% (Duke, 1981) and
19.2% (Purseglove, 1991) protein. The protein content of millet flour was 8.7%. Millet grains
are also known to contain appreciable quantity of protein of about 11% (Enwere, 1998). The
lowest value of 3.94% was observed in cassava cortex flour. Flour proteins of pigeon pea,
millet and cassava cortex do not form gluten. Most cookies can be made from flour which has
a gluten that is weak and extensible (Manley, 2000). These processed flour from pigeon pea,
41
millet and cassava cortex may sometimes be useful to „dilute‟ wheat flour. This can help to
make the dough less tough and easier to sheet. In addition, pigeon pea and millet flour can be
major sources of high quality protein for dietary cookies.
The fat content of the flour samples were generally low, ranging from 1.0 to 3.0%.
Significant (p<0.05) differences were observed among them. The fat value was highest in
millet flour (3.0%), while 1.3% was observed in pigeon pea flour. These values for millet and
pigeon pea flour compared favourably with Eneche‟s results of 4.8% and 1.4% respectively
(Eneche, 1999). The higher fat content of millet flour can be attributed to the fact that millet
is rich in germ which is rich in oil (Manley, 2000). Most legumes such as pigeon pea contain
less than 3% fat (Ihekoronye and Ngoddy, 1985).
The crude fibre content of the flour samples ranged from 0.80 to 12.0% with the
highest value observed in the cassava cortex flour. This is appreciated in this study for its
health benefits. Fibre aids in lowering blood cholesterol level and slows down the process of
absorption of glucose, thereby helping in keeping blood glucose level in control (Anderson et
al., 2009). It also ensures smooth bowel movements and thus helps in easy flushing out of
waste products from the body, increase satiety and hence impacts some degree of weight
management (Mickelson et al., 1979).
There were significant (p<0.05) differences in the carbohydrate contents of the flour
samples. Digestible carbohydrate contents of millet flour (77.39%) and pigeon pea flour
(67.86%) compared favourably with 72.80% reported by Eneche (1999) and 64.4% reported
by Oyenuga (1968). High carbohydrate value of 73.69% was also recorded for cassava cortex
flour. The high carbohydrate values of these flour can be attributed to the carbohydrate values
of their raw materials which were not so much affected by processing.
4.2 Effect of Processing on Selected Functional Properties and pH of Flour for
Production of Cookies and Extruded Snacks.
Functional properties suggest the potential application and use of food materials for
various food products (Ayernor, 1976). The results of selected functional properties and pH
of flour for the production of cookies and extruded snacks are shown in Table 4.

42
Table 4: Selected functional properties and pH of flour for production of cookies and
extruded snacks.
Sample Flour Bulk density
(g/cm3)
Water absorption
capacity (ml/g)
Swelling capacity
(%)
pH
Millet 0.64±0.01c 0.67±0.06
c 16.70±1.48
d 6.10±0.10
b
Pigeon Pea 0.71±0.03b
1.10±0.10b
48.25±1.52b
6.40±0.10a
Cassava Cortex 0.48±0.02d
3.12±0.05a
59.55±1.74a
4.20±0.10c
Millet-Pigeon pea 0.65±0.02c
0.93±0.12b
17.50±2.50d
6.20±0.20ab
Wheat 0.81±0.01a
0.47±0.15c
28.95±2.63c
6.03±0.06b
Values are means ±S.D of duplicate determinations.
Values in the same column with different superscripts were significantly (P < 0.05) different
The results of bulk density of the flour samples ranged from 0.48 to 0.81g/cm2. Wheat
flour had the highest value. There was no significant (p>0.05) difference between millet flour
(MF) and millet-pigeon pea flour (MPF) blend. The 0.64g/cm3and 0.65g/cm
3 obtained for
MF and MPF, respectively compared favourably with 0.62g/cm3 reported for yellow tigernut
flour (Oladele and Aina, 2009). The values obtained for PPF (0.71g/cm3) and WF
(0.81g/cm3) compared favourably with 0.71g/cm
3 reported for wheat flour (Akubor and
Badifu, 2004). The lowest value (0.48g/cm3) was observed in cassava cortex flour (CCF).
This implied that CCF would require more packaging space since the lesser the bulk density,
the more packaging space is required (Agunbiade and Ojezele, 2010). The low bulk density
observed show that these flour can be used for food formulation with less fear of
retrogradation. Bulk density is a measure of heaviness of a flour sample (Oladele and Aina,
2009).
The results obtained for water absorption capacity (WAC) ranged from 0.47 to
3.12ml/g. The lowest value was observed in WF. There was no significant (p>0.05)
difference between the WAC of MF and WF as well as between that of PPF (1.10ml/g) and
MPF (0.93ml/g). These values were comparable with 1.10ml/g reported for pigeon pea flour
processed by dry method (Tiwari et al., 2008). Cassava cortex flour had the highest value
(3.12ml/g) and differed significantly (p<0.05) from all the other flour samples. This result
was comparable with 3.15 ml/g reported for fufu flour (Okoro, 2007). Water absorption
capacity describes flour-water association ability under limited water supply (Singh, 2001).
These results suggest that MF, PPF and MPF may find application in baked products such as
cookies. CCF may be incorporated at low levels.
The results obtained for swelling capacity of the flour samples ranged from 16.70 to
59.55% with the highest value observed in CCF. There was no significant (p>0.05) difference

43
between MF and MPF samples, while there were significant (p<0.05) differences between
PPF, CCF and WF. These results can be compared with results reported by Abulude et al.
(2006). Swelling capacity is a function of the process conditions, nature of the material and
type of treatment. Biopolymers such as starch and protein contribute to the development of
these characteristics (Ayernor, 1976).
The results obtained for pH of CCF was 4.20, while others ranged from 6.03 to 6.20.
It shows that there was no significant (p>0.05) difference between samples PPF and MPF as
well as between samples WF, MF and MPF, while that of cassava cortex flour differed
significantly (p<0.05) from all the other flour samples. This shows that CCF was more acidic
compared to the other flour samples. The low pH value of CCF may be attributed to the
fermentation process involved in the CCF processing. Acidic products are more shelf stable
than non-acidic counter parts (Ihekoronye and Ngoddy, 1985). Similar observations have
been made by Ikpeme et al. (2010) for wheat and taro flour.
4.3 Effect of Processing on the Micronutrient and Antinutrient Composition of
Millet, Pigeon pea and Cassava Cortex Flour
The results of the micronutrient and antinutrient contents of flour obtained from
millet, pigeon pea and cassava cortex are shown in Table 5.
Table 5: Micronutrient and antinutrient composition of flour from millet, pigeon pea
and cassava cortex
Micronutrients Millet Flour Pigeon peaFlour Cassava Cortex Flour
Phosphorus mg/100g) 228.2b±0.28 326.8
a±0.28 83.6
c±0.28
Iron (mg/100g 3.40a±0.01 1.04
c±0.03 3.31
b±0.01
Calcium (mg/100g) 240.0b±1.41 60.0
c±1.41 620.0
a±1.41
Potassium (mg/100g) 204.38b±0.03 232.76
a±0.06 34.06
c±0.06
ß-carotene (IU) 83.33c±0.28 1666.67
a±0.03 333.30
b±0.00
Vitamin B1(mg/100g) 1.0b±0.28 1.0±0.14
b 2.0
a±0.14
Vitamin B2(mg/100g) ND ND 0.08±0.02
Vitamin E (mg/100g) 0.8c±0.01 4.0
b±0.11 14.2
a±0.28
Antinutrients
Tannin (%) 0.25b±0.01 0.44
a±0.014 0.11
c±0.04
Phyate (%) 0.50b±0.01 1.13
a±0.03 1.0
a±0.11
Hemagglutinin (Hu/mg) 0.06b±0.03 0.45
a±0.04 0.04
b±0.02
HCN (%) 0.50b±0.03 1.90
a±0.01 0.45
b±0.01
Values are means ±S.D of duplicate determinations. Samples with different superscript within the same column were significantly (P<0.05) different.
Significant (p<0.05) difference were observed among the samples. The highest values for
phosphorus (326.8mg/100g), Iron (3.40mg/100g), calcium (620.0mg/100g) and potassium

44
(232.76mg/100g) were observed in pigeon pea flour, millet flour, cassava cortex flour and
pigeon pea flour, respectively. These values were higher than those reported for brown and
yellow tigernut flour by Oladele and Aina (2009), but calcium value in pigeon pea flour
(60.0mg/100g) compared well with the value (65.0mg/100g) reported for pigeon pea flour by
Arawande and Borokini (2010). The values of calcium found in these flour may be adequate
for bone and teeth development in infants. The Recommended Dietary Allowance (RDA) for
phosphorus, iron, calcium and potassium are 1000mg, 15mg, 1000mg and 2000mg
respectively (FAO/WHO, 1991).
Pigeon pea flour had highest value for ß-carotene (1666.67IU). Cassava cortex flour
contained 333.30IU ß-carotene, and had highest values for vitamin B1 (2.0mg/100g) Vitamin
B2 (0.08mg/100g) and vitamin E (14.2mg/100g). Vitamin B2 was not detected in millet flour
and pigeon pea flour. The B vitamins help the human body to metabolize energy, and are also
necessary for a healthy nervous and digestive system (Flour Advisory Bureau (FAB), 2012).
Significant (p<0.05) differences were observed in the entire antinutrients determined.
Fermentation and drying processes reduced the antinutrient levels of the flour to safe levels.
Seventy two (72) hours soaking in water reduced the hydrogen cyanide level of cassava
cortex to 0.45%. Liberated cyanide will usually dissolve in water when fermentation is
effected by prolonged soaking (Casadei, 1988). According to Roseling (1987), the toxic level
of cyanide is an intake above 20mg per 100g. Hydrogen cyanide level of millet flour (0.50%)
and pigeon pea flour (1.90%) observed in this study were lower than the value (9.85%)
obtained by Anuoye et al. (2012) for pigeon pea and unripe plantain blend.
Tannin levels ranged from 0.11% in cassava cortex flour to 0.44% in pigeon pea flour. These
levels were lower than 0.98% reported by Anuoye et al. (2012) for pigeon pea and unripe
plantain blend. Phytate levels ranged from 0.5% in millet flour to 1.13% in pigeon pea flour,
while haemagglutinin levels ranged from 0.04Hu/mg in cassava cortex flour to 0.45 Hu/mg in
pigeon pea flour. Bushway et al. (1984) reported that the maximum tolerable dose of phytate
in the body is from 250 to 500 mg/100g. Therefore phytate levels of flour observed in this
study may be considered safe. Hydrogen cyanide levels ranged from 0.45% in cassava cortex
flour to 1.9% in pigeon pea flour. The disparity in the micronutrient and antinutrient contents
of flour processed from millet, pigeon pea and cassava cortex is expected since the raw
materials completely differ.
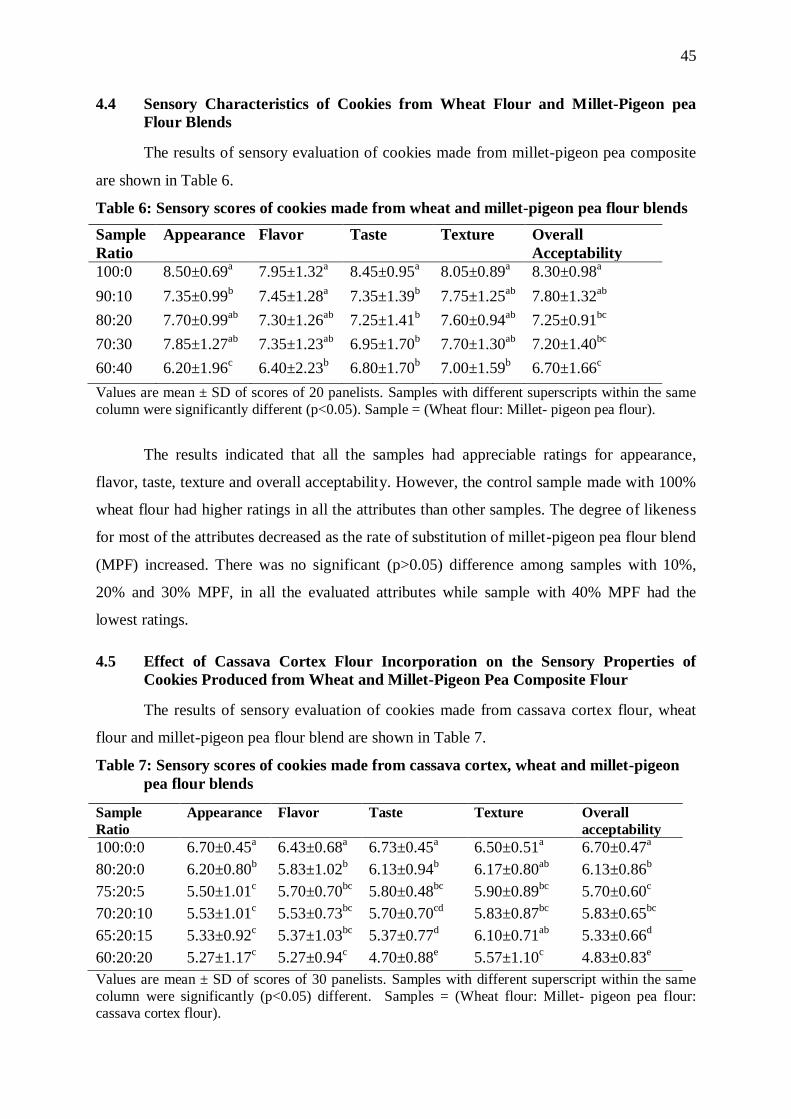
45
4.4 Sensory Characteristics of Cookies from Wheat Flour and Millet-Pigeon pea
Flour Blends
The results of sensory evaluation of cookies made from millet-pigeon pea composite
are shown in Table 6.
Table 6: Sensory scores of cookies made from wheat and millet-pigeon pea flour blends
Sample
Ratio
Appearance Flavor Taste Texture Overall
Acceptability
100:0 8.50±0.69a 7.95±1.32
a 8.45±0.95
a 8.05±0.89
a 8.30±0.98
a
90:10 7.35±0.99b 7.45±1.28
a 7.35±1.39
b 7.75±1.25
ab 7.80±1.32
ab
80:20 7.70±0.99ab
7.30±1.26ab
7.25±1.41b 7.60±0.94
ab 7.25±0.91
bc
70:30 7.85±1.27ab
7.35±1.23ab
6.95±1.70b 7.70±1.30
ab 7.20±1.40
bc
60:40 6.20±1.96c 6.40±2.23
b 6.80±1.70
b 7.00±1.59
b 6.70±1.66
c
Values are mean ± SD of scores of 20 panelists. Samples with different superscripts within the same
column were significantly different (p<0.05). Sample = (Wheat flour: Millet- pigeon pea flour).
The results indicated that all the samples had appreciable ratings for appearance,
flavor, taste, texture and overall acceptability. However, the control sample made with 100%
wheat flour had higher ratings in all the attributes than other samples. The degree of likeness
for most of the attributes decreased as the rate of substitution of millet-pigeon pea flour blend
(MPF) increased. There was no significant (p>0.05) difference among samples with 10%,
20% and 30% MPF, in all the evaluated attributes while sample with 40% MPF had the
lowest ratings.
4.5 Effect of Cassava Cortex Flour Incorporation on the Sensory Properties of
Cookies Produced from Wheat and Millet-Pigeon Pea Composite Flour The results of sensory evaluation of cookies made from cassava cortex flour, wheat
flour and millet-pigeon pea flour blend are shown in Table 7.
Table 7: Sensory scores of cookies made from cassava cortex, wheat and millet-pigeon
pea flour blends
Sample
Ratio
Appearance Flavor Taste Texture Overall
acceptability
100:0:0 6.70±0.45a 6.43±0.68
a 6.73±0.45
a 6.50±0.51
a 6.70±0.47
a
80:20:0 6.20±0.80b 5.83±1.02
b 6.13±0.94
b 6.17±0.80
ab 6.13±0.86
b
75:20:5 5.50±1.01c 5.70±0.70
bc 5.80±0.48
bc 5.90±0.89
bc 5.70±0.60
c
70:20:10 5.53±1.01c 5.53±0.73
bc 5.70±0.70
cd 5.83±0.87
bc 5.83±0.65
bc
65:20:15 5.33±0.92c 5.37±1.03
bc 5.37±0.77
d 6.10±0.71
ab 5.33±0.66
d
60:20:20 5.27±1.17c 5.27±0.94
c 4.70±0.88
e 5.57±1.10
c 4.83±0.83
e
Values are mean ± SD of scores of 30 panelists. Samples with different superscript within the same
column were significantly (p<0.05) different. Samples = (Wheat flour: Millet- pigeon pea flour:
cassava cortex flour).

46
The results show that all the samples had very good sensory ratings for appearance,
flavor, taste, texture and overall acceptability. The control sample made with 100% wheat
flour had significant (p<0.05) higher ratings than all the other samples in all the attributes
evaluated. This could be due to the fact that the panelists were familiar with commercial
cookies made with wheat flour.
In terms of appearance, the control sample with 100% wheat flour and sample with
0% cassava cortex flour differed significantly (p<0.05) from each other; and from samples
with 5%, 10%, 15% and 20% cassava cortex flour which did not differ among themselves.
The light brown colour of cassava cortex flour may have affected the appearance of the
samples since a sharp change in appearance was observed as soon as cassava cortex flour was
included (5%) and was maintained up to 20% inclusion.
There were no significant (p>0.05) differences in texture of samples without cassava
cortex flour and the sample which had 15% cassava cortex flour; as well as samples with 5%,
10%, and 15% cassava cortex flour. This shows that cassava cortex inclusion up to 15% level
did not affect the texture of the cookies. This may be attributed to its ability to soften when
hydrated. There was also no significant (p>0.05) difference between the samples with 0% and
5% cassava cortex flour and between samples with 5% and 10% cassava cortex flour in terms
of taste. However samples with 15% and 20% cassava cortex flour differed significantly
among themselves (p<0.05) and differed also from all other samples. This could be as a result
of the taste imparted by cassava cortex flour which manifested as the level of substitution
increased.
In overall acceptability, the control sample was significantly different from all the
other samples. However, there was no significant (p>0.05) difference between samples with
0% and 10% cassava cortex flour and between samples with 5% and 10% cassava cortex
flour. The degree of likeness in almost all the attributes decreased as the level of substitution
with cassava cortex flour increased. The high mean scores observed for colour, flavor, taste,
texture and overall acceptability indicated that all the cookies were of good quality. However,
sample with 20% cassava cortex flour appeared to be the least preferred considering its mean
scores for taste (4.70) and overall acceptability (4.83). This may be attributed to the higher
level of cassava cortex flour (20%) in this sample which conferred fibrous and hard texture to
the sample.

47
4.6 Sensory Characteristics of Extruded Snacks Made from Wheat, Cassava Cortex
and Millet-Pigeon Pea Flour Blends
Table 8 shows the results of the sensory evaluation of extruded snacks made from
cassava cortex flour, wheat flour and millet-pigeon pea flour blends.
Table 8: Sensory scores of extruded snacks made from cassava cortex, wheat and millet-
pigeon pea flour blends.
Sample
Ratio
Appearance Flavor Taste Texture Overall
acceptability
100:0:0 6.80±0.48a
6.33±0.48a
6.67±0.48a
6.33±0.48a
6.63±0.56a
80:20:0 6.63±0.89a
6.13±0.90a
6.37±0.77a
6.03±0.77ab
6.37±0.93a
75:20:5 5.87±0.94b
5.30±1.09b
5.80±0.81b
5.90±0.80ab
5.57±1.00b
70:20:10 5.23±0.82c
5.40±1.13b
5.67±1.03b
5.70±1.02bc
5.50±0.94b
65:20:15 4.67±1.16d
5.23±1.17b
5.20±1.22c
5.23±1.10cd
4.70±0.92c
60:20:20 4.07±1.68e
5.07±1.26b
4.93±1.02c
5.07±1.53d
4.67±1.09c
Values are mean ± SD of 30 panelists. Samples with different superscript within the same column
were significantly (p<0.05) different. Samples = (Wheat flour: Millet- pigeon pea flour: cassava
cortex flour).
The results indicate that all the samples had high sensory ratings for appearance,
flavour, taste, texture and overall acceptability. The control sample with 100% wheat flour
had the highest ratings in all the attributes evaluated. However, there were no significant
(p>0.05) differences between control sample and sample with 80:20:0 ratio in all the
attributes, while significant (p<0.05) differences were observed between the control and all
the other samples. In terms of appearance, samples with 0% cassava cortex flour differed
significantly (p<0.05) from samples with 5%, 10%, 15% and 20% cassava cortex flour. The
difference in appearance could be due to the brown colour of cassava cortex flour which
influenced the samples appearance from 5% to 20% incorporation and intensified as the level
of incorporation increased.
In terms of flavor, taste and overall acceptability, the samples with 0% cassava cortex
also differed significantly (p<0.05) from samples with 5%, 10%, 15% and 20% cassava
cortex flour. This may be attributed to the characteristic flavour of cassava cortex flour. The
degree of likeness decreased as the level of cassava cortex incorporation increased. The high
sensory ratings indicated that the extruded snacks were of good quality and were acceptable
by the panelists.
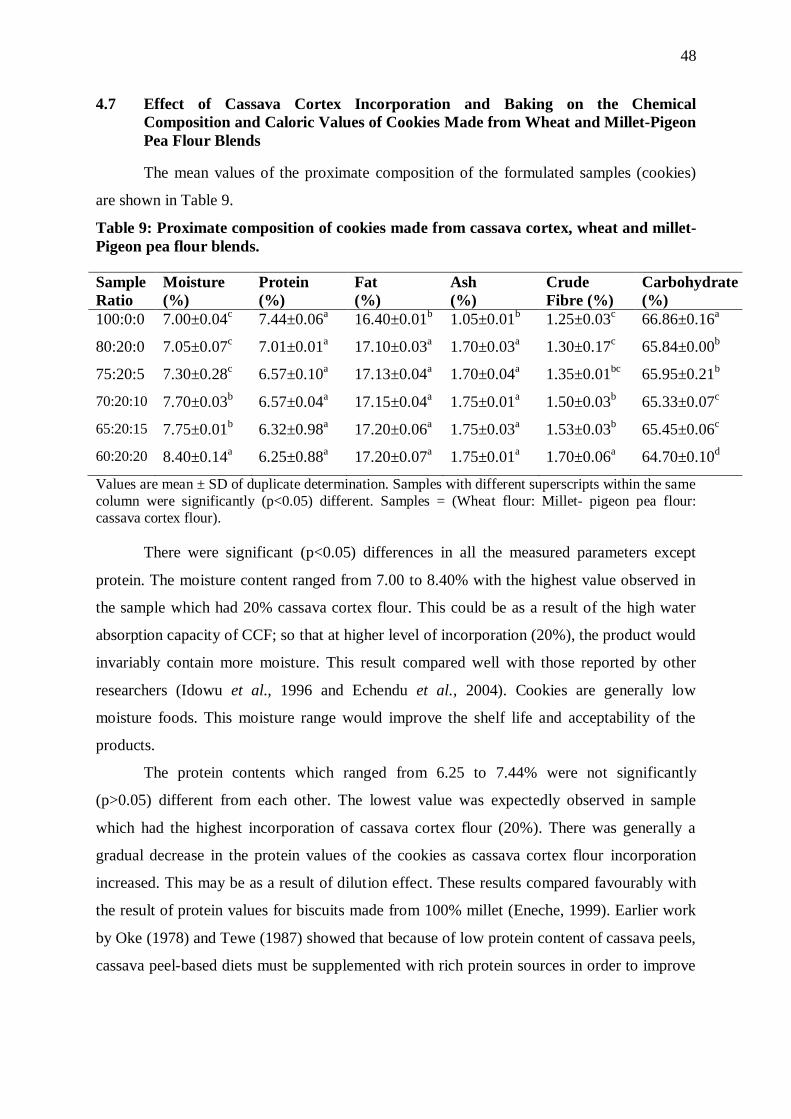
48
4.7 Effect of Cassava Cortex Incorporation and Baking on the Chemical
Composition and Caloric Values of Cookies Made from Wheat and Millet-Pigeon
Pea Flour Blends
The mean values of the proximate composition of the formulated samples (cookies)
are shown in Table 9.
Table 9: Proximate composition of cookies made from cassava cortex, wheat and millet-
Pigeon pea flour blends.
Sample
Ratio
Moisture
(%)
Protein
(%)
Fat
(%)
Ash
(%)
Crude
Fibre (%)
Carbohydrate
(%)
100:0:0 7.00±0.04c 7.44±0.06
a 16.40±0.01
b 1.05±0.01
b 1.25±0.03
c 66.86±0.16
a
80:20:0 7.05±0.07c 7.01±0.01
a 17.10±0.03
a 1.70±0.03
a 1.30±0.17
c 65.84±0.00
b
75:20:5 7.30±0.28c 6.57±0.10
a 17.13±0.04
a 1.70±0.04
a 1.35±0.01
bc 65.95±0.21
b
70:20:10 7.70±0.03b 6.57±0.04
a 17.15±0.04
a 1.75±0.01
a 1.50±0.03
b 65.33±0.07
c
65:20:15 7.75±0.01b 6.32±0.98
a 17.20±0.06
a 1.75±0.03
a 1.53±0.03
b 65.45±0.06
c
60:20:20 8.40±0.14a 6.25±0.88
a 17.20±0.07
a 1.75±0.01
a 1.70±0.06
a 64.70±0.10
d
Values are mean ± SD of duplicate determination. Samples with different superscripts within the same
column were significantly (p<0.05) different. Samples = (Wheat flour: Millet- pigeon pea flour:
cassava cortex flour).
There were significant (p<0.05) differences in all the measured parameters except
protein. The moisture content ranged from 7.00 to 8.40% with the highest value observed in
the sample which had 20% cassava cortex flour. This could be as a result of the high water
absorption capacity of CCF; so that at higher level of incorporation (20%), the product would
invariably contain more moisture. This result compared well with those reported by other
researchers (Idowu et al., 1996 and Echendu et al., 2004). Cookies are generally low
moisture foods. This moisture range would improve the shelf life and acceptability of the
products.
The protein contents which ranged from 6.25 to 7.44% were not significantly
(p>0.05) different from each other. The lowest value was expectedly observed in sample
which had the highest incorporation of cassava cortex flour (20%). There was generally a
gradual decrease in the protein values of the cookies as cassava cortex flour incorporation
increased. This may be as a result of dilution effect. These results compared favourably with
the result of protein values for biscuits made from 100% millet (Eneche, 1999). Earlier work
by Oke (1978) and Tewe (1987) showed that because of low protein content of cassava peels,
cassava peel-based diets must be supplemented with rich protein sources in order to improve
50

49
their palatability and nutrient density. These protein values observed for the formulated
cookies were however higher than the 5.1% noted by Pearson (1976)
The fat contents of the cookies were observed to be generally high. They ranged from
16.40 to 17.20% and only the control sample was significantly (p<0.05) different from all the
other samples. This could be as a result of the presence of millet and pigeon pea flour blends
in the other samples, since the same amount of fat was used for all the recipes. These values
were in agreement with various composite flour cookies formulated by other researchers
(Okpala, 2010; Giwa and Ikujenlola, 2010). Fat content of the cookies were within the
standard value for soft dough biscuits. Fats are an integral part of cookies being the third
largest component after flour and sugar (Manley, 2000). Cookies are in fact a rich source of
fat and carbohydrates hence, are energy giving food (Kure et al., 1998).
The ash contents of the formulated samples showed significant (p<0.05) difference
between the control and other samples with values ranging from 1.05 to 1.75%. The control
sample had the lowest value. The increase in ash content in all the other samples could be
attributed to the inclusion of cassava cortex, millet and pigeon pea flour in the recipe.
Comparable values of 1.5 to 2.0% were also observed by Eneche (1999).
The fibre contents of the cookies were lower than expected, considering the high
crude fibre value of cassava cortex flour. The values ranged from 1.25 to 1.70% and they
increased as the level of cassava cortex flour incorporation increased. There were significant
differences (p<0.05) among the samples. Similar values were obtained by other researchers
(Echendu et al., 2004, Giwa and Ikujenlola, 2010). However lower values of 0.0 to 0.1%
were obtained by Eneche (1999).
The carbohydrate contents of the formulated cookies were generally high, and ranged
from 64.70 to 66.86%. These values compared favourably with 61.0 to 66.5% and 68.29 to
74.34% ranges from previous works by Eneche (1999) and Magda et al. (2008) respectively.
The pH values of the cookies shown in Fig.6, ranged from 5.5 to 5.9. There was an
increase in pH as millet-pigeon pea flour was introduced. However, cassava cortex flour
inclusion lowered the pH to 5.8 in sample with 5% CCF; and to 5.5 in samples with 10%,
15% and 20% CCF incorporation. Low pH had been observed in cassava cortex flour.
The energy values of the formulated cookies shown in Fig.7, ranged from 422.43 to
428.84Kcal. The value slightly increased from 428.09kcal for the control to 428.84kcal for
sample ratio 80:20:0. This slight increase could be a function of the replacement of portions
of wheat flour (20%) with MPF. The energy values decreased with 5%, 10%, 15% and 20%
CCF incorporation. High fibre foods tend to be low in energy (Food Data Chart, 2012).

50
Protein, fat and carbohydrate values contributed to the calorie content of the cookies. Cookies
are energy-giving foods which are consumed by both young and old, especially in-between
meals. Consumption of 15-20 pieces of the formulated cookies can provide adequate energy
per day for children and for adults based on recommended dietary allowances (Okaka et al.,
1992).
Fig. 6: pH values of cookies A= cookies made from 100% wheat flour (WF) B= cookies made from 80% WF + 20% millet-pigeon pea flour (MPF)
C= cookies made from 75% WF + 20% MPF+ 5% cassava cortex (CCF)
D= cookies made from 70% WF + 20% MPF + 10% CCF
Fig. 7: Energy Values of Cookies A= cookies made from 100% wheat flour (WF)
B= cookies made from 80% WF + 20% millet-pigeon pea flour (MPF) C= cookies made from 75% WF + 20% MPF+ 5% cassava cortex (CCF)
D= cookies made from 70% WF + 20% MPF + 10% CCF
E = cookies made from 65% WF + 20% MPF +15% CCF
F = cookies made from 60% WF + 20% MPF + 20% CCF
E = cookies made from 65% WF + 20% MPF +15% CCF F = cookies made from 60% WF + 20% MPF + 20% CCF

51
4.8 Effect of Cassava Cortex Incorporation and Extrusion Cooking on the Chemical
Composition and Caloric Values of Extruded Snacks from Wheat and Millet-
Pigeon Pea Flour Blends
The mean values of the proximate composition of the formulated extruded snacks are
shown in Table 10.
Table 10: Proximate Composition of Extruded Snacks from Wheat, Cassava Cortex and
Millet/Pigeon Pea Flour Blends. Sample Moisture (%) Protein (%) Fat (%) Ash (%) Crude fibre (%) Carbohydrate (%)
100:0:0 5.15 0.03d 8.32 0.03
c 13.75 0.04
e 1.60 0.03
b 1.15 0.07
d 70.03 0.01
a
80:20:0 5.25 0.03cd
13.76 0.06a 15.05 0.07
d 1.65 0.04
b 1.20 0.04
cd 63.09 0.07
f
75:20:5 5.45 0.10c 12.26 0.08
b 15.65 0.07
c 1.65 0.00
b 1.30 0.03
bc 63.69 0.28
e
70:20:10 5.95 0.21b 7.01 0.03
d 15.65 0.14
bc 1.80 0.04
a 1.35 0.01
b 68.24 0.14
b
65:20:15 6.10 0.03b 7.01 0.04
d 15.75 0.03
b 1.85 0.03
a 1.40 0.07
b 67.89 0.11
c
60:20:20 7.10 0.01a 6.57 0.04
e 16.00 0.01
a 1.85 0.04
a 1.70 0.03
a 66.78 0.03
d
Values are mean ± SD of duplicate determination. Samples with different superscripts within the same column
were significantly (p<0.05) different. Samples = (Wheat flour: Millet- pigeon pea flour: cassava cortex flour).
The results show significant p<0.05 differences between the samples. The moisture
content ranged from 5.15 to 7.10%. The control sample with 100% wheat flour had the
lowest value. This may be as a result of the absence of cassava cortex flour, which was
observed in this study to have high water absorption capacity (3.12ml/g). The crude protein
values ranged from 6.57 to 13.76%. The lowest value was observed in sample which had the
highest level (20%) of cassava cortex flour incorporation, while the highest value was
observed in the sample which contained 80% WF and 20% MPF blend. This may be due to
dilution effect of addition of CCF that has low protein content (3.94%)
The protein values were retained more in the extruded snacks than in the cookies.
However, extrusion cooking has been shown to cause relatively small losses of essential
amino acids (Harper, 1979). The fat content which ranged from 13.75 to 16.00% with the
lowest value observed in the control sample, was significantly (p<0.05) different among the
samples. The fat content increased as MPF was introduced into the recipes. The ash and
crude fibre contents ranged from 1.60 to 1.85% and 1.15 to 1.70%, respectively. The ash
contents were higher than the values obtained for cookies while the crude fibre contents were
similar to those of the cookies.
The carbohydrate values ranged from 63.09 to 70.03% with the control sample having
the highest value. The high level of carbohydrate in the samples may be due to high level of
baking fat and cassava cortex inclusion. These values were however, similar to those of the
cookies. Extrusion cooking did not affect carbohydrate content of samples. These values
53

52
compared well with the results (70.76-79.58%) obtained by Iwe and Ngoddy (1998), from
extrudates of 70 to 90% sample mixtures of soy and sweet potato flour.
The pH values shown in Fig. 8 ranged from 5.8 to 6.0. During extrusion cooking, pH
of samples are often adjusted; lower pH range increases chewiness in the final product,
whereas a higher pH (8.5) produces a tender product and more rapid rehydration (Fellows,
2000).
The values obtained for the total energy content of the formulated samples (extruded
snacks) are shown in Fig. 9. The values ranged from 419.64 to 428.73Kcal and were higher
than the values (383.4 - 400.0Kcal) recorded for extruded Bambara-Acha containing graded
levels of carrot (Okafor, 2009). This may be attributed to the higher fat values observed in
this study. However extruded snacks showed the same trend observed in the cookies as CCF
was incorporated. Consumption of 100g of the extruded snacks may provide adequate energy
per day based on the recommended dietary allowance for children (7.6MJ) and adults
(10.8MJ) (Okaka et al., 1992).
Fig. 8 pH values of extruded snacks
G = extruded snacks made from 100% wheat flour (WF)
H= extruded snacks made from 80% WF + 20% millet-pigeon pea flour (MPF)
I= extruded snacks made from 75% WF + 20% MPF+ 5% cassava cortex (CCF)
J= extruded snacks made from 70% WF + 20% MPF + 10% CCF
K = extruded snacks made from 65% WF + 20% MPF +15% CCF
L= extruded snacks made from 60% WF + 20% MPF + 20% CCF

53
Fig. 9 Energy values of extruded snacks
4.9 Effects of Cassava Cortex Flour Inclusion, Extrusion Cooking and Baking on
Some Mineral Content of Cookies and Extruded Snacks made from Wheat and
Millet-Pigeon Pea Flour Blends
The results of evaluation of the snacks (cookies and extruded snacks) for some
minerals are shown in Table 11.
Table 11: Mineral composition of cookies and extruded snacks from their composite blends
Sample Phosphorus Iron Calcium Potassium
Ratio (mg/100g) (mg/100g) (mg/100g) (mg/100g)
Cookies
100:0:0 121.6 0.28c 0.21 0.01
b 40.0 1.41
b 79.48 0.03
e
80:20:0 121.6 0.14c 0.41 0.28
a 40.0 2.83
b 124.90 0.03
b
75:20:5 106.4 0.57e 0.21 0.28
b 50.0 4.24
a 113.54 0.01
d
70:20:10 136.8 0.28b 0.41 0.01
a 50.0 1.41
a 139.09 0.06
a
65:20:15 144.4 0.28a 0.43 0.01
a 52.0 2.83
a 116.38 0.01
c
60:20:20 114.4 0.28d 0.41 0.28
a 56.0 2.83
a 113.54 0.01
d
Extruded Snacks
100:0:0 144.4 0.14b 0.41 0.01
c 60.0 1.41
b 96.51 0.01
d
80:20:0 152.0 0.14a 1.04 0.03
c 60.0 2.30
b 96.51 0.03
d
75:20:5 152.0 0.14a 1.67 0.03
b 62.0 2.30
b 147.61 0.04
c
70:20:10 114.0 0.30d 1.62 0.03
b 63.0 1.41
b 147.96 0.22
c
65:20:15 136.8 0.60c 2.48 0.02
a 65.0 2.30
a 149.22 0.03
b
60:20:20 136.8 0.30c 2.48 0.03
a 70.0 1.41
a 196.51 0.01
a
Values are mean ± SD of duplicate determination. Samples with different superscripts within the same column were significantly (p<0.05) different. Samples = (Wheat flour: Millet- pigeon pea flour:
cassava cortex flour).
G = extruded snacks made from 100% wheat flour (WF)
H= extruded snacks made from 80% WF + 20% millet-pigeon pea flour (MPF) I= extruded snacks made from 75% WF + 20% MPF+ 5% cassava cortex (CCF)
J= extruded snacks made from 70% WF + 20% MPF + 10% CCF
K = extruded snacks made from 65% WF + 20% MPF +15% CCF
L= extruded snacks made from 60% WF + 20% MPF + 20% CCF

54
The calcium content obtained for cookies ranged between 40.0 and 56.0 mg/100g,
while those obtained for extruded snacks ranged between 60.0 and 70.0mg/100g. Significant
(p<0.05) differences were observed among the samples. The calcium contents of both the
cookies and the extruded snacks increased as the level of incorporation of cassava cortex
flour increased. This may be as a result of high values of calcium (620mg/100g) in cassava
cortex flour, observed in this study. About 100g of these formulated products can provide
more than 10% of the recommended calcium intake. The current recommended nutrient
intake (RNI) for calcium is 600mg a day for children and 1000mg a day for an adult
(FAO/WHO, 2002).
The phosphorus content obtained for the cookies ranged from 106.4mg/100g to
144.4mg/100g, while those of the extruded snacks ranged from 114.0mg/100g to
152.0mg/100g. There were significant (p<0.05) differences among the samples. These values
were appreciably high for 100g of the formulated sample to provide 15 to 20% of the RDA
(700mg). Enough phosphorus is required for maintaining body functions and production of
energy. It works alongside with calcium to maintain healthy teeth and bones (FAB, 2012).
The iron content of the cookies ranged from 0.21 to 0.41mg/100g. There was no
significant (p>0.05) differences between the control sample and sample with 5% cassava
cortex flour. Samples with 0%, 10%, 15% and 20% were also not significantly (p>0.05)
different from one another. The extruded snacks‟ iron content ranged from 0.41 to
2.48mg/100mg. The iron contents of the cookies and extruded snacks increased with
increasing addition of cassava cortex flour.
The potassium content of the formulated cookies and extruded snacks ranged from
79.48 to139.09mg/100g and from 96.51 to 196.51mg/100g respectively. The lowest values
were found in the control samples. This may be attributed to the presence of MPF present in
all the samples except the control samples. Millet and pigeon pea flour were high in
potassium. Consumption of 100g of cookies and extruded snacks will provide about 5% of
RDA for potassium (3500mg).
It was generally observed that all the mineral contents were higher in the extruded
snacks than in the cookies. Hot extrusion is a HTST process, which minimizes the loss of
nutrients (Fellows, 2000).

55
4.10 Effects of Cassava Cortex Flour Inclusion, Extrusion Cooking and Baking on
Some Vitamin Content of Cookies and Extruded Snacks made from Wheat and
Millet-Pigeon pea Flour Blends
The values obtained for some vitamin contents of cookies and extruded snack samples
are shown in Table 12.
Table 12: Vitamin composition of cookies and extruded snacks from their composite
blends
Sample Vitamins
Ratio ß-carotene (IU) B1 (mg/100g) B2 (mg/100g) E (mg/100g)
Cookies
100:0:0 250.00 2.83e 2.00 0.14
a ND 1.8 0.01
b
80:20:0 500.00 1.41a 2.00 0.30
a 0.03 0.001
b 1.0 0.14
c
75:20:5 416.67 0.03b 1.00 0.14
b 0.05 0.003
a 1.8 0.03
b
70:20:10 416.67 2.12b 1.00 0.30
b ND 1.8 0.00
b
65:20:15 333.33 0.14d 1.00 0.30
b ND 2.8 0.01
a
60:20:20 333.30 0.42d 1.00 0.14
b 0.03 0.003
b 2.8 0.03
a
Extruded Snacks
100:0:0 250.00 1.41c 2.00 0.14
a 0.02 0.001
bc 2.8 0.00
a
80:20:0 250.00 0.00c 2.00 0.30
a ND 1.0 0.14
d
75:20:5 416.67 0.01a 1.00 0.14
b 0.03 0.021
bc 1.2 0.01
c
70:20:10 416.67 0.71a ND 0.04 0.004
ab 1.8 0.01
b
65:20:15 416.67 0.01a ND 0.03 0.011
ab 1.8 0.03
b
60:20:20 333.30 0.30b ND 0.05 0.001
a 1.8 0.01
b
Values are mean ± SD of duplicate determination. Samples with different superscripts within the same column were significantly (p<0.05) different. Samples = (Wheat flour: Millet- pigeon pea flour:
cassava cortex flour).
ND = Not detected
The ß-carotene contents ranged from 250 to 500 IU and from 250 to 416.67IU for
cookies and extruded snacks, respectively. There were significant (p<0.05) differences
among the samples. However, the control samples had the lowest values. The higher values
in all the other samples can be attributed to the flour samples used for formulating these
samples especially pigeon pea flour, which had a higher value of ß-carotene. Cassava cortex
flour also had a high ß-carotene value (333.30IU)
Vitamin B1 (Thiamine) contents of the formulated cookies and extruded snacks
ranged from 1.00 to 2.00mg/100g and from 0.00 to 2.00mg/100g respectively. These values
showed significant (p<0.05) differences. Consumption of 100g of these cookies and extruded
snacks can provide the US RDA for children (0.3-1.3mg/100g) and adults (1.5 - 1.6mg/100g)
(Okaka et al., 1992).

56
The vitamin B2 (Riboflavin) content of the formulated cookies and extruded snacks
ranged from 0.00 to 0.05mg/100g and from 0.00 to 0.05mg/100g respectively. The obtained
values may be attributed to the cassava cortex flour inclusion because millet flour and pigeon
pea flour had no values for riboflavin. The vitamin B2 was retained more in the extruded
samples than in the cookies. These values are lower than the US RDA for children (0.4 –
0.8mg/100g) and for adults (1.1 – 1.7mg/100g). However 100g of the samples can provide 15
– 20% of the RDA.
The vitamin E contents of the formulated cookies and extruded snacks ranged
between 1.0mg/100g and 2.8mg/100g. Significant (p<0.05) differences were observed among
the samples. The values decreased as millet- pigeon pea flour was introduced, however a
significant (p<0.05) increase was observed on inclusion of cassava cortex flour. The values
were affected by baking and extrusion cooking since the vitamin E content of cassava cortex
flour was 14.2mg/100g in this study.
4.11 Effects of Baking and Extrusion Cooking on the Antinutrient Composition of
Cookies and Extruded Snacks Formulated from Wheat, Cassava Cortex and
Millet-Pigeon pea Flour Blends
The result of the antinutrient content of the cookies and extruded snacks are shown in
Table 13.
Table 13: Antinutrient composition of cookies and extruded snacks formulated from
wheat, cassava cortex and millet-pigeon pea flour blends
Sample Tannin (%) Phytate (%) Hemagglutinin Hydrogen cyanide (%)
(Hu/mg)
Cookies
100:0:0 0.09 0.001e 1.00 0.14
a 0.14 0.01
a 0.55 0.01
d
80:20:0 0.17 0.004b 1.00 0.14
a 0.09 0.01
b 1.45 0.28
a
75:20:5 0.17 0.006b 0.63 0.01
b 0.14 0.01
a 1.20 0.01
b
70:20:10 0.14 0.003c 1.00 0.28
a 0.15 0.01
a 0.80 0.28
c
65:20:15 0.10 0.004d 1.13 0.01
a 0.11 2.8
ab 0.75 0.01
c
60:20:20 0.09 0.003e 0.63 0.01
b 0.09 0.01
b 0.80 0.01
c
Extruded Snacks
100:0:0 0.14 0.003e 0.75 0.03
b ND 1.15 0.28
b
80:20:0 0.26 0.003c 0.63 0.03
c 0.08 0.01
b 1.05 0.00
c
75:20:5 0.33 0.004a 1.13 0.03
a 0.03 0.01
c 1.30 0.01
a
70:20:10 0.32 0.006a 1.13 0.01
a 0.04 0.03
bc 1.30 0.04
a
65:20:15 0.18 0.003d 1.13 0.06
a 0.06 0.01
b 0.75 0.01
d
60:20:20 0.18 0.006d 1.13 0.06
a 0.13 0.01
a 1.05 0.04
c
Values are mean ± SD of duplicate determination. Samples with different superscripts within the same
column were significantly (p<0.05) different. Samples = (Wheat flour: Millet- pigeon pea flour:
cassava cortex flour).
ND = Not detected
57
The tannin content of the cookies and extruded snacks ranged from 0.09 to 0.17% and
from 0.14 to 0.33% respectively, with the lowest values observed in the control samples.
Significant (p<0.05) differences existed among the samples. Tannin level decreased with
increase in cassava cortex flour. Baking reduced the tannin level by 79.55%, while extrusion
cooking reduced it by 68.18%. Tannins form insoluble complexes with proteins thereby
decreasing its digestibility (Uzoechina, 2007)
Hemagglutinin values for cookies ranged from 0.09 to 0.15 Hu/mg while the values
for extruded snacks ranged from 0.00 to 0.13Hu/mg. Hydrogen cyanide content values
ranged from 0.55 to 1.45% for cookies and 0.75 to 1.30% for extruded snacks. The phytate
content of the cookies and extruded snacks samples ranged from 0.63 to 1.13% and from 0.63
to1.13% respectively. These values were quite lower than the lethal dose for phytate (250 to
500mg/100g) reported by Bushway et al. (1984). The values obtained agreed reasonably
well with phytate levels of 0.56 to 0.70mg/100g reported by Okpala and Okoli (2011). It is
expected that phytate lowering should enhance the bioavailability of minerals such as iron in
the cookies and extruded snacks as phytic acid makes such minerals unavailable (Anuonye et
al., 2009).
Baking and extrusion reduced the antinutrient contents of the formulated samples,
since these values were lower than the antinutrient values of the flour used for the product
formulations. The tannin content reduced from 0.44% in the flour to 0.33% in the products,
hemagglutinin reduced from 0.45 Hu/mg in the flour to 0.15 Hu/mg in the products,
hydrogen cyanide reduced from 1.90% in the flour to 1.45% in the products. Okpala and
okoli (2011) reported low levels of hydrogen cyanide (0.16 to 0.24mg/100g), phytic acid
(0.56 to 0.70mg/100g), and tannins (0.36 to 0.51mg/100g) in cookies produced from pigeon
pea, cocoyam and sorghum flour blends.
4.12 Microbial Counts of Cookies and Extruded Snacks made from Wheat, Cassava
Cortex and Millet-Pigeon pea Flour blends.
The microbial count of the formulated cookies and extruded snacks are as shown in
Table 14.

58
Table14: Microbial counts of cookies and extruded snacks made from wheat,
cassava cortex and millet-pigeon pea flour blends.
Sample Bacteria count
(cfu/g)
Mould count
(cfu/g)
Coliform count
(cfu/g)
Cookies
100:0:0
0.2x10
0.25 x10
NG
80:20:0 0.8x10² 0.8 x10
2 NG
75:20:5 0.2x10 NG NG
70:20:10 NG 0.8 x10² NG
65:20:15 0.3 x10 0.2 x10² NG
60:20:20 NG 0.2 x10² NG
Extruded Snacks
100:0:0
NG
0.8 x10²
NG
80:20:0 0.8 x10² NG NG
75:20:5 0.8 x10² NG NG
70:20:10 0.8 x10² 0.3 x10 NG
65:20:15 0.8 x10² 0.25 x10
2 NG
60:20:20 0.8 x10² 0.3 x10 NG
Samples = (Wheat flour: Millet- pigeon pea flour: cassava cortex flour)
(NG) = No growth
The samples had very low levels of bacteria and mould growth. Coliforms were not
detected in the samples. The bacteria and mould counts both ranged from 0.2 x 10 cfu/g to
0.8 x 10² cfu/g. The presence of microorganisms in these samples may be attributed to the
fact that the microbial analysis was not carried out on the zero day. There may have been
contamination in the cause of keeping the samples, as the samples were kept for about 90
days before the microbial analysis. However these counts were within acceptable limits
(Fawole and Oso, 1988).
4.13 Effects of Cookies on the Biochemical Indices of Rats
Table 15 shows the effect of some formulated cookies on the lipid profile of wister
rats.

59
Table15: Effect of Consumption of the Cookies on the Lipid Profile of Wister Rats
Cholesterol (mg/dl) Triglyceride(mg/dl) HDL(mg/dl) LDL(mg/dl)
Initial Final Initial Final Initial Final Initial Final
A 72.80a±16.63 38.50
c±8.51 51.34
a±8.03 48.00
b±11.31 24.40
a±8.99 11.95
b±5.11 48.40
a±29.33 26.55
d±4.96
B 69.60a±15.52 73.50
b±7.26 59.80
a±10.66 66.00
ab±11.31 20.60
a±8.88 21.98
ab±2.69 49.50
a±9.85 51.03
c±8.48
C 79.50a±15.17 100.00
a±8.16 55.74
a±7.88 70.75
a±4.99 31.80
a±11.56 36.98
a±7.18 47.20
a±10.08 83.03
b2.61
D 65.50a±16.58 90.00
a±8.17 49.80
a±13.23 61.25
ab±8.62 22.40
a±10.78 25.30
ab±5.72 42.60
a±15.61 59.90
a±2.09
Values are mean ± SD (n = 5).
Samples with different superscript within the same column were significantly (p<0.05) different
A = Rat group fed sample A (100% wheat flour)
B = Rat group fed sample B (80% wheat flour + 20% Millet-pigeon pea flour)
C = Rat group fed sample C (70% wheat flour + 20% Millet-pigeon pea flour + 10% Cassava cortex flour)
D = Control rat group fed commercial rat feed

60
There was no significant (p>0.05) difference in the initial values of the lipid profile. However
after 28 days of feeding, significant (p<0.05) decrease was observed in the total cholesterol,
triglyceride, high density lipoprotein (HDL) and low density lipoprotein (LDL) levels of rats
fed sample A (cookies made from 100% wheat flour). This is a reverse of what was observed
in the control group fed normal feed for rats. There was significant (p<0.05) increase in the
total cholesterol level, triglyceride, HDL and LDL-Cholesterol. However, rats fed sample B
(cookies made from blend of 80% wheat flour (WF) and 20% millet/pigeon pea flour (MPF)
and rats fed sample C (cookies made from blend of 70% WF, 20% MPF and 10% cassava
cortex flour) showed same trend with the control group.
At the beginning of the experiment, all the rats had normal levels of total cholesterol
(<200mg/dl), triglycerides (<150mg/dl) and LDL-cholesterol (<130mg/dl) (Disabled world,
2008). Although significant (p<0.05) increase was observed in these lipids, their final levels
were still within acceptable ranges. These results compared well with results obtained by
Bayol et al. (2008) where feeding rats with processed foods rich in fat, sugar and salt such as
doughnuts and biscuits led to raised levels of cholesterol as well as higher levels of
triglycerides. HDL-cholesterol for all the rat groups were lower than normal range
(>50mg/dl) and remained lower than 50mg/dl at the end of the experiment. However,
addition of cassava cortex flour (fibre) improved the HDL-cholesterol of rats fed sample C by
16.39% (36.98). This shows that prolonged consumption of foods with such fibre may help
bring HDL-cholesterol to its normal range. According to Disabled world (2008), the
borderline for HDL-cholesterol is 50-35mg/dl and high risk level is less than35mg/dl.
Significant increase of total cholesterol and lowering in HDL-cholesterol is an
undesirable biochemical state for avoidance of atherosclerosis and ischaemic conditions.
Increase in the ratio of total cholesterol/HDL-Cholesterol increases the risk of heart disease
(Luc and Fruchart, 1991).
Effect on blood glucose
The effect of some of the formulated cookies on the blood glucose level of rats is
shown in Fig. 10. After 14 days of feeding, there was a significant (p<0.05) fall in the blood
glucose level of rats fed samples A and B. A significant (p<0.05) decrease was also observed
in rats fed sample C. This is possibly due to cassava cortex flour inclusion in the diet. The
blood glucose level of the rats fed sample B increased gradually after 21 days. However,
none of these increases was beyond 100mg/dl. This is expected because the nutrient density
of the cookies was not high enough to cause significant increase in their blood glucose level.

61
Only the control group showed significant (p<0.05) increase in blood glucose level after 14
and 21 days. However the increase was not above 140 mg/dl. Similar findings have been
reported by Bayol et al. (2008).
LEGEND
A = Rat group fed sample A (100% wheat flour)
B = Rat group fed sample B (80% wheat flour + 20% Millet-pigeon pea flour)
C = Rat group fed sample C (70% wheat flour + 20% Millet-pigeon pea flour + 10% Cassava
cortex flour)
D = Control rat group fed commercial rat feed
Effect on Feed Intake, Water Intake and Body Weight
There was significant (p<0.05) increase in feed intake (Fig. 11) of the control group
rats. In the rats fed with samples A, B and C there was decrease in the feed intake. This may
be due to their not being psychologically adapted to abnormal feed. In control group of
animals, significant (p<0.05) increase in water intake was observed after 7 days and 14 days,
while in the other groups of animals fed samples A, B, and C, there was decrease in their
water intake (Fig. 12). Expectedly, the control group rats gained weight significantly
(p<0.05), while rats in groups fed with sample A and B gained very little weight. On the other
hand rats fed sample C lost some weight (Fig.13). This may be due to cassava cortex flour
(fibre source) inclusion in sample cookies. One of the many health benefits of fibre is
increased satiety and hence some degree of weight management (Mickelson et al., 1979).
B
lood
glu
cose
(m
g/d
l)
Time (Weeks)
Fig. 10: Weekly Changes in blood glucose level of rats fed cookies samples
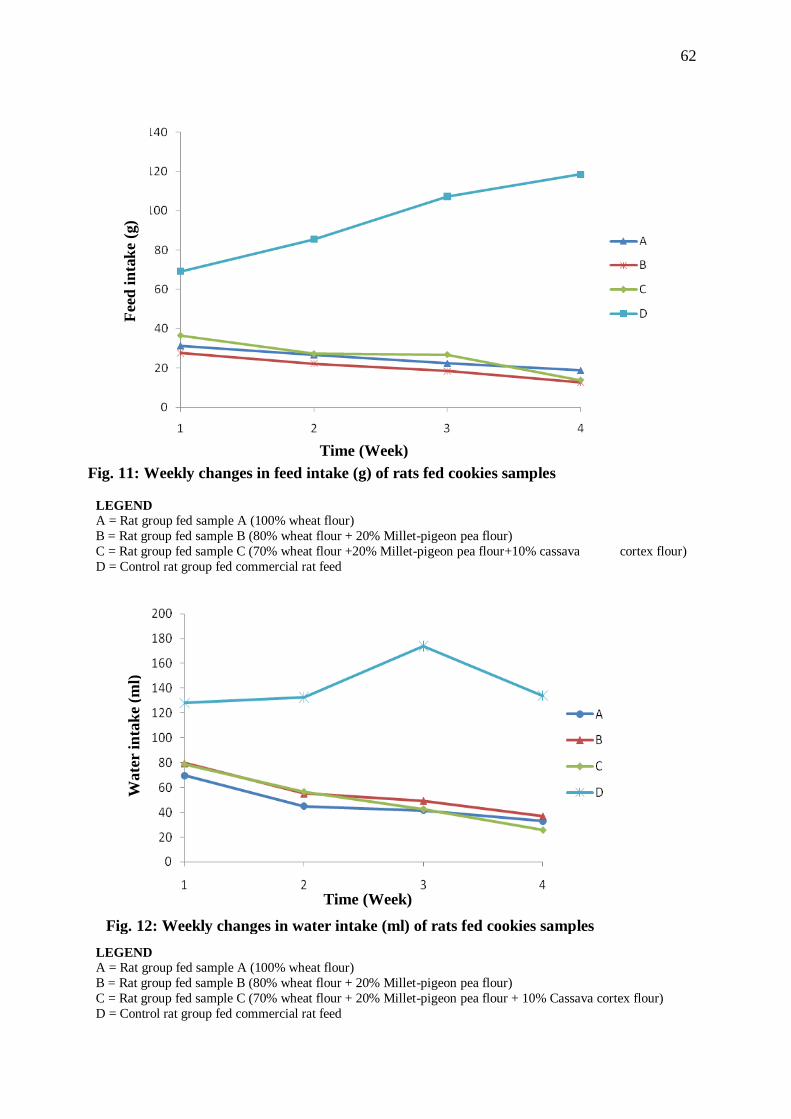
62
LEGEND A = Rat group fed sample A (100% wheat flour)
B = Rat group fed sample B (80% wheat flour + 20% Millet-pigeon pea flour)
C = Rat group fed sample C (70% wheat flour +20% Millet-pigeon pea flour+10% cassava cortex flour)
D = Control rat group fed commercial rat feed
LEGEND A = Rat group fed sample A (100% wheat flour)
B = Rat group fed sample B (80% wheat flour + 20% Millet-pigeon pea flour)
C = Rat group fed sample C (70% wheat flour + 20% Millet-pigeon pea flour + 10% Cassava cortex flour)
D = Control rat group fed commercial rat feed
F
eed
in
tak
e (g
)
Time (Week)
Fig. 11: Weekly changes in feed intake (g) of rats fed cookies samples
W
ate
r in
tak
e (m
l)
Time (Week)
Fig. 12: Weekly changes in water intake (ml) of rats fed cookies samples

63
Fig. 13 Total weight gain of rats fed cookies samples
LEGEND
A = Rat group fed sample A (100% wheat flour)
B = Rat group fed sample B (80% wheat flour + 20% Millet-pigeon pea flour)
C = Rat group fed sample C (70% wheat flour + 20% Millet-pigeon pea flour + 10% Cassava cortex flour)
D = Control rat fed commercial rat feed

64
CHAPTER FIVE
CONCLUSION AND RECOMMENDATION
The study has shown that acceptable baked and extruded products could be produced
from wheat flour, cassava cortex flour, millet and pigeon pea flour blends. These composite
flour and their products were good sources of protein (6.57 to13.76%), energy and some
micronutrients such as vitamins and minerals. The calcium content of the products ranged
from 40 to 70mg/100g, potassium 79.48 to 196.51mg/100g and the ß-carotene ranged from
250 to 500IU. Flour processing improved the nutritional values of the flour and reduced
antinutrients in the products significantly (p<0.05). The tannin content reduced from 0.44%
in the flour to 0.33% in the products, hemagglutinin reduced from 0.45 Hu/mg in the flour to
0.15 Hu/mg in the products, hydrogen cyanide reduced from 1.90% in the flour to 1.45% in
the products. Cassava cortex flour inclusion did not have any negative effect on the products
but rather improved the mineral and vitamin contents of the products. However, higher levels
of incorporation above 10% may not produce good acceptable products. Baking was
identified as a good processing method but the nutrients were retained more using the
extrusion cooking process. The experimental rats maintained normal levels of total
cholesterol, triglycerides and LDL-cholesterol, while HDL-cholesterol was on the low side
throughout the period of study. However cassava cortex inclusion in their diet improved
HDL-cholesterol from 31.80 to 36.98mg/dl, decreased blood glucose and maintained a
normal range afterwards. It also resulted to weight loss. Consumption of fibre from cassava
cortex may therefore be encouraged in humans since some nutritional and health benefits
were observed in this study.
Recommendation
1. Higher level of enrichment with pigeon pea flour is encouraged to beef up the
protein level of the products
2. The use of extrusion cooking should be encouraged in the production of cereal-
legume based snacks because it improves protein quality, reduces antinutreints
and enhances acceptability of product.
3. Storage studies should be carried out on these products to determine their shelf
stability.
4. Further research should be carried out to find out the effects of these products on
rats where all the rat groups will be fed with normal diets and cookies samples
introduced as treatments in the feed formulations, since cookies are not full meals
but complements to other foods. They are not a significant item of nutrition.
65
REFERENCES
A.O.A.C., (2010). Official Methods of Analysis, 17th ed. Association of Official Analytical
Chemists, Washington, D.C., U.S.A.
Abulude, O., Olawale, L.L. and Olaleye, M.F. (2006). Effects of Processing on Physical and
Functional Properties of Groundnut (Arachis hypogea) Flour. Electronic Journal of
Environmental, Agricultural and Food Chemistry, 5(4): 1457-1491.
Aderemi, F.A., Ladokun, O.A. and Tewe, O.O. (2004). Study of Hematology and Serum
Biochemistry of Layers Fed Biodegraded Cassava Root Sieviate. Bowen Journal of
Agriculture, 1 (1): 79 - 83.
Adeyanju, S.A. and Pido, P.P. (1978). The Feeding Value of Fermented Cassava Peels in
Broiler Diets. Nutrition Report International, 18:79-86.
Agunbiade, S.O. and Ojezele, M.O. (2010). Quality Evaluation of Instant Breakfast Cereals
Fabricated from Maize Sorghum Soybean and African Yam Bean (Sphenostylis
stenocarpa). World Journal of Dairy and Food Science, 5(1): 67-72.
Akpapunam, M.A. and Darbe, J.W. (1994). Chemical Composition and Functional Properties
of Blends of Maize and Bambara Groundnut Flours for Cookies Production. Plant
Foods for Human Nutrition, 46: 147-155
Akubor, P.I. and Badifu, G.I.O. (2004). Chemical Composition, Properties and Baking
Potentials of African Breadfruit Kernel and Wheat Flour Blends. Inernational Journal
of Food Science and Technology, 39: 223-229.
American Diabetes Association (2003). Clinical Practice Recommendations. Diabetes care,
26:1-22.
Anderson, R. L. and Wolf, W. J. (1995). Compositional Changes in Trypsin Inhibitors, Phytic
Acid, Saponins and Isoflavones Related to Soybean Processing. Journal of Nutrition,
125, 581S-588S.
Anderson, J. W., Baird, P. and Richard, H. (2009). Health Benefits of Dietary Fibre Nutrition
Review 67 (4)188-205
Anon (2003). State of the Industry, Snack Food & Wholesale Bakery, pp 92.
Anon (2006). FoodWasteRecovery.
http://www.ciwmb.ca.gov/LGlibrary/Innovations/FoodWaste/program.htm.
Anuonye, J.C., Onuh J. O., Egwim E. and Adeyemo S.O. (2009). Nutrient and Antinutrient
Composition of Extruded Acha/Soybean Blends. Journal of Food Processing and
Preservation
Anuoye J. C., Jigam A. A. and Ndaceko G. M. (2012). Effects of Extrusion –cooking on the
Nutrient and Antinutrient Composition of Pigeon pea and Unripe Plantain Blends.
Journal of Applied Pharmaceutical Sciences 02 (05): 158-162.
66
Arawande, J.O. and Borokini, F.B. (2010). Comparative Study on Chemical Composition and
Functional Properties of Three Nigerian Legumes (Jack Beans, Pigeon Pea and
Cowpea). Journal of Emerging Trends in Engineering and Applied Sciences
(JETEAS), 1 (1): 89-95
Aregheore, E.M. and Agunbiade, O.O. (1991). The Toxic Effects of Cassava (Manihot
esculenta Crantz) Diets on Human: A Review. Journal of Vertinary and Human
Toxicology, 33: 274 – 275.
Asha, A., Tripathi, A.K. and Soni P. (2008). Vermicomposting: A Better Option for Organic
Solid Waste Management. Journal of Human Ecology, 24(1): 59 – 64.
Ayernor, G.S. (1976). Particulate Properties and Reheology of Pregelled Yam (D. Rotundata)
Products. Journal of Food Technology, 41: 180-182.
Banasik, O.J. and Dick, J.W. (1982). Extruded Products from Durum Wheat. Cereal Food
World, 27: 553.
Bayol, S.A, Simbi, B.H, Bertrand J.A, Stickland,N.C. (2008) Offspring from Mothers Fed a
“Junk Food” Diet in Pregnancy and Lactation Exibit Exacerbated Adiposity that is
more Pronounced in Females. Journal of Physiology, 586.13 3219-3230.
Bernacchi, D.B., Immel, D.L. and Yaknis, C.A. (1993). Process for Making Coated
Expanded Snack Product. United States Patents and Trademark Office (USPTO), pp
51.
Bishnis, K.W. and Yadav, R.K. (1994). Effect of Domestic Processing and Cooking Method
on Phytate And Polyphenol Content of Pea Cultivar (Pisum sativum). Plenum Press
New York, pp. 381 – 388.
Bokanga, M. (1990). Cyanide Detoxification and Nutrition Changes during Cassava
(Manihot esculenta Crantz) Fermentation. International Society for Tropical Root
Crops, Thailand, pp.30.
Bradbury, M.G., Egan, S. and Bradbury, J.H. (1999). Picrat Paperkits for Determination of
Total Cyanogens in Cassava Roots and all Forms of Cyanogens in Cassava Products.
Journal of the Science of Food and Agriculture 79:598 – 601.
Bressani, R. and Elias, L.G. (1974). Legume foods. In New Protein Foods; Altschu, A. M.,
Ed., Academic Press,New York, Vol. 1
Brink, M. and Belay, G. (2006). Plant Resources of Tropical Africa, Cereals and Pulses Prota
Foundation/Backhuys Publishers/CTA, Wageningen, pp 129-133.
Brooks, E. (2011). http/ezinearticles/com?themanyhealthbenefitsofdietaryfibre accessed on
27/09/ 2011.
Bushway, R.J., Bureau, J.L. and McGann, D.P. (1984). Determination of Organic Acid in
Potatoes by High Performance Liquid Chromatography. Journal of food science
49:75-77.

67
Casadei, R. (1988). Nutritional and toxicological aspects of cassava. In Walter, R. &
Quattruci, E. eds. Nutritional and toxicological aspects of food processing, Taylor and
Francis London, pp. 171176.
Dietary Reference Intake 1(2001). Proposed Definition of Dietary Fibre. http://books.nap.
Disabled world (2008). Cholesterol Level Chart.
http://www.disabledworld.com/artman/publish/cholesterol-chart.shtml accessed on
29/06/2012.
Duke, J.A. (1981). Handbook of Legumes of World Economic Importance. Plenum Press,
New York.
Echendu, C.A., Onimawo, I.A. and Adieze S. (2004). Production and Evaluation of
Doughnuts and Biscuits from Maize- Pigeon pea flour blend. Nigerian Food Journal,
22: 147-153.
Ekundayo, J.A. (1980). In: Fungal Biotechnology. Smith, J.E., Berry D.R., Kristiasen B.
(Eds.) Academic Press, London, pp 244 – 270.
Eneche, E.H. (1999). Biscuit-Making Potential of Millet/Pigeon Pea Flour Blends. Plant
Foods for Human Nutrition. Kluwer Academic Publishers Netherlands 54: 21-27.
Enwere, N.J. (1998). Foods of Plants Origin. Afro-Orbis Publications Limited, Nsukka, pp.
24-152.
Enwere, N.J., Oyarieme, H.C. and Osho, S.M. (1993). Characteristics of Porridge-type
Breakfast Cereal Prepared from Soybean and Maize. A Paper Presented at the 14th
Annual Conference of the Nigerian Soybean Association at NCRI Ibadan April 20-22,
1993, Events and Book of Abstract, pp 12.
European Council (1999). Council Directive 1999/31/EC of April 1999 on Landfill of waste.
Evirowise (1997). Cost-effective membrane technologies for minimizing waste and affluents.
Evirowise Guide GG054.
FAB (2012). Vitamins and other Minerals. http://www.fabflour.co.uk/content/1/256/
vitamins-and-other-minerals.html. accessed on 04/07/2012.
FAO/WHO (1991). Essential Amino Acids and Minerals. In: Report of a joint FAO/WHO
Expert consultations. Food and Agricultural Organizations of the United Nations,
Rome, pp 280.
FAO/WHO (2002). Calcium. In: Human Vitamin and Mineral Requirements. Report of a
Joint FAO/WHO Expert Consultation. FAO, Rome, pp 151-171.
Fawole, M.O. and Oso, B.A. (1988) Laboratory Manual in Microbiology, 3rd
Edition
Spectrum Books Limited Ibadan.

68
Fellow, P.J. (2000). Food Processing Technology: Principles and Practice. Woodhead
Publishing Limited Cambridge England, pp 295-308.
Food data chart (2012). Dietaryfibrewww.healthyeatingclub.com/info/books-phds/books/
foodfacts/html/data/data2c.html. accessed on 15/06/2012
Friedman, M. (1996). Nutritional Value of Protein from Different Food Sources. Journal of
Agriculture and Food Chemistry, 44, 6-29.
Giwa, E.O. and Ikujenlola, A.V. (2010). Quality Characteristics of Biscuits Produced From
Composite Flour of Wheat and Quality Protein Maize. African Journal of Food
Science and Technology, 1(5) 116-119.
Harper, J.M. (1979). Food Extrusion. CRC Critical Reviews Food Science and Nutrition
155 – 215.
Harper, J.M. (1986). Extrusion Texturization of Foods. Food Technology: 40: (3) 70-76.
Harrigan, W.F. and McCance, M.E. (1976). Laboratory Methods in Food and Diary Micro-
biology, Academic Press, London, pp 25 – 29.
Howard B.J. (2006). Simple Wetting Method to Reduce Cyanogen Contents of Cassava
Flour. Journal of Food Composition and Analysis, 19(4): 388 – 393.
Huber, G.R. (2001). Development and Trends in Extruded Snacks, Food Products Design
Virgo Publishing, pp 1 – 7.
Hui, Y.H. (1999). Snack Food Technology. In: Encyclopedia of Food Science and
Technology, 4, John Wiley and Sons Inc., New York, pp. 2379.
Hui, Y.H. (2006). Handbook of Food Science, Technology and Engineering, Volume 4, pp.
169.
Idowu, M.A., Oni, A, and Amusa, B.M . (1996). Bread and Biscuit Making Potentials of
Some Nigerian Cocoyam Cultivars, Nigerian Food Journal 14: 1-12.
Ihekoronye, A.I and Ngoddy, P.O. (1985). Integrated Food Science and Technology for the
Tropics, Macmillian Publishers Limited, London, pp 236 – 253.
Ikpeme C.A., Osuchukwu, N.C. and Oshieel L (2010). Functional and Sensory Properties of
Wheat (Aestium triticium) and Taro Flour (Colocasia esculenta) Composite Bread.
African Journal of Food Science 4: (5) 248-253.
IOM. (2001). Dietary Reference Intakes: Proposed Definition of Dietary Fiber. Washington,
DC: National Academy Press.
Iwe, M.O. (2002). Handbook of Sensory Methods and Analysis. PROJOINT
Communications Services Ltd, Enugu, pp. 70-72.
69
Iwe, M.O. and Ngoddy, P.O. (1998). Proximate Composition and Some Functional Properties
of Extrusion Cooked Soybean and Sweet Potato Blends. Plant Foods for Human
Nutrition, 53: 121-132.
Jideani, V.A. (2005). Characteristics of Local Pearl Millet (Pennisetum glaucum) Grains.
Nigerian Food Journal, 23: 193 – 204.
Kent, N.L. (1975). Technology of Cereals with Special Reference to Wheat. Second Edition,
Pergamon Press Oxford.
Kirk, R.S. and Sawyer, R. (1998). Pearson‟s Composition and Analysis of Foods. 9th ed.
Churchill Livingstone Edinburgh, pp. 17 – 20.
Krauss, F.G., (1921). Production of Starch on a Small Commercial Scale from Root Crops
and Corn. Hawaii Agric Expt. Sta. 55.
Kulshreshtha, M.K., Zaror, C.A. and Jukes, D.J. (1995). Simulating the Performance of a
Control System for Food Extruders Using Model-Based Set – Point Adjustment
Kure, O.A., Bahago, E.J., Daniel, E.A. (1998). Studies on the Proximate and Effect of Flour
Particle Size on Acceptability of Biscuits Produced from Blends of Soyabeans and
Plantain Flour. Namida Tech-scope Journal, 3: 17-21.
Lasekan, O.O. and Akintola, A.M. (2002). Production and Nutritional Evaluation of Puffed
Soy-Maize Snack. Nigerian Food Journal, 1 20: 15-19.
Lee, G.F. and Stumm, W. (1960). Determination of Ferrous Iron in the Presence of Ferric
Iron using Bathopenanthroline. Journal of American Water Works Association, 52:
1567.
Liener, I.E. (1980). Toxic Constituents of Plant Food Stuffs. Academic Press, New York.
Lin, M., Humbert, E.S. and Sosulski, F.W. (1974). Certain Functional Properties of
Sunflower Meal Products. Journal of Food Science, 39: 368 – 371.
Luc, G. and Fruchart, J. C. (1991). Oxidation of Lipoproteins and Atherosclerosis. American
Journal of Clinical Nutrition, 53: 206S–209S.
Magda, R.A., Awad, A.M and Selim, K.A. (2008). Evaluation of Mandarin and Navel
Orange Peels as Natural Sources of Antioxidant in Biscuit. Alex Journal of Food
Science and Technology 82 (special volume conference) 75-82).
Manley, D. (2000). Technology of Biscuit, Crackers and Cookies. Woodhead publishing
Limited, England pp 307
Mans, J. (1982). Extruders. Preparation of Foods 11, 60-63.
Mayo Clinic Staff, (2007). Health Benefit of Dietary Fibre. http://www.mayoclinic.com/
health/fibre.
70
Mickelson, O. Makadani, D.D. and Cotton, R.H. (1979). Effects of a High Fibre Bread Diet
on Weight Loss in Collage Age Meals. American Journal of Clinical Nutrition 1703-
1717.
Morton, J.F. (1976). The pigeon pea (Cajanus cajan Millsp) a High Protein Tropical Bush
Legume. Horticultural Science, 11 (1): 11 – 19.
Muller, H.G. and Tobin, G. (1980). Nutrition and Food Processing. First American Edition.
AVI Publishing Company Inc. Westport Connecticut.
Ningsanorid, S. and Ooraikul, B. (1989). Chemical and Nutritional Properties of Dry and
Wet Milling Products or Red Cowpeas. Journal of Canadian Institution Food
Science and Technology, 22(2): 147 – 155.
O‟Connor, C. (1987). Extrusion Technology for the Food Industry. Elsevier Applied Science,
London.
Obadina, A.O., Oyewole, O.B., Sanni, L.O., and Abiola, S.S. (2005). Fungal Enrichment of
Cassava Peels Protein. African Journal of Biotechnology, 5 (3): 302 – 304.
Obioha, F.C. and Anikwe, P.C. (1982). Utilization of Sun Dried Cassava Peel by Growing
Swine. Nutrition Report International, 26, 962 – 963.
Oboh, G. and Akindehunsi, A.A. (2003). Biochemical Changes in Cassava Products (Flour
and Garri) Subjected to Saccharomyces cerevisae Solid Media Fermentation. Food
Chemistry, 82 (4): 599 – 602.
Oboh, G., and Oladunmonye, M. (2007). Biochemical Changes in Micro-Fungi Fermented
Cassava Flour Produced from Low-and Medium – Cyanide Variety of Cassava
Tubers. Nutrition Health, 18(4): 355 – 67.
Odunfa, S.A. African Foods. In Microbiology of Fermented Foods. Elsevier Science, London
and New York, 2:155-199.
Okafor, N. (1992). Commercialization of Fermented Foods in Sub-Saharan Africa. In:
Application of Bacteriology to Traditionally Fermented Foods. National Academic
Press, USA., pp165 – 169.
Okafor, J.N. (2009) Production and evaluation of extruded snacks from a composite of
bambara groundnut (Voandzeia subterranean Thoaur), hungry Rice (Digitania exilis
staph.) and carrot (Daucus carota). An M.Sc. thesis of the Department of Food
Science and Technology, University of Nigeria Nsukka, pp 5 – 7.
Okaka, J.C. (1997). Cereals and Legumes: Storage and processing technology. Data and
Microsystems publishers Enugu, Nigeria. pp 5-6, 153-154.
Okaka, J.C. and Potter, N.N. (1979). Physicochemical and functional properties of cowpea
powders processed to reduce beany flavor. Journal of Food Science, 44: 1235 – 1240.
71
Okaka, J.C., Akobundu, E.N.T and Okaka, A.N.C. (1992). Human Nutrition (An Integrated
Approach), ESUT Publication Enugu, pp 122-126.
Oke, O.L. (1978). Problems in the use of cassava as animal feed. Animal Feed Science and
Technology 3: 345-380.
Okoro, C.C. (2007). Effect of process modification on the physio-chemical and sensory
quality of fufu-flour and dough. African Journal of Biotechnology, 6 (16) 1949-1953.
Okpala, L.C. and Okoli, E. C (2011). Nutritional evaluation of cookies Produced from Pigeon
Pea, Cocoyam and Sorghum flour blends. African Journal of Biotechnology, 10 (3)
433-438.
Okpala, M.O. (2010). Development and Evaluation of Baked Products from Jackfruit
(Artocarpus heterophyllus lam) seed kernel and pulp flour. An M.Sc Dissertation of
the Department of Food Science and Technology, University of Nigeria, Nsukka.
Oladele, A.K. and Aina J.O. (2009) Chemical Composition and properties of flour produced
from two varieties of tigernut (Cyperns esculentus). African Journal of Biotechnology,
6 (1): 2473-2476.
Olsen, K.A. and Schaal, B.A. (1999). Evidence on the origin of cassava: Phylogeography of
cassava (Manihot esculenta). Proceedings of the National Academy of Sciences of the
United States of America (PNAS).
Onuh, J.O. (2007). Development and evaluation of extruded snacks from cereals, legumes
and ripe-pulpy fruits and vegetables.A Ph.D Proposal of the Department of Food
Science and Technology, University of Nigeria Nsukka, pp 5 – 7.
Onwuka, G.I. (2005). Food Analysis and Instrumentation. Theory and Practice. Naphtali
prints. A Division of HG Support Nigeria Limited, Surulere, Lagos, Nigeria, pp119-
121.
Onyebuashi, C.O.A. (1986). Characteristics of Water Extractable Proteins from Cajanus
cajan. M.Sc. Dissertation, Department of Food Science and Technology, University
of Nigeria Nsukka.
Osborne, D. R. and Voogt, P. (1978). The Analysis of Nutrients in Foods. Academic Press
London, pp 160-239.
Oyenuga, V.A. (1968). Nigerian food and feeding stuffs: Their Chemistry and Nutritive
value. Ibadan University Press,Ibadan.
Padmaja, G. (1995). Cyanide detoxification in cassava for food and feed uses. Critical
Reviews on Food Science and Nutrition 299 – 339.
Pearson, D. (1976). The Chemical Analysis of Foods 7th Edition, London: Churchill
Livingstone .

72
Purseglove, J.W. (1991). Tropical crops: Dicotyledons. Longman Scientific and Technical.
John Wiley and sons, New York.
Pyke, M. (1982). Foods and Food Processes of Increasing Sophistication. In: Food Science
and Technology, 4th ed., John Murray, London, pp 263-280.
Rizvi S.S.H, Mulvansy S.J, Sokhey A.S. (1995). The Combined Application of Supercritical
Fluid and Extrusion Technology. Trends in Food Science and Technology 6: 232-
240.
Roland P. and Stanely C. (2011). Quality Assurance and Safety of Crops and Foods. Journal
of Food Science and Technology, (4): 90-128
Roseling, H. (1987). Cassava Toxicity and Food Security. Uppsala, Sweden, Tryck, kontakt,
pp 40
Seiler, K. (1984). Extrusion Cooking and Food Processing. Food Trade Reviews, 124 – 125,
127.
Siedel, J., Hagele E.O., Ziegenhorn J., and Wahlefed A.(1983). Reagents for the a,
determination of serum total cholesterol with improved lipolytic efficiency.Clinical
Cheistry, 29: 1075-1080.
Siegel, A. and Fawcett, B. (1976). Food Legume Processing and Utilization. Agriculture,
Food and Nutrition Science Division, IDRC-TS-1 Ottawa.
Singh, U. (2001). Functional Properties of Grain Legume Flour. Journal of Food Science and
Technology 38 (3): 191-199.
Sonaiya, E.B. and Omele, I.A. (1977). Cassava Peels for Finishing Pigs. Nutrition Report
International, 16(4): 479 – 485.
Stacewicz-Sapuntzakis, M. Bowen, P.E., Hussain, E.A., Damayanti-Wood, B.I., Farnsworth,
N.R. (2001). Chemical Composition and Potential Health Effect of Prunes: A
Functional Ford? Critical Reviews on Food Science And Nutrition 41(4): 251-86.
Steel, R.G.B. and Torrie, J.H. (1980). Principles and Procedures of Statistics. McGraw Hill
book Co. Inc., New York, USA.
Sunderland, R. (1996). Production of Third Generation Snacks. Cereal Food World, 41:12 –
14.
Tewe, O.O (1987). Cassava peel utilization in Poultry Diets Root crops and the Africa Food
Crisis. IDRC-258 Canada, 150-153.
Tewe, O.O. and Iyayi, E.A. (1995). Utilization of Cassava Peels in Small Holder Pig and
Small Remnant Production Systems in Nigeria. A Paper Presented At The 6th
Triennial Symposium of ISTRACAR Lilongwe Malawi, 22 – 28 Oct; 1995.
Thakur, S. and Sexena, D.C (2000). Formulation of Extruded Snack (Gum Based Cereal-
Pulse Blend): Optimization of Ingredients Levels Using Response Surface
Methodology, Lebensmittel-Wissenchaf Mid- Technology- Food Science and
Technology, 33: 345- 361.

73
Tiwari, B.K., Tiwari, U., Jagan, M.R., Alagusundaramm, K. (2008). Effect of Various Pre-
Treatments on Physiochemical and Cooking Properties of Pigeon Pea (Cajanus cajan
L.) Food Science and Technology International 14(6); 0487-0495.
Tweyongyere, R. and Kantongole, I. (2002). Cyanogenic Potential of Cassava Peels and
Their Detoxification for Utilization as Livestock Feed. Veterinary and Human
Toxicology 44 (6): 366 – 369.
Ugwuanyi, L. (2010). Effect of Processing on the Physico-chemical Properties and
Performance of Cassava peels in Food Preparation. A B.Sc Project of the Department
of Food Science and Technology, University of Nigeria, Nsukka, 18-19.
Ukpabi, U.I. and Ndimele, C. (1990). Evaluation of the Quality of “Garri” Produced in Imo
State, Nigeria. Nigerian Food Journal, 8: 105 – 110.
Uzoechina O. B. (2007). Evaluation of the Effect of Processing Techniques on the Nutrient
and Antinutrient Contents of Pigeon pea (Cajanus cajan) Seed Flour. Journal of Food
Science, 28:76-77
Walker, A., (1951). Unaliment de famine: I‟ecorle de manioc. Rev. International Bot. Appl.
31: 542.
White, W.L.B., Arias-Garzon, D.I., McMahon, J.M. and Sayre, R.T. (1998). Cyanogenesis in
Cassava: The role of Hydroxyritule Lyase in Root Cyanide Production. Plant
Physiology, 116: 1219 - 1225.
Wikipedia (2009). http://en.wikipedia.org/wiki/snackfood. accessed on 07/5/2010
Wikipedia (2009). http://patft.uspto.gov/netacgi/nph. accessed on 07/5/2010
Wikipedia (2010). http://en.wikipedia.org/wiki/pigeonpea. accessed on 15/04/2011
Yagci, Sibel, Gogus and Fahrettin (2009). Development of extruded snack from food by-
products: A response surface analysis. Journal of food processing engineering, 32
(4): 565-586.