Embed Size (px)
Citation preview

Journal of Business and Management Sciences, 2015, Vol. 3, No. 1, 32-44 Available online at http://pubs.sciepub.com/jbms/3/1/5 © Science and Education Publishing DOI:10.12691/jbms-3-1-5
Product Designing through Conjoint Analysis and Curve Fitting of Financial Data: A Case of Birla Tyres
Monalisha Pattnaik*
Department of Business Administration Utkal University, Bhubaneswar India-751004 *Corresponding author: [email protected]
Received March 10, 2015; Revised April 02, 2015; Accepted April 13, 2015
Abstract This case study focuses on the product designing of domestic bias tyres of trucks and bus. There are some attributes of tyres by which potential customers are focusing on these attributes but by taking the most significant attributes like “Application”, “After sales service” and “Rim size” and using the conjoint analysis technique the best combination has been selected. For financial data the curve fitting method of least square of straight line parabolic curve methods are applied for forecasting for the next 10 years and the comparative study also carried out for managerial implication of this company.
Keywords: product design, conjoint analysis, utility, curve fitting, straight line, parabolic curve
Cite This Article: Monalisha Pattnaik, “Product Designing through Conjoint Analysis and Curve Fitting of Financial Data: A Case of Birla Tyres.” Journal of Business and Management Sciences, vol. 3, no. 1 (2015): 32-44. doi: 10.12691/jbms-3-1-5.
1. Introduction From the financial point of view it is observed that the
financial drives of Birla tyre that is sales, gross profit, net worth and EPS are not in stable position. By applying forecasting techniques with comparative studies it can be suggested that whether straight line or parabolic curve fitting of least square is more appropriate for the company. It has been approved the formation of an internal group to “develop the strategies and tools necessary to accomplish Birla Tyres vision of sustainable sourcing.” As described in its latest Report and internal documents, Birla Tyres envisioned a sustainable supply chain of the product “we continue to operate in certain sectors where our customers trust our strategic vision. Cement and tyres, the two significant business of Kesoram have seen a mixed year. To meet the challenges of these dynamic markets and to continue on our journey of success, we have necessary foresight, strategy and preparedness.” They believed that Birla Tyres’ existing product and its design efforts led the tyre industry; however, it also identified many issues Birla Tyres still needed to address in order to achieve its vision.
The company declares that from motorcycles to farm tractors, millions of people rely on Birla tyres for their everyday needs. So the product designing of Birla tyre focuses the system of designing with the best combination of significant attribute of appropriate levels by which it can satisfy the potential customers’ demand. Ultimately the financial fluctuations of the company can be retrieved to stable in competitive globe. The product designing constitutes a very pivotal role for the effective functioning of the financial fluctuations of the company. Selection of
design of the product depends upon the nature of the product, target customers, supplier base etc. The product design should always be selected carefully based on the strategy the company wants to follow and the risks it wants to take. Operation control of production of these products may be executed by Company’s own staff or by hiring professionals.
Birla Tyres had successfully influenced many of its suppliers to improve their social, environmental, and economical impacts. This will ensure a beneficial experience for all their stakeholders, customers, employees, bankers’ dealers and suppliers. So that Birla Tyres has built a solid reputation for quality and is now recognized as one of the best tyre manufacturers around. In the process, Basant Kumar Birla CEO (see Exhibit-3), and his worldwide team would have to answer some difficult questions: • How should Birla Tyre prioritize for product design
of domestic bias tyre (e.g. providing the right thing at right time and minimizing cost) with the most significant attributes like “Application”, “After sales service” and “Rim size”? What should be the best combination out of different levels of these three significant attributes.
• How should Birla Tyre frame and revise the financial fluctuations which can be predicted or forecasted by different techniques and which curve fitting is the best for different financial data like sales, gross profit, net worth and EPS so that the optimum production can be achieved with minimum cost which impact the global brand?
2. Company Profile

Journal of Business and Management Sciences 33
Kesoram Industries Ltd. is a Public Limited Company promoted by Late G.D. Birla in the year 1928 having its Corporate Office at Kolkata. Under the Company’s Banner first a textile business (manufacturing of textiles) was started. Thereafter in course of time different units were developed and inducted. Presently, the company is controlling the business of cement, tyres, rayon, chemical, paper etc. with an annual turnover exceeding Rs.7000.00 Crores (see Exhibit-2).
Birla Tyres, under the Kesoram’s umbrella was born in the year 1988 at Chhanpur, Balasore, Odisha. After the demise of Late G.D. Birla, Syd. B.K. Birla took over the charge of the company and under his initiation Birla Tyre was established. Originally, the unit was started for manufacturing of automobile tyres, tubes and flaps with installed capacity of 120 M.T. per day. Commercial production was started in the year 1992. Since then the unit has increased its capacity by adding machines at different times. Presently, the installed capacity has been increased to 272.5 M.T.
In the year 2008, a second tyre plant was established by the same promoter at Laksar, Uttarakhand, Haridwar with installed capacity 320 M.T. per day to manufacture automobile tyres, tubes and flaps. In the year 2010 the 3rd unit was set up for the manufacture of truck radial tyre with capacity 150 M.T. Subsequently, a 4th unit has also started simultaneously for two wheeler/three wheelers with capacity of 80 M.T. In the year 2011 passenger car radial was under construction at Balasore with installed capacity 70 M.T. per day. At present the same is under project stage and likely to be completed by 2013. Birla Tyres has an annual turnover Rs.3800.00 Crores from all units. It spends about Rs.34.00 Crores towards inbound logistic and Rs.74.00 Crores for out bound logistic. For different channel function and operation Birla Tyre is spending about Rs.58.00 Crores.
Birla Tyres a unit of M/s. Kesoram Industries Ltd. was set up to manufacture Automobile Tyres, Tubes and Flaps in the District of Balasore, Orissa started commercial production with effect from 01.03.1992. The plant was set up in Technical Collaboration with “M/s. Pirelli Ltd., U.K.” A subsidiary of International giant Pirelli group of Italy being one of the largest manufacturer of tyres in the world. Birla Tyres, part of Kesoram Industries Limited, was founded in 1991. Birla Tyres manufactures tyres for automobiles, trucks, buses, motorcycles, heavy machinery vehicles, tractors and other farm machinery. Birla Tyres set up its first tyre manufacturing plant in Balasore in the Indian state of Orissa in 1991 alongside Italian tyre manufacturer Pirelli.
In a span of two decades, Birla Tyres has become one of the most well-known tyre manufacturers in India. With its new manufacturing plant in Laksar-Haridwar, Uttarakhand, the company has surged ahead in the tyre business. Built within a record time of a mere 10 months, Birla Tyres plans to invest a total of approximately INR 2300 Crores in the state-of-the-art Haridwar factory which has a production capacity of 44,00,000 truck tyres per annum. Birla Tyres exports to more than 50 countries and reported a turnover of over INR 350 Crores earned from exports alone between 2009 and 2011. On the domestic front, Birla Tyres has a 3200 strong network of dealers spread across the length and breadth of the country to cater for the Indian tyre market. Birla Tyres employs over
170 sales officers and engineers, stationed at strategic locations to offer round the clock Claim Settlements and unparalleled customer services. Birla Tyres has earned various national and international accreditations including the ISO 14001 certification. It has a broad product range, with the Victus series for truck and bus radials and Road Maxx series for motorcycles being the latest offerings from the company.
Birla Tyres had to face difficulties as well such as the increase in natural rubber prices or labour unrest in the manufacturing plant in Balasore. The profits too have taken a severe toll in 2011. Compared to a profit of about INR 237 Crores in 2010, Birla Tyres has suffered losses to the amount of 210 Crores in 2011. In a move to correct the situation, the company is in the process of revamping and reorganizing its management operations. With a new management strategy that intends to focus on better usage of the capacity of manufacturing plants together with aggressive marketing and an altered product mix with a shift towards the more profitable passenger car and two-wheeler tyres products, Birla Tyres hopes to recover from the losses in the near future.
The Indian tyre market for truck and bus radials is set to grow at a tremendous rate owing to the infrastructure development in India. In a bid to enter and win the Indian radial tyre market segment, Birla Tyres is set to increase the production of truck and bus radials by a whopping 85 tonnes per day in the manufacturing plant at Haridwar in a move that would require an investment of INR 350 Crores. The tyre manufacturing plant in Balasore is slated to receive an investment of INR 450 Crores to increase the output of passenger car radials by a figure of 80 tonnes a day.
The plant is equipped with best and sophisticated advanced machineries from world leaders of tyres machinery manufacturers such as Berstorff, (Germany) C.A. Litzler, (U.S.A.), Comerio (Italy), Pirelli (Italy), Mitsubishi (Japan), Spadone (U.S.A.) along with indigenous machineries from L&T McNeil, Farrel Anand and Alferd Herbert etc.
The Company has been awarded the ISO 9001 Certificate in December, 1994 in recognition of its Quality Management System. It is the first tyre Company in the history to be awarded ISO 14001 Certificate in recognition of its Environment Management System in the year February, 1998. The Company has also won QS 9001 Certification in March, 1999. The Company has started Total Productive Maintenance (TPM) activities for further strengthening the quality of product and personnel increasing efficiency and controlling cost and awarded the Certificate in October, 2001.
The Plant was initially established with 120M.T. production capacity concentrating upon production of Truck and Bus Tyres, Tubes and Flaps. Subsequently the production capacity was increased to 149 M.T. during the year 1999-2000. The Unit also simultaneously established Radial Tyre Plant which started production since November, 2000 with production capacity about5 M.T. per day to produce only passenger car tyres. Presently, our installed capacity is 272.5 M.T. and plant is running with full capacity in both the cases.
The indigenous sale is built up through OEM, DGS&D and replacement market. TELCO, Ashok Leyland, Mahindra & Mahindra & TAFE, are the regular OEM

34 Journal of Business and Management Sciences
customers. The company has seventy two distribution points spread all over India for direct sales to the replacement market. The export is made to various Countries like, U.S.A., U.K., Canada, Brazil, Sweden, Singapore, Ireland, Norway, Spain, Germany, Bahrain, Algeria, Nigeria, Peru, Philippines, Malaysia, Bangladesh, Nepal & Vietnam.
The prevailing market situation has compelled the Company to concentrate on TPM norms which have helped immensely in cutting down all the hidden losses thereby drastically reducing the cost of production. This has helped to withstand the tough competition and company is constantly striving to sustain the present status.
3. Overview Kesoram was founded in 1919 under the name of
Kesoram Cotton Mills Ltd (see Exhibit 1). From its humble beginnings as a cotton textile mill in Calcutta, Kesoram expanded into the production of rayon. Its first rayon plant was built in 1959, with a production capacity of 4,635 metric tons of rayon yarn per year. The spirit of entrepreneurship did not end there. Kesoram soon entered the tyres and cement industries. A change of name was needed to reflect the company’s increasing portfolio of businesses. So in 1986, it changed its name to Kesoram Industries Limited. Since then, Kesoram’s operations have grown from strength to strength. Its reputation is recognised today by its listings on four global stock exchanges – National Stock Exchange of India, Bombay Stock Exchange, Calcutta Stock Exchange Association, and the Societe de la Bourse de Luxembourg.
To provide unmatched accessibility, Birla Tyres has more than 170 sales depots regionally. With more than 491 sales engineers and 8,831 dealers at major locations, you will always find a Birla Tyre representative to meet your needs. (See Exhibit- 4) for the market position of Birla Tyres.
4. Production Capacity
Birla tyres prides itself on delivering innovation and operational excellence. The state-of-the art factory at Laksar-Haridwar, Uttaranchal, a production capacity of over 44 lakh truck tyres per year. Today, with the integrated plant at Balasore, Odisham, Birla tyre has a combined capacity of 298,669 metric tonnes. With plans to expanded into the production of passenger car tyres, Birla tyres is poised to become one of the most comprehensive tyre manufacturers in this region. (See Exhibit 5) for the production capacity of Birla tyres.
5. Corporate Birla Tyres was first established in 1991, as part of
Kesoram Industries Limited. It then collaborated with world-class tyre manufacturer Pirelli, in the production and development of its tyres. Since then, Birla Tyres has built a solid reputation for quality and is now recognised as one of the best tyre manufacturers around.
6. Growth & Success Point The First Plant for manufacturing of rayon yarn was
established at Tribeni, District Hooghly, West Bengal and the same was commissioned in December, 1959 and the second plant was commissioned in the year 1962 enabling it to manufacture 4,635 metric tons per annum (mtpa) of rayon yarn. This Unit has 6,500 metric tons per annum (mtpa) capacity as on 31.3.2008. The plant for manufacturing of transparent paper was also set up at the same location at Tribeni, District Hooghly, West Bengal, in June, 1961. It has the annual capacity to manufacture 3,600 metric tons per annum (mtpa) of transparent paper.
Birla Tyre has been established with an overall market share of about 16% of the total tyres sold in the Country. Out of total sales made, 50% sale is in replacement market, 30% sale in export market and rest 20% in OE Market. Birla Tyre has been awarded the “Best Company of the year” many a times in its life span from the state of Orissa. It has been awarded “The Tyre Company of the Year” from ATMA. It has received the Chief Minister Award, “Golden Peacock Shield” twice in the year 2001 and 2006. CII, Odisha Chapter also awarded trophy and shield in different occasions. For quality performance also Birla Tyre has been awarded innumerable prizes from different circle. For the highest export from the State it has received trophy twice in its life span (see Exhibit-6).
7. Product Mix of Kesoram Industries Limited
Figure 1. Product Mix of Birla Company
7.1. Product Mix of Birla Tyres
From motorcycles to farm tractors, millions of people rely on Birla Tyres for their everyday needs. Figure 1 shows the product mix of Kesoram corporation limited. The company produces tyres for domestic market as well as international market (export). The details are presented in Table 1 (product mix of domestic market) and in Table 2 (product mix of export market) respectively. With over 170 sales in India, one can always find a dealer to serve to his/her needs. Lets have an access to Birla tyre’s international network that stretches across 17 countries worldwide.
Journal of Business and Management Sciences 35
Table 1. Product Mix of Domestic Market Domestic
Truck And Bus Light Truck Passenger Car Motor Cycle Farm OTR And Mining Bias Radical Bias Bias Radical Bias Bias Bias
XPL VICTUS D321 XPL BT 339 BLAIZER
ROAD MAX BT R-
41 SHAAN GRADER MAX
XET DLX, SUPER BT, ZINA VICTUS D311 SAMSON BT 444 DAZZLER
ROAD MAX BT F-
21 SHAAN+ KALAPATTHAR
SAMSON, ZETA+DLX ROADMILER, BT339+
VICTUS D331 ROADMILLER BT 446 DELTA
ROAD MAX BT F-
81 SUPER LOADERMAX
BT 112 PLATINUM VICTUS A511 BT 111 THUNDER DERBY
ROAD MAX BT R-
42 - ULTRAGRIP
BT 112 PLUS, BT 334, BT 336, TIRIB DLX, BT339*
VICTUS S311 BT 112 - MILANO
ROAD MAX BT R-
81 - ULTRA TRAC
BT 339 PLATINUM - BT 339 - STEELEX ROAD
MAX BT R-82
- -
ZYNO DLX, ULTRA PLUS, - BT 369 - STELLAR - - - BT ULTRA, BT 112 GOLD,
TARZAN DLX - BT 333 - VECTOR - - -
BT 111, BT112, RAFTAR, TISON DLX, BT 339, BT 339N, - CHAKRA - - - - -
ZING, BT-MAX, BT334*,RUSTAM - - - - - - -
Table 2. Product Mix of Export Market Export
Truck And Bus Light Truck Passenger Car Motor Cycle Farm OTR and Mining Bias Radical Bias Bias Radical Bias Bias Bias
XPL VICTUS D321 XPL BT 300 DAZZLER ROAD MAX BT
R-41 SHAAN GRADER MAX
BtT112P VICTUS D311 SAMSON BT 444 DELTA ROAD MAX BT
F-21 SHAAN+ KALAPATTHAR
BISONP, BT333 VICTUS D331 ROADMILER BT 669 DERBY ROAD MAX BT
F-81 SUPER LOADERMAX
BT 112 VICTUS A511 BT 111 SAFAR MILANO ROAD MAX BT
R-42 ARJUN ULTRAGRIP
BT 223, BT 334 VICTUS S311 BT 112 RUSTOM - ROAD MAX BT
R-81 BT555 ULTRA TRAC
BT 222 - BT222 - - ROAD MAX BT R-82 BT666 -
BT 336, BT111 - BT 339 - - - - - RUSTOM, BT369,
BT880 - BT 333 - - - - -
SAMSON, SUGAR, KING - BT300 EXTRA - - - - -
BT339 - - - - - - -
Table 3. Domestic Products (Bias)
Attribute / Tyres XPL+ XPL-
LG BT 112 PLUS
BT- ZETA +
BT Roadmil
er BT 112 BT
ULTRA
BT TISON DLX
BT ULTRA MILER
BT KALAPATH
AR
BT 112 PLATINU
M
Market Domestic
Domestic
Domestic
Domestic
Domestic
Domestic
Domestic
Domestic
Domestic Domestic Domestic
Category Trucks & bus
Trucks & bus
Trucks & bus
Trucks & bus
Trucks & bus
Trucks & bus
Truck & bus
Trucks & bus
Trucks & bus Trucks & bus Trucks &
bus Applicatio
n High load
High load
High mileage
High mileage
Load & mileage
Load & mileage
Load & mileage
Load & mileage
Load & mileage Mining High
mileage Pattern
type Lug Lug Lug Lug Rib Rib Rib Lug Rib Lug Lug
Tube type Tube Tube Tube Tube Tube Tube Tube Tube Tube Tube Tube Rim size 7.5” 7.5” 7.5” 7.5” 7.5”,6.5” 6.5”,7” 7.5” 7.5” 7.5” 6.5”, 7.5” 7.5” Tyre size 10-20 10-20 10-20 10-20 8.25-20 9-20 10-20 10-20 10-20 10-20 10-20 Ply rating 18 18 16 16 16 16,18 16 16 16 16,18 16
After Sales
Service 2 2 2 2 2 2 2 2 2 2 2
8. Domestic Market Bias Tyres of Trucks & Bus
8.1. XPL+ • Extra thick casing and reinforced bead area to
withstand toughest road conditions and heavy load carrying capacity
36 Journal of Business and Management Sciences
• With additional warranty of crown concussion and LRD upto 50% wear
8.2. XPL-LG • Extra thick casing and reinforced bead area to
withstand toughest road conditions and heavy load carrying capacity
• High NSD for better mileage
8.3. BT 112 Plus • Specially designed cross Lug tyre with extra tread
depth for higher mileage • Special tread rubber compound and reinforce clinch
area for better torque resistant • Premium casing for additional retreads
8.4. BT Zeta + • Specially designed cross Lug tyre with extra tread
depth for higher mileage • Special tread rubber compound and reinforce clinch
area for better torque resistant • Premium casing for additional retreads
8.5. BT Roadmiler • Extra tread depth for high mileage • Specially designed sinusoidal pattern for uniform
wear, anti- rib sinking and excellent steering control • Additional advantage for power steering application • Very attractive and effective buttress design for
cooler running • Premium casing for additional retreads
8.6. BT Ultra • Extra tread depth for high mileage • Extra strong casing for wide range of load
applications
8.7. BT 112 • Deep tread depth provides excellent traction and
longer life • Special tread rubber compound designed against
chipping & chunking • Reinforced nylon casing offers durability & multiple
retreads
8.8. BT Tison DLX • Proven cross lug design with reinforced casing
ensures low cost per km
8.9. BT Ultra Miler • Extra Tread Depth & Wide Central Rib for higher
mileage • Sinusoidal Grooves & Specially Designed SIPES for
better steering and fit for new generation vehicles • Optimized Mass at shoulder for cooler running • Extra Under Tread & Durable Casing for multiple
retreads
8.10. BT Kalapatthar • Specially designed tread pattern and Reinforced
casing for resistance to lug chipping, lug tearing, Cut resistance
• Strong shoulder block for excellent capacity and dry traction
8.11. BT 112 Platinum • Specially designed high tread depth pattern for
premium mileage & excellent traction on metalled and uninstalled roads
• Heavy duty casing for multiple retreads
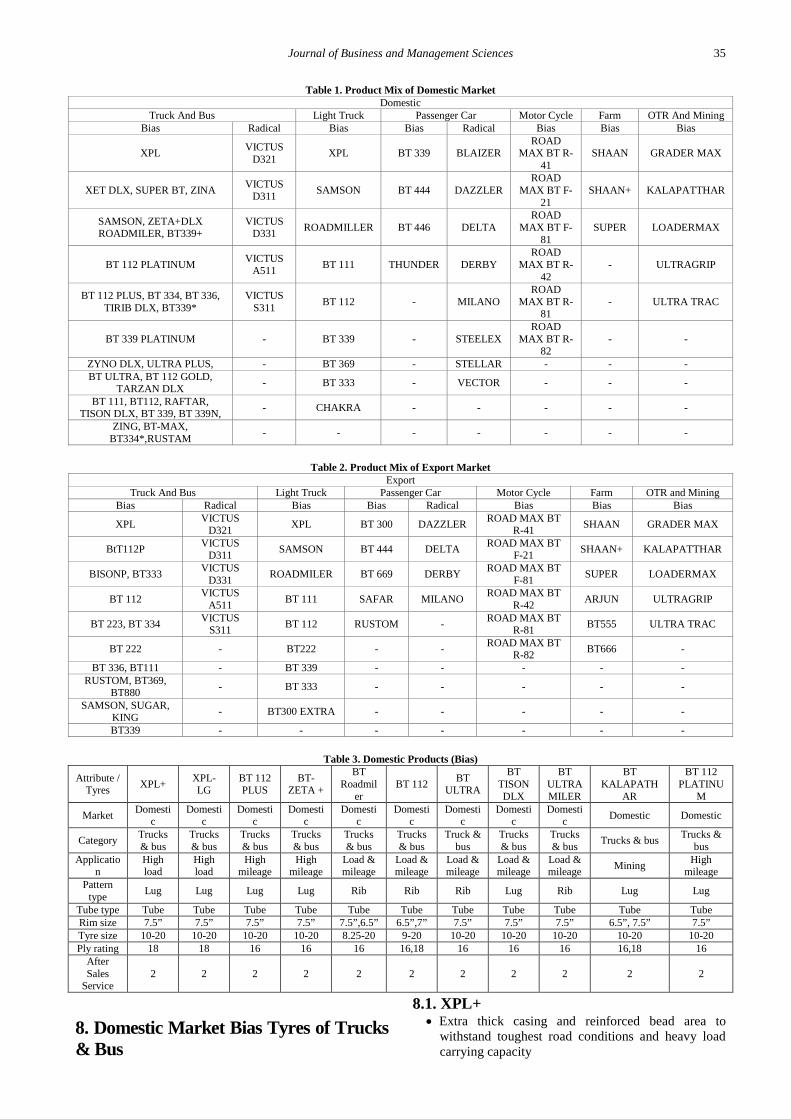
Table 4. Choosing the Right Tyres
9. Conjoint Analysis From the Table 4 it is observed that there are so many
attributes of tyres to choose the right tyre of vehicles.
Using conjoint analysis the objective is to determine from the potential customers’ point of view, how important each significant attribute is to them. Then the value of utility each combination of the levels can be derived by the customers which helps to understand the feasible

Journal of Business and Management Sciences 37
offerings from the marketer’s point of view so, that the company can design that type product for satisfying customers’ demand. By choosing 5 samples of the potential distributors of Bhubaneswar area data has been
collected for the appropriate product design of Birla tyre. Since the sum of the utility is zero, from the Table 5 it can be observed that all the part utilities of each level have been derived.
Table 5. Utilities Table for Conjoint Analysis Distributor Attribute Levels Part Utility Range of Utility (Max-Min)
1
Application High Load -.591
10.431-(-9.84)=20.271 High Mileage -9.840 High Load & High Mileage 10.431
After Sales Service (years) 3 -.824
2.891-(-2.067)=4.958 4 -2.067 5 2.891
Rim Size (“)
6.5 -.166
0.691-(-0.331)=1.022 7 .691 7.5 -.331 8 -0.194
2
Application High Load -1.250
1.5-(-1.25)=2.75 High Mileage -.250 High Load & High Mileage 1.5
After Sales Service (years) 3 3.000
3-(-3.667)=6.667 4 -3.667 5 0.667
Rim Size (“)
6.5 2.278
2.389-(-2.389)=0 7 -2.278 7.5 -2.389 8 2.389
3
Application High Load .026
11.948-(-11.974)=23.922 High Mileage -11.974 High Load & High Mileage 11.948
After Sales Service (years) 3 -3.807
3.947-(-3.807)=7.754 4 -.140 5 3.947
Rim Size (“)
6.5 -.643
0.943-(-0.873)=1.816 7 .943 7.5 .573 8 -0.873
4
Application High Load .167
7-(-7.167)=14.167 High Mileage -7.167 High Load & High Mileage 7
After Sales Service (years) 3 2.583
2.583-(-1.5)=4.083 4 -1.500 5 -1.083
Rim Size (“)
6.5 2.167
2.167-(-1.056)=3.223 7 -.278 7.5 -.833 8 -1.056
5
Application High Load 2.123
5.701-(-7.824)=13.525 High Mileage -7.824 High Load & High Mileage 5.701
After Sales Service (years) 3 -.723
2.946-(-2.223)=5.169 4 -2.223 5 2.946
Rim Size (“)
6.5 2.963
2.963-(-2.346)=5.309 7 -1.605 7.5 -2.346 8 0.988
9.1. Data Interpretation From the Table 5 it is concluded that “Application” of
the tyre is the most important attribute for the four potential customers (1, 3, 4, 5) out of five customers. There are two indicators for this: • The range of utility value is highest (20.271, 23.922,
14.167, 13.525) for the “Application” of the tyre. • The highest individual utility value of this attribute is
at its any one of the three levels (10.431, 11.948, 7, 5.701).
So, “Application” is the most important attribute at given level of attributes. Then “After sales Service” is the second most significant attribute at the range of (4.958,
7.754, 4.083, 5.169) and the last attribute in relative importance is the “Rim size” where the utility range is (1.022, 1.816, 3.223, 5.309).
9.2. Combination Utility The most potential customer is 3 since the range of the
utility value is highest (23.922). From part utility of customer 3 it is observed that the combination of “Application” High load & High mileage, “After sales service” 5 years and “Rim size” 7 inch is the best because it has the highest utility value (11.948+3.947+0.943=16.838). The next best combination is “Application” High load & High mileage, “After sales service” 5 years and “Rim size” 7.5 inch because it has the
38 Journal of Business and Management Sciences
utility value (11.948+3.947+0.573=16.468). The worst combination is “Application” High mileage, “After sales service” 3 years and “Rim size” 6.5 inch since the utility value is (-11.974-3.807-0.643=-16.424). By using this technique the utility of any combination can be obtained for Birla tyre.
9.3. Individual Attributes The difference in utility with the change of one level in
one attribute can also be checked. For the “Application” of High load to High mileage there is decrease in utility value of 12 units but for the “Application” of High mileage to High load & High mileage there is increase in utility value of 23.922 units.
Similarly for the “After sales service” of 3 to 4 years there is increase in utility value of 3.667 units but for the “After sales service” of 4 to 5 years there is again increase in utility value of 4.087 units.
For the “Rim size” of 6.5” to 7” there is increase in utility value of 1.586 units but for the “Rim size” of 7” to 7.5” there is decrease in utility value of 0.37 units and “Rim size” of 7.5” to 8” there is again decrease in utility value of 1.446 units.
10. Leadership, Performance & Response The company has been always looking to the quality
aspect. In order to achieve this, it has been concentrated and focuses on the truck tyres segment. To standardize and maintain the quality company is following ISO standard for different activity. It has also adopted TPM, Total Productive Maintenance, being the formula/concept for zero breaks down, Zero maintenance and zero accident. Implementing all these theories in daily life has culminated in a decrease in the loss and wastage ratio and increased the productivity level. This could certainly promote the quality parameters and emphasizes the leadership.
Total revenues of the Company during the year under review increased by about 8% to Rs. 6005 crore. Both major business, Tyres and Cement, recorded revenue growth. Operating margins, however, came under considerable pressure owing to spiraling input costs. These, in turn, impacted financing costs, which too showed a steep increase during the year.
The year under review was pervaded by several challenges making it perhaps the Tyre Business’s most difficult year since inspection. Revenues grew by 9% to Rs. 3922 Crore. However, inordinate pressure on margins forced the Business’s EBIDTA to decline significantly. Consequently, negative EBIDTA stood at Rs. 428 crore during the year under review as compared to negative EBIDTA of Rs. 15 crore in previous year.
The company’s supply chain has been very effective because it has promised to its customer that right thing in right time and in right place has to be delivered. This has been recorded as vision statement. All employees are motivated by the vision statement and vowed to achieve goal. Moreover due to induction of SAP the process becomes more easy and transparent to achieve the goal.
11. Outlook & Outcomes
Despite concerns of a slowing economy in the near term and the consequent impact on the automotive sector, the overall outlook for the tyre industry is positive. Infrastructure investments in roads, growing income of the country’s middle class, increasing mechanization of agriculture and the continued ready availability of loan finance for vehicles will act as an impetus to tyre sales. According to Basant Kumar Birla, Chairman Birla Tyres’, “much has changed over the last year economy continues its last sluggish journey greatly influenced by European concerns. At home we see rising inflation, a depreciating currency and rising cost of inputs coupled with purchasers’ resistant price increases. Such times require us to revisit our strategy, which has brought us great benefits over more than ninety years. Changes have been undertaken to respond to today’s needs and I am happy that indications are positive. The tyre business is under a new senior management team and is beginning to show signs of recovering from the difficulties faced for almost two years now. Success in the years ahead will be determined by the readiness to anticipate and be proactive to the fast changing business and regulatory environment while remaining fully committed to our corporate and social responsibility. This will ensure a beneficial experience for all our stakeholders: shareholders, customers, employees, bankers, dealers and suppliers.”
Our customers are very much complacent with the product of Birla Tyres. This resulted in dealers/sub-dealers to use our product, priority. Dealer commission, sub dealer commission is paid in time. Company also hold the dealer/sub-dealer meet once in a year and recognized the best dealer’s achievement. The company is very much keen in providing free services to that customer whose tyre failed within guarantee period. There are system to allow the customer benefit whose tyre failed, depending upon the percentage of failure and expiry of tyre life.
12. Industrial Structure and Developments
The Indian Tyre Industry is dominated by five major Indian manufacturers Apollo Tyres, Birla Tyres, CEAT Tyres, JK Tyres and MRF who together account for more than 85% of the industry turnover. The major market segments of business are replacement, institutional (Organizational Equipment Manufactures “OEM” and State Transport Undertakings) and exports. In terms of product, the market is split into two broad segments Commercial Vehicle Tyres (trucks & buses, light commercial vehicles, agriculture and specialty vehicles) and Personal Vehicle Tyres (car, SUV, motor cycle, scooter and moped).
Commercial vehicle tyres continue to constitute the largest segment of the Indian market. A few years back, these tyres constituted more than 80% of the market. Over the last few years, however, the Indian passenger vehicle industry (cars as well as two wheelers) has grown at a pace that outstrips growth of commercial vehicle sales, driven by greater disposable incomes, the rising aspirations of a burgeoning middle class, and the presence of almost every international vehicle manufacturer in India. Growing passenger vehicle sales in the country has meant the proportion of commercial vehicle tyres in the

Journal of Business and Management Sciences 39
total tyre industry has dropped to a little more than 60% today.
A key trend in the Indian market is the shift away from the old technology cross ply tyres to radials. While radialisation is greater than 95% in passenger vehicle today, in commercial vehicle tyres it is still below 25%. This is, however, picking up and India should soon catch up with the world on this parameter. Growing preference for radials by fleets on account of their better performance, increasing fitment of radials by OEMs and massive investments in increasing capacities for truck and bus radials by industry players seems to be driving this change. Radicalization in the truck and bus segment is forecast to cross 40% in the next few years.
The automotive market has a direct correlation with the growth of the Indian economy. The deceleration in the Indian economy has had a negative impact on the automotive industry as a whole. Declining growth of economic activity slows the demand for commercial vehicles something that is evident in India today. Consequently, the overall domestic truck and bus tyre market also saw stagnation in 2011-12 as compared to the previous year, which had seen a growth of over 20%. Sales of passenger vehicles suffered a mid year slump resulting in lower off take of tyres by OEMs. Nonetheless, towards the end of the financial year 2011-12, indications were that sales were beginning to look up once again.
On the cost front, volatility in raw material prices, especially of natural rubber, has been a major factor impacting the fortunes of the Indian Tyre Industry in the previous year. Volatile raw material prices continue to pose the biggest risk for the tyre business.
13. Forecasting Techniques in Birla Tyres
13.1. Time Series Analysis From this historical data it is easy to predict for future
by using least square method of straight line and parabolic method and the interpretations are derived through the comparative study. By applying curve fitting of straight line of sales with respect to time the value of 2 0.955R = it shows that 95% of the variation in sales in Birla Tyres can be explained by the time factors or independent variable. From the ANOVA testing the significance of F is 0.000. This indicates that the model is statically significant at a confidence level 0f 95%. So the trend line
4050.428 616.017y x= + , where y is sales and x is the time factor and it shows these two variables are statistically significant for the trend model as P-values are less than 0.05.
By applying curve fitting method of parabolic curve of sales with respect to time the value of 2 0.968R = which shows that 97% of the variation in sales of tyres can be explained by the time factor or independent variable. From the ANOVA testing the significance of F is 0.000. This indicates that the Parabolic model is also statistically significant at a confidence level of 95%. So the trend line of parabolic curve is 24261.177 616.017 31.612y x x= + − , where y is sales of tyres and x is the time factor and it shows these two variables are statistically significant for the trend model as P-values are less than 0.05. So it is
appreciable to forecast sales both by using straight line and parabolic curve method of curve fitting.
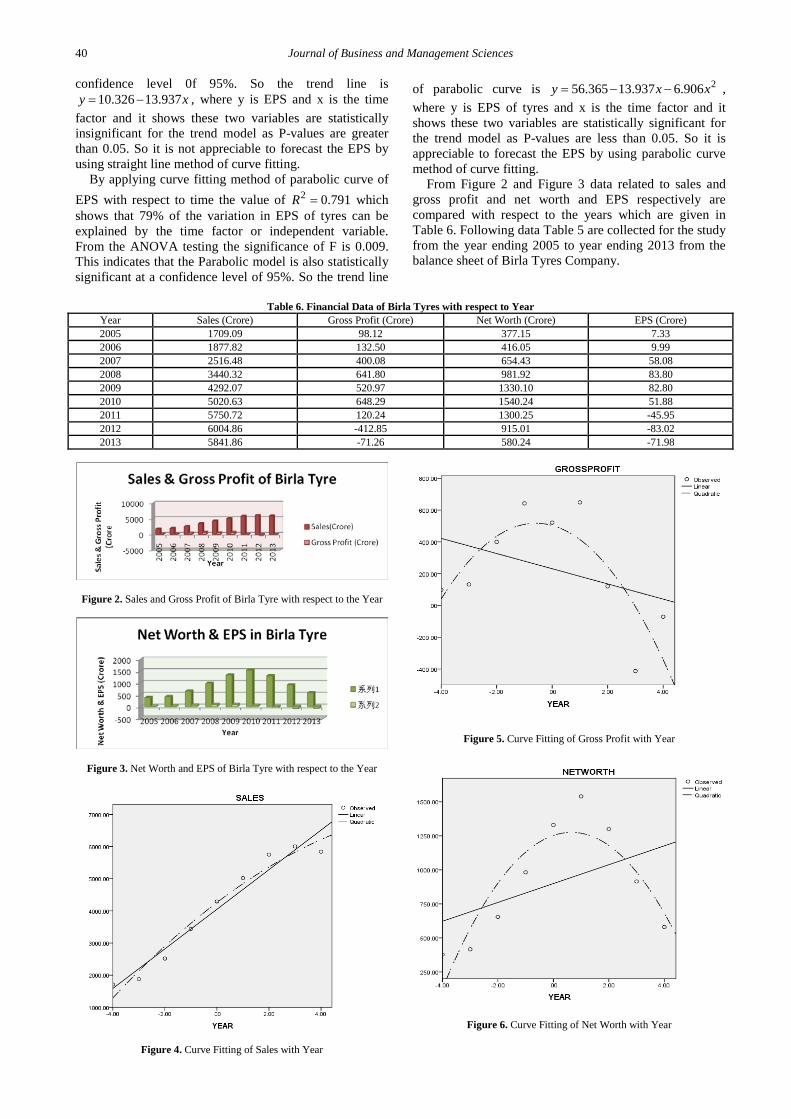
By applying curve fitting of straight line of gross profit with respect to time the value of 2 0.137R = which shows that 14% only of the variation in gross profit in Birla Tyres can be explained by the time factors or independent variable. From the ANOVA testing the significance of F is 0.327. This indicates that the model is statically insignificant at a confidence level 0f 95%. So the trend line is 230.877 47.779y x= − , where y is gross profit and x is the time factor and it shows these two variables are statistically insignificant for the trend model as P-values are greater than 0.05. So it is not appreciable to forecast the gross profit by using straight line method of curve fitting.
By applying curve fitting method of parabolic curve of sales with respect to time the value of 2 0.65R = which shows that 65% of the variation in gross profit of tyres can be explained by the time factor or independent variable. From the ANOVA testing the significance of F is 0.043. This indicates that the Parabolic model is also statistically significant at a confidence level of 95%. So the trend line of parabolic curve is 2503.055 47.779 40.827y x x= − − , where y is gross profit of tyres and x is the time factor and it shows these two variables are statistically significant for the trend model as P-values are less than 0.05. So it is appreciable to forecast the gross profit by using parabolic curve method of curve fitting.
By applying curve fitting of straight line of net worth with respect to time the value of 2 0.201R = which shows that 20% only of the variation in net worth in Birla Tyres can be explained by the time factors or independent variable. From the ANOVA testing the significance of F is 0.226. This indicates that the model is statically insignificant at a confidence level 0f 95%. So the trend line is 889.488 69.320y x= + , where y is net worth and x is the time factor and it shows these two variables are statistically insignificant for the trend model as P-values are greater than 0.05. So it is not appreciable to forecast the net worth by using straight line method of curve fitting.
By applying curve fitting method of parabolic curve of net worth with respect to time the value of 2 0.806R = which shows that 81% of the variation in net worth of tyres can be explained by the time factor or independent variable. From the ANOVA testing the significance of F is 0.007. This indicates that the Parabolic model is also statistically significant at a confidence level of 95%. So the trend line of parabolic curve is
21252.964 69.320 53.021y x x= + − , where y is net worth of tyres and x is the time factor and it shows these two variables are statistically significant for the trend model as P-values are less than 0.05. So it is appreciable to forecast the net worth by using parabolic curve method of curve fitting.
By applying curve fitting of straight line of EPS with respect to time the value of 2 0.35R = which shows that 35% only of the variation in EPS in Birla Tyres can be explained by the time factors or independent variable. From the ANOVA testing the significance of F is 0.093. This indicates that the model is statically insignificant at a
40 Journal of Business and Management Sciences
confidence level 0f 95%. So the trend line is 10.326 13.937y x= − , where y is EPS and x is the time
factor and it shows these two variables are statistically insignificant for the trend model as P-values are greater than 0.05. So it is not appreciable to forecast the EPS by using straight line method of curve fitting.
By applying curve fitting method of parabolic curve of EPS with respect to time the value of 2 0.791R = which shows that 79% of the variation in EPS of tyres can be explained by the time factor or independent variable. From the ANOVA testing the significance of F is 0.009. This indicates that the Parabolic model is also statistically significant at a confidence level of 95%. So the trend line
of parabolic curve is 256.365 13.937 6.906y x x= − − , where y is EPS of tyres and x is the time factor and it shows these two variables are statistically significant for the trend model as P-values are less than 0.05. So it is appreciable to forecast the EPS by using parabolic curve method of curve fitting.
From Figure 2 and Figure 3 data related to sales and gross profit and net worth and EPS respectively are compared with respect to the years which are given in Table 6. Following data Table 5 are collected for the study from the year ending 2005 to year ending 2013 from the balance sheet of Birla Tyres Company.
Table 6. Financial Data of Birla Tyres with respect to Year Year Sales (Crore) Gross Profit (Crore) Net Worth (Crore) EPS (Crore) 2005 1709.09 98.12 377.15 7.33 2006 1877.82 132.50 416.05 9.99 2007 2516.48 400.08 654.43 58.08 2008 3440.32 641.80 981.92 83.80 2009 4292.07 520.97 1330.10 82.80 2010 5020.63 648.29 1540.24 51.88 2011 5750.72 120.24 1300.25 -45.95 2012 6004.86 -412.85 915.01 -83.02 2013 5841.86 -71.26 580.24 -71.98
Figure 2. Sales and Gross Profit of Birla Tyre with respect to the Year
Figure 3. Net Worth and EPS of Birla Tyre with respect to the Year
Figure 4. Curve Fitting of Sales with Year
Figure 5. Curve Fitting of Gross Profit with Year
Figure 6. Curve Fitting of Net Worth with Year

Journal of Business and Management Sciences 41
Figure 7. Curve Fitting of EPS with Year
From Figure 4 it is observed that curve fitting of sales with respect to the year using both linear trend line and parabolic curve techniques are fitting well as original data are approaching to the trend lines but from Figure 5 it is observed that curve fitting of gross profit by parabolic curve is fitting well as original data are approaching towards the parabolic curve rather than straight line. Figure 6 and Figure 7 show the curve fitting of net worth and EPS by parabolic curve respectively are fitting well as original data are approaching towards the parabolic curve rather than straight line.
Figure 8, Figure 9, Figure 10 and Figure 11 represent the forecasting values of sales, gross profit, net worth and EPS for the next 10 years using straight line and parabolic curve methods of least square.
Figure 8. Forecasting of Sales by Straight Line and Parabolic Curve Method
Figure 9. Forecasting of Gross Profit by Straight Line and Parabolic Curve Method
Figure 10. Forecasting of Net Worth by Straight Line and Parabolic Curve Method
Figure 11. Forecasting of EPS by Straight Line and Parabolic Curve Method

42 Journal of Business and Management Sciences
Box 1. SWOT Analysis of Birla Tyres
Strength Weakness
Birla Tyres, Balasore, due to its location advantage and new technology it has gained cost benefit.
Due to having its own captive power plant, it is producing power at a very low cost. It’s infrastructure in plant set up is also very conducive to lower the production cost.
It is situated on N.H.5, the new golden quadrilateral connecting channel and Kolkata. This leads the transportation of incoming and outgoing transportation very
easy and cost competitive. Increased competition from global majors like Michelin, Bridgestone and
Continental who are putting up or expanding capacities could emerge as a challenge for domestic manufacturers.
All Indian giant tyre companies like MRF, Apollo, JK, Ceat have set up their major units nearer to the raw material sources.
For this their input cost is lower than Birla Tyres. Both the units of Birla Tyres are located far away from the raw
material sources. Again all giants companies that are very old have set up more
than 40 year have very experienced management and key personnel which Birla Tyre is lacking.
The industry’s large installed capacities in commercial vehicle cross ply tyres at a time of advancing radicalization could be
another concern.
Opportunities Threats
Although growth might have temporarily slowed, the trend rate of India’s economic growth remains intact at a healthy level. This, coupled with increased investments in infrastructure should result in a rapidly expanding automotive market in India, and
provide numerous growth opportunities for the tyre business. For all tyres companies in India, there is ample opportunity to grab the market. Presently
Demand exceeds supply. The figures published in ATMA Bulletin/Magazine shows that there is good demand
for export of tyres. Demand is coming from every sphere like East Asia, South Asia, Middle East,
African Countries, European Countries and American Countries. Also due to rupee depreciation this has become more lucrative. Within the Country also globalization helps easy entry to various Multinational Companies for which
big automobile giants have opened new manufacturing units in India and produced different varieties vehicles. This also increased the demand of tyres three fold.
Still there are various threat coming and impinging upon Birla Tyres. Most giants have now collaborated with International
tyre companies like Michelin, Bridge Stone, Goodyear, Continental, Pirelli and with their partnership, have hired their
technology. This helps them to modernize their plant and upgrade their technology.
Birla Tyres yet has not chalked out plan for collaboration. Moreover, a low cost China tyre which is being dumped inside
the country has become a matter of great concern. In this way about 10% to 15% demand is being filled up by
these tyres. In the near term, however, there is some concern whether the automotive segment would grow as aggressively as in the past
owing to a slowing economy.
14. SWOT Analysis For every new project or new programme
implementation Birla Tyres is evaluating its strength weakness or weak point, opportunity & threat which are explained in Box 1.
15. Conclusion World is facing a global recession for which demand is
falling internationally. America, Europe and some Countries are on the brink of Bankruptcy. Country like Greece, Turkey are declared debt country and EUC had bailed out to save them. India is also facing the same problem. Our growth has come down drastically. Chief Economic Advisor had predicted a growth for 2013-14 within 5%. Industries have started feeling the pinch of the slow down. Automobile sector have started reducing their production quota. This will have automatic impact in tyre industries. All tyres manufacturing companies are also gradually heading for their production cut.
The Indian tyre market for truck and bus radials is set to grow at a tremendous rate owing to the infrastructure development in India. In a bid to enter and win the Indian radial tyre market segment, Birla Tyre is set to increase the production of truck and bus radials by a whopping 85 tonnes per day in the manufacturing plant at Haridwar in a move that would require an investment of INR 350 Crores. The tyre manufacturing plant in Balasore is slated to receive an investment of INR 450 Crores to increase the output of passenger car radials by a figure of 80 tonnes a day.
Tyre companies both Indian and foreign, are all headed to capture the Indian tyre market with many international brands such as Continental, Bridgestone, Goodyear and Michelin setting up shop on the Indian soil. For Birla Tyres, the competition is stiff, with all the major global
players as well as Indian tyre majors such as MRF and Apollo Tyres vying for the top spot and the largest market share.
Basant Kumar Birla, Chairman, Birla Tyres’, reflected on Birla Tyre’s achievements as he considered the challenges and opportunities that he discussed. His goal was to move beyond the supply chain and specific efforts to a more comprehensive supply chain strategy and new product designing strategy for regaining the financial stability through proper utilization of forecasting techniques of financial drives in the company. He believed that Birla Tyre could and should retain its position in the industry as a sustainability leader, but what was the best path to reach that goal? His mind wandered back to some of the key questions: • How should Birla Tyre prioritize sustainability
relative to other goals (e.g. providing the right thing at right time and minimizing cost)?
• How should Birla Tyre reconcile different sustainability expectations and priorities around the world with the understanding that TPM, Japanese formula based upon zero accident, zero break done and zero down time with the best product designing of highest utility value so that the optimum production can be achieved with minimum cost which impact the global brand? (See Box-2) for the model of Birla Tyre.
16. Future Plan Birla Tyres is now very much watchful and cautiously
stepping in the right direction. Negotiation is under process with Pirelli, the giant Italian Company for partnership business. It is also thrusting its full effort to positioning in marketing and instilling the market share by focusing on new business for sustaining in long run in the globe.

Journal of Business and Management Sciences 43
Box-2. Model of Birla Tyres
References [1] Agrawal, D.K., Text Book of Logistics and Supply Chain
Management, Macmillan, India, 2003. [2] Annual report & Accounts 2011-2012 of Kesoram Industries
Limited. [3] BIRLA TYRES’ handouts, related documents and records. [4] Chopra, S., Meindl, P., Kalra, D.V., Supply Chain Management,
Pearson, Prentice Hall, India, 2009. [5] Nargundkar, R. Marketing Research, TMH, India, 2011.
[6] Pattnaik, M., Inventory Models: A Management Perspective, Lambart Academic Publication, Germany, 2014.
[7] Pattnaik, M., Models of Inventory Control, Lambart Academic Publication, Germany, 2012.
[8] Sople, V.V., Logistics Management, Pearson Education, India, 2009.
[9] Swarup, K., Gupta, P.K., Manmohan, Operations Research, Sultan Chand & Sons, India, 2003.
[10] www.businessball.com [11] www.kesocorp.com
Exhibit 1. History of Kesoram Industries Ltd

44 Journal of Business and Management Sciences
Exhibit 2. Kesoram Industries Ltd
Exhibit 3. CEO Basant Kumar Birla
Exhibit 4. Market Position of Birla Tyre
Exhibit 5. Production Capacity of Birla Tyre
Exhibit 6. Accreditation of Birla Tyre
Exhibit 7. Product Mix of Domestic Bias Tyres of Trucks & Bus