Embed Size (px)
Citation preview

GÓRNICTWO I GEOLOGIA 2011 Tom 6 Zeszyt 1 Zdeněk KALÁB1), Markéta LEDNICKÁ2), Alexej A. LYUBUSHIN3)
1)Institute of Geonics of the ASCR, Ostrava – Poruba 2)Institute of Geonics of the ASCR, Czech Republic; also VSB, Ostrava – Poruba 3)Institute of Physics of the Earth, Russian Academy of Sciences, Moscow PROCESSING OF MINING INDUCED SEISMIC EVENTS BY SPECTRA ANALYZER SOFTWARE
Summary. This paper deals with presentation of using of wavelet transform for processing of mining induced seismic events. This procedure is presented on example of wave patterns recorded in Karviná region. Main presented result is wavelet-packed decomposition, or time-frequency map of logarithm of squared Morlet continuous wavelet transform coefficients. It is documented that this processing contributes to vivid frequency analysis and to cluster analysis of wave patterns. ANALIZA ZJAWISK SEJSMICZNYCH, INDUKOWANYCH DZIAŁALNOŚCIĄ GÓRNICZĄ, ZA POMOCĄ OPROGRAMOWANIA OPARTEGO NA ANLIZIE SPEKTRALNEJ
Streszczenie. W artykule przedstawiono zastosowanie transformaty falkowej do analizy zjawisk sejsmicznych indukowanych działalnością górniczą, wraz z przykładem opartym na zapisie drgań zarejestrowanych w regionie Karvina. Zaprezentowano również wyniki badań w postaci dekompozycji pakietu falkowego oraz w postaci zapisu czasowo-częstotliwościowego ciągłej transformaty falkowej Morleta. Wyniki analiz wskazują na dużą przydatność zaprezentowanej metody do analiz częstotliwościowych oraz klastrowej analizy przebiegu fal. 1. Introduction
Common types of processing and analysing the signals are often based on the Fourier
transforms, eventually, on the windowed Fourier transforms. At present, wavelet transform,
especially discrete wavelet transform, has been used in many scientific branches.
Mathematics integral transform and operator calculus, physics quantum mechanics,
astrophysics, seismology and seismic investigation and digital signal processing are the most
frequent application fields.

76 Z. Kaláb, M. Lednická, A.A. Lyubushin
Wavelet transform (WT) is another type of digital data analysis in time-frequency domain
connected with common filtering. The mathematical theory of the WT was actively developed
in last decades (e.g., Cohen and Chen, 1993, Daubechies, 1992, Koornwinder, 1993, Meyer,
1993, Szu and Telfer, 1994). Description of the WT was defined as follow (e.g. Cohen and
Chen, 1993):
The wavelet function is „oscillatory“ in the sense that it takes on positive and negative
values due to a fundamental property dictating that the integral of the wavelet function is
zero;
The wavelet function is localized in the sense that it is magnitude falls with distance from
its „main lobe“.
The most popular application of this procedure is compression and decompression of data.
First using of wavelet transform in seismology was also focused on compression of data
(signals). The algorithm, which we apply to the computation of the wavelet transform, is
based on the pyramidal algorithm and this procedure is used for interpretation of data.
Initial results of processing of mining induced seismic events from Karviná region were
presented in 1996/1997 (e.g. Častová et al., 1996, Častová and Kaláb, 1997). In these
contributions, the discrete wavelet transform was applied to the construction of a 3-dimension
mapping of the time-frequency decomposition. Spatial mapping of results was used for
concise presentation and for the type analysis of the decomposed wave pattern and for the
evaluation of the prevailing frequency in the analyzed part of signal. The wavelet transform
was also applied to the smoothing of recorded signals. Kaláb and Častová (2007) presented
summary of obtained results during decade of using wavelet transform for interpretation of
wave patterns of mining induced seismic events from Karviná region.
Special program named “Spectra Analyzer”, which was developed by prof. Lyubushin for
analysis of geophysical and other signals (Lyubushin, 2007), was used for analysis of
seismological signals in this paper. This program includes options of spectral and time-
frequency analysis, band-pass filtering, wavelet-packet decomposition and nonlinear wavelet
threshold filters, estimating trends by Gaussian kernel and local polynomial smoothing, etc.
2. Analysed data
Data from experimental seismological measurement that was performed in Stonava
village in the Karviná region in the year 2009 were used. Five temporary seismic stations

Processing of mining induced seismic…
77
were placed in buildings at the surface above the actually exploited coalface. Seismic stations
GAIA (VISTEC Company) with three-component sensors ViGeo2 and/or LE3D were used
for this measurement. Seismic data were recorded in continual mode; sampling rate was set to
250 samples per second. Continual mode of data recording enables to detect not only strong
mining induced seismic events, but also weak events with maximum amplitude comparable to
seismic noise level in given locality. These continual data series are useful also for analysis of
long time data, including seismic noise (Kaláb and Lyubushin, 2008).
Example of wave pattern of mining induced seismic event used for the wavelet analysis is
presented on Fig. 1. Horizontal axis presents time in seconds, vertical axis presents vibration
velocity in counts, where 1Mcnt = 2.975 mm.s-1. This event was recorded at Stonava seismic
station, its maximum vibration velocity was 0.25 mm.s-1.
Fig. 1. Wave pattern of mining induced seismic event (Components Z, N, E are top-down respectively) Rys. 1. Przebieg fali sejsmicznej wywołanej działalnością górniczą (składowe Z, N, E)
3. “Spectra Analyzer”
Interactive program “Spectra Analyzer” was developed for data mining properties of
scalar time series. This program enables:
Estimates power spectra of scalar time series of an arbitrary length;
Performs smoothing and detrending by Gaussian kernel or local polynomial (0 <= order
<= 10) within moving time window of the given length or for the whole series;
Makes Fourier bandpass filtering after selecting frequency band at the spectra graph
('Zoom Spectra' operation);
Estimates power spectra evolution within moving time window using AR-model;

78 Z. Kaláb, M. Lednická, A.A. Lyubushin
Makes orthogonal wavelet packet decomposition by splitting detail levels into 1, 2, 4 or 8
sub-levels;
Makes wavelet threshold filtering by selecting 'large' and 'small' values of absolute
wavelet coefficients;
Finds long chains of Wavelet Transform Maximum Modulus (WTMM) skeleton of the
selected signal fragment using wavelets equal to derivatives of Gaussian of the orders 0
(usual kernel), 1 and 2 ('mexican hat');
Estimates time-frequency map of logarithm of squared Morlet continuous wavelet
transform coefficients;
Estimates time-frequency map of logarithm of squared orthogonal wavelet-packet
coefficients ('Heisenberg boxes');
Estimates best fitted low-frequency harmonic with unknown period;
Seeks for period and 2 extreme points of 'maximum wave' of the signal for fragment
length <= 500 samples;
Estimating multifractal spectrum of singularity for chosen fragment by detrended
fluctuation analysis.
In this paper, only wavelet processing of mining induced seismic event is presented.
Orthogonal wavelet packet decomposition and frequency map of logarithm of squared Morlet
continuous wavelet transform coefficients are main used procedures.
4. Obtained results
Part of horizontal component (N) of selected mining induced seismic event (Fig. 1) was
used for orthogonal wavelet packet decomposition. Power spectrum of this component is on
Fig. 2. This decomposition by the first 10 detail levels without splitting into sub-levels is
presented on the Fig. 3 (graph on the left). Orthogonal wavelet order is found automatically
by using minimum entropy criterion. After plotting each sub-level in scale (Fig. 3, graph on
the right), we can see the most important parts of the original signal depending on time
period. In this case, the most significant parts of decomposed signal occur within the time
period 0.512 – 0.064 s (frequency about 2 – 15 Hz).
Time-frequency map of logarithm of squared Morlet continuous wavelet transform
coefficients was used for next signal processing. It is necessary to use only part of processed
seismic signal with the maximum of 10,000 samples for this analysis. If the sampling

Processing of mining induced seismic…
79
frequency of recorded seismic signal is 250 Hz, than maximum length of processed part is
40s. This is sufficient length for used type of signal (i.e. mining induced seismic event). It is
necessary to resample original data for other types of processed signals with long time
duration and/or higher sampling frequencies to have possibility to use this type of analysis.
Resultant map of logarithm of squared Morlet continuous wavelet transform coefficients for
the N component of used seismic signal is on the Fig. 4. Horizontal axis represents relative
time in seconds, vertical axis is logarithm of periods, and tonality is logarithm of squared
Morlet continuous wavelet transform coefficients.
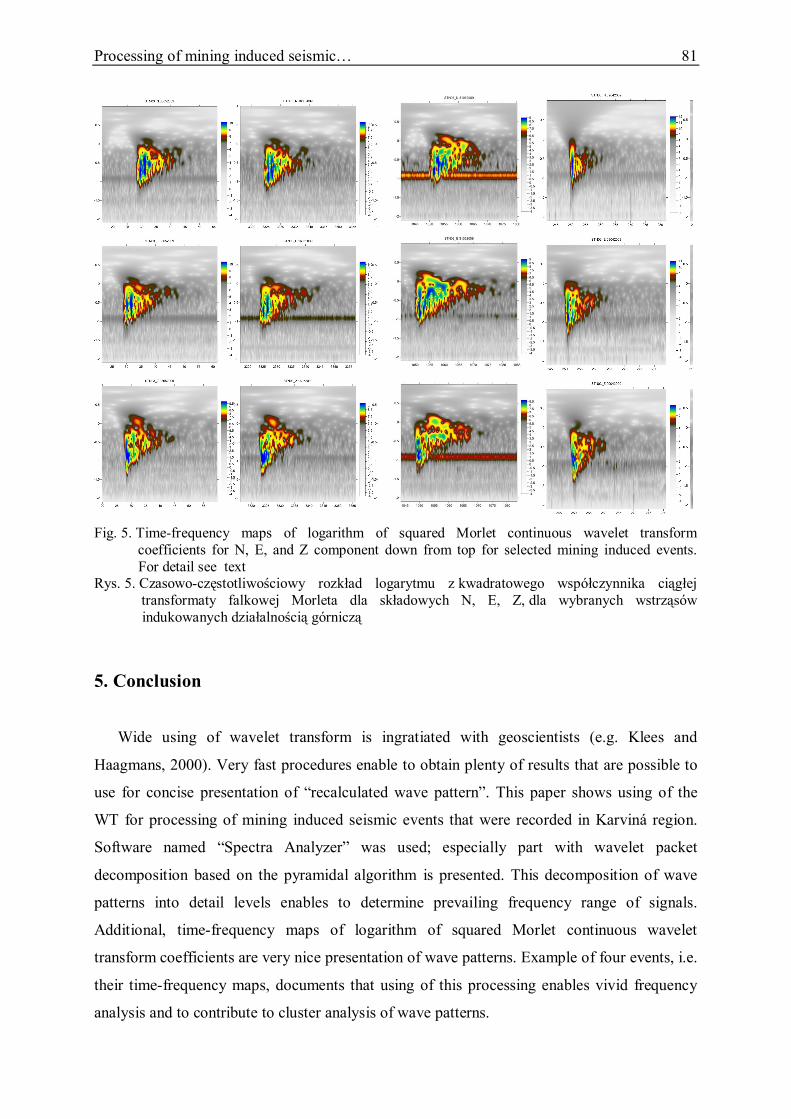
To present using of described methodology for processing of mining induced seismic
events, calculated results for four selected events are shown in Fig. 5. All events were
recorded at the same station, i.e. Stonava station. First two events (first and second columns
from left) represent weak events with approximately identical source coordinates. It is
possible to declare that the corresponding time-frequency maps have the same patterns. Next
two events (third and fourth columns from left) occurred in other directions from seismic
station (other parts of region). These maps have different patterns among each other and
also compared with first two events.
Fig. 2. Power spectra for N component of event presented on the Fig. 1 Rys. 2. Widmo mocy dla składowej N wstrząsu zaprezentowanego na rysunku 1

80 Z. Kaláb, M. Lednická, A.A. Lyubushin
Fig. 3. Orthogonal wavelet packet decomposition by the first 10 detail levels for N component of event presented on the Fig. 1. Horizontal axis represents relative time in seconds. Period range is denoted below each detail levels Rys. 3. Ortogonlana dekompozycja pakietu falek na pierwszych 10 poziomach szczegółowości dla wstrząsu przedstawionego na rys. 1. Oś pozioma wyznacza czas w sekundach. Zakres czasu opisany jest poniżej każdej charakterystyki
Fig. 4. Time-frequency map of logarithm of squared Morlet continuous wavelet transform coefficients for N component of event presented on the Fig. 1. For description see text Rys. 4. Czasowo-częstotliwościowy rozkład logarytmu z kwadratowego współczynnika ciągłej transformaty falkowej Morleta dla składowej N wstrząsu przedstawionego na rysunku 1
Processing of mining induced seismic…
81
Fig. 5. Time-frequency maps of logarithm of squared Morlet continuous wavelet transform coefficients for N, E, and Z component down from top for selected mining induced events. For detail see text Rys. 5. Czasowo-częstotliwościowy rozkład logarytmu z kwadratowego współczynnika ciągłej transformaty falkowej Morleta dla składowych N, E, Z, dla wybranych wstrząsów indukowanych działalnością górniczą
5. Conclusion
Wide using of wavelet transform is ingratiated with geoscientists (e.g. Klees and
Haagmans, 2000). Very fast procedures enable to obtain plenty of results that are possible to
use for concise presentation of “recalculated wave pattern”. This paper shows using of the
WT for processing of mining induced seismic events that were recorded in Karviná region.
Software named “Spectra Analyzer” was used; especially part with wavelet packet
decomposition based on the pyramidal algorithm is presented. This decomposition of wave
patterns into detail levels enables to determine prevailing frequency range of signals.
Additional, time-frequency maps of logarithm of squared Morlet continuous wavelet
transform coefficients are very nice presentation of wave patterns. Example of four events, i.e.
their time-frequency maps, documents that using of this processing enables vivid frequency
analysis and to contribute to cluster analysis of wave patterns.

82 Z. Kaláb, M. Lednická, A.A. Lyubushin
Software “Spectra Analyzer” is free for non-commercial use. It is possible to download
the software and the manual in English from the addresses:
http://alexeylyubushin.narod.ru/SpAn.zip http://alexeylyubushin.narod.ru/Software_for_Point_Processes_Periodicity_and_Scalar_Time_Series_Data_Mining.pdf Acknowledgement:
This research is performed with the financial support of the Research Program of the
Academy of Sciences of the Czech Republic, No. OZ 30860518 and in frame of co-operation
between Russian and Czech researchers (authors acknowledge the financial support in the
framework of the bilateral agreement RAS-AVCR, joint theme Analysis of geophysical data
using modern mathematical methods).
BIBLIOGRAPHY 1. Cohen J.K., Chen T.: Fundamentals of the discrete wavelet transform for seismic data
processing, tp://ftp.mines. colorada.edu/pub/popens/math-cs-dept/pub.93/cwp-130p.ps.z, 1993.
2. Častová N., Kaláb Z., Kučera R.: Digital Seismic Signals and their Wavelets. Seismology in Europe. Proceedings of XXV General Assembly of European Seismological Commission, Iceland, Reykjavík 1996, p. 89-93.
3. Častová N., Kaláb Z.: Use of Wavelet Transform for Processing of Mining Induced Seismic Events, [in:] Strakoš V., Kebo V., Farana, R. i Smutný L. (eds.): Mine Planning and Equipment Selection 1997. Proceedings of the Sixth International Symposium MPES, Ostrava, Czech Republic, A.A.Balkema/Rotterdam/Brookfield 1997, p. 285-291.
4. Daubechies I.: Ten lectures on wavelets. SIAM, Philadelphia 1992. 5. Kaláb Z., Častová N.: Desetiletí použití waveletové transformace pro důlně indukované
seizmické jevy na ÚGN. Transactions (Sborník vědeckých prací Vysoké školy báňské – Technické univerzity Ostrava), Řada stavební, roč. VII, č.2, Ostrava 2007, p. 43-50.
6. Kaláb Z., Lyubushin A.A.: Study of Site Effect using Mining Induced Seismic Events and Ambient Noise from Karviná Region. Acta Geodyn. et Geomater., Vol. 5, No. 2(150), Ostrava 2008, p. 105-113.
7. Klees R., Haagmans R.: Wavelets in the Geosciences. Springer Verlag, Berlin Heidelberg 2000, p. 241.
8. Koornwinder T.H.: Wavelets: An elementary treadment of theory and applications. Word Scientific, Singapore-New Jersey-London-Hong Kong 1993.
9. Lyubushin A.A.: Geophysical and Ecological Monitoring Systems Data Analysis. Nauka, Moscow 2007, p. 228.
10. Meyer Y.: Wavelets, algorithms and applications. SIAM, Philadelphia 1993. 11. Szu H.H., Telfer B.A.: Mathematics of adaptive wavelet transforms: relating continuous
with discrete transforms. Optical Engineering, 6/1994, Vol. 33, No. 7, 1994.
Recenzent: Prof. dr hab. inż. Zenon Pilecki

Processing of mining induced seismic…
83
Omówienie
Analiza falkowa jest metodą szeroko stosowaną w zagadnieniach geofizycznych. Bardzo
szybka procedura obliczeniowa pozwala na otrzymywanie dużej liczby wyników i ich
prezentację za pomocą charakterystyk czasowo-częstotliwościowych.
Artykuł przedstawia zastosowanie transformacji falkowej do analizy zjawisk
sejsmicznych wywołanych działalnością górniczą, które zarejestrowane zostały w regionie
Karvińskim. Przedstawione w ramach niniejszego artykułu analizy i rozważania
przeprowadzone zostały na podstawie programu „Spectra Analyzer” (program do
niekomercyjnego wykorzystania dostępny jest pod adresem internetowym
http://alexeylyubusmin.narod.ru/SpAm.2ip). Program ten był szczególnie przydatny do
dekompozycji przebiegu drgań za pomocą algorytmu piramidalnego, dekompozycja
przebiegu na poziomy podstawowe umożliwia określenie dominującego zakresu
częstotliwości. Dodatkowo zastosowano bardzo dogodną metodę prezentacji przebiegu fali za
pomocą czasowo-częstotliwościowych rozkładów logarytmów z kwadratowego
współczynnika ciągłej transformaty falkowej Morleta. W artykule przedstawiono wyniki
badań w postaci dekompozycji pakietu falkowego oraz w postaci zapisu czasowo-
częstotliwościowego ciągłej transformaty falkowej Morleta dla czterech wstrząsów.
Wyniki analiz wskazują na dużą przydatność zaprezentowanej metody do analiz
częstotliwościowych oraz klastrowej analizy przebiegu fal.