Embed Size (px)
Citation preview

PROCESSING CRUDE OIL: SELECTION OF TECHNOLOGIES AND PETROCHEMICALS PRODUCTS USING MULTICRITERIA METHODS.
{A CASE STUDY OF MULTILEVEL PLANNING}
Claudia García Aranda1, Faculty of Chemistry. National University of Mexico, Mexico.
Bertrand Mareschal, Faculty of Applied Sciences, Université Libre de Bruxelles, Belgium.
Carlos E. Escobar Toledo2 , Faculty of Chemistry, National University of Mexico, Mexico.
Abstract: In this paper, we propose a system of models to show the importance of Petrochemical’s Industry value added. The Petrochemical Industry is structured in a network, having different alternative routes of production and their correspondent technologies in a network formed initially from the basic until final petrochemicals. It has been considered that basic petrochemicals were produced through Refineries with a different technology composition each to other. Network techniques and multicriteria decision analysis (MCDA) were utilized in order to choose the best route of production for each petrochemical product. Demand of basic petrochemicals of each refinery configurations were modelled by means of Linear Programming (LP). The results of the MCDA analysis and the dual problem were interpreted for the case study. Finally, a comparison showed that the value of the final petrochemical products is at least so attractive than the only exportation of crude oil. Key words:, Multicriteria decision analysis, multilevel planning, network techniques, Decision support systems, Petrochemical Industry assessment; linear programming. 1. Introduction: The Petrochemical Industry. The hierarchical multilevel model planning, to be developed in this paper, to be well understood, requires a brief presentation of the Petrochemical Industry. This important Industry is a huge of network of processes and products; their characteristics are the following. The petrochemical industry system is a large, complex, and constantly changing industry. There are more than 8000 different compounds in commercial production derived from petroleum and natural gas. It is capital and energy intensive. It is also is oligopolistic in structure, nevertheless, the petrochemical products multiply their value along the chain of production until their final destination. For example: p-xylene increments 170 times in a shirt, PVC increments 40 times in a tennis ball and the acrylonytrile increments 150 times in a sweater. The Petrochemical Industry is based upon the production of chemicals from petroleum and natural gas. This industry also deals with chemicals manufactured from the by-products of petroleum refining. Also included, are chemicals produced from natural gas liquids. The structure of the petrochemical industry is extremely complex, involving thousands of chemicals and processes. It is severely cross-linked, with the products of one
1 Doctoral sudent in Chemical Engineering. 2 In sabbatical year at the Université Libre de Bruxelles. Service de Mathématiques de la Gestion.

process being the feedstock of many others. For most chemicals, the production route from feed stocks to final products is not unique, it includes many possible alternatives. As complicated, as it may seen, this structure is however comprehensible, at least in a general form (Bell, 1990; Rudd, 1981). In fact, there is a multitude of production routes available for most chemicals which are produced by more than one technology. At the beginning of the production chain, they are the raw feed stocks: petroleum and natural gas. From these feed stocks it can be produced a relatively small number of important building blocks. These building blocks include the lower olefins and aromatics: ethylene, propylene, butylenes, butadiene, benzene, toluene and xylenes. These building blocks are then converted into a complex array of thousands of intermediate and final chemicals, considering of course, their technology processes. The final products of the petrochemical industry are generally not consumed directly, but are used by other industries to manufacture consumer goods. Such versatility, adaptability and dynamic nature are three of the important features of the modern petrochemical industry. The classification and description of petrochemical end products is not an easy task, because petrochemicals find their way into such a broad diversity of products and frequently a particular product will fall into more than one category. However it is generally agreed that the main end products are in the form of polymers and copolymers: as plastics, but also elastomers, fertilizers and fibers. Other products are solvents, detergents, paints, coatings, pigments, dyes, cosmetics, pharmaceutical forms, and food uses.
1.1. The Mexico’s petrochemical industry Petrochemical industry was one of the largest Mexico’s industries. Up 25% of Mexican industries required petrochemicals in their operations at the moment of this industry was at its best level of production (1950-1990). When the oil crises and embargoes came, the environment in which the international petrochemical industry operates suddenly changed. No longer were feedstock supplies and costs steady and predictable, nor was energy consumption a minor consideration. In 90’s decade, the three critical factors in the international industry changing face were: severe cycles in profits, globalization and continuing and substantial industry learning curve effects. These critical factors with supply – demand equilibrium, have combined to the dilemma for industry global players, whose strategies have been produce, more added values by means of complex technologies. This was not the case for Mexico’s Petrochemical Industry. The Mexican politician’s decision makers, have took the decision to sell the entire infrastructure and go, briefly speaking, to sell more crude oil abroad the country, considering that it could be an interesting business. The margin benefit is at the moment more than ten times the production cost. In all these decisions the country lost the possibility of real industrialization by adding more value producing more petrochemicals for the internal market and to then develop the manufacturing industry still more. Meanwhile, China and the Asian southeast countries developed an aggressive industry based on chemicals.

The petrochemical industry abroad, has achieved flexibility, which allows it to adapt to its ever-changing environment. Then, the three critical factors and the industrial flexibility have not taken into account in Mexico’s Petrochemical Industry decision making planning and consequently, it lost both, the dynamic growth and the possibility to add value to their products. 2. Main objectives and goals: description of the problem. The main objectives of this work are: Use a coordination model in a framework of multilevel planning, in order to develop a new methodology to reduce complexity in a system with a large number of interrelated subsystems. Use different tools, as network theory, Multicriteria decision making analysis and linear programming, in order to solve a combinatory planning problem, taking the Mexican petrochemical industry as a case study with a horizon planning starting in 2003 until 2025. We have also particularly objectives, being:
• To develop a mixed methodology for selecting alternative technologies in order to develop the petrochemical industry having as a raw material, crude oil. The model goes until final products, considering its demand as exogenous variable.
• To resituate the added value of this industry having as reference the exportation of the crude oil. For do that, we will take a part of the whole exportation, to show the feasibility to produce petrochemicals with more added value than exporting only crude oil.
• To demonstrate that the production of petrochemicals being as raw material crude oil is at least equally competitive that the only exportation of it.
3. Developing the technology strategy The technology strategy utilized in this paper comes from many authors, but principally from Ackoff‘s interactive planning (Ackoff, 1981; 1987). It consists of five stages: formulation of the mess, ends planning, means planning, resource planning and implementation and control. Formulation of the mess is basically an external and internal analysis of any Petrochemical industry firm. The external analysis deals with understanding the threats and opportunities facing the petrochemical industry (Porter, 1996). The internal analysis deals with identifying strengths and weaknesses related to the internal operations and resources of it, in terms of the value added chain of the whole industry. The second phase is the ends planning. In this phase, the characteristics of a product are defined from the marketing perspective but also from the operational product design and manufacturing performance objectives in terms of cost, energy consumption, added value and some others attributes of the technology chosen to dealt with. The output of ends planning is a specification of desirable performance objectives to be met by the product or process technologies. The technology evaluation process, determine how well competing technologies might contribute to the accomplishment of all the improvement objectives.

The means planning phase should be viewed as the translation of prioritized technologies. The resource planning phase deals for determining the financial resources required for a particular project. 4. A technology evaluation model In this section we propose a model for evaluating the choice of technology in a set of petrochemical chains as case study, in order to promote the industrial development and then value added. This model serves as a focus for bringing together the results of the formulation of the mess and ends planning with technology choice as it relates to various activities along of the whole industry’s value added chains (Ford, 1988; Hamilton, 1990). The mathematical tools and its application to the petrochemical system will be: < Generalized network model (“crossing the arcs algorithm”). Used to examine the network of technologies/products to choose the different was to produce them. < Multicriteria decision making aid. Mainly, to chose the route of production and then, the intermediate products. We include four criteria to make the decision. < Multilevel coordination model, in order to coordinate the decision making. < A linear programming approach, to choice the best refinery’s configuration and product scheduling. < A model to search the equivalence between crude oil market prices, respect to the product values of a final petrochemicals along its chain of production. The following data are needed to develop the model: - Value of every petrochemical product (VP) (total costs -excluding the cost of intermediate and final products- plus i % Return on Investment); i= rate of return. - Real input-output coefficients (which exploit the underlying stoichiometric framework of Petrochemistry), for processing plants with known technology. - Total costs of production and investments for all the petrochemical processes. - In the case of investments, a source of economic and technical data, were 3 different production capacities for each one of all products/technologies in the network, given by the Process Economic Program published by Stanford Research Institute. Then, we have needed a function to find a correlation between those 3 capacities, considering economies of scale, in order to interpolate o extrapolate other capacity:
( )10,*
)log()log(log≤≤=
+=βα
βαβCapInv
CapInv (1)
Where: α and β are constants to be calculated by a regression; Inv = Investment and Cap = Production capacity. - Calculate de Value added into the whole petrochemical system. This amount is: (VP) variable costs, for each petrochemical product. - Search a set of technological configurations for a Refinery with interesting basic petrochemicals yields. This search was one of the most important contributions in the chemical engineering field [Garcia, 2006a]. - Search indexes of damage to the environment and to human health in every chemical produced along the petrochemical chains.

It is important to leave clear, that it was searched the best Refinery’s configurations among a lot of possibilities. At that point, we have dressed a technology intelligence system in order to have sufficient alternatives about those configurations. We have got a reduced number of refinery configurations and then, we design them. To have confidence of those configurations, a process simulation program was used to be sure that all of them will operate with the necessary yields, obtaining the basic petrochemicals needed. With those designs, the investment and operating costs were calculated. The system can be viewed in its general form as Figure 1 shows:
FRAMEWORK OF THE PROBLEM
( ) KkFk ,...,1=∀
Refinery configuration:
Production of basic petrochemical inputs
And Refined (energy) products.
Crude oil Availability
KaSa ,...,1=∀
A
B
C
B
C
C
DA
E
E
A
G
G
H
I
I
K
L
L
K
J
J
C
A
N
P
I M
PETROCHEMICAL PRODUCT
PETROCHEMICAL PRODUCT
A
B
C
B
C
C
DA
E
E
A
G
G
H
I
I
K
L
L
K
J
J
C
A
N
P
I M
PETROCHEMICAL PRODUCT
PETROCHEMICAL PRODUCT
Crude oil exportation
To energy meet pool demand
To the manufacturing
industry
At time “t” (t=1,…,T) of the planning horizon
( ) KkFk ,...,1=∀
Refinery configuration:
Production of basic petrochemical inputs
And Refined (energy) products.
Crude oil Availability
KaSa ,...,1=∀
A
B
C
B
C
C
DA
E
E
A
G
G
H
I
I
K
L
L
K
J
J
C
A
N
P
I M
PETROCHEMICAL PRODUCT
PETROCHEMICAL PRODUCT
A
B
C
B
C
C
DA
E
E
A
G
G
H
I
I
K
L
L
K
J
J
C
A
N
P
I M
PETROCHEMICAL PRODUCT
PETROCHEMICAL PRODUCT
A
B
C
B
C
C
DA
E
E
A
G
G
H
I
I
K
L
L
K
J
J
C
A
N
P
I M
PETROCHEMICAL PRODUCT
PETROCHEMICAL PRODUCT
A
B
C
B
C
C
DA
E
E
A
G
G
H
I
I
K
L
L
K
J
J
C
A
N
P
I M
PETROCHEMICAL PRODUCT
PETROCHEMICAL PRODUCT
Crude oil exportation
To energy meet pool demand
To the manufacturing
industry
At time “t” (t=1,…,T) of the planning horizon
Figura 1.
4.1. Petrochemical Technology Assessment.
4.1.1. Linear Programming approach
A lot of important works on the network representation of the Petrochemical Industry have been done since 1981, considering the ever changing nature of this industry and the uncertain environment in which it operates. To explain briefly, Stadtherr (1978) was the first to model the petrochemical industry, developing a linear model, which exploits its underlying stoichiometric framework. Having found that 40% to 80% of production costs are typically accounted for by the feedstock costs, and then he has chosen to optimize feedstock consumption. They determined that the weight fraction of carbon made a better criterion for measuring feedstock consumption. This model can be represented by:

M1,..., c x N..., 1, d q N 1,..., s p
N 1,..., 0 q - x a p
:to Subject
p ω Minimize
jjj
iii
iii
iij
M
1 j iji
i
N
1 ici
=∀≤=∀≥=∀≤
=∀=+∑
∑
=
=
(2)
Where M = number of processes; N = number of chemicals; xj = production level of process j; pi = feedstock of chemical i consumed; qj = amount of chemical i produced; aij amount of chemical i produced by process j (> 0 if chemical i is produced, < 0 if i is consumed, = 0 otherwise); ci = weight of fraction carbon in chemical i; si = available supplies of feedstock i; di = consumer demand for chemical i; cj = industrial capacity for process j.
4.1.2. Network approach Chavez (1986) has used PASCAL to build a graphical linked data structure, with the nodes representing the chemicals and processes, and arcs indicating the relations between them. Then, through recursive programming, the procedure could traverse the graph both up-and downstream to observe the affects of any perturbations. In this manner it is possible to examine the process individually, within the context of the industry, rather than observing all of the process as a single unit. This removes the tendency (found in LP formulations) to operate one section of the industry sub-optimally in order to improve some industry – wide objective function. For the Mexican Petrochemical Industry, Escobar and Rodriguez (1994) have used the same approach, focusing it to increment the value added along the chain of production, being the value added the difference between price and variable cost.
4.1.3. Multiobjective linear programming model. In Escobar (2001), it is considered a strategic model of Petrochemical Expansion. It was examined the different efforts about the industry modelling; it was developed a strategically model concerning the industrial expansion in a petrochemical firm producing multiple products in several economic regions. Both the expansion of existing facilities and the development of new industrial sites were considered. Multiple objective linear programming is used as a basis for making tradeoffs among the various economic and operational factors considered for an industrial petrochemical expansion: 1. Maximization of the return on capital invested. 2. Minimization of the costs of production and transportation. 3. Minimization of capital invested in new facilities. 4. Maximization of the total output of a particular output in a region. 5. Maximization of the total output of existing facilities within a particular region. In order to define the interval criteria weights in the model, it is utilized the Analytic Hierarchy Process to bring them closer to the decision maker preferences.
4.2. Network model representation of the Petrochemical Industry Our assessment technological model is based as it is pointed out in section 3, to analyse the industry, by traversing a graphical data structure representative of the process/product network structure.

The network structure processes and products linked by “chains of production” in a production route are shown in Figure 2. As it can be seen, there are five important elements on this network. The first, on the left hand side are a few “basic” products (coming from a petroleum refinery production). On the contrary, there is a huge quantity of “intermediate products” in the network; being these products one hundred times more than the basic products. The final of the network there also are a few “final products”. Second, the intermediate products can be shared to produce the final products, beginning always with any one or more of basics. Third, in order to traverse the arcs, one should know (exogenously) which final products are needed to be produced. Fourth, it exits always at least one associated process of production for a product. Fifth, it is necessary to choose the technological route to take, in order to know the inputs of the final products, needed to be produce, Considering the ever stoichiometric characteristic of chemical reactions, it is possible to build a petrochemical chain. In this network a same compound can be produced trough different inputs, i.e. different chains of production will be considered as well different processes with diverse set of raw materials. The number of possible combinations of feasible process/products which can produce a given final product is very large. This characteristic makes them a combinatory problem to be solved. To traverse the arcs it is necessary to go from the right hand side to the left hand side arcs, i.e. from final to basic petrochemicals. In this step the best technological routes will be selected by means of both, generalized network techniques and multicriteria decision making. The quantities of basic petrochemicals, which a refinery should produce, will be then defined.
A
B
C
B
C
C
DA
E
E
A
G
G
H
I
I
K
L
L
K
J
J
C
A
N
P
I M
PETROCHEMICAL PRODUCT
PETROCHEMICAL PRODUCT
RAW
MATERIALS
FINAL
PRODUCUCTS
First step: Going from final to basic petrochemicals. Choosing the chain.
Second step: Going from basic to final products.
The final product’s ranking.
GRAFICAL REPRESENTATION OF PETROCHEMICAL PROCESS AND PRODUCTS
A
B
C
B
C
C
DA
E
E
A
G
G
H
I
I
K
L
L
K
J
J
C
A
N
P
I M
PETROCHEMICAL PRODUCT
PETROCHEMICAL PRODUCT
RAW
MATERIALS
FINAL
PRODUCUCTS
First step: Going from final to basic petrochemicals. Choosing the chain.
Second step: Going from basic to final products.
The final product’s ranking.
A
B
C
B
C
C
DA
E
E
A
G
G
H
I
I
K
L
L
K
J
J
C
A
N
P
I M
PETROCHEMICAL PRODUCT
PETROCHEMICAL PRODUCT
A
B
C
B
C
C
DA
E
E
A
G
G
H
I
I
K
L
L
K
J
J
C
A
N
P
I M
PETROCHEMICAL PRODUCT
PETROCHEMICAL PRODUCT
RAW
MATERIALS
FINAL
PRODUCUCTS
First step: Going from final to basic petrochemicals. Choosing the chain.
Second step: Going from basic to final products.
The final product’s ranking.
GRAFICAL REPRESENTATION OF PETROCHEMICAL PROCESS AND PRODUCTS
Figura 2.
The “traversing the arcs” algorithm can be expressed mathematically as the Generalized Network Problem (GNP) [Wagner, 1970]:

From GNP, we will only use the following constraints: Let xij = the amount of flow over arc (i, j) during the planning horizon. Then a generalized network model is:
""int11
knodeermediaryeachforTxx k
p
iik
p
jkj =−∑∑
== (3)
Considering that the production capacity of a petrochemical plants i, (i=1,2,…m) is S. There are n different final products whose annual demand is known and named, Dj for each product j (j=1,2,…n) measured in tons per year. For different petrochemical plants and aij indicates the corresponding relative production efficiencies (input/output), i.e. the real stoichiometric coefficients of chemical reactions described in the network. Then we have the following additional constraints:
miforSx i
n
jij ,...,2,1
1
=≤∑=
(4)
and,
∑=
=≥m
ijijij njforDxa
1
,...,2,1 (5)
jandiallforxij 0> (6) The algorithm we have constructed utilizes the equations 3 to 6 and was constructed by Sevilla (2006). Then for “traversing the arcs” of the network composed by final products with an exogenous demand, intermediate and basic products, we “induced” the demand required meeting the final’s products. Once the arcs are traversed and the demands of intermediate and basic products are calculated, we will utilize a multicriteria method in order to focus on the best route of production and reduce the dimension of the complexity due to the combinatorial problem. 5. Multicriteria decision analysis (MCDA) To evaluate the best petrochemical chain for a given final petrochemical, we have utilized multicriteria decision analysis. The criteria we will use are: Maximization of the added value along the petrochemical chains (routes) in order to produce the final petrochemical “pi“ Minimization of investments required trough the petrochemical chains to produce the final petrochemical product “pi“ Minimization of the real quantity of energy needed by different process/products along the petrochemical chains to produce the final petrochemical “pi“ Minimization of the risk of damage the environment by any of the products along the petrochemical chains for producing the final product “pi“ We don’t discuss here the importance of Multicriteria Methods, but a lot of bibliography is available to the interested lector. See: (Brans, 1982, 1996; Brans, Mareschal, and Vincke 1984, Brans, and Mareschal, 1992, 1994, 1995, Brans, and

Vincke, 1985; Macharis, Brans, and Mareschal, 1998; Mareschal, 1987, 1988; Vanderpooten and Vincke, 1989; Roy and Vincke, 1981, 1985; Roy, 1968, 1971, 1974, 1978; Roy and Galland, 1973), among others. When only one criterion function had to be optimized, different aspects have not to be included to take a decision. Nevertheless, most of the time, we have to deal with conflicting criterions when facing a complex and global problem. The process of making a decision generally involves four phases although the decision maker is usually not conscious of these phases. During this process the phases are: information, conception, choice and retrospective analysis. The order between these phases can of course be different and is often characterized by passages from one phase to another, depending on the progression of the consideration. The phase of information corresponds to the horizon seeing. The candidates to a solution, called the actions, are detected and considered as well as the conceivable criteria. The phase of conception, on the other hand, allows defining the set of choice, The decision making is done on the final set of actions, not necessarily corresponding to the initial one. The retrospective analysis is rarely done by a formal study but is certainly in the decision maker’s mind.
5.1. MCDA Methods We have thus given in the basic notions above, definitions and concepts related to the MCDA problematic. The following section will be dedicated only to a short review of methods which permit to tackle the different problems pointed out in above sections. It is of course impossible to treat all the existing methods. Nevertheless, we can distinguish 3 families of methods: the multi-attribute utility methods, outranking methods and interactive methods. They differs in the way of how they take into account the decision maker’s criteria and preferences. We will only refer to the so named Outranking methods defining first the outranking relations as follows: an outranking relation is a binary relation, defined on the set A | ai S aj if, given the information about the decision maker’s preference, the evaluations of these actions and the nature of the problem, there is enough arguments to admit that action ai is at least as well as action aj, while there is no argument to deny this consideration. Several methods have been developed from this point traducing this general idea in different mathematically ways. Let us remark that this relation doesn’t have to be complete neither transitive. This relation leads in the beginning to a pair wise comparison between actions. The second step is thus to exploit this result according to the treated problem. One of the more important methods of this kind is the PROMETHEE family. These methods are used to tackle decision’s problems and the methodology is as follows: Computation of a single-criterion preference degree: This degree reflects the decision maker’s preference of an action over another action while considering just one criterion. This preference degree is presented by a preference function Pk for criterion “k” and is in function of the differences taken by the actions on this criterion. If the difference is small, then the preference will be small too. A weight is associated to each criterion. This weight permits to aggregate all the preference degree on a single-criterion as a marginal contribution to one preference degree.

Complementary to these methods, it has been proposed a way to construct interactively, with the decision maker, the preferences functions and to analyze the results’ sensitivity in function of the weights. This has lead to a geometrical tool to explore the structure of the decision problem, and to vision the results in a plane called the Gaia plane (Mareschal, 1987, 1988). The GAIA plane provides a comprehensive view of the decision problem:
• Criteria (or grouped categories of criteria) are represented by axes which orientation permits to detect conflicts between criteria
• Actions are represented by symbols which position inform about their strong and weak features
• A ‘Pi’ decision axis representing the weighting of the criteria and their compromise.
We will remember some characteristics of PROMETHEE II. This method that we are going to use consists of the (PII, III) complete ranking. It is necessary a complete ranking because we need the best technological Routes (process and products included) with the criteria have been considered. The PROMETHEE ranking is based on netflow ( )aφ that is computed from the pairwise comparison. It is the balance between the positive and negative outranking flows, so that:
( ) ( )( ) ( )baifbaI
baifbaPII
II
φφφφ
=>
(7)
When PROMETHEE II is considered, all our technological alternatives for a given final petrochemical are comparable and the following properties hold:
( )
( )∑∈
=
≤≤−
Ax
aand
a
0
11
φ
φ
(8)
When ( ) 0>aφ , “a” is more outranking all alternatives on all criteria, when ( ) 0<aφ it is more outranked. According to definitions given in Brans, Mareschal and Vincke (Brans, JP & B. Mareschal, Vincke, P, 1984), we have:
( ) ( ) ( )[ ]∑∑= ∈
−−
=k
j Axjjj waxPxaP
na
1
,,1
1φ (9)
consequently,
( ) ( ) j
k
jj waa ∑
=
=1
φφ (10)
if,
( ) ( )[ ]∑∈
−−
=Ax
jjj axPxaPn
,,1
1φ (11)
where n = number of actions and wj is the weight of criterion j.

In our case, we will able to select a set of the best technological alternative’s routes for each final petrochemical and also the best subset of final petrochemicals, taking into account a set of constraints regarding the refineries technical configuration. With this purpose, we will remember the PROMETHEE V method. Let {ai, i=1, 2, n} be the set of possible alternatives and let us associate the following Boolean variables to them: xi=1 if ai is selected and 0, if not. The PROMETHEE V procedure consists of the two following steps: Step 1. The multicriteria problem is considered first, without constraints. As our case, we have utilized PROMETHEE II; rankings are obtained and the net flows for the best technological routes for each final petrochemical have been computed. And also the subset of the best final petrochemicals. Step 2. The following linear program could be considered in order to take into account additional constraints.
( )
{ }
1
,. . : , , 1, 2,...,
0; 1,...,
k
i ii
p i i p
i
Max a x
s t x p P
x i n
φ
λ β
=
= ≥ ≤ =
≥ =
∑
∑ (12)
where ip ,λ and pβ are coefficients and right hand sides associated to the constraints. The coefficients of the objective function are the net outranking flows. 6. Multilevel Planning
6.1. The coordination models A lot of works have been done in this field; we refer to the lector to references as, (Armand, 1968; Arrow and Hurwicz, 1960; Aubin, 1973; Bensoussan, 1972; Dantizg and Wolfe, 1960; Escobar, 1979, 1983; Escobar and Trémolières, 1978; Geoffrion, 1970; Kornai, J. and Liptak, Th. 1965; Kornai, J. 1969, 1973; Malinvaud, 1967; Walras, 1954). Since more than 20 years the theoretical literature about this kind of models (as well designed as decentralized or decomposition) has been large; nevertheless the applications, are practically inexistent, because the globalization of the markets. In our case we will utilize the framework of multilevel planning considering that the oil industry in Mexico is state owned. The three steps to coordinate the decision making will be: Consider a hierarchy of three levels, the first level, represents the Central Unit that receives information from “the market”. The market demands of some final petrochemicals, a time “t” (t= 1, T). This information came from econometric and prospective models, exogenously performed. The information (the calculated demand for one “t” of the horizon planning), is transmitted the “Central Unit”, which is a strategic planning centre. This Central Unit also coordinates the levels below it.

The Central Unit (CU) will then transmit the information to the next two lower levels, named “The Refinery” and the “Final and intermediate petrochemicals’ Producers”. At the same time the CU, is transmitting the information to decentralize the decisions. At the second level, the Refinery knows the conditions under which it can use crude oil to produce petrochemicals. This is considered as the first iteration. Of course all the levels have the information about the “induced” demands of intermediate and basic petrochemicals. The coordination variables under the control of the CU are the market demands of final petrochemicals and the four criteria to choose the best technological chains utilizing multicriteria decision making. See Figure 3.
Conditions:
Max AV,
Min damages to environment,
Min INV,
and
Min energy consumption.
First Level
Second Level
Third Level
The iteration steps represent the preparation of a decision to achieve the planning goal.
The chains are calculated utilizing the generalized network technique: “crossing the arcs” .
Information about the demand of a given
petrochemical.
Market
“CENTRAL UNIT”
Refineriesproducing basic petrochemicals
Final and intermediate petrochemicals producers
Chain 1 Chain 2 Chain 3 Chain 4
Information
Quantity to be produced
Alternative: Production for the
given petrochemical
Induced demands, technical and
economic information.
FIRST ITERATION
Basic petrochemical needed.
GENERAL FRAMEWORK OF MULTILEVEL DESCENTRALIZED DECISION MAKING
Alternative chains of production.
Figura 3. We present the second iteration, consisting of the answers of the decentralization procedure of the lower levels. The final petrochemical producers will select the best chain of production taking into account a multicriteria analysis. This information is returned to the CU. On the other hand these petrochemicals producers will induce the demand of basic petrochemicals. The information is communicated to the Refinery with the product values. The Refinery will inform to the CU how are the values of those petrochemicals that will be equivalent to a certain price of the crude oil. The CU, will inform to the market if it is possible to produce all the products (production=demand) or not: production < demand. See Figure 4.

Market
“CENTRAL UNIT”
Refineries
producing basic petrochemicals
Final and intermediate petrochemicals producersSelected chain
¿Production<= Demand?
PV and VA information
First Level
Second Level
Third Level
Equivalent price crude oil or valorisation crude oil
Selection of the “best”technological chain. They compete among them.
Chain 1 Chain 2 Chain 3 Chain 4
Selected chain
The central unit, the final and intermediate petrochemical producers and Refinery’s D.M. negotiate the exchange of information in a decentralized manner.
They can achieve global feasible results for the whole system.
SECOND ITERATION
GENERAL FRAMEWORK OF MULTILEVEL DESCENTRALIZED DECISION MAKING
Selected chain
Figura 4.
If the final demand is not satisfied, the CU can take the decision of import the necessary quantity to meet the final demand. But the CU, ask the producers to take a multicriteria decision making with the same criteria, but now in order to know which final products can be really considered, ordered in a hierarchy, ranking process. With this information, it will be possible to know which products are outranked to others. This valuable information serves to solve a linear programming problem to know the refinery’s assignment and scheduling solution. So, the Refinery will search their own best technological configurations with high yields of basic petrochemicals, and the petrochemical’s producers will rank the final products for each one of the final products demanded. To proceed to a this second utilization of the “traversing the arcs” algorithm, it is necessary to use the “best” chain of production for each final petrochemical and traverse the arcs in a contrary sense: from basic petrochemicals demand to final petrochemicals, using the same four criteria. It does not need the real quantity of the each basic petrochemical, but only rank the final products in order to have the same kind of information for each final petrochemical. This last information is taken for the Refinery decision makers to select finally the basic petrochemicals to be produced taking into consideration the quantity of crude oil allowed and the technical configurations. This is the third and last iteration. The CU gives the order to the Refinery to solve jointly with the petrochemical’s producers, a Linear Programming model, using as general idea the PROMETHEE 5 procedure. The linear programming model is explained in the next section. This last information is taken for the Refinery decision makers to select finally, the basic petrochemicals to be produced taking into consideration the whole added value of the chains of production and also its own. The iterative process has finished.
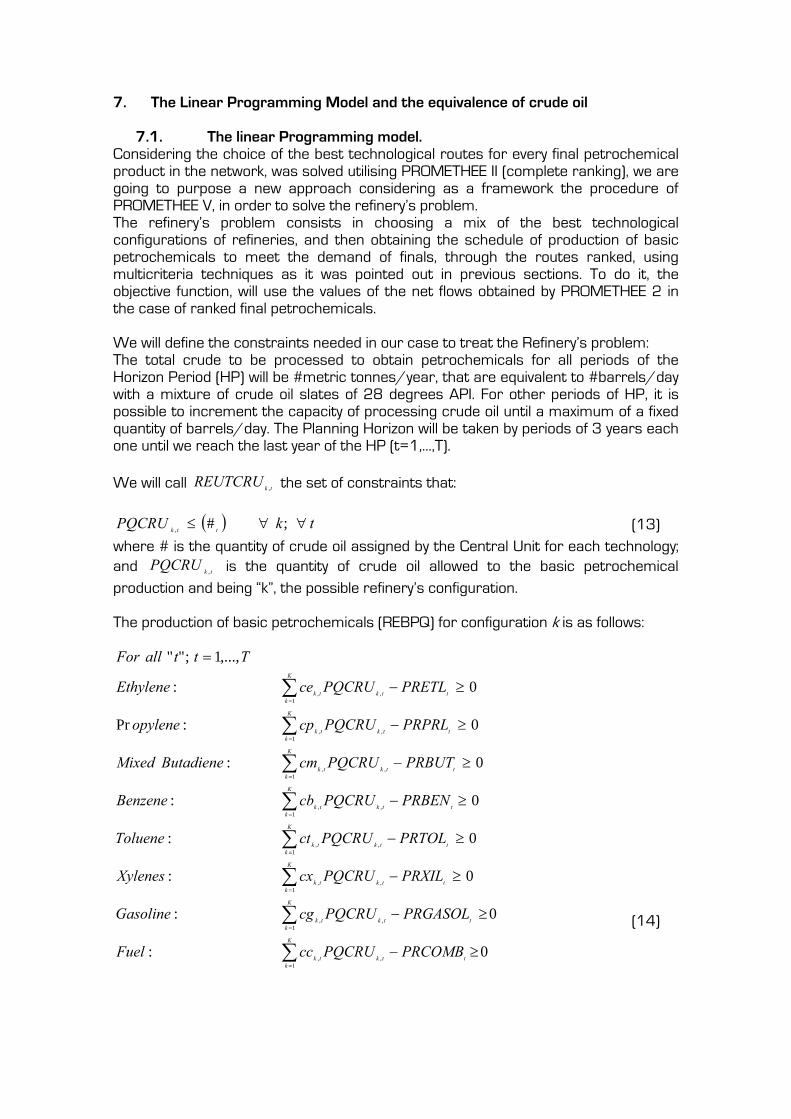
7. The Linear Programming Model and the equivalence of crude oil
7.1. The linear Programming model. Considering the choice of the best technological routes for every final petrochemical product in the network, was solved utilising PROMETHEE II (complete ranking), we are going to purpose a new approach considering as a framework the procedure of PROMETHEE V, in order to solve the refinery’s problem. The refinery’s problem consists in choosing a mix of the best technological configurations of refineries, and then obtaining the schedule of production of basic petrochemicals to meet the demand of finals, through the routes ranked, using multicriteria techniques as it was pointed out in previous sections. To do it, the objective function, will use the values of the net flows obtained by PROMETHEE 2 in the case of ranked final petrochemicals. We will define the constraints needed in our case to treat the Refinery’s problem: The total crude to be processed to obtain petrochemicals for all periods of the Horizon Period (HP) will be #metric tonnes/year, that are equivalent to #barrels/day with a mixture of crude oil slates of 28 degrees API. For other periods of HP, it is possible to increment the capacity of processing crude oil until a maximum of a fixed quantity of barrels/day. The Planning Horizon will be taken by periods of 3 years each one until we reach the last year of the HP (t=1,…,T). We will call tkREUTCRU , the set of constraints that:
( ) tkPQCRU ttk ∀∀≤ ;#, (13) where # is the quantity of crude oil assigned by the Central Unit for each technology; and tkPQCRU , is the quantity of crude oil allowed to the basic petrochemical production and being “k”, the possible refinery’s configuration. The production of basic petrochemicals (REBPQ) for configuration k is as follows:
∑
∑
∑
∑
∑
=
=
=
=
=
≥−
≥−
≥−
≥−
≥−
=
K
kttktk
K
kttktk
ttk
K
ktk
K
kttktk
K
kttktk
PRTOLPQCRUctToluene
PRBENPQCRUcbBenzene
PRBUTPQCRUcmButadieneMixed
PRPRLPQCRUcpopylene
PRETLPQCRUceEthylene
TttallFor
1,,
1,,
,1
,
1,,
1,,
0:
0:
0:
0:Pr
0:
,...,1;""
∑
∑
∑
=
=
=
≥−
≥−
≥−
K
kttktk
K
kttktk
K
kttktk
PRCOMBPQCRUccFuel
PRGASOLPQCRUcgGasoline
PRXILPQCRUcxXylenes
1,,
1,,
1,,
0:
0:
0:
(14)

Where, the coefficients in (14), tktktktktktktktkkt cccgcgcxctcbcmcpce ,,,,,,,, ,,,,,,,, are the yields in % weight of each product (ethylene, propylene, mixed butadiene, benzene, and toluene, xylenes, gasoline and fuel). These yields could be different for each “k” configuration in the period “t” of the PH.
0.:
)*(
,*,,*,
*,
,*,
=−∴
=∈
=
∈∈
∈
∈
tiLlitLli
Lli
tLli
PRBPQPRFPQcalpetrochemifinalallPRFPQand
LlcalpetrochemifinalofToncalpetrochemibasicofTon
α
α
(15)
Where LliPRFPQ
∈*, describes that for all better technological chain which has outranked all others, and Ll ∈* for all final products and for all “t” (t=1,…,T). On the other hand for each period “t”, the demand constraints ( DEMANDFPQ ) for all final petrochemical, are:
tLliDemandPRFPQ tLlitLli ,*,*,,*, ∈∈∀≤∈∈ (16)
Where tLliDemand ,*, ∈ was calculated by an econometric model and a prospective approach. Of course all variables are greater or equal to zero. The objective function is then:
( ) tPRFPQMaxLi
tLlitLli ∀∑∈
∈∈ ,*,,*,φ (17)
Being tLli ,*, ∈φ the net outranking flows came from PROMETHEE II, for each final
petrochemical ( tLliPRFPQ ,*, ∈ ) at period “t”.
7.2. Crude oil Equivalence value of one ton of versus the final petrochemical’s product value.
The problem here is to answer the following question: which is the marginal rate of substitution of petrochemicals for crude oil exportation. In others words it should be answer the following question: Which is the equilibrium price that equals the crude oil price with the product value of basic petrochemicals? To answer to this question, we present a procedure to do it, herein below.
j0,j I 0.25 d +=iVP (18)
cj ddd += 1 (19)
ccc qpd = (20)
jcci IqpdVP ,01 25.0++= (21)
All terms in equation (21) are annualized (F), where F is ( )( )( ) F
iii
i n
nn
tn =⎥
⎦
⎤⎢⎣
⎡+−+
=+∑
= 111
11
1.
Being “i” the rate of return.
( )FI
nqpFdFVP j
cci
,0
1 25.0*** ++= (22)
Then cp is:

nqFI
FdFVPp
c
j
i
c *
25.0** ,0
1 −−= (23)
Where:
iVP = Product value of petrochemical “I” through the chain of production (US$)
jI ,0 = Annualized investment of the “j” (j=1,…,6) Refinery configuration (US$)
1d = Total costs of production but not considering the crude oil (US$)
cd = Cost of the crude oil (raw material) (US$)
cp = Crude oil market price (US$/Ton)
cq = Demanded quantity of crude oil being utilized by the Refinery (Ton)
j,025.0 = 25%, is the rate of return on investment (ROI) n = Number of years in the horizon planning (HP). 8. Results obtained. In order to have a reference framework to present the results obtained in this work. We will present in Figure 5 a generalized flow sheet of the proposed methodology and then, follow with that description, the results have been obtained.
8.1. General flow sheet of the proposed methodology.
GENERAL DIAGRAM OF THE PROPOSED METHODOLOGY
Deficit of the production capacityPercent grade of the plant capacity designTrade BalanceConsumption
Define competitive petrochemical products
Marketing study forecasting
2003-2025
Descentralization Algorithm:
Multilevel planning:
From basic to final petrochemicalsFINAL RESULTS
Products: From basic to final network of processes and
petrochemicals
Crossing the arcs algorithm in order to select the technological
routes with competitive characteristics
Decision making of the set product / process
Through
Multicriteria Methods
Select ranking products
Induced demand of the basic
petrochemicals
Linear programming model to schedule refinery production
Production of the basic petrochemicals from
crude oil
Decision making of production and
investment
Set of technologies
Figura 5.
8.2. Case study
We will use a case study a part of Mexico’s Petrochemical Industry. For doing that, we define the final petrochemicals for planning. The CU receives information about the market requirements in form of demands considering t=1 as 2009, the first year of the HP t=T, the end of the HP as 2025. Table 1, gives an overview of the market needs.

Table 1. Demand overview for some final petrochemicals
YEARPRODUCT 103 (Ton/year)
2009 2025
Polystyrene (normal and expanded) 545 2 800 Polyurethane 220 556 Polyester fibers 366 2 283 Polyethylene Terephthalate resins and films (PET) 1 704 2 972 High density Polyethylene (HDPE) 1 040 3 900 Low density Polyethylene (LDPE) 1 061 2 600 Linear low density Polyethylene (LLDE) 305 728 Polypropylene 1 158 407 Styrene/Butadiene Rubber (SBR) 279 430 Acrylonytrile/Butadiene/styrene ABS) and Styrene Acrylonytrile (SAN) resins
529 887
Phtalic Anhydride 86 105 Polybutilen Terephthalate (PBT) 220 349 With this information, the CU sends it to the petrochemical producers and also to Refinery decision makers. The petrochemical’s producers (intermediate and final), will build their alternative chains of production. They proceed to make the selection of the best technological routes (chains) using multicriteria decision analysis with PROMETHEE 2, having as criteria: > Maximization of the added value along the petrochemical chains (routes) in order to produce the final petrochemical “pi“(Weight: 4.8). > Minimization of investments required trough the petrochemical chains to produce the final petrochemical product “pi“(Weight: 2.0). > Minimization of the real quantity of energy needed by different process/products along the petrochemical chains to produce the final petrochemical “pi“(Weight: 1.7). > Minimization of the risk of damage the environment by any of the products along the petrochemical chains for producing the final product “pi“(Weight: 1.5). In all cases it has been used a “V” threshold, taking as the preference limit the median of the differences between each criteria. The results from PROMETHEE 2 are presented in the Table 2.
Table 2. First step: competition among chains.
Final Petrochemical Product Number of Alternative Chains
Chain selected. Results from PROMETHEE 2

Phtalic Anhydride 2 I Polyester Fibers 9 II Styrene/Butadiene Rubber (SBR)
14 XIV
High Density Polyethylene (HDPE)
4 IV
Low Density Polyethylene (LDPE) 2 II Linear Low Density Polyethylene (LLDPE)
4 IV
Polybutilen Terephthalate (PBT) 14 II Polystyrene (normal and expanded)
14 VI
Polypropylene (PP) 4 I Polyurethane 8 VI Acrylonytrile/Butadiene/styrene (ABS) and Styrene Acrylonytrile (SAN) resins
14 II
Polyethylene Terephthalate Resins and films (PET)
9 VIII
Considering this “best” technological routes to produce the final petrochemical, the second step is to make compete products considering the technological route chosen. We also utilised PROMETHEE 2. With the same 4 criteria, same weights and same threshold function. Table 3, shows the data for this competition.
Table 3. Data to select final petrochemical products.
Final petrochemical
Selected technological chain
Min: Energy, 106 Kcal/Kg
Max: Added Value 10& US$/Kg
Min: Investment 106 US$/Kg
Min: Environmental Damages Index
Phtalic Anhydride
I 167.214 0.243 0.700 10
ABS Resins II 1081.006 0.385 0.908 22 High density Polyethylene
IV 294.394 0.117 0.252 13
Low density Polyethylene
II 771.097 0.168 0.413 10
Linear low density Polyethylene.
IV 213.598 0.156 0.311 13
PET resins VIII 1932.450 0.579 1.740 18 PBT resins II 2569.233 1.487 3.690 17 Polyester Fibers
II 2255.389 0.938 2.501 19
Polyurethane VI 4774.572 1.802 3.862 50 Polypropylene I 138.215 0.101 0.151 11 Styrene-Butadiene Rubber
XIV 2002.784 0.649 1.388 19
Polystyrene VI 2179.858 0.387 1.156 17

With these results the Petrochemical producers communicates to the CU which chain is the best for each final product. The CU asks to the final producers to make a selection of the best final products, but considering the best technological route have been chosen previously. The results, coming from data in Tables 2 and 3, are presented in Table 4.
Table 4. Final petrochemicals in competition. Results.
Final petrochemical products: Values of Φ for final petrochemicals in competition.
Phtalic Anhydride 0.0974 Polyester Fibbers 0.0245 Styrene Butadiene Rubber 0.0075 High Density Polyethylene 0.0021 Low Density Polyethylene 0.0285 Linear Low Density Polyethylene 0.0285 Poly Butylen Terephthalate 0.1063 Polystyrene -0.1568 Polypropylene 0.0463 Polyurethane -0.037 Abs-San Resins -0.0944 PET Resins -0.0527 The CU makes an exploration taking into account the quantities of basic petrochemicals needed to be produced, consulting the Refinery’s decision makers. These last decision makers look for an appropriate configuration to produce those basic petrochemicals. The first outcome is considered that all the final and intermediate petrochemicals are derivatives from benzene, toluene, orthoxylene, and paraxylene and also from ethylene, propylene and butadiene. They will search the alternative refineries configurations. The results are as follows (Garcia, 2005b,c). It was found 6 configurations having as characteristic that more petrochemicals yield they have more investment and operations costs are put into consideration. See table 5.
Table 5. Technical and economical data for Refinery’s configurations.
Refinery Configuration Weight, %
1 2 3 4 5 6
Ethylene 8.7 16.1 18.3 18.9 22.5 26.0 Propylene 4.6 9.1 11.0 12.9 12.8 15.0 Butadiene 1.5 2.8 3.4 3.1 3.9 4.6 Aromatics 4.9 8.2 9.7 14.4 12.0 13.9 Total basic petrochemicals
19.7 36.2 42.4 49.3 51.2 59.5
Gasoline 2.3 3.9 4.7 8.4 5.6 6.4 Other products 69.8 47.6 38.3 22.6 25.5 12.6 Total Investment 106 US$
346.5 450.4 517.4 570.6 595.9 686.1
Process Cost (US$/Ton of crude oil)
56.64 76.70 90.18 95.55 103.17 118.00
(US$/bbl of crude oil)
7.76 10.50 12.35 13.09 14.13 16.19

For the whole solution of the problem, it is necessary now to solve the linear programming problem having as objective function the values of the net flows obtained for PROMETHEE 2, when the final products have ranked. The results obtained will tell the decision makers how much of the final petrochemicals could be produced and also whose refinery’s configurations or a mixed of them could be possible to operate. On the other hand these results will compare the marginal value of use a ton of crude oil for producing petrochemicals instead of export it, when the marginal benefit is about 60 $/barrel. In the annexe it is calculated the equivalence of the value of one barrel of crude oil versus the final petrochemical’s value, i.e. the marginal rate of substitution of producing petrochemicals versus crude oil exportation. At the end the Refinery communicates to the CU how much crude oil can be put in operation to produce the demanded petrochemicals and also communicates to the petrochemical producers how much basic petrochemicals could be produced. Everybody hopes that the product value of the whole chain be at least equal to the benefit margin of exporting one barrel of crude oil.
8.3. Refinery’s LP Solution. The solution of LP model (set of equations 13 to 17), solved with the” LINGO" 10” SOFTWARE, is a follows: 1. – The solution had a global optimum. 2. - The solution considers the exploitation of 300,000 b/day of crude oil (15 millions ton/year), using the six technical refinery configurations at its upper limit of the availability. 3. – The final and basic petrochemical products considered in the solution, are as follows (see Table 6).
Table 6. Production of final petrochemicals
Production Ton/year
Demand Ton/year
Unsatisfied demand Ton/year
Polyester Fibres 192,855 366,000 173,145 Styrene-Butadiene Rubber 294,000 294,000 High Density Polyethylene 1,040,000 1,040,000 Low Density Polyethylene 1,061,000 1,061,000 Linear Low Density Polyethylene 305,000 305,000 Polybutilen Terephthalate 220,000 220,000 Phtalic Anhydride 86,000 86,000 Polypropylene 1,158,000 1,158,000 4. - The following data has been taken from the optimal solution; it concerns the basic petrochemicals to be produced to obtain the quantity of final’s and the quantities put on the free market to be sold (See table 7).

Table 7. Production of basic petrochemicals
Basic Petrochemicals (Ton/year)
Production (Ton/year)
Used to produce petrochemical finals (Ton/year)
Send to external market (Ton/year)
Ethylene 2,798,000 2,556,070 241,930 Propylene 1,665,500 1.204,323 461,177 Benzene 612,100 59,432 552,668 Toluene 516,000 0 516,000 Xylenes (o and p) 342,000 342,000 0 The dual of the problem has some signification: The reduced costs as well as the dual prices express that no final products will be produced if the Φ’s have a negative value; nevertheless an important set dual variables, are them associated to the upper level of crude oil quantity allowed for each refinery configuration (see equations 13). For example the more important configuration are the forth. That configuration has a dual variable many times greater than the other five, as follows: Refinery Configuration Number of times that the shadow price of
Configuration 4 is greater than: 1 6.50 2 3.61 3 2.95 5 2.50 6 2.17 Those results, tell us that it could be possible to solve a mixed integer programming problem some quite different, as follows: N k, t ( ) tkPQCRU ttk ∀∀≤ ;#, Where N k, t = an integer of the number of times that one kth refinery configuration can be repeated until the limit of 300,000 bbl/day. That’s why, we can write:
, t1
6, tK
kk
N=
≤ ∀∑
As an experiment to prove that configuration 4 is the better, we put 6 times a module of this configuration, i.e. 64 2.5 10 Ton/yearPQCRU ≤ , 6 times. We have obtained better results: the objective function has increased from 0.1334227 to 0.1376648, because it has produced the total demand of the Polyester fibers, from 192,855 Ton to 366,000 Ton. The rest of the solution was the same reported in Table 6. Other interesting results from the dual problem were that if some final products had positive values in the Objective function (i.e. their flows had been able to be positives), the production of ABS resins, were incremented the value of Objective function (reduced cost). 5. – Other calculations about the properties of the solution, are as follows:

Table 8. Product value, added values, investment and energy consumed (Millions)
Final Petrochemicals: Product value US$/year
Added value US$/Year
Investment $US
Energy Kcal/year
Polyester Fibres 428.02 180.97 428.30 434.96 Styrene-Butadiene Rubber
426.46 190.91 408.02 588.82
High Density Polyethylene 192.60 122.18 261.87 306.17 Low Density Polyethylene 266.28 178.21 438.72 818.13 Linear Low Density Polyethylene
76.80 47.51 94.96 65.15
Polybutilen TEREPHTALATE
528.26 327.23 811.82 565.52
Polypropylene 404.66 117.39 174.91 160.05 Phtalic Anhydride 29.75 20.87 60.24 14.38 Total 2,352.83 1,185.26 2,732.84 2,952.90 Refinery’s Investment 3,164.00 Total (Investment) 5,896.84 In this last Table all the values correspond to the petrochemicals chains from basic to finals and do not include nor the Refinery’s expenses as operations costs does, neither the energy use. The total investment, considering the Refinery’s is about 5, 897 millions US$. With this last figure, it is possible to express and 1US$, gives an added value of 0.20 US$, much better than nothing if the only exportation of crude is take into account. On the other hand, if it is added the sales income for the basic petrochemicals sold to the external market, the product value of 2,353 millions US$ is risen to 4,014 millions US$. This figure can be considered as an income and then, a benefit/cost relationship is about 70%. These figures do not take into account the gasoline, fuel oil and other products produced by the refineries, to be sold in the free market. 6. – Equivalence of crude oil price for the petrochemicals produced: The marginal rate of substitution. Considering that one of the objectives of this work, was to compare the equivalence of the petrochemical’s chains with one barrel of crude oil to be exported at least at $US 65 per barrel, in the following table (Table 9), it is dressed the values in terms of their crude oil equivalence. It is important to consider that these values are calculated for the whole chains, using the equations 18 to 23.
Table 9. Equivalence of final petrochemicals to one barrel of crude oil - equivalence to crude oil (US$/bbl) -
Refinery Configuration
1 2 3 4 5 6 TOTAL BYFINAL PRODUCT
Polyester Fibers 26 39 44 47 53 58 267 Styrene Butadiene Rubber
51 86 99 100 120 133 589
High Density Polyethylene
5 6 6 6 6 6 35
Low Density Polyethylene
5 6 6 6 6 7 36
Linear Low 5 6 6 6 6 7 36

Refinery Configuration
1 2 3 4 5 6 TOTAL BYFINAL PRODUCT
Density Polyethylene Polybutilen Terephthalate
6 7 7 10 7 8 45
Polypropylene 5 6 6 6 6 6 35 Phtalic Anhydride 5 5 5 6 6 6 33 The difference between the refinery’s configurations is due both, to the complexity of them and also to the fact of more complex are the refinery more basic petrochemicals products can be obtained. One can also see that with these total values for the petrochemical chains of US$/bbl 1,076 can paid more than16.5 times the exportation price of the same barrel of crude oil, i.e. US$ 65/bbl. 9. Some conclusions. < We have finish successfully with the methodology presented along this paper, considering a mix of operational research tools as the generalised net work technique jointly with multicriteria methods and linear programming, developing then, a new characterized model to coordinate decision makers at different levels of decentralized hierarchy. < We have also reduced the complexity of the combinatory decision making in order to select more efficiently the final petrochemicals chains. For do that, the first step was to make compete the different chains to obtain only one of them and then to make compete products considering that the chain was already chosen. < We have also show at the case study, that the value added of the petrochemicals products gives more than zero comparing those values with the only crude oil exportation. A multiplier of the investment of about 0.20 US$, has a great significance. If we have been able to consider that no added values have been taking into account for the manufacturing industry, the total added value would be a very good one. < We have put attention in the dual of the LP problem. From it, we have been able to select the better of technological configurations of the Refineries, putting a good extension of research to solve a mixed integer problem. < We have also been able to experiment with a “natural ranking” of the Refineries trough the shadow prices of the dual problem, whose value, help us to improve the first ‘optimal’ solution found. Here the hypothesis is that it is possible to have solutions whose dual can be give a ranking order among the industrialization of natural resources with greater value added that their exportation. < We can also show that the equivalence of the petrochemicals compared with only exportation of crude oil is well paid. It is important to mention then, that use crude oil as petrochemical raw material instead of export it is a good business and will serve to develop the industrialization of the country. < All the values coming from the whole methodology does not have the concept of real “optimal solutions” as a mathematical programming model has, but these solutions are the ‘best’ we can obtained considering the decision maker’s preferences. On the other hand a relationship of 70% of benefice/cost is very attractive one. Acknowledgement We want to acknowledge Mr. Edgar Sevilla, whose aid was very important in discussing a lot of parts of this work but overall, for the design of the software “traversing the arcs”.

References Ackoff, R. L. Creating the Corporate Future. USA: John Wiley & Sons, Inc.; 1981. Armand, R. La dècentralisation des décisions par les prix. Metra 1968; 7. Arrow, K.J. and Hurwicz, L. Decentralization and computation in resource allocation; 1960. Aubin, J.P. Multigames and decentralization in management. In: J. Cochrane (Ed.), Multiple criteria decision making. USA: Univ. of South Carolina; 1973. Bell, J.T. Modeling of the Global Petrochemical Industry. Ph.D. Thesis, Department of Chemical Engineering, University of Wisconsin-Madison, Madison, USA; 1990. Bensoussan, A. Decentralization in management. Bruxelles: European Institute for Advance Studies in Management; 1972. Brans J.P. and Vincke, P. A preference ranking organization method: The PROMETHEE method for MCDM. Management Science 1985; 31(6); 647-656. Brans J.P. The space of freedom of the decision maker modelling the human brain. European Journal of Operational Research 1996; 92(3); 593-602. Brans J.P., and Vincke P. (1985). A preference ranking organization method: The PROMETHEE method for MCDM. Management Science 1985; 31(6); 647-656. Brans J.P., Mareschal B. (1992). Promethee-V: MCDM Problems with segmentation constraints. INFOR 1992; 30(2); 85-96. Brans J.P., Mareschal B. PROMCALC & GAIA: A new decision support system for multicriteria decision aid. Decision Support Systems 1994; 12; 297-310. Brans J.P., Mareschal B. The PROMETHEE VI procedure. How to differentiate hard from soft multicriteria problems. Journal of Decision Systems 1995; 4; 213-223. Brans J.P., Mareschal B., Vincke P. PROMETHEE: A new family of outranking methods in MCDM. In: J.P. Brans (Ed.), Operational Research’84 (IFORS’84). Amsterdam, North-Holland; 1984. p. 477-490. Brans, J.P. L'ingéniérie de la décision. Elaboration d'instruments d'aide à la décision. Méthode PROMETHEE. Quebec, Canada: Université Laval; 1982. Chavez, O.E. Structural Simulation in the Analysis of the Chemical Industry. Ph.D. Thesis, University of Wisconsin-Madison, Madison, USA; 1986. Dantzig, G. B. and Wolfe, P. (1960). Decomposition Principle for Linear Programs. Operations Research 1960; 8(1) ; 101-111. Escobar, C. Modèles de décentralisation, prix de transfert et coordonnabilité dans les systèmes de Raffinage et la Planification du Gaz naturel. Thèse de doctorat en Calcul économique et Analyse de système, Groupe de Recherche e Analyse de Système et Calcul Economique (ERA-CNRS No 640), Université d’Aix-Marseille, Aix en provence, Belgium; 1979. Escobar, C. and Rodríguez, F. Metodología para la Evaluación de Tecnologías y su Aplicación en el Cálculo del Valor Agregado en Cadenas Petroquímicas. Revista del Instituto Mexicano de Ingenieros Químicos IMIQ 1994; 4, Escobar, C. and Trémoliéres, R. Dècentralisation, prix de transfert et contrôle de gestion dans les Raffineries. Aix-en-Provence: IAE (Institut d'Administration des Entreprises); 1978. Escobar, C. Descentralización y Coordinación de un Sistema Jerárquico de Oferta de Productos Petrolíferos y Petroquímicos. En: Memoria de Simposio: Modelos Matemáticos para la Planeación Energética. D.F.: Universidad Nacional Autónoma de México, Consejo Nacional de Ciencia y Tecnología; 1983. p. 85-112. Escobar-Toledo, C. Industrial Petrochemical Production Planning and Expansion: A Multi-Objective Linear Programming Approach. Revista Sociedad de Estadistíca e Investigación Operativa TOP 2001; 9(1); 77-89. Ford, D. Develop your Technology Strategy. Long range planning 1988; 21.

Garcia, C and Escobar, C. Using Multicriteria Methods for Technology/Product Selection: Processing Crude Oil to Produce Petrochemicals. XXI Euro Congress, Reykjavik: Iceland; 2006d. Garcia, C. Documento de examen predoctoral en Ingeniería (Ingeniería Química). Ciudad Universitaria (UNAM): México; 2006a. Garcia, C. Refinería petroquímica. En: C. Escobar Toledo (Ed.), Recuperación del Valor Agregado y de la Productividad en la Industria Petroquímica Mexicana. Ciudad Universitaria: México; 2006b. p. 1-44. Garcia, C. Resultados finales: Planeación jerárquica a niveles múltiples. De los petroquímicos básicos a los finales. En: C. Escobar Toledo (Ed.), Recuperación del Valor Agregado y de la Productividad en la Industria Petroquímica Mexicana. Ciudad Universitaria: México; 2006c. p. 1-26. Geoffrion, A. M. (1970). Elements of large-scale mathematical programming. Management Science 1970; 16(11); 652-691. Hamilton, W. F. (1990). The dynamics of technology and strategy. European Journal of Operational Research 1990; 47; 141-152. Kornai, J. Thoughts on multilevel planning systems. In: L. M. Goreux and A. S. Manne (Eds.), Multilevel Planning: Cases Studies in Mexico, Amsterdam: North Holland Pub. Co.; 1973. Kornai, J. and Liptak, Th. Two-Level Planning. Econometrica 1965; 33; 141-169. Kornail, J. Multilevel Programming- a first report on the model and on the experimental computation. European Economic Review 1969; 1; 134-191. Macharis, C., Brans, J.P. and Mareschal, B. The GDSS PROMETHEE procedure (a PROMETHEE-GAIA based procedure for group decision support). Journal of Decision Systems 1998; 7; 283-307. Malinvaud, E. (1967). Decentralized procedures for planning. In: E. Malinvaud and M.O.L. Bacharach (Eds.), Activity Analysis in the Theory of Growth and Planning. London: Macmillan; 1967. p. 170-208. Mareschal, B. Weight stability intervals in multicriteria decision aid. European Journal of Operational Research 1988; 33; 54-64. Mareschal, B. Aide à la décision multicritère: développements récents des méthodes PROMETHEE. Cahiers du C.E.R.O 1987; 29; 175-214. Porter, M.E. What is strategy? Harvard Business Review 1996; 61-78. Roy, B. and Vincke, P. Multicriteria analysis: Survey and new directions. Invited Review, European Journal of Operational Resarch 1981; 8(3); 207-218 Roy, B. Classement et choix en présence de points de vue multiples (la méthode ELECTRE). RIRO 1968; 8; 57-75. Roy, B. Critères multiples et modélisation des préférences (L’apport des relations de surclassement). Revue d’Economie Politique 1974; 84; 1-44. Roy, B. La modélisation des préférences: Un aspect crucial de l’aide à la décision. Revue METRA 1974; 13(2); 135-153. Rudd, D. F., Fathi-Afshar, S., Treviño, A. A. & Stadtherr, M. A. Petrochemical Technology Assessment. New York: Wiley-Interscience; 1981. Sevilla, E. De los petroquímicos finales a los básicos: Algoritmo de recorrido y métodos multicriterio. En: C. Escobar Toledo (Ed.), Recuperación del Valor Agregado y de la Productividad en la Industria Petroquímica Mexicana. Ciudad Universitaria (UNAM): México; 2006a. p. 1-25. y Apéndices. Sevilla, E. Resultados finales: Planeación jerárquica a niveles múltiples. De los petroquímicos básicos a los finales. En: C. Escobar Toledo (Ed.), Recuperación del Valor Agregado y de la Productividad en la Industria Petroquímica Mexicana. Ciudad Universitaria: México; 2006b. p. 1-26 y Apéndices. Stadtherr, M. A. (1978). A systems approach to assessing new petrochemical technology. Chemical Engineering Science 1978; 33; 921-922.

Vanderpooten D. and Vincke P. Description and analysis of some representative interactive multicriteria procedures. Mathematical and Computer Modeling 1989; 12; 1121-1238. 3. Wagner, Harvey M. Principles of Operations Research. Prentice-Hall. Englewood Cliffs, New Jersey; 1970. Walras, L. Elements of pure economics, or the theory of social wealth. London: George Allen; 1954.