Embed Size (px)
Citation preview

SYNTHETIC VISION - A VIEW IN THE FOG
Mr. Malcolm A. Burgess Dr. Robert D. Hayes 1919 Commerce Drive 605 Chestnut Hill Road Hampton, VA 23666 Marietta, GA 30064
ABSTRACT
The FAA, industry and DOD are collaborating to evaluate and demonstrate technologies permitting aircraft to land in very low visibilities over a wide range of airports. Called the Synthetic Vision System Technology Demonstration Program, the system concept provides an electronic image of the runway to the pilot on a head-up display with an overlay on the display of symbology providing all the navigation and performance information needed to fly and land the aircraft. The system concept and supporting technologies may have the potential to substantially improve the safety and reliability of landing and taking off in very low visibilities at far more airports than is possible today,
The program incorporates millimeter wave radar, infrared sensor, head-up display, and airborne computer processing technologies across a wide range of flight scenarios of interest to the civil aviation industry and to a number of government agencies. Static tests were conducted from September of 1991 through August of 1992 in an instrumented tower facility in which performance of candidate sensor technologies has been examined in measured weather conditions. Flight tests are underway in an instrumented aircraft in which sensor, total system and pilot performance are measured and documented. Testing will be complete by November and the results published early in 1993.
Theoretical performance of the system concept at 35 GHz is calculated and compared in this paper to the actual performance of the 35 GHz experimental demonstration
several technologies which, when combined into a system, are capable of providing a useful head-up image with overlying aircraft performance symbology for the pilot. This head-up "picture" would replace the visual cues lost to the pilot when operating in fog or precipitation that has obscured the visual image of the airport and desired runway.
While the SVS Technology Demonstration Program is focused on the landingldeparting aircraft application, there are a number of potential applications of these technologies having to do with airport safety of flight operations as suggested in Figure 1. The ongoing SVS work will contribute significantly to the understanding of the usefulness of these technologies in all of the potential applications. In particular, the performance available from the candidate sensor technologies, such as resolution, range, image update rates, and weather penetration will pertain to these applications. Also, many system performance findings will be relevant in areas such as display field of view and image processing.
Take off In Low Vlslbll
controller VlSblllty Enh8nComent - Weather
Emergency Vohlcb Movement Daectlon * LOW Vlsblllty Prevenllon - Nlght
Figure 1 - Potential Applications of Synthetic Vision system for typical approach and runway intrusion detection conditions. There is excellent correlation between the two. EXPERIMENTAL SYSTEM CONFIGURATION AND
STATUS The results of the tower and flight tests to date indicate
that with the experimental system, pilots are routinely able to fly to CAT IIIa minimums on the Type I ILS facilities used in the program to date using the millimeter wave sensor. Very low visibility fog and precipitation conditions encountered in the test have had little affect on the useful range of the millimeter wave sensor system.
INTRODUCTION
In 1988 the FAA, in cooperation with industry, the USAF, the Navy and several other government organizations, initiated an effort to demonstrate the capabilities of existing technologies to provide an image of the runway and surrounding environment for the pilot of aircraft landing and taking off in very low visibilities. Named the Synthetic Vision System (SVS) Technology Demonstration Program, that effort is providing a snapshot of the performance of
The SVS Technology Demonstration Program has obtained and tested a 35 Ghz millimeter wave (MMW) imaging radar built by Honeywell, a 95 Ghz millimeter wave target detection and tracking radar built by Norden, a 94 GHz millimeter wave imaging radar built by Lear Astronics, and a 3-5 micron infrared imaging camera built by Kodak. Static testing has been completed in an instrumented tower facility at Wright-Patterson AFB, Ohio. Flight testing is underway in an instrumented Gulfstream I1 (G-11) aircraft operating out of the Van Nuys, California airport. As of August 28,1992, the 35 GHz radar and the infrared camera have been operated as a part of the SVS demonstration system, for some 75 hours of flight in the G-I1 aircraft in which approximately 200 approaches have been flown to ten different airports in a variety of selected weather conditions. Approximately 100 more hours are to be flown into these airports as well 'as 6 to 8 additional airports before the
603 0-7803-0820-4/92 $3.00 0 1992 IEEE
-T I
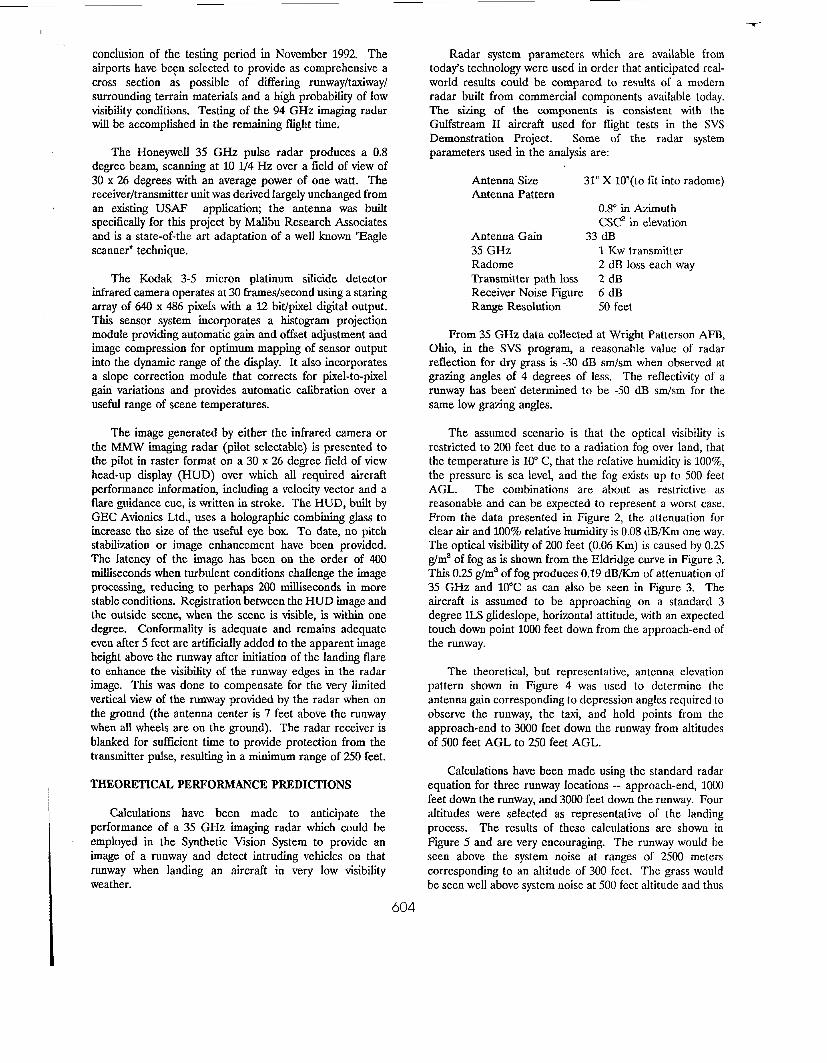
conclusion of the testing period in November 1992. The airports have beFn selected to provide as comprehensive a cross section as possible of differing runway/taxiway/ surrounding terrain materials and a high probability of low visibility conditions. Testing of the 94 GHz imaging radar will be accomplished in the remaining flight time.
The Honeywell 35 GHz pulse radar produces a 0.8 degree beam, scanning at 10 1J4 Hz over a field of view of 30 x 26 degrees with an average power of one watt. The receiver/transmitter unit was derived largely unchanged from an existing USAF application; the antenna was built specifically for this project by Malibu Research Associates and is a state-of-the art adaptation of a well known "Eagle scanner" technique.
The Kodak 3-5 micron platinum silicide detector infrared camera operates at 30 frames/second using a staring array of 640 x 486 pixels with a 12 bit/pixel digital output. This sensor system incorporates a histogram projection module providing automatic gain and offset adjustment and image compression for optimum mapping of sensor output into the dynamic range of the display. It also incorporates a slope correction module that corrects for pixel-to-pixel gain variations and provides automatic calibration over a useful range of scene temperatures.
The image generated by either the infrared camera or the MMW imaging radar (pilot selectable) is presented to the pilot in raster format on a 30 x 26 degree field of view head-up display (HUD) over which all required aircraft performance information, including a velocity vector and a flare guidance cue, is written in stroke. The HUD, built by GEC Avionics Ltd., uses a holographic combining glass to increase the size of the useful eye box. To date, no pitch stabilization or image enhancement have been provided. The latency of the image has been on the order of 400 milliseconds when turbulent conditions challenge the image processing, reducing to perhaps 200 milliseconds in more stable conditions. Registration between the HUD image and the outside scene, when the scene is visible, is within one degree. Conformality is adequate and remains adequate even after 5 feet are artificially added to the apparent image height above the runway after initiation of the landing flare to enhance the visibility of the runway edges in the radar image. This was done to compensate for the very limited vertical view of the runway provided by the radar when on the ground (the antenna center is 7 feet above the runway when all wheels are on the ground). The radar receiver is blanked for sufficient time to provide protection from the transmitter pulse, resulting in a minimum range of 250 feet.
THEORETICAL PERFORMANCE PREDICTIONS
Calculations have been made to anticipate the performance of a 35 GHz imaging radar which could be employed in the Synthetic Vision System to provide an image of a runway and detect intruding vehicles on that runway when landing an aircraft in very low visibility weather.
Radar system parameters which are available from today's technology were used in order that anticipated real- world results could be compared to results of a modern radar built from commercial components available today. The sizing of the components is consistent with the Gulfstream I1 aircraft used for flight tests in the SVS Demonstration Project. Some of the radar system parameters used in the analysis are:
Antenna Size Antenna Pattern
31" X 10"(to fit into radome)
0.8" in Azimuth CSC* in elevation
Antenna Gain 33 dB 35 GHz 1 Kw transmitter Radome Transmitter path loss 2 dB Receiver Noise Figure 6 dB Range Resolution 50 feet
2 dB loss each way
From 35 GHz data collected at Wright Patterson AFB, Ohio, in the SVS program, a reasonable value of radar reflection for dry grass is -30 dB sm/sm when observed at grazing angles of 4 degrees of less. The reflectivity of a runway has been determined to be -50 dB sdsm for the same low grazing angles.
The assumed scenario is that the optical visibility is restricted to 200 feet due to a radiation fog over land, that the temperature is lo" C, that the relative humidity is loo%, the pressure is sea level, and the fog exists up to 500 feet AGL. The combinations are about as restrictive as reasonable and can be expected to represent a worst case. From the data presented in Figure 2, the attenuation for clear air and 100% relative humidity is 0.08 dB/Km one way. The optical visibility of 200 feet (0.06 Km) is caused by 0.25 g/m3 of fog as is shown from the Eldridge curve in Figure 3, This 0.25 g/m3 of fog produces 0.19 dB/Km of attenuation of 35 GHz and 10°C as can also be seen in Figure 3. The aircraft is assumed to be approaching on a standard 3 degree ILS glideslope, horizontal attitude, with an expected touch down point 1000 feet down from the approach-end of the runway.
The theoretical, but representative, antenna elevation pattern shown in Figure 4 was used to determine the antenna gain corresponding to depression angles required to observe the runway, the taxi, and hold points from the approach-end to 3000 feet down the runway from altitudes of 500 feet AGL to 250 feet AGL.
Calculations have been made using the standard radar equation for three runway locations -- approach-end, 1000 feet down the runway, and 3000 feet down the runway. Four altitudes were selected as representative of the landing process. The results of these calculations are shown in Figure 5 and are very encouraging. The runway would be seen above the system noise at ranges of 2500 meters corresponding to an altitude of 300 feet. The grass would be seen well above system noise at 500 feet altitude and thus
604

\ ... . . . ....... . . . . . ,
::a.:;.
. . m'. I
. . . . . . , . .... ..... . . . . . . . . . . . . .
. . . . 'R
.'h
. . . . . . .. . .
i
i j j i ' i I I . . . . . . . . . . . . . . . d l l l l I I I I r l l l l l ...... I I J J w- I I I I I I - - " " I r ,. .................... ~~, * . I ,-, ',,,1-.1..",.'., 'lI , V . . I , , , I I. 9 , I , ( I . , ' . I . , , , , , , , 1 . 1 1 . 1 1 . . C ' ! , . , I . , . . , 0
605

the runway would appear as an absence of grass clutter just as soon as the radar resolution is adequate to permit identification. A 10 square meter target would be seen some 10 dB above the grass and some 23 dB above system noise even as far away as 3500 meters or from 500 feet altitude. The effects of the fog conditions described above would not be noticeable on the runway detection range or on the detection of the 10 square meter target.
I I I I I 10 6 0 a -10 -16 -a
Elevatlon Angle
Figure 5 - Typical Elevation Antenna Pattern
Depressed 1" From Aircraft Horizontal Centerline
clear, fog, and snow
0.2 0-41 0
-0.2- sn
\I=
Range (m)
rain
Os4I-- 0.2 hw raln
-
- 1 ~ ~ " " " " ' ~ " " " " ' 1500 Moo 2500 3000 3500
Range (m) LigM Rain - 1.2 mm4r Medium Rain - 5.3 mnvhr Heavy Rain - 12.9 mm/hr
Figure 6 - Tower Test Data 35 GHz Contrast
606
TEST RESULTS 1
The results of the actual testing to date of the 35 GHz experimental system have also been encouraging. The useful imaging range for a radar has been defined for purposes of this project as the range at which the average received power of the radar return from the terrain surrounding the runway differs from that of the runway or taxiway by at least 1 3 dB. This definition has-been found useful in previous I
imaging radar work as the point at which the contrast between the radar returns from adjacent areas composed of fairly homogeneous materials has enabled the human being to discriminate between the areas. As shown in Figure 6,the useful range of the 35 GHz sensor in the tower test facility was approximately 3100-3200 meters in all measured clear air, fog, snow, and light (1.2 m m h ) to medium (5.3 m m h ) rain conditions. The useful imaging range of the 35 GHz sensor in flight while on approach has been approximately 2 to 2 1/2 miles with no appreciable loss in range in the heavy fogs experienced so far (water contents from 0.1 to 0.6 g/m3). While much of the contrast has been lost in the translation from a dynamic radar image to this printed copy, Figure 7 shows the display scene by the pilot on a typical approach. This figure shows the 35 GHz image and the overlaying symbology displayed at approximately 12/3 miles from touchdown on the HUD of the G-I1 test aircraft during an approach in fog to Vandenberg AFB on August 8, 1992. The evaluation pilots in the SVS Technology Demonstration program have consistently been identifying the runway on which they intend to land at about this distance from the runway. The liquid water content of the fog typically varied during the descent from 0.6 g/m3 at the top of the cloud to 0.1 g/m3 at the base. Figure 8 shows the display seen by the pilot at approximately U3 mile at 200 feet altitude on the same approach (the decision height in a typical CAT I ILS or M U approach). While not evident in this figure due to losses in resolution in the printing process, the runway edge lights and runway distance-remaining signs were clearly visible to the pilot and can be seen in the video recording of HUD data from which this figure was taken.
I
1 I
1
1
,
The resolution of the 35 GHz experimental sensor system has been adequate, even with no image enhancement whatsoever, when used in conjunction with the aircraft performance symbology also provided on the HUD for the approach and landing. The evaluation pilots have reported Cooper-Harper ratings of 3 (satisfactory without improvement and with minimal compensation required by the pilot for desired performance) for use of this sensor in actual CAT IIIa landings (50 feet decision heightf700 feet runway visual range). The pilots are using whatever navigation and landing system is available for the runway of intended landing and are using the HUD as their sole means to conduct the published approach. As the image of the terrain becomes available from the radar sensor (typically at about 1600 to 1800 feet above the ground), confirming the satisfactory performance of the radar, the pilots begin their search for the runway. They are typically positively identdying the runway of intended landing at about 325 to

T 1 500 feet above the ground, depending on the contrast between the runway and surrounding terrain. They continue to monitor the image as they fly the electronic glide path to the published decision height and then, upon deciding that the image is providing sufficient resolution, are continuing the approach to the runway. The pilots are continuing to use the image and trapezoid of the runway image generated by the radar to position themselves between the runway edges in the center of the runway, to adjust as necessary their alignment with the runway, to kill whatever drift they may have acquired, and to confirm that their velocity vector is carrying them to the desired touchdown point. They are finding the velocity vector to be immensely helpful throughout the approach when used in conjunction with the electronic image or the outside scene (when available) to more precisely manage the control of the aircraft than has been possible without the vector.
In actual CAT IIIA landingdtake-offs and in simulated zero ceilinghero visibility landingdtake-offs, the pilots are using the flare guidance cue (the flight director symbol becomes the flare guidance cue at flare height), ILS localizer deviation and heading information in conjunction with the runway edges of the radar image trapezoid throughout the flare, touchdown and roll-out, and take-off. Their Cooper- Harper ratings for these activities have typically been 3’s on 150’ wide runways, however, they have consistently been 4 to 5 (deficiencies warrant improvement) on runways wider than 150 feet wide because of the very narrow vertical field of view of the 35 GHz experimental system radar image.
The minimum range, limited vertical field of view, and limited resolutions of the experimental 35 GHz system, taken together, do not support taxi operations using the 35 GHz sensor image.
In the SVS Technology Demonstration work to date, the infrared sensor system has performed flawlessly when operated outside visible moisture and within the design temperatures (outside air temperatures below approximately 85-90 degrees) with exceptionally long range and high resolution. Tower testing of this sensor was limited by the lack of very low visibilities at the test site during the test period and by the limited availability of the sensor. In the flight testing accomplished to date, the infrared sensor’s useful imaging range in haze and high humidity conditions substantially exceeded the range of the pilot’s eyes. These conditions were often encountered when operating just below a cloud ceiling and in the smog conditions of the Los Angeles area. They were also sometimes encountered when just departing a ragged cloud ceiling and particularly when doing so over a coastal area where there was an active surf. In measurable moisture, however, the sensor has had essentially zero range. In descending through typical cloud and fog conditions of 0.5-0.6 g/m3 liquid water content decreasing to 0.1 g/m3 liquid water content (just before breaking out of the visible moisture), the range of the infrared sensor was essentially the same as or slightly less
607
than that of the eye. Initial taxi tests of the infrared sensor in very low visibilities also show performance is not improved over human visual capability in visible moisture.
Figures 9 through 11 were taken from video data collected during flight tests at Pt. Mugu NAS in which actual runway intrusions were staged during intended touch and go approaches and take-off operations to determine the pilot’s ability to detect the intrusions.. The tests were conducted in clear air in mid afternoon. The intrusion vehicle was a GMC Suburban passenger vehicle operated in radio contact with and according to a plan coordinated beforehand between the SVS test aircraft safety pilot and the Pt. Mugu NAS ATC tower. The three intrusions were staged during an afternoon of approaches; the evaluation pilot was not aware of the plan. In Figure 9, the vehicle has been positioned at the approach end of the runway amidst the runway identifier numbers. Note the other features of the Pt. Mugu runway that have been annotated in Figure 9. The approach arresting barrier (1850 feet from the threshold), the visual “meatball” landing aid, the ILS glideslope antenndtransmitter housing, and two SVS scene calibration reflectors are clearly visible. The runway edge lights and assorted runway/taxiway markers are also clearly visible in the video data from which this figure has been reproduced. The pilot correctly determined that there was an obstacle on the runway at approximately 300 feet above the ground on the approach and initiated a missed approach at 210 feet. In Figure 10, the vehicle has been positioned in the center of the runway at approximately 3000 feet from the threshold of the runway. On that approach the pilot correctly determined that there was an obstacle on the runway at approximately 300 feet above the ground on the approach and initiated a missed approach at 250 feet above the ground. In Figure 11, the vehicle has been positioned in the center of the runway while the pilot was taxiing into position for a simulated zero ceilinghero visibility take-off. While the test crew in the SVS aircraft clearly saw the obstacle on the SVS radar images displayed elsewhere in the aircraft, the pilot had not deselected his symbology to ascertain if the runway was clear (until this point in the program, this procedure had not been established) and the symbology obscured the obstacle on the HUD image. The pilot would have initiated the take-off roll had not the safety pilot intervened. Upon deselecting the symbology, the evaluation pilot immediately saw the obstacle on the HUD image beyond the arresting barrier and stated he would not have initiated the take-off. In the course of this afternoon of SVS scene calibration, the runway intrusion vehicle was positioned at various ILS zone protection taxi hold lines adjacent to the runway to determine whether or not the reflected energy would bloom in the SVS image causing the pilot to misconstrue the obstacle as a runway intrusion. In no case did the object appear to bloom onto the runway in the image, nor did the pilot notice the vehicle among the many other objects in the field of view. In each case, the vehicle could be clearly seen as a distinct new object in the image of the runway.

1 CONCLUSIONS ,
Predicted performance of a 35 GHz Synthetic Vision System has been very close to the actual performance of the 35 GHz experimental Synthetic Vision System in tower and flight tests. In the flight tests conducted to date, the evaluation pilots have routinely landed in simulated zero ceilingzero visibility and in actual CAT IIIA conditions on the Type I ILS facilities used in the tests, The fog and precipitation conditions experimented in the tower and flight
’ tests to date have had no signifcant effect on the performance of the 35 GHz experimental system. The performance of the experimental 35 GHz system has not been adequate for taxi operations in simulated zerolzero conditions due to the sensor’s minimum range, limited vertical field of view, and limited resolution.
Figure 7 - 35 GHz SVS Head-Up Display At Pilot Runway Identification Range Vandenberg AFB - Runway 30
608

F
Vandenberg AFB - Runway 30
Point Mugu NAS - Runway 21
609

Figure 10 - 35 GHz SVS Image At Runway Intrusion Detection Point Mugu NAS - Runway 21
Figure 11 - 35 GHz SVS Image Of Runway Intrusion On Take-Off Point Mugu NAS - Runway 21
610
![[PPT]Integrated Avionics Systems - Virginia · Web viewIntegrated Avionics Systems AOE 4065 – Aircraft Design AIAA - Team #6 - 10/5/06 John Zimmer Matt Stahr What are Integrated](https://img.dokumen.tips/doc/110x75/5ab7b6437f8b9ac1058bc650/pptintegrated-avionics-systems-virginia-viewintegrated-avionics-systems-aoe.jpg)


![, Allen, C., & Rendall, T. (2019). Efficient Aero-Structural Wing AIAA Scitech … · In AIAA Scitech 2019 Forum [AIAA 2019-1701] (AIAA Scitech 2019 Forum). American Institute of](https://img.dokumen.tips/doc/110x75/6089b44b26d0b4646a6cbe59/-allen-c-rendall-t-2019-efficient-aero-structural-wing-aiaa-scitech.jpg)