Embed Size (px)
Citation preview

Proceedings
Wednesday, December 11, 2019 10:00 AM - 3:00 PM Chazy, New York

10:Life 11:and 11: 1:0Foc 1:4sus 2:3Qu 3:3 5:0 6:0Denut
:10-11:0e: Fora
:00-11:4d Feedin
:45-1:00
00-1:45 cus on T
45-2:30 sceptibl
30-3:00 uality Re
30-5:00
00-6:00
00 PM aler Metrition
DWed
00 Dr. ges and
45 Dr. ng of Ca
0 Hot L
Dr. HTransitio
Katiele to hea
Lauresearch
Tou
Dinn
Dr. eting-Th
Dairy Ddnesd
10
Rick Grd Feedin
Sarah Malves.”
Lunch av
Heather Don Cow
e Ballardat stress
ra Klaibe Update
ur of Min
ner at B
Tom Ovhe lates
Day atday, D0:00A
rant, Minng Mana
Morrison
vailable
Dann, “S Manage
rd, “Beats?”
ber, “Mine”
ner Instit
BERC Au
verton ast resear
t MineecemM -3:0
ner Instiagement
n, “Kick
e for $5,
Start theement”
t the He
ner Insti
tute Dai
uditorium
and Dr. Krch info
er Instmber 100 PM
itute, “Ht to Mak
the Col
Door P
e Lactat
eat – Are
tute Edg
iry and R
m court
Kristan Rrmation
titute1, 201
Happy Hke Your C
ld-Winte
Prizes
tion Off
e North C
ge-of-Fi
Researc
tesy of P
Reed, Cn on dair
19
erd, HaCows S
er Mana
f with a B
Country
ield Wat
ch facilit
Poulin
Cornell Fry cattle
appy mile”
gement
Bang –
y cows
ter
ties
Feed e
t

12/9/2019
1
Happy Herd, Happy Life:Forages and Feeding to Make Your Cows Smile
Rick GrantWilliam H. Miner Agricultural Research Institute
Chazy, NY
Cows respond to high quality forage…
When cows consume highly digestible fiber…
Higher milk components Less metabolic disorders Fewer foot problems Greater cow longevity Less purchased grain
Greater IOFC: +30%
(Chase, 2012)
Highest profit dairy herds can manage forages!
High vs low profit herds Ability to manage forage quality and inventory
Harvest at optimal maturity regardless of weather
Have back-up plans when things don’t work…
9% less in feed cost
(Ishler, Penn State University)
Forage Quality is More Important
than Forage Type
Forage NDF digestibility and cow performance
• +0.40 lb/d DMI
• +0.55 lb/d 4%FCM (Oba and Allen, 1999)
For every 1%-unit increase in NDF
digestibility
• +0.26 lb/d DMI
• +0.31 lb/d 3.5%FCM (Jung et al., 2010)
>40% corn silage in diet

12/9/2019
2
Response to forage digestibility varies by milk production level…
…so, target its use
Response to high-NDFD corn silage by milk production level (Ivan et al., 2004)
-15
-10
-5
0
5
10
15
10 15 20 25 30 35 40
Beginning ECM yield (kg/d)
EC
M r
esp
on
se (
kg
/d)
Overall, DMI increased by 1.4 lb/d and milk by 2.0 lb/d
Cow’s biology requires forage segregation
Assessment of forage composition and digestibility (NDF and starch) allows forages to be targeted to appropriate group of cows
Allocation of forage by production level gets more milk from forage!
Targeted allocation of forages is critical for efficient use…
Targets for forage NDF and NDF digestibility …
NutrientAlfalfa,Mean
Alfalfa,Normal range1
Grass,Mean
Grass,Normal range
NDF, % of DM 43.7 38.2 ‐ 49.3 56.7 49.9 ‐ 63.4
Lignin, % of DM 7.4 6.1 ‐ 8.6 5.2 3.5 ‐ 6.8
30‐h NDFD, % 51.5 45.4 ‐ 57.6 63.3 56.4 ‐ 70.1
1Mean plus/minus one standard deviation.Source: DairyOne Forage Lab, Ithaca, NY.
Need to target higher NDFD to maximize response to forages!
uNDFom profile: 30, 120, and 240 h (source: Cumberland Valley Analytical Services)
0
5
10
15
20
25
30
35
40
Corn Silage High NDFD CornSilage
Legume Forage Mixed Forage Grass Forage
%DM
uNDF30om uNDF120om uNDF240om
Making the most of highly digestible forages …
Low quality forage GUARANTEES
low milk production.
But, high quality forage DOES NOT ASSURE
high milk production.

12/9/2019
3
Laboratory analysis should measurethe potential nutritive value of forage, but poor feeding management reduces this potential-especially in competitive feeding environments.
Example: Excess competition at feedbunkand bare bunk disease
(Campbell and Grant, 2016)
• Overcrowding and feed restriction (1:00 am to 6:00 pm):– Up to 9 h/d greater sub‐acute rumen acidosis (pH < 5.8)
– Reduces NDF digestion rate by up to 50%
• High NDFD forage is wasted…
Cow response to forage is function of:
*Nutritive value*Management
Importance of management environment (Bach et al., 2008)
47 herds with similar genetics were fed same TMR
Mean milk yield = 65 lb/d Range: 45 to 74 lb/d
Non-dietary factors accounted for 56% of variation in milk yield Feeding for refusals (64.1 vs 60.6 lb/d)
Feed push-ups (63.7 vs 55.0 lb/d)
Stalls per cow
Feed and Feeding Environment
Stocking Density, Feed Restriction, and Dietary Fiber: Focus on Rumen pH
(Mac Campbell, 2016; 2017)
(Photos courtesy: H. Dann; M. Campbell)
Low rumen pH:Stocking density >> diet
• 100 versus 142% stocking density– 1.4 to 2 h/d greater sub‐acute acidosis (SARA; pH<5.8)
• Dietary changes (peNDF, uNDF, feed restriction)
– 0.3 to 0.9 h/d greater SARA
• Overcrowding and feed restriction
– Up to 9 h/d SARA
• Bottom line: Feeding environment affects rumen pH as much as (more than) diet itself.
(Campbell and Grant, 2019)

12/9/2019
4
Perfect recipe for low rumen pH…
High dietary starch; low peNDF, uNDF240
Overcrowding, especially >120% of stalls
Empty bunk
(Campbell and Grant, 2016)
Recumbent rumination
reduces SARA -especially under
competitive environments
y = -20.70x + 21.06R² = 0.44
0
2
4
6
8
10
12
0.5 0.6 0.7 0.8 0.9 1
Overcrowded environment
(Campbell et al., 2017)
Forage quality influences eating behavior…
As ration fiber content increases: Increased time spent eating
Longer meal length
More sorting
~5% of energy provided by feed can be used for chewing with higher NDF, lower digestibility forages.
(Alhadrami and Huber, 1991)
Overlooked component of forage quality …
Time spent eating at bunk Forage %, NDF digestibility, and particle size
Particle size in TMR versus particle size in swallowed bolus
Behavior responses to increasing diet forage content (Jiang et al., 2017)
Item 40% 50% 60% 70% Difference
DMI, lb/d 49.3 47.3 44.7 41.1 -3.7 kg/d
Eating, min/d 286 292 342 393 +107 min/d
Rumination, min/d 426 454 471 461 +35 min/d
Total chewing, min/d 712 745 813 853 +141 min/d
Resting, min/d 728 695 627 587 -141 min/d
Corn silage and alfalfa hay, primarily. Increased chewing time (mostly longer eating time) at expense of resting time.
Eating time ~5 h/d encourages natural feeding behavior (Grant and Albright, 2001).
Sieve size: 19 mm 13.2 mm 9.5 mm 6.7 mm 4.75 mm 3.35 mmMean
particle size (mm)
Diet
Low/Low peNDF, uNDF240
3 % 27 % 33 % 20 % 10 % 7 % 9.36
High/Low peNDF, uNDF240
12 % 27 % 29 % 16 % 9 % 6 % 10.42
Low/High peNDF, uNDF240
9 % 21 % 23 % 22 % 14 % 11 % 9.19
High/High peNDF, uNDF240
32 % 13 % 17 % 20 % 11 % 7 % 11.55
Bolus
Low/Low peNDF, uNDF240
1 % 11 % 38 % 26 % 14 % 10 % 7.96
High/Low peNDF, uNDF240
3 % 11 % 22 % 29 % 20 % 16 % 7.46
Low/High peNDF, uNDF240
2 % 11 % 26 % 29 % 19 % 13 % 7.51
High/High peNDF, uNDF240
5 % 12 % 19 % 28 % 21 % 14 % 7.78
Particle size reduction during eating

12/9/2019
5
Sieve size: 19 mm 13.2 mm 9.5 mm 6.7 mm 4.75 mm 3.35 mmMean
particle size (mm)
Diet
Low/Low peNDF, uNDF240
3 % 27 % 33 % 20 % 10 % 7 % 9.36
High/Low peNDF, uNDF240
12 % 27 % 29 % 16 % 9 % 6 % 10.42
Low/High peNDF, uNDF240
9 % 21 % 23 % 22 % 14 % 11 % 9.19
High/High peNDF, uNDF240
32 % 13 % 17 % 20 % 11 % 7 % 11.55
Bolus
Low/Low peNDF, uNDF240
1 % 11 % 38 % 26 % 14 % 10 % 7.96
High/Low peNDF, uNDF240
3 % 11 % 22 % 29 % 20 % 16 % 7.46
Low/High peNDF, uNDF240
2 % 11 % 26 % 29 % 19 % 13 % 7.51
High/High peNDF, uNDF240
5 % 12 % 19 % 28 % 21 % 14 % 7.78
Particle size reduction during eatingParticle size of ingested feed
(Schadt et al., 2011)
Forage typeNDF,
% of DMFeedsize,
Bolussize,
Chews/g NDF
mm mm
Long rye grass hay 57.1 … 10.3c 2.6
50-mm rye “hay” 58.6 42.2a 9.9c 3.5
19-mm PSPS hay 57.9 43.5a 10.7bc 2.2
8-mm PSPS hay 59.1 25.1b 10.8bc 1.7
1.18 PSPS hay 54.2 9.7f 8.1d 1.9
Grass silage 53.1 13.8c 11.6ab 0.4
Corn silage 48.1 12.0e 11.2bc 0.7
TMR 37.7 13.1d 12.5a 0.6
Suggested PSPS targets:Miner Institute (2017)
Sievemm
PSPS 2013
%
Miner2017
%Comments
Top 19 2-8 <5Sortable material, too long, increases time needed for eating;
especially if >10%
Mid 1 8 30-50 >50Still long and functional pef, more so than 4 mm material. Maximize amount
on this sieve, 50-60%
Mid 2 4 10-20 10-20Functions as pef sieve, no recommendation for amount to retain here other
than total on the top 3 sieves = pef
Pan ‐‐‐ 30-40 25-30 40-50% grain diet results in at least 25-30% in the pan
Keep feed in front of cowComfortable stalls
Part of a system
Recommended particle size distributions:work in progress…
Screen, mm TMR Corn silage Alfalfa silage Grass silage
19‐mm <5 3‐8 5‐15? 5‐15
8‐mm >50 50‐65 50‐75 50‐75
4‐mm 10‐20 30‐40 25‐30 20‐30
Pan 25‐30 <5 <5 <5
TLC 5/8 – 7/8 1/2‐3/4 1/4‐3/8
Considerable variation between TLC and silage particle size distribution. GOAL: chop length should ensure good packing in silo to reduce DM losses.
Forages and feeding to make your cows smile…
The Ideal Situation…
Particle size, NDFD, and forage % to allow 3 to 5 h/d eating time and meet cow requirements
Populate rumen with 2nd screen (8-10 mm) of PSPS stimulates rumination
Access to stalls to encourage recumbent rumination
Feed available 24/7 and pushed up!

12/9/2019
6
Carrying on William Miner’s vision: “Science in the Service of Agriculture.”

12/10/2019
1
Kick the Cold: Winter Management and Feeding of Calves
Sarah Morrison, Ph.D.Research Scientist, Miner Institute
2019 Dairy Day
1. Double birth weight by 56 daysEx. 85 lbs (38.5 kg) 170 lbs (77.1 kg)
→ 1.5 lbs/d (0.68 kg/d)
2. Morbidity (medical treatments) – Diarrhea <15%
– Respiratory infections <10%
3. Mortality <3%
Preweaning Gold StandardsDairy Calf and Heifer Association
Thermal Neutral Zone
• 59 to 82°F (15 to 28°C) for calf under 3 week of ageCold Stress
• Prioritization of nutrients1. Maintenance
• Thermal regulation
• Immune system
• Stress response
2. Growth
Scibilia et al., 1987; NRC, 2001
Meeting Requirements is More Challenging in Cold Temperatures
Temperature, °F
Nutrient source 59 50 41 32 23 14 5
Whole milk, qt. 2.2 2.7 3.1 3.4 3.6 3.9 4.1
Milk replacer, qt. (20% CP; 20% Fat)
2.7 3.4 3.8 4.1 4.5 4.9 5.2
Estimated from values in NRC, 2001 for 88-lb calf
Energy (ME) and Protein Requirements for BW Gain in a 110 lbs Calf
Van Amburgh and Drackley, 2005
Rate of gain (lbs/d)
DMI(lbs/d)
ME(Mcal/d)
CP(g/d)
CP(% of DM)
0.44 1.21 2.36 94 18.0
0.88 1.48 2.89 150 22.4
1.32 1.76 3.52 207 26.6
1.76 2.12 4.36 253 27.4
2.20 2.47 4.83 318 28.61NRC (2001) Assumes milk replacer with 2.14 Mcal ME/lb DM.*Thermoneutral conditions
Growth Rate and First Lactation Milk Decreased by Temperature at Time of
Birth
Soberon et al., 2012
32 52 61 67
Relative temperature at birth (°F)
Columns with different letters differ (P < 0.05)
880
660
440
220
‐880
‐660
‐440
‐220
0
‐1100TDM residuals for first‐lactation m
ilk (lbs)

12/10/2019
2
How to Increase Nutrients Provided
1. Increase solids fed per day• More milk per feeding
• An additional feeding• Increase solids concentration
2. Increase the energy density• “Arctic” or Winter blend
• Fat Supplementation
3. Increase starter intake
Other Factors Influencing Maintenance Requirements
• Housing design
• Feeding management
• Bedding type
• Calf jackets
• Wind
• Newborn management
• Colostrum
Objective of NNYADP StudyAssess impact of increasing nutrients (milk or milk replacer) fed during winter months in different
housing systems on growth and health of dairy calves in NNY
Farms that Participated
January and April of 2019
Farm A • Non‐heated barn, natural and PPT ventilation
• Group pens
• Auto feeder
• Bedded pack of sawdust and straw
Farm B • Hutches
• Fed in buckets 2x/d
• Bedded with sawdust and straw
Calf jackets were used on both farms
Farms Feeding Programs
Farm A• Commercial milk replacer 23% Protein, 22% Fat
• 15% solids • Maximum feeding level of either:
• 11.6 qt/d (11 L; Low)• 13.6 qt/d (13 L: High)
Farm B• Whole saleable milk
• Milk balancer (0.25 lbs/gal)
• Maximum feeding level of either:
• 4.8 qt/d (4.5 L; Low)• 8.8 qt/d (8.3 L: High)
Calves born on each farm were randomly assigned to 1 of 2 feeding levels specific to each farm (20 calves/feeding level)
Actual intake of milk or milk replacer not measured
Commercial starter (22% CP) and water for ad libitum intake
Volume of Milk or MR Offered
13.7
11.6
9.0
4.7

12/10/2019
3
Solids from MR Offered Farm A
4.2
3.5
Analyzed Milk Composition Farm B
Analyzed Milk Composition Farm B Analyzed Milk Composition Farm B
**23% reduction in ADG preweaningwith variable solids intake‐ Hill et al., 2008
Solids from Milk Offered Farm B
2.5
1.3
Total Solids from Milk and BalancerFarm B

12/10/2019
4
Measurements Collected on Farm• Environmental conditions. Temperature
• Feed. Samples of milk, milk replacer and starter collected weekly and analyzed for nutrient composition.
• Growth. Body weight, hip height, and BCS measured at birth, 4 and 8 week of age.
• Blood Measurements. Initial serum protein determined the first week of age
• Bedding score. Bedding score evaluated weekly• Health. Any health events or medications recorded for calves. Calves scored once weekly to evaluate signs of diarrhea and respiratory disease.
Results
Observed Environmental TemperatureFarm A
Observed Environmental TemperatureFarm B
Estimating Maintenance Requirements

12/10/2019
5
44
88
132
176
220
264
44
88
132
176
220
264
Body Weight (lbs)
Body Weight (lbs)
Body Weight
P‐values:Trt:0.41Week:<0.001Trt x week:0.86
P‐values:Trt:0.02Week:<0.001Trt x week:0.001
Goal for Body Weight by 56 days:Farm A 86 lbs to 172 lbsFarm B 89 lbs to 180 lbs
Farm A Wk 8 BWLow: 180 lbsHigh: 186 lbs
Farm B Wk 8 BWLow: 174 lbsHigh: 194 lbs
Average Daily Gain
P‐values:Trt:0.70Week:<0.001Trt x week:0.96
P‐values:Trt:0.002Week:<0.001Trt x week:0.02
Goal for Body Weight by 56 days:Farm A 1.53 lbs/dFarm B 1.59 lbs/d
Farm A Overall ADGLow: 1.54 lbs/d High: 1.58 lbs/d
Farm B Overall ADGLow: 1.74 lbs/dHigh: 2.14 lbs/d
Body Condition Score
P‐values:Trt:0.05Week:<0.001Trt x week:0.95
P‐values:Trt:0.20Week:<0.001Trt x week:0.02
Hip Height
P‐values:Trt:0.71Week:<0.001Trt x week:0.42
P‐values:Trt:0.29Week:<0.001Trt x week:0.01
Goal for Hip Height Growth by 56 days:4‐5 inches (10‐12.7 cm)
Farm A Overall HH GainLow: 4.7 inHigh: 5.7 in
Farm B Overall HH GainLow: 3.9 in High: 4.3 in
UW Madison Health Scoring
Nasal Discharge Scores
Farm B‐ Low 2.7x more likely to have elevated nasal score
12/10/2019
6
UW Madison Health Scoring
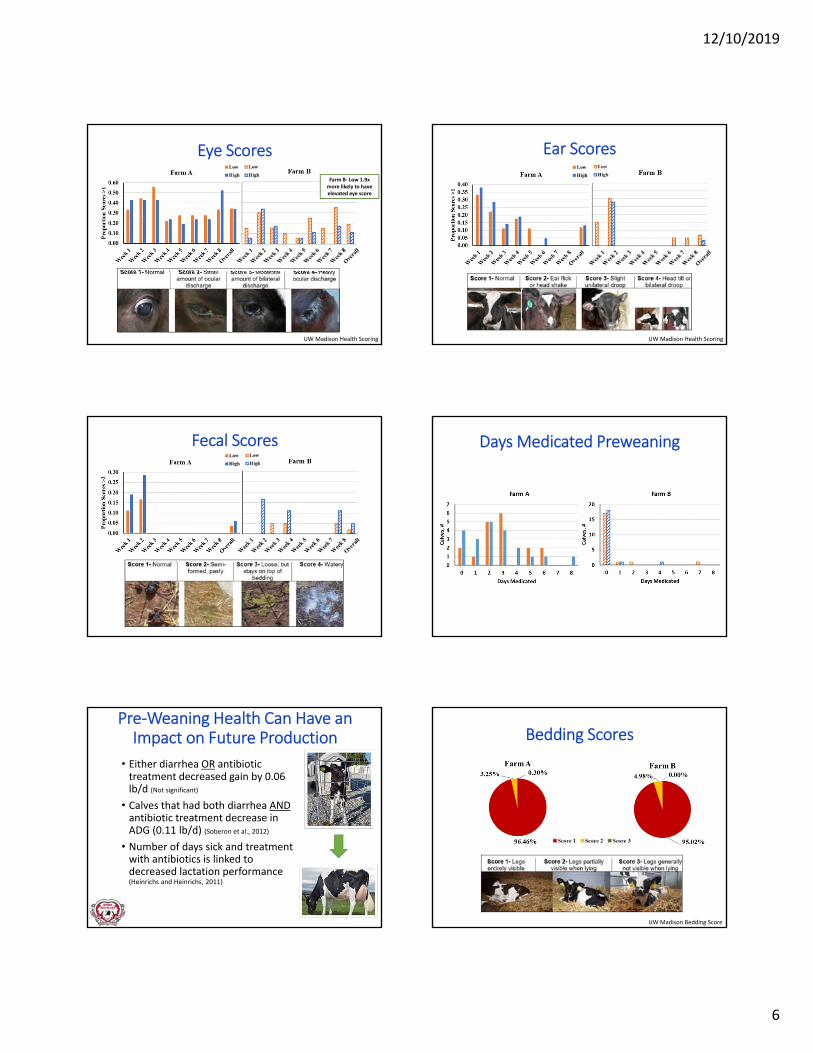
Eye Scores
Farm B‐ Low 1.9x more likely to have elevated eye score
UW Madison Health Scoring
Ear Scores
Fecal Scores Days Medicated Preweaning
Pre‐Weaning Health Can Have an Impact on Future Production
• Either diarrhea OR antibiotic treatment decreased gain by 0.06 lb/d (Not significant)
• Calves that had both diarrhea ANDantibiotic treatment decrease in ADG (0.11 lb/d) (Soberon et al., 2012)
• Number of days sick and treatment with antibiotics is linked to decreased lactation performance (Heinrichs and Heinrichs, 2011)
UW Madison Bedding Score
Bedding Scores

12/10/2019
7
Take Away Tips to Kick the Cold!Minimize the Time a Between Birth and when a Newborn Calf is Dry
• Hair coat has no insulating effect when wet
• Large surface area
• Low body fat reserves
Track Temperature at Mixing and Feeding
Temperature at Mixing
Follow Bag Instructions
Temperature at Eating
First, Middle, and Last Calf!
105‐130°F
40.5‐54.4°C
>105 °F
>40.5 °C
How to Increase Nutrients Provided
1. Increase solids fed per day• More milk per feeding
• An additional feeding• Increase solids concentration
2. Increase the energy density• “Arctic” or Winter blend
• Fat Supplementation
3. Increase starter intake
Water Intake to Starter Intake Ratio (4:1)
• 1 lb starter requires 4 lb (1/2 gallon) water intake
• Without water • Slower rumen development
• Reduces feed conversion rates
Age (months) Water (gal)
1 1.3‐2
2 1.5‐2.0
3 2.1‐2.6
4 3.0‐3.6
Calf Rearing Guide by S. J. Charlton
Bedding Management Important to Minimize Heat Losses to the Calf

12/10/2019
8
Tips for Bedding Management
1. Must keep calves clean and dry
2. ‘Kneel test’• Soiled knees= insufficient bedding, risk of bacterial challenge
• Wet knees= insufficient bedding, taking heat from calf
3. Target: minimum 3 inches clean dry bedding between calf and clean floor.
4. Type depends on availability and time of year• Wheat straw ideal for winter
5. Nesting Score
Lago et al., 2016
NS3 + solid
NS3 NS1 + solid
NS2
NS2 + solid
NS1
Influence of Nesting Score and Solid Barriers Between Pens
NS = Nesting scoreSolid = Solid panel between calves
Calf Jackets Allow Calves to Retain More Heat
Calf jacket = ~ 1 unit Nesting Score
Ken Nordlund, Dairyland Initiative
Calf Jackets Allow Calves to Retain More Heat
Influence “Microclimates” of Your Calves
• What external factors are holding the calves back from meeting your replacement animal goals?
• Time of year
• Nutrients required and how they are delivered• Management
• Think of these factors as your Insurance Policy for the investment in nutrition
12/10/2019
9
THANK YOU VERY MUCH TO THE PARTICIPATING FARMS!!!
Questions?
whminer.org

12/10/2019
1
Start the Lactation Off with a Bang
Focus on Transition Cow Management
Heather Dann, Ph.D.2019 Dairy Day
Start the Lactation with a Bang
• The cow is…
– Healthy
– Produces a large quantity of milk with good components
– Able to reproduce at the appropriate time
• The dairy is…
– Profitable and sustainable
What are the Challenges?
Energy balance & subclinical ketosis
Subacute ruminal acidosis (SARA)
Subclinical hypocalcemia (milk fever)
Lameness
Mastitis and metritis
Implementation of Practices that Focus on Prevention of Health Problems
• Clinical vs. subclinical problems
• Removal of stressors
• Optimization of nutrient intake
– Driven by DMI
Tip #1
Focus on Nutrition and Management During the Dry and Fresh Periods…
Dictates the Success or Failure of the Lactation

12/10/2019
2
The Best Formulated Diets Cannot Overcome
Suboptimal Management Practices
Implement management practices that allow access to good quality feed while minimizing social and environmental
stressors and promoting cow comfort
Tip #2
Remove or Reduce Environmental, Social, and Nutritional Stressors
Stressors Divert Nutrients Away From Productive Functions
Cow Comfort is a Function of the Cow’s Management Environment
Physical Environment
Social Environment
Resting ↔ Ruminating ↔ Feeding
Productivity, Health, & Wellbeing
Cooling Cows During the Dry Period Improves Milk Production
Providing Prepartum Evaporative Cooling Only in the Early or Late Dry Period Does NOT Rescue Milk Yield in Subsequent Lactation
110 lb
99 lb
88 lb
77 lb
66 lb
55 lb
44 lb
33 lb
Fabris et al., 2019
Cooler Entire Dry Period: Better prepartum DMI
and milk
Cooling Cows During the Dry Period
• Improves immune function (do Amaral et al., 2009)
• Increases colostrum yield and IgG content (Adin et al., 2009)
• Increases apparent efficiency of absorption of IgG (Tao et al., 2012)
• Increases birth weight and weaning weight of offspring (Tao et al., 2012)

12/10/2019
3
• Cooling dry cows is affordable– Remodeling an existing barn
– Building a new barn
• U.S. default scenario: the benefit to cost ratio and payback period was 3.2 and 0.3 years when a dry cow barn was remodeled to cool cows and 1.5 and 5.7 years if a dry cow barn needed to be built
Common Social Stressors Faced by Transition Animals
• Overstocking
• Regrouping
• Commingling heifers with mature cows
Chebel et al., 2016
Social Behavior May Play an Important Role in Disease Susceptibility
• Stress from aggression may negatively affect the immune system of a transition cow
• During the 2 wk before calving healthy cows displaced others from the feed bins on average 16.8 times/d compared with severely metritic cows who only displaced others on average 12.2 times/d (P = 0.06)
• Multiparous cows were more aggressive at the feed bunk, displacing others on average 17.9 times/d relative to primiparous cows that displaced others on average 11.5 times/d (P = 0.002)
Huzzey et al., 2007; J. Dairy Sci. 90:3220‐3233
Overcrowding During the Transition Period
• Overstocking stalls (0.5 vs 1 stall/cow) and feed bunk space (13 vs 26”/cow) increases NEFA and fecal cortisol metabolites in far‐off cows (Huzzey et al., 2011)
• Headlock stocking density >80‐90% or manger space <30”/cow in close‐up pen: – reduces feed intake– increases DA incidence– reduces milk yield in first‐calf heifers (Oetzel, 2004)
• <100 ft2/cow in close‐up pen reduces lying & rumination times, increases incidence of milk fever (Cook et al., 2004)
• >100% stocking density of bunks in fresh pen increases eating rate (Krawczel et al., 2010)
Fresh Pen
Photo By M. Carabeau
Tip #3
Purposely Manage the Maternity Pen…
A Short but Critical Time Period

12/10/2019
4
The Maternity Pen is an Important Facility Since it Affects the Well‐being of the Cow and
Newborn Calf
Individual maternity pen, bedded pack, or enhanced calving pen
Goals: 1) low stress environment, 2) low health risk for cow and calf, 3) convenience for people, & 4) opportunity for seclusion
Everyone is Watching…
Cows Seek Isolation at Calving
Proudfoot et al., 2014 JAS Cows preferred to calve in the shelter during the daytime
Cows Prefer the Corner when Provided with a Barrier
Proudfoot et al., 2014 JDS
Secluded Maternity Areas Offer Protection from Herd Members
Less interactions with herd members, less calves suckling an alien cow, and stronger acute maternal response to cow‐calf separation
Jensen et al., 2019
Use of Barrier with Low (150 ft2/cow) and High (100 ft2/cow) Stocking Density

12/10/2019
5
Creutzinger et al., 2019
Cows in barrier pens tended to have shorter labor duration
0
20
40
60
80
100
Barrier No Barrier
Duration of stage II labor
(minutes)
P = 0.08
Creutzinger et al., 2019
Stocking density did not impact labor duration
60
65
70
75
80
85
Low High
Duration of stage II labor
(minutes)
Stocking density
P = 0.93
Creutzinger et al., 2019
Time To First Meal After Calving
Does she have access to feed and water?
Tip #4
Use a Fresh Pen
Use of a Fresh Pen Continues to Grow in Popularity
• Facilitates monitoring of health problems with less “lock up time”
• Allows for increased milking frequency
• Minimizes social stresswhen stocked and managed appropriately
• Provides a diet specifically formulated for fresh cows

12/10/2019
6
Cows Benefit From a Fresh Pen
• 6 commercial dairies with freestalls– Fresh pen for 30 d after calving (space for 10% of herd)– Comingled lactating pen
• Primiparous cows housed in the fresh pen– Produced ~506 lb more ECM during 1st 305 DIM– Had less ketosis treatments (HR = 0.33)
• Multiparous cows did not benefit from separate housing
• Did not use a “fresh cow diet”…probably see more benefit of fresh pen; length of stay too long?
Østergaard et al., 2010
How Long Do or Should Cows Remain in the Fresh Pen?
• 10 to 42 DIM with 14 to 21 DIM the most common
• The optimal duration of stay in a fresh pen is unknown…it most likely varies among farms and cows
1‐28 d postpartum27% forage NDF(31% NDF, 26% starch)
29‐84 d postpartum20% forage NDF(32% NDF, 28% starch)
Data Courtesy of M. Allen
Don’t Leave Cows on the Fresh Diet for Too Long
Forage NDFlikely limiting DMI
62
57
53
48
44
40
35
Dry M
atter Intake, lb/d
Check KetonesIntake Limited by Gut Fill/Forage Digestibility Resulted in Increased BHB
Rate of increase of DMI was slow relative to
rate of increase of milk
More ketosis
Tip #5
Optimize Nutrient Intake
• Control Energy Intake in Dry Period
• Focus on Ration Fermentability in Fresh Period
• Supply Metabolizable Protein and AA
• Adjust DCAD
• Meet Mineral and Vitamin Needshttp://www.progressivedairy‐hay.com/~prodairy/digital_edition/2011/04/06PD/
Dry and Fresh Cow Nutrition Continues to Evolve
• Use integrated strategies to support…
– Energy metabolism
–Protein metabolism
–Mineral metabolism
– Immune function
–Rumen function

12/10/2019
7
• Different approaches dictated by…
– Facilities and grouping
– Management philosophy and ability
– Feed availability and quality
Far‐off Dry Close‐up Dry FreshEarly
Lactation
Far‐off Dry Close‐up Dry 1 Group or High Lactation
1 Group Dry (often shorter dry period) FreshEarly
Lactation
1 Group Dry (often shorter dry period) 1 Group or High Lactation
‐8 ‐3 0 +2???Week of Lactation
How much TMR are the cows eating?
Does the dairy know? Does the dairy measure it?
Intake is Critical for SuccessControlled by Physical and Chemostatic Mechanisms
Influenced by Feeding Management, Social Interactions, and Environment
0
10
20
30
40
50
60
70
Far‐off Close‐up Fresh High
lb/d Rapid Increase
≥30 in Bunk Space or ≥1 Headlock
Diet Formulation
Higher Forage, Lower Energy Dry DietsControlling Energy Intake while Meeting Other Nutrient Needs
• Often based on corn silage and straw (or haylage)– Feeding characteristics– 100 to 110% of ME– 10‐18% starch; >40% NDF (gut
fill); 0.7‐0.8% of BW as forage NDF
– 1,000 to 1,300 g MP (85‐100 g MP/kg DM)
– DCAD
• Fine tune based on…– Fermentable carbohydrates– Cow response (intake, health,
performance) Drackley, 2006; Drackley et al., 2007; Dann, 2016
Overfed Dry Cows Cause Headaches
• Abdominal fat deposition• Insulin resistance• Blood NEFA and BHBA• Liver triglyceride• Body weight/condition loss after calving
• Chronic inflammation• Health problems
• DM intake• Energy intake• Milk• Reproductive performance
• Profitability

12/10/2019
8
Fresh Cow Diet Frequently Based on the High Cow Diet
• Less starch & more fiber
• More physically effective fiber (peNDF)
– Usually < 1‐2 kg of chopped straw/hay
• Additional rumen undegradableprotein/amino acids
• Additional rumen inert fat
• Strategic addition of other nutrients and additives
– Monensin, yeast products, & RP‐choline
Fresh Cows ‐ Use a Mix of Carbohydrates
Have a mix of carbohydrates– 18 to 26% starch (16 to 22% fermentable starch)– 4 to 8% sugar– 28 to 36% NDF– ≥ 21% peNDF
• Consider total fermentable carbohydrate; measure digestibility of starch & NDF
• Need to adjust mix of carbohydrates for each herd’s situation
Key Things to Remember to Improve Feeding Behavior in Fresh Cows
• Fresh cow diets should be formulated to maximize eating time and DMI
• Maximize the opportunities for cows to go to the bunk across the day
• Controlling feed sorting, meal size, and meal frequency– Overcrowding must avoided for fresh cow pens
• Minimize group changes & keep 1st lactation separate to decrease social stress
DeVries, 2017 CNC/WDMC
Increased Risk of Ruminal Acidosis (SARA) in Fresh Cow
• Large changes in dietary composition and intake during the transition period – Fermentable carbohydrate
• Feeding behavior changes associated with calving, stocking density, grouping, and pen movement strategies– Heifers may be more susceptible
• SARA– Negatively affects ability of rumen epithelium to absorb
volatile fatty acids (VFA)– Decreases fiber digestion through changes in the microbial
population– Causes inflammation
Fairfield et al., 2007; Penner et al., 2007; Aschenbach et al., 2011; Williams et al., 2015
Potential Responses to Inflammation
Bradford et al., 2015
Increased Feeding Frequency May Reduce Severity of SARA in Higher‐Risk Cows
• Cows at higher risk of SARA ate longer after feeding compared with those at lower risk
• Feeding 3x/d decreased the time spent eating after the first feeding and increased time spent eating later in the day– Reduced severity of SARA by higher risk cows with no negative impact on performance of lower risk cows
• Increased feeding frequency…increased milk fat yield
Macmillan et al., 2017

12/10/2019
9
Metabolizable Protein and Amino Acids are an Opportunity
• CP vs MP for dry cows– Quality of CP and AA, availability of fermentable carbohydrates for microbial growth
• Dry cows: 12 to 15% CP… 1,000 to 1,300 g/d… 85 to 100 g MP/kg DM; Met and Lys
• Fresh cows: prevent protein mobilization before calving, promote DMI, provide sufficient fermentable carbohydrates and RDP for microbial growth, supplement RUP and RPAA
Amino Acid Balancing is Beneficial for Transition Cows
• Lys and Met are assumed to be first limiting; glutamine may be a conditionally essential AA during fresh period
• Supplementing Lys, Met, or both starting before calving and continuing into lactation can increase milk yield, milk components, or both and improve immune function (Wu et al., 1997; Socha et al., 2005; Ordway et al., 2009; Osorio et al., 2013)
• Responses are dependent on CP, MP supply, and intestinal digestibility of RUP supplements
• ~75 g Lys/d and ~25 g Met/d for milk protein response
• Need for BCAA: Leu, Ile, Val
Strategies to Minimize Risk of Hypocalcemia
• Maintain intake before calving and encourage intake after calving (#1)
• Prophylactic treatment with oral or SQ calcium following calving
• Feeding strategies for close‐up or 1 group dry diets– Feed low calcium or a calcium binder– Feed low potassium– Adjust dietary cation anion difference (DCAD)
Evaluate and Adjust Dietary Cation‐Anion Difference (DCAD) for Close‐Up Cows
• DCAD = (mEq Na+ + mEq K+) − (mEq Cl− + mEq S2−)
• ‐10 to ‐15 mEq/100 g to help accommodate biological variation among animals
Goff, 2006; Shire and Beede, 2013
Mineral Recommendation, %DM
Ca Variable approach
Mg 0.35 to 0.40
K < 1.3
P 0.3 to 0.4
S 0.2 to 0.4
Cl ~0.5 % less than K
Fats are More than Just Energy
• Dietary fat is typically 2‐3% in dry diet and 4‐6% in fresh diet
• Supplementing fat and changing fatty acid content (PUFA; CLA) of fat source positively affects reproductive performance (de Veth et al., 2009; Rodney et al., 2015)
• Fatty acids can modify immune function (Bradford et al., 2015; Sordillo, 2016)
• Fatty acids can affect milk composition and body weight (Lock 2017)
Tip #6
Use Cow‐ and Herd‐Level Monitoring Systems to Identify Challenges/Opportunities

12/10/2019
10
Health Related Technologies:Allows Us to Spend More Time with Sick Cows
• Milk weight deviations
• Milk composition changes
• Cow‐side tests
• Video surveillance
• Rumination and activity monitors
We are More Likely to Start the Lactation Off with a Bang If…
• Focus on Nutrition and Management During the Dry and Fresh Periods – Formulate diets in the context of one another to provide a smooth transition
– Prepare cow for next lactation before lactation ends
• Remove or Reduce Environmental, Social, and Nutritional Stressors– Avoid potential impact on physiology and intake
We are More Likely to Start the Lactation Off with a Bang If…
• Purposely Manage the Maternity Pen
– Support behavior that promotes intake
• Use a Fresh Pen
– Reduce stressors and targeted diet
• Optimize Nutrient Intake
– Different goals during dry and fresh periods
• Use Cow‐ and Herd‐Level Monitoring Systems to Identify Challenges/Opportunities

12/11/2019
1
Beat the Heat Are North Country cows susceptible to heat stress?
Effect of Heat Stress on the Dairy Industry in New York State
• Cows in New York spend 8.2% of their hours during the year heat stressed
• Less than the national average of 14.1%
• Equal to $23 million per year in losses for New York alone
• Due to loss in dry matter intake, milk production, fertility, increased cull rate and death rate
(St-Pierre et al., 2003)
How do we evaluate/define an environment that causes heat stress?
• Temperature humidity index (THI) calculated based on relative humidity and dry bulb temperature
• THI of 72 - previously used threshold for heat stress
• Low producing cows < 70 lbs (32 kg), Ravagnolo et al., 2000)
• Cows producing at least 77 lbs (35 kg) per day drop in production by 6.3% when THI is over 68 (Collier et al., 2012)
• Greater metabolic heat generated the higher the production level
Heat Stress Levels – Lactating Dairy Cows • Heat Stress Threshold – THI 68-71 milk
losses begin, repro losses detectable, Body temp exceeds 101.3°F (38.5°C).
• Mild/Mod Heat Stress – THI 72-79 Body temp exceeds 102.2°F (39°C).
• Mod/Severe Heat Stress – THI 80-89 Body temp exceeds 104°F (40°C).
• Severe Heat Stress – THI >90 Body temp exceeds 106°F (41°C).
Collier et al., 2012
But what makes our cows different in the North Country?
Heat Acclimation
• According to Collier et al. (2006), heat acclimation is a biphasic pattern that can be divided into two periods:
1. Acute or short-term heat acclimation (STHA)
2. Chronic or long-term heat acclimation (LTHA)

12/11/2019
2
Acute/STHA
• Heat stress causes changes in cellular signaling pathways which disrupts cellular homeostasis
• In effect, cells "reprogram" to become adapted to the effects of heat stress
Chronic/LTHA
• The heat-acclimated phenotype of the cellular changes is now expressed after chronic exposure to heat stress
• Alterations in various hormonal secretions and signals must take place in addition to changes in the response of target tissues to specific hormones
• Increase in receptor populations
• Examples of hormones involved: thyroid hormones, prolactin (PRL), somatotropin (ST), glucocorticoids, and mineralocorticoids
Heat Acclimation
• It takes weeks, as opposed to days, to complete both acclimation phases
• The North Country does not typically have heat events lasting weeks
• Animals' bodies may not become acclimated to the heat without day after day exposure
• Result: deleterious effects on animal well-being
How do cows regulate body temperature?
From: http://coolcows.dairyaustralia.com.au/heat-stress-in-cows
Body Temperature – Lying vs Standing
Body temperature increases 2x rate while
lying down
Cows must stand longer to control body temperature
homeostasis
Air • Ventilation
• Airflow
Water
• Misters
• Soakers
• Drinking water availability
Shade • Protect from solar radiation

12/11/2019
3
Heat Stress Research at Miner Institute Objective
Assess the impact of episodic heat stress on farms with different degrees of heat abatement on behavioral, lameness, and productive responses of dairy cattle from July through September in Northern New York State.
Year 1 • Four farms selected with varying degrees of heat abatement/management
• All freestall farms used water/fans in holding areas
• Measurements taken between July 1st and September 30th, 2017
• Bulk tank yield and milk composition evaluated
• Cow comfort assessed two hours before and after milking and averaged daily – Stall Standing Index
Herd Size Breed Barn Bed Stocking Density
Heat Abatement
Farm A 287 Holstein Freestall Sand 104 % None
Farm B 650 Holstein Freestall Sand 139-142 % Fans – Stalls
Farm C 57 Jersey Tiestall Stall mats/sawdust Fans
Farm D 465 Holstein Freestall Mattresses/sawdust 126 % Fans – Stalls
Year 1
• Thirty focal cows selected
• Lameness scored at beginning and end of study
• Lying time/bouts – Leg-mounted data loggers attached weekly
Days In Milk
Milk Yield (lbs/d)
Farm A 112 ± 28 112 ± 20
Farm B 87 ± 18 130 ± 20
Farm C 161 ± 138 66 ± 11
Farm D 76 ± 28 108 ± 11
Year 1 – Results – Average THI by Farm Year 1 – Results – Farm A Lying time relative to minutes THI > 68
0
200
400
600
800
1000
1200
1400
400
500
600
700
800
900
Min
ute
s T
HI ≥
68
Ly
ing
Min
ute
s
Minutes THI ≥ 68
Lying Minutes
12 hr Threshold

12/11/2019
4
Year 1 – Results – Farm B Lying time relative to minutes THI > 68
0
200
400
600
800
1000
1200
1400
400
500
600
700
800
900
Min
ute
s T
HI ≥
68
Ly
ing
Min
ute
s
Minutes THI ≥ 68
Lying Minutes
12 hr Threshold
Year 1 – Results – Farm C Lying time relative to minutes THI > 68
0
200
400
600
800
1000
1200
1400
400
500
600
700
800
900
Min
ute
s T
HI ≥
68
Ly
ing
Min
ute
s
Minutes THI ≥ 68
Lying Minutes
12 hr Threshold
Year 1 – Results – Farm D Lying time relative to minutes THI > 68
0
200
400
600
800
1000
1200
1400
400
500
600
700
800
900
Min
ute
s T
HI ≥
68
Ly
ing
Min
ute
s
Minutes THI ≥ 68
Lying Minutes
12 hr Threshold
Year 1 – Results Comparison between lying time on Cool vs Hot days
COOL HOT SE P-value
THI (mean ± sd) 60.9 ± 3.7 72.3 ± 1.1 - -
Minutes THI ≥ 68 (mean ± sd) 74 ± 127 1279 ± 155 - -
Lying Time (h/d)
Farm A 12.8 10.3 0.34 <0.01
Farm B 11.5 10.3 0.31 <0.01
Farm C 12.8 11.1 0.34 <0.01
Farm D 10.3 8.6 0.30 <0.01
~ 3 lbs milk loss/hr reduced lying time
Year 1 – Results Lameness Score Change
0 20 40 60 80 100
Farm A
Farm B
Farm C
Farm D
% Cows NOT Lame
Start
End
*
*
*
Year 1 – Results – Stall Standing Index
b b a
a b ab

12/11/2019
5
Year 1 – Results Relationship between THI and milk true protein (%)
Farm A Farm B
Farm D Farm C
Year 1 - Summary
• Dairy cows in Northern NY are adversely impacted by episodic bouts of heat stress.
• All farms were impacted by heat stress to varying degrees, regardless of heat abatement system.
• Cows with minimal heat abatement were particularly susceptible during heat events.
• Decreased lying time
• Increased lameness
• Decreased milk protein content
Farm Profits
Year 2 • Farm A, B and D same as Year 1, Farm C added because of
additional heat abatement used
• Measurements taken between July 1st and Sept. 30th, 2018
• Bulk tank yield and milk composition evaluated
Herd Size Breed Barn Bed Heat Abatement
Farm A 300 Holstein Freestall Sand None
Farm B 700 Holstein Freestall Sand Fans – Stalls
Farm C 410 Holstein Freestall Mattresses/sawdust Fans – Stalls, Feedbunk Water - Feedbunk
Farm D 475 Holstein Freestall Mattresses/sawdust
Fans – Stalls
Year 2
• Thirty focal cows selected
• Lameness scored at beginning and end of study
• Lying time/bouts – Leg-mounted data loggers attached weekly
Days In Milk
Milk Yield (lbs/d)
Farm A 69 ± 29 112 ± 15
Farm B 87 ± 18 123 ± 24
Farm C 64 ± 20 130 ± 19
Farm D 53 ± 24 111 ± 11
Year 2 – Results – Average THI by Farm Year 2 – Results Comparison between lying time on Cool vs Hot days
COOL HOT SE P-value
THI (mean ± sd) 64.5 ± 2.8 76.0 ± 2.0 - -
Minutes THI ≥ 68 (mean ± sd) 450 ± 290 1430 ± 30 - -
Minutes THI ≥ 72 (mean ± sd) 50 ± 110 1310 ± 180
Minutes THI ≥ 75 (mean ± sd) 0 ± 10 790 ± 290
Lying Time (h/d)
Farm A 12.0 9.3 0.31 <0.01
Farm B 11.7 9.4 0.38 <0.01
Farm C 10.6 8.6 0.62 <0.01
Farm D 10.4 7.9 0.38 <0.01

12/11/2019
6
Year 2 – Results Lameness Score Change
Year 2 – Results – Milk fat (%)
Year 2 – Results – Milk protein (%) Year 2 - Summary
• Confirmed Year 1 results - dairy cows in Northern NY are adversely impacted by episodic bouts of heat stress.
• All farms were impacted by heat stress to varying degrees, regardless of heat abatement system.
• Decreased lying time
• Increased lameness
• Decreased milk protein content
Farm Profits
What additional information is needed to better understand heat stress and its impact
on dairy cows in the North Country?
Year 3 – 2019 – Same Farms
• Farm A – No changes in heat abatement.
• Farm B – Changed angle of fans, and closed doors at north-end of pen to create more air movement within pens. Reduced over crowding.
• Farm C – Used mist-system attached to fans in feed alley and stall beds.
• Farm D – No changes in heat abatement

12/11/2019
7
Year 3 – 2019 – Measures
• Leg loggers for lying time • Lameness scoring • Bulk tank milk sample analyses NEW MEASURES • Wind speed throughout pen – Feed alley, Stalls-standing and lying • Body temperature • Rumen pH • Drinking behavior • Activity
SmaXtec
• Classic bolus (top) -- measures reticular temperature, drinking bouts, & activity • Given to 25 out of 30 cows
• Premium bolus (bottom) -- measures body temperature, activity, & reticular pH • Given to the 5 highest-producing, lowest DIM
cows
Reticular Temperature
Farm C: Cow #2409
*For all data analysis, median reticular temperature will be used; Ammer et al. (2006) showed the median is more highly correlated with vaginal & rectal temperature than arithmetic means
Reticular pH
Farm B: Cow 3988
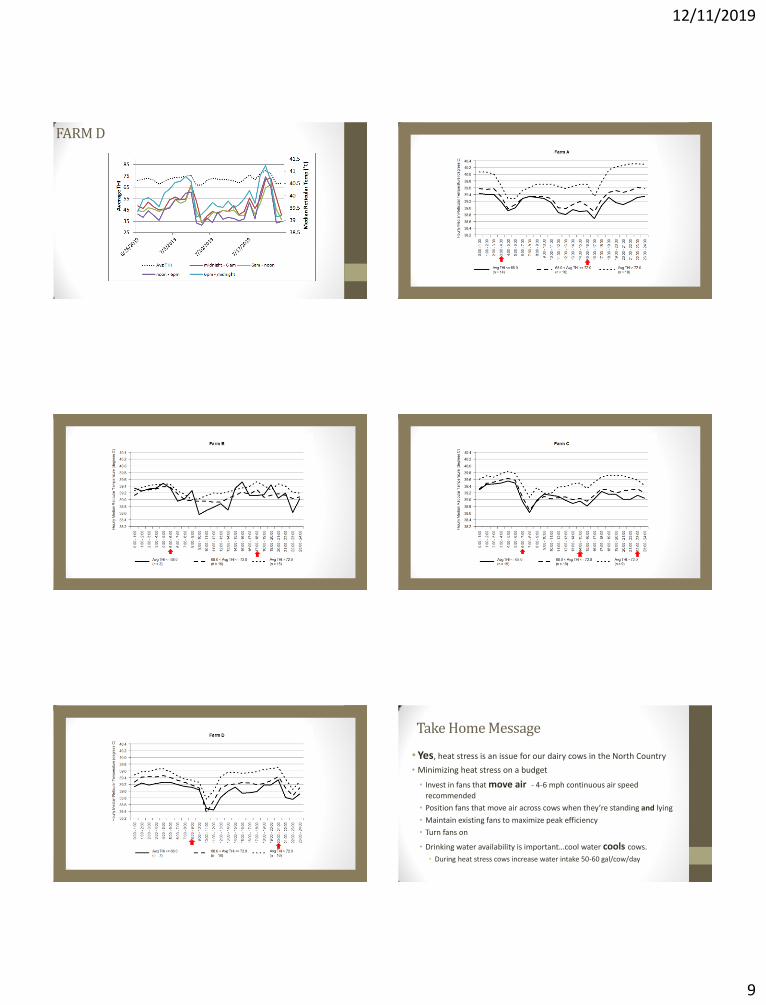
Year 3 - Preliminary Results Average THI by Farm
Year 3 - Preliminary Results MR Temperature relative to minutes THI ≥ 72
Farm B

12/11/2019
8
Year 3 - Preliminary Results MR Temperature relative to minutes THI ≥ 72
Farm C
Year 3 - Preliminary Results MR Temperature relative to minutes THI ≥ 72
Farm D
Air Movement Average windspeed (mph) by farm
Farm Stall (Standing) Stall (Lying) Feed Alley
A 0.5 0.6 0.8
B 2.5 3.1 2.1
C 2.3 2.3 3.2
D 1.8 1.8 1.5
FARM A
FARM B FARM C
12/11/2019
9
FARM D
Take Home Message
• Yes, heat stress is an issue for our dairy cows in the North Country
• Minimizing heat stress on a budget
• Invest in fans that move air - 4-6 mph continuous air speed
recommended
• Position fans that move air across cows when they’re standing and lying
• Maintain existing fans to maximize peak efficiency
• Turn fans on
• Drinking water availability is important…cool water cools cows.
• During heat stress cows increase water intake 50-60 gal/cow/day

12/11/2019
10
Next Steps
• Summarize data from all three years to provide producers with the economic impact of heat stress
• Which heat abatement system is most effective?
• What about the dry cows?

12/10/2019
1
Miner InstituteEdge-of-Field Water Quality
Research Update Laura Klaiber
Miner Institute Dairy DayDecember 11, 2019
Water Quality 101• Phosphorus (P) is limiting nutrient in freshwater systems
Soil solution P necessary for plant growth is 0.2 ‐ 0.3 mg/L
P concentration in lakes > 0.02 ‐ 0.03 mg/L – accelerated eutrophication, harmful/nuisance algae blooms (HABs, HNABs)
P is relatively immobile when given time to interact with soil
P fractions: SRP (bioavailable, manure/commercial fertilizers), organic P (manure)
particulate P (erosion)
• Nitrogen (N) is highly mobile, easily lost (leaching, atmosphere)Nitrate‐N (bioavailable, soluble, easily lost in leachate)
Organic N and ammonium‐N: primary N forms in manure, higher levels in surface runoff
Denitrification (gaseous loss from saturated soils), volatilization (organic N ‐> ammonia)
N levels may contribute to toxicity of HABs
2
Nutrient Loss PathwaysAbbreviations:SRP = soluble reactive PDP = dissolved P (organic)PP = particulate PTP = total P
Nitrate‐N
N gases
Figure adapted from Radcliffe et al., 2014) 3
Macropores develop from: • Shrink/swell clays• Earthworm burrows• Root channels
Preferential flow pathwaysaka Macropores
4
Figure: National Climate Assessment (GlobalChange.gov)
Extreme Events
5 6
More soil P = More risk

12/10/2019
2
Annual Phosphorus Loads2014-2019 (n = 16)
Max: 0.92Mean: 0.20
Max: 1.06Mean: 0.09
Max: 1.07Mean: 0.35
Max: 1.32Mean: 0.16
7
SRP
0
10
20
30
40
50
60
70
80
90
100
Percent of Annual P Loss
SRP TP
Nongrowing SeasonTile Drainage P Transport
TP mean = 89.6%
SRP mean = 88.7%
8
Untiled FieldTiled Field
Tile and Surface runoff monitoring
Surface runoff monitoring
5.8 ac fields, silt loam, somewhat poorly drained, Tonawanda seriesCorn silageSoil test P = 5 lb/ac (Medium)
Tiled vs Untiled (Essex County, NY)
9
Surface
96% from surface
Tiled vs Untiled Fields 3/28/18-10/1/19
10% from tile flow
4% fromtile flow
Field Runoff DRP Total P Nitrate‐N Amm‐N Total‐N TSS
in ‐‐‐‐‐‐‐‐‐‐‐‐‐‐‐‐‐‐‐‐‐‐‐‐‐‐‐‐‐‐‐lb/ac‐‐‐‐‐‐‐‐‐‐‐‐‐‐‐‐‐‐‐‐‐‐‐‐‐‐‐‐‐‐‐‐‐
Tiled 13.3 0.024 0.312 13.44 0.62 15.30 260.5
Untiled 12.2 0.014 0.443 3.41 0.54 6.09 589.7
TD‐surface 7.1 0.022 0.296 0.66 0.50 1.84 247.1
TD‐tile 6.2 0.002 0.015 12.78 0.12 13.46 13.4
10
Lake Alice Runoff Plots
Site Characteristics/Management• Data from 2018, continuing this
year (data not included)• Combination of excessively well‐
drained, poorly‐drained soils• 8,000 gal/ac manure application
in fall 2017 (disk harrow incorp.)• 1st year alfalfa (60/40 alfalfa‐grass
mix) planted 5/10/18• Soil test P = 4.5 lb/ac (Medium)• No nutrient applications in 2018• Only 1st and 2nd cut taken
11
Lake Alice Runoff Plots
12
12/10/2019
3
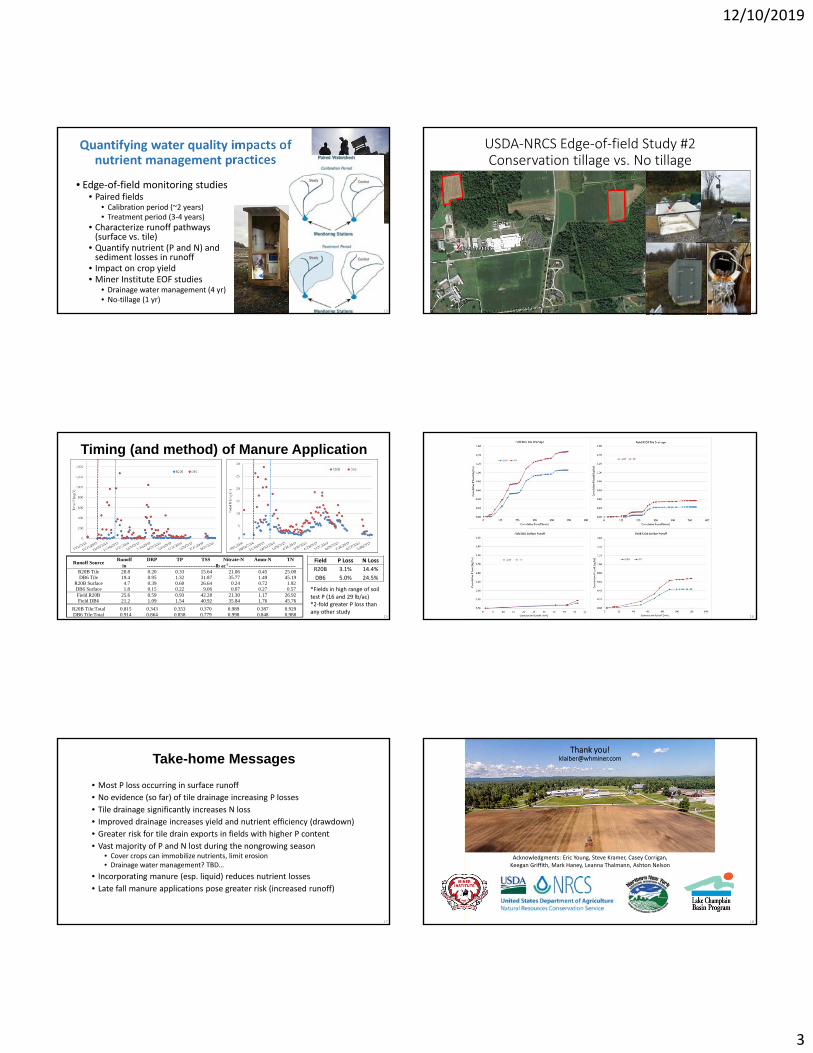
Quantifying water quality impacts of nutrient management practices
• Edge‐of‐field monitoring studies• Paired fields
• Calibration period (~2 years)• Treatment period (3‐4 years)
• Characterize runoff pathways (surface vs. tile)
• Quantify nutrient (P and N) and sediment losses in runoff
• Impact on crop yield• Miner Institute EOF studies
• Drainage water management (4 yr)• No‐tillage (1 yr)
13
USDA‐NRCS Edge‐of‐field Study #2Conservation tillage vs. No tillage
14
Timing (and method) of Manure Application
Runoff Source Runoff DRP TP TSS Nitrate-N Amm-N TN
in -----------------------------------------lb ac-1---------------------------------------- R20B Tile 20.8 0.20 0.33 15.64 21.06 0.45 25.00 DB6 Tile 19.4 0.95 1.32 31.87 35.77 1.49 45.19
R20B Surface 4.7 0.39 0.60 26.64 0.24 0.72 1.92 DB6 Surface 1.8 0.15 0.22 9.06 0.07 0.27 0.57 Field R20B 25.6 0.59 0.93 42.28 21.30 1.17 26.92 Field DB6 21.2 1.09 1.54 40.92 35.84 1.76 45.76
R20B Tile:Total 0.815 0.343 0.353 0.370 0.989 0.387 0.929 DB6 Tile:Total 0.914 0.864 0.858 0.779 0.998 0.848 0.988
Field P Loss N Loss
R20B 3.1% 14.4%
DB6 5.0% 24.5%
15
*Fields in high range of soil test P (16 and 29 lb/ac)*2‐fold greater P loss than any other study
16
• Most P loss occurring in surface runoff
• No evidence (so far) of tile drainage increasing P losses• Tile drainage significantly increases N loss• Improved drainage increases yield and nutrient efficiency (drawdown)
• Greater risk for tile drain exports in fields with higher P content• Vast majority of P and N lost during the nongrowing season
• Cover crops can immobilize nutrients, limit erosion• Drainage water management? TBD…
• Incorporating manure (esp. liquid) reduces nutrient losses
• Late fall manure applications pose greater risk (increased runoff)
17
Take-home Messages
Acknowledgments: Eric Young, Steve Kramer, Casey Corrigan, Keegan Griffith, Mark Haney, Leanna Thalmann, Ashton Nelson
Thank [email protected]
18