Embed Size (px)
Citation preview

Paper No. 1.57a 1
PROCEDURE TO EVALUATE LIQUEFACTION-INDUCED LATERAL
SPREADING BASED ON SHEAR WAVE VELOCITY
Fred (Feng) Yi
Senior Geotechnical Engineer, C.H.J. Incorporated, Colton, CA-USA 92324
ABSTRACT
Evaluation of liquefaction-induced lateral spreading is very important for the design of structures located on gently sloping ground and
with relatively shallow groundwater. Extensive research has been performed on the calculation of liquefaction-induced lateral
spreading based on the standard penetration test (SPT) and cone penetration test (CPT) data by various researchers (Bartlett and Youd
1992, 1995, Rauch, 1997; Zhang et al., 2004; Idriss and Boulanger, 2008). However, few published papers can be found that address
the calculation of liquefaction-induced lateral spreading based on shear wave velocity. This paper presents a procedure to evaluate
liquefaction-induced lateral spreading directly based on shear wave velocity. New empirical relationships for factor of safety against
liquefaction, maximum shear strain, and shear wave velocity are developed based on the laboratory tests performed at the University
of Tokyo (Ishihara and Yoshimine 1992, Yoshimine et al. 2006). The results calculated utilizing this new procedure are compared
with those based on SPT and CPT data using existing methods. The results indicate good agreement. This approach not only provides
a new method for estimating the liquefaction-induced lateral spreading directly from shear wave velocity data but also provides a cost
effective tool for verification of CPT results because of the small cost increase in measuring shear wave velocity during the standard
CPT testing.
INTRODUCTION
As one of the major surficial manifestations of liquefaction,
lateral spreading has been observed in nearly all major
earthquakes from the 1923 Kanto earthquake in Japan
(Hamada et al. 1992) to the recent Sichuan earthquake in
China (Wang 2008). “Damage caused by lateral spreads,
though seldom catastrophic, is severely disruptive and often
pervasive. … Cumulatively, more damage has been caused by
lateral spreads than by any other form of liquefaction-induced
ground failure.” (NRC, 1985). Due to the enormous damage to
engineered structures and lifelines caused by liquefaction-
induced lateral spreading, its evaluation and prediction
becomes very important for the design and construction of
structures located on areas susceptible to lateral spreading.
These areas are usually relatively flat, along waterfronts, and
attractive for urban development (Rauch, 1997). Since the late
1980’s, extensive research has been performed on the
calculation of liquefaction-induced lateral spreading (NRC,
1985, Hamada et al. 1986, Bartlett and Youd 1992, 1995,
Rauch, 1997, Zhang et al., 2004; Idriss and Boulanger, 2008).
Several methods have been proposed by individuals to predict
the liquefaction-induced lateral spreading. These methods
include empirical methods based on a database from observed
case histories (Bartlett and Youd 1995, Rauch, 1997), semi-
empirical methods based on laboratory test results, field
exploratory data and anticipated earthquake magnitude (Zhang
et al., 2004; Idriss and Boulanger, 2008), and numerical
simulation using the finite element method (FEM) and finite-
difference method (FDM) (Valsamis et al. 2007).
Several in-situ testing methods are in common usage for
exploration of subsurface soils, including the standard
penetration test (SPT), the cone penetration test (CPT), shear-
wave velocity measurements (Vs), and the Becker penetration
test (BPT). All of these methods have been utilized in the
evaluation of liquefaction potential. Most of the currently
published methods for evaluating liquefaction-induced lateral
spreading are based on either SPT or CPT data. Few published
papers can be found that address the calculation of
liquefaction-induced lateral spreading based on shear wave
velocity. This paper presents an approach for estimating
liquefaction-induced lateral spreading based on shear wave
velocity. This approach includes a detailed procedure for
calculating the factor of safety against liquefaction and the
maximum cyclic shear strain. The proposed method was

Paper No. 1.57a 2
evaluated by comparing the results calculated based on SPT
and CPT data utilizing currently widely accepted methods.
GEOLOGIC CONDITIONS FOR LATERAL SPREADING
Liquefaction-induced lateral spreading is defined as the finite,
lateral displacement of gently sloping ground as a result of
pore pressure build-up or liquefaction in a shallow underlying
deposit during an earthquake (Rauch, 1997). A three
dimensional description of the lateral spreading is illustrated
in Fig. 1 (Varnes 1978, Rauch 1997). Fig. 2 shows two typical
patterns of soil liquefaction and the induced lateral spreading.
The geologic conditions for increased susceptibility to
liquefaction-induced lateral spreading are: 1) shallow water
table, 2) presence of unconsolidated loose sandy alluvium,
typically Holocene in age; 3) strong ground shaking, and 4)
constant initial shear stress resulting from a gently sloping
ground. The first three conditions are the conditions required
for liquefaction to occur. The last is the additional condition
for liquefaction-induced lateral spreading to occur. Although
not clearly stated in most publications, the estimation of
liquefaction-induced lateral spreading is also generally based
on these four conditions.
Fig. 1 Schematic depiction of a lateral spreading resulting
from liquefaction in an earthquake (after Rauch 1997,
originally from Varnes 1978)
PROCEDURES TO EVALUATE LIQUEFACTION-
INDUCED LATERAL SPREADING
The procedure presented hereafter is similar to that adopted by
Zhang et al. (2004) and includes the following steps:
Step 1. Assess the liquefaction potential based on Andrus and
Stokoe's method (Andrus and Stokoe 2000, Andrus et
al. 2004).
Step 2. Calculate the maximum shear strain based on results
of simple shear tests performed at the University of
Tokyo (Ishihara and Yoshimine 1992, Yoshimine et
al. 2006) extended for the application to Vs data.
Step 3. Calculate the lateral spreading
The related previous work will be reviewed in the following
sections.
Fig. 2 Soil liquefaction and lateral spreading of (a) gently
sloping ground and (b) toward a free face (after Rauch 1997)
Evaluation of factor of safety against liquefaction
The factor of safety against liquefaction is defined as the ratio
of the cyclic resistance ratio, CRRM, that will cause
liquefaction of the soil for a given number of cycles, to the
cyclic stress ratio, CSR, developed in the soil by the
earthquake motion.
CSR
CRRFS M
liq= (1)
Cyclic stress ratio (CSR). In the simplified procedure (Seed
and Idriss 1971), the CSR developed in the soil is calculated
by a formula that incorporates ground surface acceleration,
total and effective stresses in the soil at different depths
(which in turn are related to the location of the ground water
table), non rigidity of the soil column, and a number of
simplifying assumptions. Seed and Idriss (1971) formulated
the following equation for calculation of CSR.
dvvvavrgaCSR )'/)(/(65.0'/
00max0σσστ == (2)
where avτ is the average equivalent uniform cyclic shear stress
caused by the earthquake and is assumed to be 0.65 of the
maximum induced stress, max
a is the peak horizontal
acceleration at ground surface generated by the earthquake, g
is the acceleration of gravity, 0v
σ and '0v
σ are total and
effective overburden stresses, respectively, and d
r is a stress
reduction coefficient.
Several methods have been published by individuals for the
calculation of d
r (Seed and Idriss 1971, Lao and Whitman
1986, Seed et al 2003, Idriss 1999). The expression (Eq. 3)
Paper No. 1.57a 3
proposed by Idriss (1999) may be used to estimate the average
value of d
r .
])()(exp[ Mzzrd
⋅+= βα (3a)
( )133.573.11/sin126.1012.1)( +−−= zzα (3b)
( )142.528.11/sin118.0106.0)( ++= zzβ (3c)
in which z is the depth below ground surface in meters, M is
the earthquake moment magnitude, and the arguments inside
the sine terms are in radians.
Cyclic resistance ratio (CRR). Andrus and Stokoe (2000)
developed a Vs-based CRR curve for uncemented, Holocene-
age soils with 5% or less fines at an earthquake magnitude 7.5
as shown in Eq. 4.
−
−+
=
215
1
)(215
18.2
100
)(022.0
1
2
1
5.7
css
css
csV
VCRR (4)
where subscript cs is the abbreviation for clean sand (soils
with 5% or less fines), and (Vs1)cs is the overburden stress-
corrected shear wave velocity as defined in Eq. 5 to account
for the influences of the state of stress in soil.
25.0
011)'/()(
vascsscscsspVKVKV σ== (5)
where Vs1 is the overburden stress-corrected shear wave
velocity of sandy soils, pa is the reference stress of 100 kPa or
about atmospheric pressure, and Kcs is a fines content (FC)
correction factor. Juang et al (2002) suggested the following
relationships for estimating Kcs:
0.1=csK , for %5≤FC (6a)
TFCKcs )5(1 −+= , for %35%5 << FC (6b)
TKcs 301+= , for %35≥FC (6c)
where
( ) ( )211
100/0038.0100/0109.0009.0ss
VVT +−= (6d)
It is preferred that the FC measured from SPT samples be used
for above corrections. If measured data is not available, FC
estimated from CPT data could also be used (Yi, 2009).
Research indicates that other corrections, such as earthquake
magnitude, overburden pressure, and static shear stress, should
also be made to the CRR (Seed and Idriss 1982, Seed 1983,
Idriss and Boulanger, 2008). For any earthquake moment
magnitude M,
ασKKMSFCRRCRR csM )(5.7= (7)
where MSF is the magnitude scaling factor, and σK and αK
are factors for overburden and initial static stress ratio
corrections, respectively. Several expressions have been
proposed by individuals for these corrections. The most
recently published work by Idriss and Boulanger (2008) can
be utilized.
Magnitude scaling factor (MSF). Various relationships
between magnitude scaling factor and earthquake moment
magnitude have been proposed (Seed and Idriss 1982,
Tokimatsu and Yoshimi, 1983, Arabgo 1996, Idriss 1999). By
studying the relations between the number of equivalent
uniform stress cycles and earthquake magnitude, Idriss (1999)
suggested the magnitude scaling factor as:
( ) 8.1058.04/6.9exp ≤−−= MMSF (8)
Overburden correction factor σK . Laboratory cyclic triaxial
compression tests show that while liquefaction resistance of a
soil increases with increasing confining pressure, the
resistance, as measured by the stress ratio, is a nonlinear
function that decreases with increased normal stress. Seed
(1983) suggested a correction factor, σK , to account for this
nonlinearity for overburden pressures greater than 100 kPa.
Although various expressions for an overburden correction
factor have been proposed by a number of researchers, this
author recommends the use of σK proposed by Boulanger and
Idriss (2004).
1.1'
ln10 ≤
−=
a
v
pCK
σσσ (9a)
where the coefficient σC can be expressed in terms of
corrected shear wave velocity.
[ ]3.0
100/)(1.39.18
1976.1
1
≤−
=cssV
Cσ (9b)
Static shear stress correction factor αK . This factor was
originally introduced by Seed (1983) to account for the effect
of static shear stresses on CRR. In the 1996 NCEER workshop
(Youd et al. 1997), it was concluded that the wide ranges in
potential αK values developed in past investigations indicate
a lack of consensus and a need for continued research and
field verifications, and that general recommendations for use
of αK by the engineering profession are not advisable at this
time. Since that workshop, further research has been
performed by Idriss and Boulanger (2003a, 2003b). For the
purpose of liquefaction-induced lateral spreading evaluation,
the author believes that Idriss and Boulanger’s results can be
used.

Paper No. 1.57a 4
−⋅+==
= cba
CRR
CRRK
Rξ
α
αα exp
0
(10a)
)exp(632)exp(6346361267 2 ααα −−−+=a (10b)
( ))0001.exp(31.13.1211.1exp 2 +++−= ααb (10c)
352.2126.0138.0 αα ++=c (10d)
'/0vs
στα = (10e)
( )
976.1
1
10018.0
/'100ln
1
−
−= css
a
R
V
ppQξ (10f)
')21('003
1v
Kp σ+= (10g)
where K0 is the coefficient of lateral earth pressure at rest and
Q is a grain type related empirical constant approximately
equal to 10 for quartz and feldspar, 8 for limestone, 7 for
anthracite, and 5.5 for chalk. In addition, α and Rξ should be
constrained within the following limits.
35.0≤α and 1.06.0 ≤≤− Rξ (10h)
Liquefaction-induced maximum cyclic shear strains of clean
sand
Relative density. To study the volume change characteristics
of sand after liquefaction, several series of uni- and multi-
directional cyclic simple shear tests have been performed at
the University of Tokyo (Ishihara and Yoshimine 1992,
Yoshimine et al. 2006). The results indicate that one of the
important parameters affecting the cyclic maximum shear
strain of liquefied sands is the relative density (DR) of the
sand. To utilize Vs data, a relationship between DR and Vs is
necessary. Existing relationships between DR and Vs are not
available in published research. However, this relationship can
be established by utilizing the relationships between relative
density and SPT blow counts and between shear wave velocity
and SPT blow counts.
Several relationships between relative density and SPT blow
counts have been proposed in the past (Terzaghi and Peck
1967, Tokimatsu and Seed 1987, Idriss and Boulanger 2008).
Data points collected by Mayne et al. (2002) and Tokimatsu
and Seed (1987) are re-plotted in Fig. 3 showing the
relationship between relative density and SPT blow counts
corrected to an energy ratio of 60% with an overburden stress
of 1 atm. (N1)60cs is used as the abscissa in Fig. 3 to represent
the equivalent clean sand (N1)60.
Expressions proposed by Terzaghi and Peck (1967) and Idriss
and Boulanger (2008) as well as the curve by Tokimatsu and
Seed (1987) are also plotted in Fig. 3. It can be seen that an
average relationship can be better expressed by Eq. 11.
(%)52/)(100 601 csR ND = (11)
125 150 175 200 225 250
)1(7.0'
210 +
=σ
jR
ND
60
)(100 601 cs
R
ND =
46
)(100 601 cs
R
ND =
52
)(100 601 cs
R
ND =
0
10
20
30
40
50
60
70
80
90
100
0 10 20 30 40 50 60 70 80
Rel
ati
ve d
ensi
ty,
DR
(%)
Corrected SPT Blow Count, (N1)60cs
Corrected Shear Wave Velocity, (Vs1)cs (m/s)
Tokimatsu & Seed 1987
Idriss & Boulanger 2008
Recommended
Determined from Eq. (1)
Determined by field density tests
Determined from frozen samples
Fig. 3 Relationship between relative density, corrected SPT
blow counts, and corrected shear wave velocity (data from
Mayne et al. 2002 and Tokimatsu and Seed 1987)
Andrus et al. (2004) collected (N1)60cs - (Vs1)cs data pairs from
different regions (Fig. 4). By nonlinear regression analysis,
Andrus et al. (2004) obtained a power curve as shown by Eq.
12.
253.0
6011 ])[(7.87)( CScss NV = (12)
100
150
200
250
300
0 10 20 30 40 50 60
Co
rrec
ted S
hea
r W
ave
Vel
oci
ty,
(Vs1
) cs (m
/s)
Corrected SPT Blow Count, (N1)60cs
California
Canada
Japan
So. Carolina
Location
253.0
6011 ])[(7.87)( CScss NV =
Fig. 4 Relationship between corrected shear wave velocity and
corrected SPT blow counts for uncemented, Holocene sands
(after Andrus et al. 2004)
Paper No. 1.57a 5
By combining Eq. 11 and Eq. 12, the relationship between
relative density and corrected shear velocity can be derived as
shown in Eq. 13.
(%)]100/)[(974.17 976.1
1 csSR VD = (13)
The relationship between relative density and (Vs1)cs shown in
Eq. 13 is also plotted in Fig. 3.
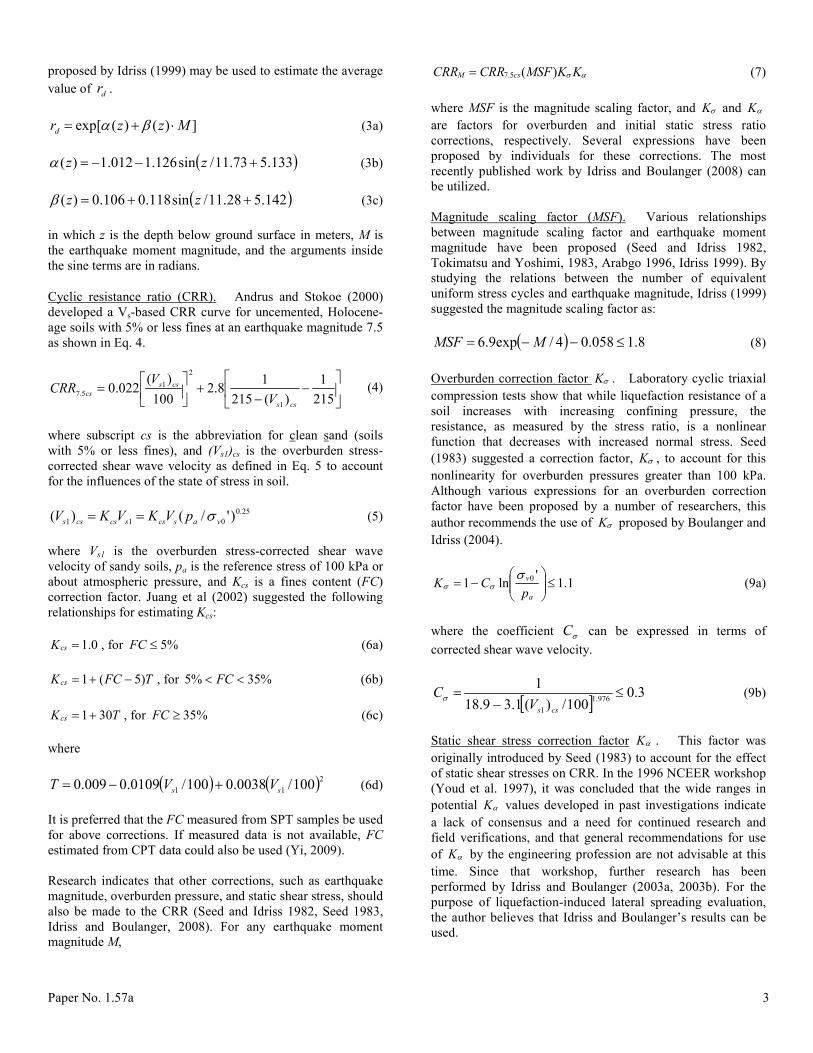
Maximum shear strain. In the process of estimating the
liquefaction-induced settlement, Ishihara and Yoshimine
(1992) discovered that for a given value of relative density, the
smaller the factor of safety, the larger the maximum shear
strain. While at a given value of factor of safety less than
unity, the larger the relative density, the smaller the maximum
shear strain. A set of relationships was established as shown in
Fig. 5.
0.0
0.2
0.4
0.6
0.8
1.0
1.2
1.4
1.6
1.8
2.0
0 2 4 6 8 10 12 14 16
Fa
cto
r o
f sa
fety
ag
ain
st liq
uefa
cti
on
, F
Sli
q
Maximum amplitude of shear strain, γmax (%)
Dr ≈ 47%
Dr ≈ 73%
Dr ≈ 93%
DR=90% DR=80%DR=70%
DR=60%
DR=50%
DR=40%
Nagase & Ishihara (1988)
Irregular, uni- and multi-
directional cyclic shear
tests on Fiji river sand.
Fig. 5. Relationship between factor of safety and maximum
amplitude of shear strain during irregular loading (after
Ishihara and Yoshimine 1992, test data from Dr. Yoshimine)
Yoshimine et al (2006) approximated the curves in Fig. 5 with
a hyperbolic function. This function was further combined
with additional constrain of a limiting shear strain (Fig. 6) by
Idriss and Boulanger (2008) to form the set of equations below
for calculating the maximum shear strain.
0max =γ , for 2≥liqFS (14a)
−
−−=
α
αγγFFS
FFS
liq
liq
1)2(035.0,min limmax
for αFFSliq ≥>2 (14b)
limmax γγ = , for αFFS liq < , (14c)
where maxγ is the maximum shear strain as a decimal,
limγ is
the limit of the maximum shear strain, and
2)100/(0.6)100/(7.4032.0 RR DDF −+=α (15a)
The DR should be limited to values ≥ 40% for use in Eq. 15a.
By introducing Eq. 13, Eq. 15a becomes
952.3
1
976.1
1
100
)(190.0
100
)(836.0032.0
−
+= csscss
VVFα (15b)
with (V1s)cs limited to values ≥ 150 (m/s).
120 140 160 180 200 220
Range estimated by Seed et al.
(1985), based on data by
Tokimatsu & Yoshimi (1984)
and recommendations of
Seed (1979)
Relations for estimating
lateral displacement
index (LDI)
0
20
40
60
80
0 10 20 30 40
Lim
itin
g s
hea
r st
rain
(%
)
Corrected SPT Blow Count, (N1)60cs
Corrected Shear Wave Velocity, (Vs1)cs (m/s)
Idriss and Boulanger (2008)
Nagase & Ishihara (1988)
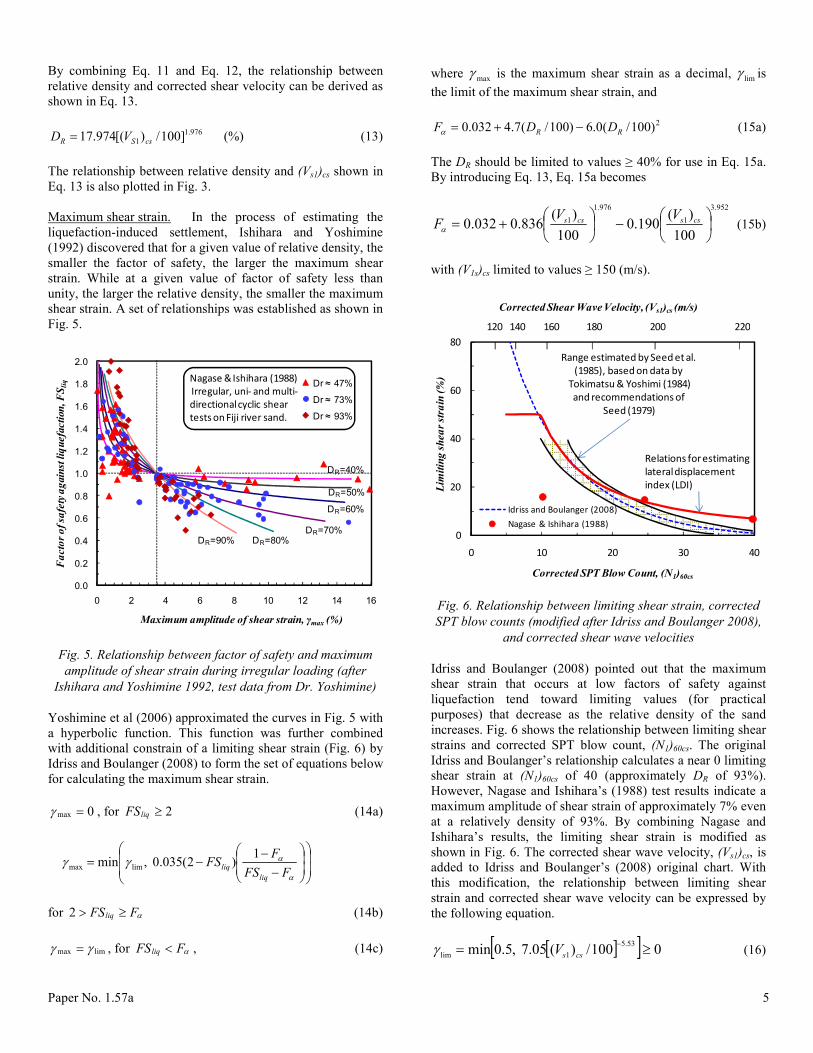
Fig. 6. Relationship between limiting shear strain, corrected
SPT blow counts (modified after Idriss and Boulanger 2008),
and corrected shear wave velocities
Idriss and Boulanger (2008) pointed out that the maximum
shear strain that occurs at low factors of safety against
liquefaction tend toward limiting values (for practical
purposes) that decrease as the relative density of the sand
increases. Fig. 6 shows the relationship between limiting shear
strains and corrected SPT blow count, (N1)60cs. The original
Idriss and Boulanger’s relationship calculates a near 0 limiting
shear strain at (N1)60cs of 40 (approximately DR of 93%).
However, Nagase and Ishihara’s (1988) test results indicate a
maximum amplitude of shear strain of approximately 7% even
at a relatively density of 93%. By combining Nagase and
Ishihara’s results, the limiting shear strain is modified as
shown in Fig. 6. The corrected shear wave velocity, (Vs1)cs, is
added to Idriss and Boulanger’s (2008) original chart. With
this modification, the relationship between limiting shear
strain and corrected shear wave velocity can be expressed by
the following equation.
[ ][ ] 0100/)(05.7,5.0min53.5
1lim≥= −
cssVγ (16)

Paper No. 1.57a 6
By combining Eqs. 14 through 16, the original relationship
between the factor of safety and maximum shear strain is
replotted in Fig. 7 as a function of the corrected shear wave
velocity. Fig. 8 shows the relationship between maximum
shear strain and corrected shear wave velocity.
Nagase & Ishihara (1988), Irregular,
uni- and multi-directional cyclic
shear tests on Fiji river sand.
(Vs1) c
s=
160, 140
(Vs
1) c
s=
180
(Vs
1) c
s=
238
(Vs
1) c
s=
220
(Vs
1) c
s=
200

Paper No. 1.57a 7
in turn were underlain by interlayered clay, sand, and gravelly
sand.
Fig. 9. Map of Moss Landing Area (after Boulanger et al.
1997)
The factor of safety against liquefaction, liquefaction-induced
maximum shear strain, and LDI were calculated based on
measured Vs data following the procedures described in the
previous sections. The results are plotted in Fig. 10. For
comparison, calculation results based on SPT and CPT data
using the equations included in the MNO-12 “Soil
Liquefaction during Earthquakes” (Idriss and Boulanger,
2008) are also illustrated in Fig. 10. The measured SPT blow
counts and CPT tip resistance were converted to shear wave
velocity for comparison. Results calculated by Idriss and
Boulanger (2008) based on the same SPT data are also plotted
in the graphs. It can be seen that the results calculated based
on Vs data generally agree well with those calculated based on
SPT and CPT data, especially with CPT data, and are
consistent with the calculation results by Idriss and Boulanger
(2008).
At the MBARI facility site, extensive ground deformations
were observed along Sandholdt Road. Three slope
inclinometers labeled SI-2, SI-4, and SI-5 were installed along
the shoreline edge of Sandholdt Road, prior to the Loma Prieta
earthquake. The readings of inclinometers before and after the
earthquake indicate that the shoreline moved about 7.5 cm (SI-
4) to 28 cm (SI-2) toward the harbor. Vs data as well as SPT
and CPT data is available near SI-2. Based on the SPT log and
laboratory test results, subsurface soils at this location
generally consist of a poorly graded fine-grained sand layer
with a fines content of between 2 and 3% to a depth of
approximately 10.5 m below existing ground surface with 2
clayey silt interlayers with thickness of approximately 0.3 and
1 m, respectively. These in turn were underlain by soft to stiff
clay with interlayered sand layers. The calculated results of
the factor of safety, maximum shear strain, and LDI based on
measured Vs data are plotted in Fig. 11. Similar to the first
sample, results calculated based on SPT and CPT data are also
illustrated in the graphs in Fig. 11. Other than the first sample,
the results based on Vs data are closer to those based on SPT
data.
To determine the coefficient Ch, calculated LDI’s were
compared with lateral deformation observed from various
locations in Moss Landing after the 1989 Loma Prieta
earthquake. Fig. 12 shows the relationship. A Ch of 0.23 is
obtained by regression analysis with an R-squared value of
0.74. With this correction, the calculated lateral spreading
deformations are plotted in the right-most graph in Figs. 10
and 11 with comparison of observed data. As can be seen
there is good agreement between observed data and calculated
values.
It should be noted that Ch is affected by several factors. One of
the factors could be the peak horizontal ground acceleration,
amax. As Idriss and Boulanger (2008) pointed out, the predicted
deformations are sensitive at a certain range of amax. Other
factors affecting Ch and, further, the extent of lateral spreading
are non-liquefied crust conditions (thickness and the cohesion)
and surficial conditions (pavement etc.). The current
methodology generally assumes a free movement of the non-
liquefied crust without any resistance. These factors should be
further evaluated in future studies.
CONCLUSIONS
A set of equations is proposed based on previous studies for
calculating liquefaction-induced lateral spreading, extending
to the application of shear wave velocity. The equations have
been presented in the order of the calculation sequence. The
proposed method was tested by utilizing data from two sites in
Moss Landing where extensive surface deformations were
observed after 1989 Loma Prieta earthquake. By using the
proposed equations, the factor of safety against liquefaction,
liquefaction-induced maximum shear strain, and LDI were
calculated directly based on measured Vs data and compared
with the results calculated based on SPT and CPT data using
existing methods. The results indicate good agreement with
the results obtained using the existing methods.
An important advantage of the proposed method is that with a
small cost increase in the field investigation, it provides a
verification of the predicted results using different field

Paper No. 1.57a 8
0
2
4
6
8
10
12
14
16
0 200 400D
ep
th (
m)
Vs (m/s)
Vs
0 1 2 3
FSliq
CPT
0 20 40 60
γmax (%)
Idriss & Boulanger
(2008) - SPT
0 200 400
LDI (cm)
SPT
Idriss &
Boulanger
(2008):
LDI=230cm
0 20 40 60 80
Dh (cm)
Observed
Fig. 10. Sample calculation of Dh at the Entrance Kiosk, Moss Landing State Beach, based on Vs data, comparing with CPT and SPT
results as well as Idriss and Boulanger’s (2008) calculation results based on SPT data (after Idriss and Boulanger 2008) and
corrected shear wave velocity (amax=0.25g)
0
2
4
6
8
10
12
0 100 200 300
Dep
th (
m)
Vs (m/s)
Vs
0 1 2 3
FSliq
CPT
0 20 40 60
γmax (%)
SPT
0 50 100 150
LDI (cm)
0 20 40
Dh (cm)
SI-2
Fig.11. Sample calculation of Dh at Sandholdt Road, MBARI, based on Vs data, comparing with CPT and SPT results (amax=0.25g)

Paper No. 1.57a 9
investigation data. For example, other than just performing
normal CPT sounding, both CPT and Vs data can be obtained
during the same operation by using seismic cone. With an
introduced coefficient Ch of 0.23, the calculated lateral
spreading deformation agrees well with the observed data.
However, it should be noted that this coefficient is affected by
various factors. The sensitivity of the predicted liquefaction-
induced spreading to various parameters should be evaluated
as part of the analysis. Conditions of the non-liquefied crust
(such as thickness, soil cohesion, and surface pavement),
should also be considered in order to provide more reliable
predicted values.
0
20
40
60
80
100
0 50 100 150 200 250 300
Obse
rved
Late
ral
Dis
pla
cem
ent,
Dh
(cm
)
Lateral Displacement Index, (LDI) (cm)
SPT
Vs
CPT
74.0
)(23.0)(
2 =
⋅=⋅=
R
LDILDICDhh
Fig. 12. Determination of coefficient Ch based on comparison
of observed lateral spreading deformation and calculated LDI
ACKNOWLEDGMENTS
The author appreciates the support and help by Mr. Robert J.
Johnson and Mr. Allen D. Evans in the preparation of this
manuscript.
REFERENCES
Andrus, D.A. and K.H. Stokoe [2000]. “Liquefaction
Resistance of Soils from Shear Wave Velocity”, Journal of
Geotechnical and Geoenvironmental Engineering, Vol. 126,
No. 11, pp. 1015-1025
Andrus, D.A., P. Piratheepan, B.S. Ellis, J. Zhang, and C.H.
Juang [2004]. “Comparing Liquefaction Evaluation Methods
Using Penetration-VS Relationships”, Soil Dynamics and
Earthquake Engineering, Volume 24, Issues 9-10, October
2004, pp. 713-721
Arango, I. (1996). "Magnitude Scaling Factors for Soil
Liquefaction Evaluation", J. Geotechnical Eng., ASCE
122(11), pp. 929-936
Bartlett, S.F. and T.L. Youd [1992]. “Empirical analysis of
horizontal ground displacement generated by liquefaction-
induced lateral spread”: National Center for Earthquake
Engineering Research Technical Report NCEER-92-0021, 114
pages.
Bartlett, S.F. and T.L. Youd [1995]. “Empirical Prediction of
Liquefaction-Induced Lateral Spread”: Journal of
Geotechnical Engineering, ASCE, v. 121, No. 4, pp. 316-329.
Boulanger, R. W. and I. M. Idriss [2004]. "State normalization
of penetration resistances and the effect of overburden stress
on liquefaction resistance." Proc., 11th Int. Conf. on Soil
Dynamics and Earthquake Engineering, and 3rd Int. Conf. on
Earthquake Geotechnical Engineering, D. Doolin et al., eds.,
Stallion Press, Vol. 2, pp. 484-491.
Boulanger, R. W., I. M. Idriss, and L. H. Mejia [1995].
"Investigation and evaluation of liquefaction related ground
displacements at Moss Landing during the 1989 Loma Prieta
earthquake." Report No. UCD/CGM-95/02, Center for
Geotechnical Modeling, Department of Civil and
Environmental Engineering, University of California, Davis
Boulanger, R. W., L. H. Mejia, and I. M. Idriss [1997].
"Liquefaction at Moss Landing during Loma Prieta
Earthquake", Journal of Geotechnical and Geoenvironmental
Engineering, ASCE, 123(5): pp. 453-467.
Hamada, M., K. Wakamatsu, and S. Yasuda [1992].
“Liquefaction-induced ground deformation during the 1923
Kanto earthquake”, Case Studies of Liquefaction and Lifeline
Performance during Past Earthquakes, Vol. 1, Technical Rep.
NCEER-92-001, National Center for Earthquake Engineering
Research, Buffalo, N.Y.
Idriss, I.M. [1999]. “An update to the Seed-Idriss simplified
procedure for evaluating liquefaction potential”, in
Proceedings, TRB Workshop on New Approaches to
Liquefaction, Publication No.FHWA-RD-99-165,Federal
Highway Administration, January.
Idriss, I. M., and R. W. Boulanger [2003a]. "Estimating Kα for
use in evaluating cyclic resistance of sloping ground." In Proc.
8th US-Japan Workshop on Earthquake Resistant Design of
Lifeline Facilities and Countermeasures Against Liquefaction,
O'Rourke, Bardet, and Hamada, eds., Report MCEER-03-
0003, pp. 449-468.
Idriss, I. M., and R. W. Boulanger [2003b]. "Relating Kα and
Kσ to SPT blow count and to CPT tip resistance for use in
evaluating liquefaction potential." In Proceedings, 20th
Paper No. 1.57a 10
Annual Conference of Association of State Dam Safety
Officials, ASDSO, Lexington, KY, September 8-10.
Idriss, I. M., and R. W. Boulanger, [2008]. "Soil Liquefaction
During Earthquake", Earthquake Engineering Research
Institute, EERI Publication MNO-12.
Ishihara, K., and M. Yoshimine [1992]. “Evaluation of
settlements in sand deposits following liquefaction during
earthquakes”, Soils and Foundations 32(1), pp. 173–188.
Juang, C.H., T. Jiang, and R.D. Andrus [2002]. “Assessing
probability-based methods for liquefaction potential
evaluation”, Journal of Geotechnical and Geoenvironmental
Engineering, ASCE, 2002; 128(7), pp. 580-589.
Liao, S. C. and R. V. Whitman [1986], “Overburden
correction factors for SPT in sand”, J. Geot. Engrg., ASCE,
1986, 112(3), pp. 373-377.
Mayne, P.W., B. Christopher, R. Berg, and J. DeJong [2002].
“Subsurface Investigations - Geotechnical Site Characteriza-
tion”, Publication No. FHWA-NHI-01-031, National Highway
Institute, Federal Highway Administration, Washington, D.C.,
301 pages.
Nagase, H. and K. Ishihara [1988]. "Liquefaction-induced
compaction and settlement of sand during earthquakes", Soils
and Foundations, Vol. 28, No. 1, pp. 66-76.
NRC [1985]. “Liquefaction of soils during earthquakes”,
Report No. CETS-EE-001, National Academic Press,
Washington, DC, USA
Rauch, A.F. [1997]. “EPOLLS: An Empirical Method for
Predicting Surface Displacements Due to Liquefaction-
Induced Lateral Spreading in earthquakes”, Ph.D.
dissertation, Virginia Polytechnic Institute and State
University, VA.
Seed, H.B. [1983]. “Earthquake Resistance Design of Earth
Dams”, Symposium on Seismic Design of Earth Dams and
caverns, ASCE, New York, pp. 41-64.
Seed, H.B., and I.M. Idriss [1971]. “Simplified procedure fore
valuating soil liquefaction potential”, J. Soil Mechanics and
Foundations Div., ASCE 97 (SM9), pp. 1249–273.
Seed, H.B., and I.M. Idriss [1982]. “Ground motions and soil
liquefaction during earthquake”, Earthquake Engineering
Research Institute, Oakland, CA, 134 pages.
Shamoto Y., J. Zhang and K. Tokimatsu [1998]. "New charts
for predicting large residual post-liquefaction ground
deformation", Soil Dynamics and Earthquake Engineering,
Vol. 17, February 18, pp 427-438.
Terzaghi, K. and R. B. Peck [1967]. “Soil Mechanics in
Engineering Practice”, 2nd edn., John Wiley, New York,
London, Sydney.
Tokimatsu, K. and Y. Yoshimi [1983]. “Empirical
correlations of soil liquefaction based on SPT N-values and
fines content”, Soils and Foundations. 23(4), pp. 56-74.
Tokimatsu, K. and H.B. Seed [1987]. "Evaluation of
Settlements in Sands Due to Earthquake Shaking", Journal of
Geotechnical Engineering, Vol 113, No. 8, pp. 861-878.
Valsamis, A., G. Bouckovalas, and V. Dimitriadi, [2007].
“Numerical evaluation of lateral spreading displacement in
layered soils”, 4th
International Conference on Earthquake
Geotechnical Engineering. ISSMGE. Thessaloniki, Greece,
June 25-28 Paper No. 1644
Varnes, D.J. [1978]. “Slope Movement Types and Processes”,
Landslides – Analysis and Control, Special Report 176, R. L.
Schuster and R. J. Krizek (eds.), Trans. Research Board,
Washington, D.C.
Wang, Z. [2008]. “May 12, 2008 Sichuan, China Earthquake
Reconnaissance”, University of Kentucky, Lexington, KY
Yi, F. [2009], “Case Study of CPT Application to Evaluate
Seismic Settlement in Dry Sand”, Manuscript submitted to
The 2nd International Symposium on Cone Penetration
Testing, Huntington Beach, California, USA, May 9-11, 2010.
Yoshimine, M., H. Nishizaki, K. Amano, and Y. Hosono
[2006]. “Flow Deformation of Liquefied Sand Under Constant
Shear Load And Its Application To Analysis Of Flow Slide Of
Infinite Slope”, Soil Dynamics and Earthquake Engineering,
Vol.26, Issues 2-4, pp.253-264.
Youd, T.L., I.M. Idriss, R.D. Andrus, I. Arango, G. Castro,
J.T. Christian, R. Dobry, W.D.L. Liam Finn, L.F. Harder, Jr.
M.E. Hynes, K. Ishihara, J.P. Koester, S.S.C. Liao, W.F.
Marcuson, III, G.R. Martin, J.K. Mitchell, Y. Moriwaki, M.S.
Power, P.K. Robertson, R.B. Seed, K.H. Stokoe, II [1997].
“Summary Report”, Proceedings of the NCEER Workshop on
Evaluation of Liquefaction Resistance of Soils, National
Center for Earthquake Engineering Research Technical Report
NCEER-97-0022, pp. 1-40.
Zhang, G., P.K. Robertson, and R. W. I. Brachman [2004].
“Estimating Liquefaction-Induced Lateral Displacements
Using the Standard Penetration Test or Cone Penetration
Test”, Journal of Geotechnical and Geoenvironmental
Engineering, ASCE, August, 2004, 861-871