Embed Size (px)
Citation preview

Mustafa B. Erten,1 Robert B. Gilbert,2 Chadi S. El Mohtar3 and Danny D. Reible4
Development of a Laboratory Procedure toEvaluate the Consolidation Potential of SoftContaminated Sediments
ABSTRACT: Consolidation settlement of non-aqueous phase liquid (NAPL) contaminated sediments may trigger NAPL mitigation. The con-solidation potential and resulting NAPL mobilization of the sediments should be evaluated in the laboratory; however, due to the highly compressi-ble and weak nature of riverbed sediments, it is usually not possible to conduct conventional consolidation tests on sediment specimens. In thisstudy, a triaxial setup was modified to work effectively under low stresses. Kaolinite was used to represent the soil solid phase and Soltrol 130 (atype of mineral oil) was used to represent the NAPL. Both oil-wetted and water-wetted regimes were analyzed. Hexane Extraction and moisturecontent tests results confirmed the final fluid amounts in the specimen obtained by measuring the effluent volume during consolidation. The resultsof the tests show that approximately 0.1 g of NAPL per 1 g of soil solids is unlikely to be mobilized by consolidation. The developed procedurecould also be employed to define the mobile and immobile fractions of NAPL and the expected compression of contaminated sediments. The vol-ume of NAPL in excess of the retained residual can be used to design NAPL collection systems or to size layers of NAPL sorbent materials suchas organo-clays.
KEYWORDS: contamination, consolidation, kaolinite, NAPL, sediments
Nomenclature
Cc ¼ Compression indexe0 ¼ Initial void ratio
K0 ¼ Lateral earth pressure coefficient at restKactive ¼ Active lateral earth pressure coefficient
LL ¼ Liquid limitSNAPL ¼ NAPL saturation ratioVNAPL ¼ Volume of NAPLVFluid ¼ Total volume of pore fluids
WNAPL ¼ Weight of NAPLWSolids ¼ Weight of soil solids
r0H ¼ Horizontal effective stressr0v ¼ Vertical effective stressp ¼ Plasticity index
hNAPL ¼ Volumetric NAPL contenthwater ¼ Volumetric water content
u ¼ Total stress friction angleu’ ¼ Effective stress friction angle
Introduction
Consolidation testing of non aqueous phase liquid (NAPL) conta-minated sediments is challenging since they usually are finegrained low strength media with very high water contents.Although contaminants may be contained in sediments effectivelyby using various remediation methods, there is always a concernthat these contaminants may mobilize and migrate into the overly-ing water. A cover or cap of clean sediment on top of the contami-nated sediment is one approach used to try to reduce thismigration (Zeman 1994). However, adding a sand layer on top ofa soft sediment will cause consolidation settlement that might leadto mobilization of the NAPL (Azcue et al. 1998). Therefore, it isimportant to determine the consolidation properties of the sedi-ment to try to predict both amount and properties of the expelledNAPL due to the added load. The consolidation properties of sedi-ments can be evaluated by laboratory tests; however, these testsare challenging mainly because these sediment specimens are verysoft and they may contain contaminants which require specialcare. Usually sediments have very high fluid content, whichmakes preparing a laboratory sample almost impossible. The focusof this work is to develop a procedure to measure consolidationproperties of these soft NAPL contaminated sediments and simul-taneously measure the amount and quality of the water and/orNAPL that might be expelled.
Steward (2007) introduced a new method for specimen prepa-ration of undisturbed NAPL contaminated sediments and
Manuscript received December 10, 2010; accepted for publication June 9,2011; published online July 2011.
1Graduate Research Assistant, Univ. of Texas at Austin, 1 UniversityStation C1792, Austin, TX 78712-0273. (Corresponding author), e-mail:[email protected]
2Brunswick-Abernathy Regents Professor in Soil Dynamics andGeotechnical Engineering, Univ. of Texas at Austin, 1 University StationC1792, Austin, TX 78712-0273.
3Ph.D., Assistant Professor, Dept. of Civil, Architectural, and EnvironmentalEngineering, Univ. of Texas at Austin, Austin, TX 78712-0273.
4Bettie Margaret Smith Chair of Environmental Health Engineering, Dept.of Civil, Architectural, and Environmental Engineering, Univ. of Texas atAustin, TX 78712-0273.
Copyright VC 2011 by ASTM International, 100 Barr Harbor Drive, PO Box C700, West Conshohocken, PA 19428-2959. 1
Geotechnical Testing Journal, Vol. 34, No. 5Paper ID GTJ103689
Available online at: www.astm.org
Copyright by ASTM Int'l (all rights reserved); Mon Nov 7 16:05:31 EST 2011Downloaded/printed byUniv of Texas Austin pursuant to License Agreement. No further reproductions authorized.

conducted consolidation tests using a triaxial setup. Initial NAPLsaturation of the test samples changed between 0 %–38 %. Efflu-ent was collected in bladder accumulators. NAPL mobilizationwas observed in two of the nine specimens tested. Moretti (2008)conducted similar tests on NAPL contaminated sediments. Theresults indicated that consolidation may mobilize the NAPL insediments. Steward (2007) and Moretti (2008) worked on fieldsamples which varied significantly in terms of the soil type andpore fluid constituents. This heterogeneity made it difficult toderive general conclusions on the consolidation behavior.
Thornley (2006) tested oil contaminated sediments by mixingkaolinite and bentonite with oil at low oil/water volume ratios.The sediment slurries were tested in a modified Rowe Cell. Theresults showed that the addition of oil had a minor effect on theconsolidation behavior when compared to the results of the testson clean kaolinite and bentonite slurries. The results showed thatoil mobilization can occur due to the consolidation of specimens.
Ma et al. (2010) conducted column tests to evaluate the consol-idation of very soft sediments and the effect of consolidation onthe expulsion of contaminated pore fluid. The column test had cer-tain advantages such as being easy to set up and an inexpensiveapparatus. The major disadvantages were the following: the diam-eter to height ratio of the specimens was very low resulting inhigh bias in the results due to wall friction. In addition, the fluidpressures in the specimen could not be controlled, and the volumeof the effluent was not known.
Imai (1979), Imai et al. (1984), and Sridharan and Prakash(1999) conducted seepage consolidation tests on very soft soils. Ina seepage consolidation test, the specimen was consolidated in atube under a differential hydraulic head applied across the speci-men. This type of consolidation test is very useful for testing verysoft clean specimens although the applied differential head is typi-cally much larger than would be applied under self-weight consol-idation or with a thin sand cap and unrealistic amounts of NAPLmay be mobilized by this head difference. Centrifuge testing isanother common way of testing very soft sediments (Moo-Younget al. 2003; Robinson et al. 2003). The major concern with run-ning centrifuge tests is being able to appropriately model low loadconsolidation NAPL and water behavior from the response at thevarying accelerations.
Lee and Fox (2008, 2009) and Lee et al. (2009) conducted con-solidation tests to investigate the effect of consolidation on solutetransport. They concluded that consolidation can make the solutetransport faster. In these tests, they used a miscible tracer to detectthe pore fluid mobilization.
Contaminants may exist in the pore spaces at different satura-tion ratios and they may be miscible or immiscible with the porewater. Variation in the pore fluid may influence the physico-chemical structure of the soil and affects its consolidation andstrength properties. The influence of pore fluid on the character-istics of soils was investigated in several studies. Mesri andOlson (1971) calculated coefficients of permeability of kaolinite,illite, and smectite with different pore fluids. Permeability valueswere back calculated from the consolidation data by using Terza-ghi’s theory of one-dimensional consolidation. The results indi-cated that permeabilities were highest for non-polar pore fluidsand lowest for water (high dielectric constant fluid). Acar and
Olivieri (1989) conducted hydraulic conductivity tests on com-pacted kaolinite specimens. In this study, it was observed thatwhen organic fluids were permeated through the specimen, thehydraulic conductivity of soils changed. Anandarajah and Zhao(2000) investigated the effect of different pore fluids on thestrength of kaolinite.
Olson and Mesri (1970) conducted one dimensional consolida-tion tests on kaolinite slurries as well as illite and smectite slurries.The specimens included one-phase pore fluids, which were water,carbon tetrachloride, and ethyl alcohol. The results showed thatthe consolidation behavior of kaolinite was governed mainly bythe mechanical factors rather than physico-chemical effects. Themechanical factors were defined as the strength, flexibility, andsurface friction of the soil particles. In addition, the compressibil-ity of kaolinite with carbon tetrachloride and ethyl alcohol wasdifferent than the compressibility of water saturated samples.
The objective of this study is to develop a testing system toevaluate the consolidation potential of contaminated sediments atvarious oil saturation ratios. A regular oedometer consolidation testsetup has certain disadvantages when used for testing soft contami-nated sediments. Some of these limitations are: an accurate assess-ment of the amount of the effluent fluid is not possible; it does notallow application of pore pressures which can help simulate thefield stress conditions; wall friction that can constrain the move-ment of the soil nest to the ring. In this study, a modified triaxialset up was used for consolidating soft sediments. The triaxial appa-ratus provided separate applications of vertical, horizontal, andpore pressures which ensured that the stress conditions in the fieldwere simulated more accurately. Several modifications were madeto the standard triaxial setup, specimen preparation and testing pro-cedures so that the testing worked efficiently under low effectivestresses and the expelled fluid could be collected for further testing.In addition, a laboratory preparation method for controlled NAPLcontaminated sediment specimens at high fluid contents was devel-oped. Finally, using the specimen preparation procedure and themodified triaxial setup, consolidation tests were successfully con-ducted on sediments at 0 %–100 % oil saturation ratios.
Test Apparatus
A triaxial setup has certain advantages over a conventional con-solidation device. The apparatus allows vertical and horizontalstresses to be applied independently to let the specimen consoli-date under anisotropic conditions. Pore pressures can be con-trolled to better represent the field conditions. In addition, the soilspecimen is confined by a very soft membrane so that side fric-tions are eliminated to a great extent.
To adapt a conventional triaxial setup for consolidation of verysoft contaminated sediments, several modifications were imple-mented. The loading system in a regular triaxial setup is designedto apply displacements at a constant rate. However, in a consolida-tion test, it is important to load a specimen in load-control condi-tions. To apply a constant load on the specimen, an air piston wasattached at the top of the triaxial frame. The maximum pressurethat the air piston can apply is 1034 kPa. A load cell was attachedin between the air piston and the triaxial piston. The load cell had
2 GEOTECHNICAL TESTING JOURNAL
Copyright by ASTM Int'l (all rights reserved); Mon Nov 7 16:05:31 EST 2011Downloaded/printed byUniv of Texas Austin pursuant to License Agreement. No further reproductions authorized.

a maximum capacity of 11.3 kg. The precision of the load cellwas 60.005 kg.
The confining pressure around the specimen was provided byusing pressure regulators. The selected pressure regulators shouldhave a low pressure range but should reach pressures up to themaximum required cell pressures. The pressure regulators hadmaximum output capacity of 69 kPa.
In a typical pressure panel, burettes are filled with water to cap-ture the volume change in the specimen or the cell. When theapplied pressure needs to be increased, air pressure is applied at thetop of the water column in the burettes. However, the height ofwater in the burettes will create an additional stress and this stresswill add to the applied air pressure. Since the pressures dealt with ina regular triaxial shear strength tests are reasonably high, this addi-
tional water pressure is usually ignored. In a typical pressure panelwith a burette length of 30 cm, applied pressures can be off by asmuch as 2.76 kPa from the pressure panel reading depending on thewater level in the burette and the vertical location of the specimenrelative to the burette. When testing near-surface sediments, wherein situ effective stresses are fairly low, a 2.76 kPa difference inapplied effective stress would create a significant difference in theconsolidation behavior. To overcome this problem, differential pres-sure transducers were connected at the bottom of the specimen andthe cell. It is important that the pressure transducers are connectedat the same height as the specimen and the cell. The differentialpressure transducers had a maximum pressure limit of 86 kPa.
In a typical triaxial test in which the pore fluid is expectedto be water only, latex membranes are preferred. However,
FIG. 1—(a and b) Pictures and (c) schematic of final apparatus.
ERTEN ETAL. ON CONSOLIDATION OF NAPL CONTAMINATED SEDIMENTS 3
Copyright by ASTM Int'l (all rights reserved); Mon Nov 7 16:05:31 EST 2011Downloaded/printed byUniv of Texas Austin pursuant to License Agreement. No further reproductions authorized.
contaminants in soil pores can react with the latex membrane anddisintegrate it over the time of a consolidation tests (one test cantake few weeks). Therefore, neoprene membranes were used forthese tests since neoprene is non-reactive with most contaminants.In addition, the effluent tubing should be non-absorptive. Teflontubing was used to overcome this problem.
Bladder accumulators were used in the setup to keep the efflu-ent separated from the pressure panel and to avoid contaminantsreaching the panel. The effluent goes into the bladder accumulatorand pushes clean water out of the other half of the bladder into thepressure panel. The bladder accumulators help collect the contam-inants for further analysis. The bladder is made of a non-reactivematerial; however, it is gas permeable.
A schematic of the final testing apparatus is shown in Fig. 1.The vertical displacements are recorded with a dial gage or anLVDT, which is placed on a plastic arm attached to the triaxialpiston. The volume change in the cell and specimen was measuredfrom the change in the volume of water in the burettes of the pres-sure panel.
Materials
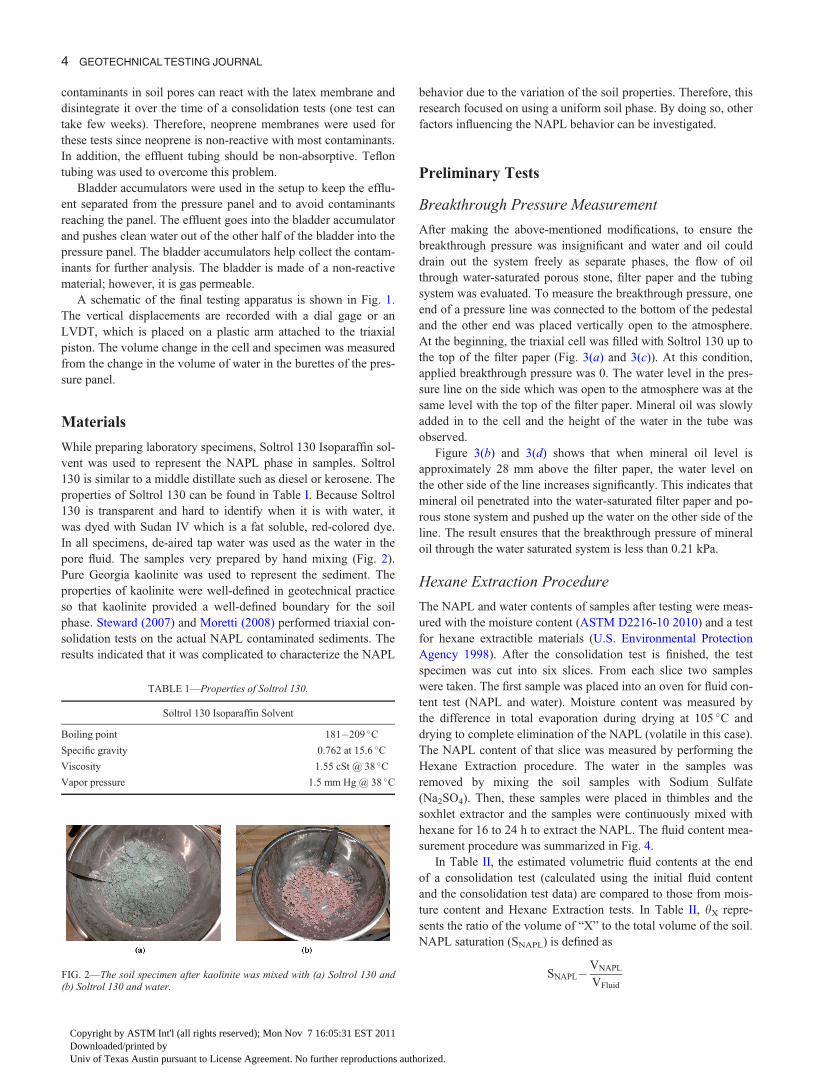
While preparing laboratory specimens, Soltrol 130 Isoparaffin sol-vent was used to represent the NAPL phase in samples. Soltrol130 is similar to a middle distillate such as diesel or kerosene. Theproperties of Soltrol 130 can be found in Table I. Because Soltrol130 is transparent and hard to identify when it is with water, itwas dyed with Sudan IV which is a fat soluble, red-colored dye.In all specimens, de-aired tap water was used as the water in thepore fluid. The samples very prepared by hand mixing (Fig. 2).Pure Georgia kaolinite was used to represent the sediment. Theproperties of kaolinite were well-defined in geotechnical practiceso that kaolinite provided a well-defined boundary for the soilphase. Steward (2007) and Moretti (2008) performed triaxial con-solidation tests on the actual NAPL contaminated sediments. Theresults indicated that it was complicated to characterize the NAPL
behavior due to the variation of the soil properties. Therefore, thisresearch focused on using a uniform soil phase. By doing so, otherfactors influencing the NAPL behavior can be investigated.
Preliminary Tests
Breakthrough Pressure Measurement
After making the above-mentioned modifications, to ensure thebreakthrough pressure was insignificant and water and oil coulddrain out the system freely as separate phases, the flow of oilthrough water-saturated porous stone, filter paper and the tubingsystem was evaluated. To measure the breakthrough pressure, oneend of a pressure line was connected to the bottom of the pedestaland the other end was placed vertically open to the atmosphere.At the beginning, the triaxial cell was filled with Soltrol 130 up tothe top of the filter paper (Fig. 3(a) and 3(c)). At this condition,applied breakthrough pressure was 0. The water level in the pres-sure line on the side which was open to the atmosphere was at thesame level with the top of the filter paper. Mineral oil was slowlyadded in to the cell and the height of the water in the tube wasobserved.
Figure 3(b) and 3(d) shows that when mineral oil level isapproximately 28 mm above the filter paper, the water level onthe other side of the line increases significantly. This indicates thatmineral oil penetrated into the water-saturated filter paper and po-rous stone system and pushed up the water on the other side of theline. The result ensures that the breakthrough pressure of mineraloil through the water saturated system is less than 0.21 kPa.
Hexane Extraction Procedure
The NAPL and water contents of samples after testing were meas-ured with the moisture content (ASTM D2216-10 2010) and a testfor hexane extractible materials (U.S. Environmental ProtectionAgency 1998). After the consolidation test is finished, the testspecimen was cut into six slices. From each slice two sampleswere taken. The first sample was placed into an oven for fluid con-tent test (NAPL and water). Moisture content was measured bythe difference in total evaporation during drying at 105 �C anddrying to complete elimination of the NAPL (volatile in this case).The NAPL content of that slice was measured by performing theHexane Extraction procedure. The water in the samples wasremoved by mixing the soil samples with Sodium Sulfate(Na2SO4). Then, these samples were placed in thimbles and thesoxhlet extractor and the samples were continuously mixed withhexane for 16 to 24 h to extract the NAPL. The fluid content mea-surement procedure was summarized in Fig. 4.
In Table II, the estimated volumetric fluid contents at the endof a consolidation test (calculated using the initial fluid contentand the consolidation test data) are compared to those from mois-ture content and Hexane Extraction tests. In Table II, hX repre-sents the ratio of the volume of “X” to the total volume of the soil.NAPL saturation (SNAPL) is defined as
SNAPL�VNAPL
VFluid
TABLE 1—Properties of Soltrol 130.
Soltrol 130 Isoparaffin Solvent
Boiling point 181�209 �C
Specific gravity 0.762 at 15.6 �C
Viscosity 1.55 cSt @ 38 �C
Vapor pressure 1.5 mm Hg @ 38 �C
FIG. 2—The soil specimen after kaolinite was mixed with (a) Soltrol 130 and(b) Soltrol 130 and water.
4 GEOTECHNICAL TESTING JOURNAL
Copyright by ASTM Int'l (all rights reserved); Mon Nov 7 16:05:31 EST 2011Downloaded/printed byUniv of Texas Austin pursuant to License Agreement. No further reproductions authorized.

where:VNAPL ¼ Volume of NAPL,VFluid ¼ Total Volume of Pore Fluids.
The fluid contents comparison in Table II implies that theamount of fluids after each consolidation stage can be successfullyestimated by using the consolidation data.
Sample Preparation
El-Sherbiny (2006) placed kaolinite in a tub and filled the tubwith water. The moisture content of kaolinite was measured atvarious depths after the primary consolidation was finished. Byusing the moisture content profile measured by El-Sherbiny
FIG. 4—Flowchart of the fluid content measurement.
TABLE 2—Final fluid contents calculated from consolidation test readings,moisture content and hexane extraction tests.
Hexane Extraction and Moisture Content Tests Consolidation Test
hwater 44 % 46 %
hNAPL 12 % 14 %
htotal 56 % 60 %
SNAPL 21 % 23.0 %
FIG. 3—Breakthrough test when the mineral oil level is (a and c) at the top of the filter paper (zero breakthrough pressure) and (b and d) slightly higher than thetop of the filter paper (breakthrough pressure �0.21 kPa).
ERTEN ETAL. ON CONSOLIDATION OF NAPL CONTAMINATED SEDIMENTS 5
Copyright by ASTM Int'l (all rights reserved); Mon Nov 7 16:05:31 EST 2011Downloaded/printed byUniv of Texas Austin pursuant to License Agreement. No further reproductions authorized.
(2006), the effective stress, moisture content profile was generatedfor the kaolinite. Then the moisture content of kaolinite wasobtained for the imaginary samples which were located at depthsof 0.9 m and 1.1 m below the mudline. In both cases, it wasassumed that the depth of river was 3.3 m above the mudline. Thein situ stresses (vertical and horizontal stresses, and pore pressure)were calculated for imaginary cases where the sample was located0.9 m below the mudline for the clean sediments and 1.1 m belowthe mudline for the NAPL-contaminated sediments. The place-ment water content of the clean sediment samples was 90 %.Theinitial void ratio (e0) for the clean sediments was 2.32, while itwas 2.05 for the NAPL contaminated sediments.
After determining the required fluid content for the correspond-ing e0, all the samples were mixed by hand in a bowl with a spat-ula (as seen in Fig. 2). Initial testing program showed that whenthe samples with oil and water were mixed at this e0, the maxi-mum possible water saturation was 30 %. For any higher watersaturation levels, the soil mixture became unstable and mineral oilfloated out due to the buoyancy forces. Therefore, for specimenswith oil and water pore fluid at water saturation higher than 30 %,the specimens were prepared at 30 % water saturation and thenwater is flushed through the specimen to push out the NAPL untilrequired water saturation is reached.
Specimen Setup
Before setting up the specimen, porous stones were saturated byeither boiling them in water or placing them in an ultrasonicshaker for 20–25 min. Filter papers were saturated in a separatebeaker. All the pressure lines were saturated with water beforeplacing the soil mixture. Both the top cap and the bottom pedestalsides were greased to provide a better contact with the membrane.All samples had a diameter of 5.1 cm and a length of 10.2 cm. Aneoprene membrane was placed on the bottom pedestal. Themembrane was sealed by using 3 o-rings. A saturated porous stoneand a filter paper were placed inside the membrane on the bottompedestal. A vacuum split mold was then placed around the mem-brane on the bottom pedestal and the top part of the membranewas flipped over the mold. Vacuum was applied between themold and membrane for the membrane to take the form of themold. While placing the soil mixture into the membrane, the mainconcern was to place the soil sample into the membrane at con-trolled NAPL and water contents at a certain initial void ratio. Inaddition, the sample should have been close to 100 % saturation.The prepared soil mixture was placed in the membrane in severallifts. After each lift, soil was compacted by slightly tamping witha metal rod. By slight tamping, the fluid contents of the soil didnot change. In addition, in the tests where the specimen had onlyone type of pore fluid (water or NAPL) after applying in situstresses calculated for the imaginary case, the B-value was meas-ured around 0.97 in all tests. This indicated that the specimenswere very close to 100 % saturation. Therefore, tamping was con-sidered as the best method to place the soil into the membrane.
After placing the soil in the membrane, a filter paper, a porousstone and the top cap were placed on the top of the specimen. Themembrane was rolled over the top cap and sealed with 3 o-rings.Pressure lines were connected to the top cap. For the clean sedi-
ments samples the triaxial cell was filled with water while the topcap of the cell was still not in place. The vacuum split mold wascarefully removed by using spatulas and tongs while the waterwas still in the cell. Specimen dimensions were assumed the sameas the vacuum split mold. When the sample had NAPL, the vac-uum split mold was easily removed. No bulging or sample defor-mation was observed due to the stress release. Specimen heightand diameter were measured at several locations. Then the cellwas assembled and filled with de-aired tap water. The triaxial pis-ton was then placed in the divot on the top cap and locked withoutapplying any pressure on the specimen.
Flushing Stage
As mentioned earlier, if SNAPL was required to be less than 70 %,the oil content decreased by pushing water from the top, whichcaused the NAPL to expel from the bottom. This stage is calledthe flushing stage. During the flushing stage, three lines connect-ing the pressure panel and the triaxial cell were used for pressureapplication: The first line was connected to the triaxial cell outsidethe specimen; the second line was connected directly to the top ofthe specimen; and the third line was connected to the bottom ofthe specimen through the bladder accumulator. Initially, the celland the pore pressures were set to equal values. Then an extrapressure was applied to the top of the specimen. A hydraulic gra-dient was created due to the differential pressure at the top and thebottom of the specimen. The water was flushed through the speci-men from the top and pushed the NAPL out from the bottom. TheNAPL was collected in the top cell of the bladder accumulator.By doing so, NAPL saturation was gradually reduced since theNAPL in the specimen was replaced with water.
Consolidation Test Procedure
During the consolidation stage two lines were required betweenthe panel and the triaxial cell. One of them was connected to thecell to control the cell pressure. The other line was connected tothe bladder accumulator. The bladder accumulator was connectedto the top and bottom of the specimen by using a t-connector. Afterthe flushing stage was over, the pressures at the top and bottom ofthe specimen were set to the same value. Then cell pressure wasincreased to the effective stress required for the first consolidationstage. After that, pore pressures as well as cell pressure wereincreased simultaneously until required pore pressure was reachedwithout changing the effective stresses during the process. The pis-ton at the top was released and the vertical pressure was set to theuplift compensation. The specimen was consolidated under initialstresses calculated for the scenarios described previously.
During preliminary testing program, initially K0 was selectedas 0.5. K0 is defined as the ratio of horizontal effective stress (r
0H )
to the vertical effective stress (r0v) on the soil specimen. However,
when K0 was 0.5 or 0.6, the sample failed during one of the con-solidation stages. The reason for failure was considered due to thefact that when K0 was 0.5 or 0.6, the applied horizontal stress didnot provide required confining pressure that would have been inthe field. It should be noted that these failures occurred under con-solidated-undrained (or mostly undrained) conditions. If the ratio
6 GEOTECHNICAL TESTING JOURNAL
Copyright by ASTM Int'l (all rights reserved); Mon Nov 7 16:05:31 EST 2011Downloaded/printed byUniv of Texas Austin pursuant to License Agreement. No further reproductions authorized.

of the undrained shear strength to the effective vertical stress (c/pratio) of this soil is 0.25, that would give a total stress frictionangle (U) of 14� giving an undrained active earth pressure coeffi-cient (Kactive) of 0.61. If the shear-induced pore water pressuresdissipated before the specimen failed, then the effective stress fric-tion angle ( U’) would have been much higher (greater than 30 oreven 40 degrees at these low normal stresses). Failure was notobserved when K0 was 0.7. Therefore it was assumed that the rep-resentative K0 of this soil was between 0.6 and 0.7. Preliminarytesting program showed that K0 of 0.5, 0.6, or 0.7 did not have asignificant effect on the consolidation behavior (as can be seenlater on in Fig. 6). In all latter tests, K0 of 0.7 was used.
Both the horizontal and vertical pressures felt by the specimenare directly related to the pore pressure distribution in the speci-men. When an additional load is applied on the specimen, initiallythis load is carried by the pore fluid. This additional load is thentransferred to the soil skeleton as the excess pore water pressure isdissipated. Therefore, when a constant cell pressure is applied tothe specimen in a triaxial setup, the vertical pressure required tokeep the K0 condition will increase proportional to the excesspore pressure dissipation. Therefore in all consolidation tests inthe current study, the vertical pressures are applied incrementallyto ensure the applied vertical stresses maintained the K0 equal to0.7. The initial pore pressure dissipation curve was obtained froman isotropic consolidation test. In Fig. 5, the expected consolida-tion curve was labeled “Isotropic Consolidation.” The curve “K0
Condition” indicates the volumetric strain changes when the verti-
cal load is applied following the pore pressure dissipation in theisotropic test. The figure shows that the observed consolidationbehavior matches perfectly with the pore pressure dissipation dur-ing the consolidation stage.
Results
Water-Saturated Specimens
During the initial testing program, kaolinite was mixed with wateronly to prepare clean sediments samples. The lateral earth pressurecoefficient (K0) was varied to observe the effect on consolidation.
The void ratios versus effective stress relationships found inthe current study for the clean sediments were similar to theresults reported in Olson and Mesri (1970) for water-saturatedspecimens of kaolinite (Fig. 6). In addition, the depth of waterabove the sediment did not affect the results for water-saturatedspecimens since the effective stresses were the same (the curve la-beled “K0¼ 0.7 (I)” in Fig. 6 is for the stress condition where themudline is 1.5 m below the water surface, while the curve labeled“K0¼ 0.7 (II)” is for a 3 m water depth). It can also be concludedthat there is no significant change in consolidation behavior for K0
of 0.5, 0.6, and 0.7.Mesri and Olson (1971) conducted hydraulic conductivity tests
on water saturated kaolinite specimens. Coefficients of consolida-tion values were back-calculated by using the hydraulic conductiv-ity values reported in their study. The coefficients of consolidationvalues found in this study were compared with Mesri and Olson(1971) in Table III.
Oil and Water Saturated Specimens
Six consolidation tests were performed at varying NAPL saturationratios (SNAPL). (15 % to 100 %). Oil-wetted specimens were pre-pared by mixing the kaolinite with oil first and then water. Inwater-wetted specimens, the opposite order of mixing was fol-lowed. Three of the specimens were prepared as water-wetted whilethe other three were oil-wetted. All the specimens were mixed to
FIG. 5—Comparison of the K0 consolidation curve with the isotropic consoli-dation curve.
FIG. 6—Summary of consolidation test results for water-saturated specimens.
TABLE 3—Comparison of measured rates of consolidation for water-satu-rated specimens.
Coefficient of Consolidation (cm2/min)
Effective Stress (kPa) Current Study Mesri and Olson (1971)
10.3 0.07 0.07
15.2 0.08 0.07
TABLE 4—The properties of soil specimens tested.
Test Type SNAPL Cc
1 Oil-saturated 100 % 0.41
2 Oil-wetted 70 % 0.40
3 Water-wetted 70 % 0.44
4 Oil-wetted 42 % 0.56
5 Water-wetted 39 % 0.47
6 Water-wetted 15 % 0.56
ERTEN ETAL. ON CONSOLIDATION OF NAPL CONTAMINATED SEDIMENTS 7
Copyright by ASTM Int'l (all rights reserved); Mon Nov 7 16:05:31 EST 2011Downloaded/printed byUniv of Texas Austin pursuant to License Agreement. No further reproductions authorized.

70 % of SNAPL and compacted at a void ratio of 2.05. The NAPLcontents were then decreased to the desired values through waterflushing as mentioned in the specimen preparation section. NAPLcontents and compression indices (Cc) of all the tests are given inTable IV. Cc values varied between 0.40 and 0.56.
Figure 7 shows void ratio versus vertical effective stress rela-tions for all specimens. Due to the consolidation during the flush-ing stage, initial void ratios are lower when the desired initialNAPL saturation is lower due to longer flushing. While the com-pression index values vary with NAPL saturation ratios, they donot show significant differences. However, the general trendshows that sediments with higher SNAPL, tend to be stiffer. In twotests where SNAPL is at 70 %, the consolidation behavior is verysimilar although one of the specimens is oil-wetted and the otheris water-wetted. A similar conclusion can be made when the testswith SNAPL of 42 % and 39 % are compared. The results showthat there is no significant difference in consolidation behaviorbetween the oil-wetted and water wetted specimens.
Figure 8 shows the change in void ratio with increasing effec-tive stress of tests conducted on water-wetted specimens wherethe initial SNAPL was below 35 %. In Figs. 8–11, the continuousline indicates that the expelling fluid during the consolidationstage is only NAPL, whereas the dashed line indicates that onlywater was expelled during the consolidation process.
Figure 9 shows how the SNAPL changes with increasing verti-cal effective stress. As seen, when SNAPL reaches 18 %, the NAPLis no longer mobilized by changes in the confining pressure. TheSNAPL indicates the ratio of volume of NAPL to the total volume
of the pore fluids and does not take into account the amount ofsoil solids. Therefore, a change in SNAPL is not a direct measure ofthe amount of retained oil in the sediment since the total volumeof the pore fluid can be changing due to water expulsion, whereashNAPL includes the volume of both fluids as well as the volume ofsoil solids.
As seen in Fig. 10, the change in hNAPL shows a more charac-teristic trend when compared with the results in Fig. 9. Therefore,hNAPL seems to provide a better way of quantifying the amount ofresidual NAPL. When hNAPL is around 12 %, the NAPL is no lon-ger mobilized.
FIG. 7—Void ratio versus effective stress relation of the tested specimens.
FIG. 8—Void ratio versus vertical effective stress curves for water-wettedspecimens.
FIG. 9—Change in NAPL saturation during the test.
FIG. 10—Change in volumetric NAPL content during the test.
FIG. 11—Change in weight of NAPL per weight of soil solids.
8 GEOTECHNICAL TESTING JOURNAL
Copyright by ASTM Int'l (all rights reserved); Mon Nov 7 16:05:31 EST 2011Downloaded/printed byUniv of Texas Austin pursuant to License Agreement. No further reproductions authorized.

Figure 11 shows the change in the weight of NAPL (WNAPL)per weight of soil solids (WSolids). The results indicate that whenWNAPL/WSolids is between 8 % and 10 %, NAPL in the soil matrixis immobilized.
Summary and Conclusions
In this study, a triaxial setup was implemented for testing the con-solidation potential and resulting NAPL expulsion of soft, conta-minated sediments. Several modifications were made to aconventional triaxial setup for consolidation testing under verylow effective stresses. Bladder accumulators were used to collectthe effluent for further analysis of the effluent.
A specimen preparation method was presented to preparespecimens at desired oil saturation ratios. Initial testing showedthat the effect of K0 was observed to be negligible on void ratioversus effective stress relationship.
Six consolidation tests were conducted on a model soft sediment(kaolinite) at different oil saturation ratios. The results showed thatCc values varied between 0.40 and 0.56. When the NAPL contentwas higher, generally the soil was stiffer. The oil-wetted and water-wetted specimens showed similar consolidation behavior.
The results of tests with kaolinite, Soltrol 130 and water mix-ture showed that approximately 0.1 g of NAPL per 1 g of soil sol-ids is unlikely to be mobilized by consolidation. The volume ofNAPL above this retained residual can be used to design a con-tainment system. Design of a capping system should be done onlyfor the amount of the NAPL expected to be expelled. This willresult in a thinner cap, and lesser amount of work will be requiredto place the cap material. The results showed that the proposedtest setup and specimen preparation method was successful toevaluate the consolidation behavior of the model sediment.
References
Acar, Y. B., and I. Olivieri, 1989, “Pore Fluid Effects on the Fab-ric and Hydraulic Conductivity of Laboratory-CompactedClay,” Transp. Res. Rec., Vol. 1219, pp. 144–159.
ASTM D2216-10, 2010, “Standard Test Methods for LaboratoryDetermination of Water (Moisture) Content of Soil and Rockby Mass,” ASTM, Philadelphia, PA.
Anandarajah, A., and D. Zhao, 2000, “Triaxial Behavior of Kao-linite in Different Pore Fluids,” J. Geotech. Geoenviron. Eng.,Vol. 126, No. 2, pp. 148–156.
Azcue, J. M., A. J. Zeman, A. Mudroch, F. Rosa, and T. Patter-son, 1998, “Assessment of Sediment and Porewater After oneYear of Subaqueous Capping of Contaminated Sediments inHamilton Harbour, Canada,” Water Sci. Technol., Vol. 37, No.6–7, pp. 323–329.
El-Sherbiny, R. M., 2006, Performance of Suction CaissonAnchors in Normally Consolidated Clay, University of Texas,Austin, TX.
Imai, G., 1979, “Development of a New Consolidation Test Pro-cedure Using Seepage Force,” Soils Found., Vol. 19, No. 3,pp. 45–60.
Imai, G., K. Yano, and S. Aoki, 1984, “Applicability of HydraulicConsolidation Test for Very Soft Clayey Soils,” Soils Found.,Vol. 24, No. 2, pp. 29–42.
Lee, J., and P. J. Fox, 2008, “An Experimental Investigation ofConsolidation Induced Solute Transport,” in GeoCongress2008: Characterization, Monitoring, and Modeling of GeoSys-tems, ASCE, New Orleans, LA, pp. 806–813.
Lee, J., and P. J. Fox, 2009, “Investigation of Consolidation-Induced Solute Transport. II: Experimental and NumericalResults,” J. Geotech. Geoenviron. Eng., Vol. 135, No. 9, pp.1239–1253.
Lee, J., P. J. Fox, and J. J. Lenhart, 2009, “Investigation of Con-solidation-Induced Solute Transport. I: Effect of Consolidationon Transport Parameters,” J. Geotech. Geoenviron. Eng., Vol.135, No. 9, pp. 1228–1238.
Ma, X., D. D. Reible, and M. Harris, 2010, “Assessment Feasibil-ity of In-Situ Capping and Contaminant Mobility in NAPL-Contaminated Sediments,” Int. J. Geotech. Eng., Vol. 4, No. 1,pp. 71–78.
Mesri, G., and R. E. Olson, 1971, “Mechanisms controlling thepermeability of clays,” Clays Clay Miner., Vol. 19, No. 3, pp.151–158.
Moo-Young, H., T. Myers, B. Tardy, R. Ledbetter, W. Vanadit-Ellis, and T. H. Kim, 2003, “Centrifuge simulation of the con-solidation characteristics of capped marine sediment beds,”Eng. Geol., Vol. 70, No. 3–4, pp. 249–258.
Moretti, L. K., 2008, Evaluation of Capping NAPL-ContaminatedSediment, Univ. of Texas, Austin, TX.
Olson, R. E., and G. Mesri, 1970, “Mechanisms Controlling Com-pressibility of Clays,” ASCE J. Soil Mech. Found. Div., Vol.96, No. 6, pp. 1863–1878.
Robinson, R. G., T. S. Tan, and F. H. Lee, 2003, “A comparativestudy of suction-induced seepage consolidation versus centri-fuge consolidation,” Geotech. Test. J., Vol. 26, No. 1, pp.92–101.
Sridharan, A., and K. Prakash, 1999, “Simplified Seepage Consol-idation Test for Soft Sediments,” Geotech. Test. J., Vol. 22,No. 3, pp. 235–244.
Steward, K. K., 2007, Development of Apparatus and Method forConsolidating Very Soft, Contaminated Sediment, Universityof Texas, Austin, TX.
Thornley, D. M., W. B. Wilkinson, and A. Parker, 2006,“A preliminary investigation of the release of oil fromcontaminated clays and other fine-grained sediments duringconsolidation,” Q. J. Eng. Geol. Hydrogeol., Vol. 39, No. 4,pp. 375–390.
U.S. Environmental Protection Agency, 1998, Method 3540-C:Soxhlet Extraction, Test Methods for Evaluating Solid Waste,Washington, D.C.
Zeman, A. J., 1994, “Subaqueous capping of very soft contami-nated sediments,” Can. Geotech. J., Vol. 31, No. 4, pp.570–577.
ERTEN ETAL. ON CONSOLIDATION OF NAPL CONTAMINATED SEDIMENTS 9
Copyright by ASTM Int'l (all rights reserved); Mon Nov 7 16:05:31 EST 2011Downloaded/printed byUniv of Texas Austin pursuant to License Agreement. No further reproductions authorized.