Embed Size (px)
Citation preview

48
Rakenteiden Mekaniikka (Journal of Structural Mechanics)Vol. 42, No 1, 2009, pp. 48-60
Problematic in formulation of wind loads on buildings
Risto Kiviluoma
Abstract. This paper describes problematic in precise modelling of wind loads on buildings.Recent tall-building projects and plans in Finland, including wind-exposed buildings of order100 m in height, have arose interest in usage of expert advice and boundary-layer wind-tunneltechnologies. Such technologies have been developed since the 1960’s for the needs ofskyscrapers. With wind-tunnel testing and their improved measurement instrumentation, resultstend to go in more detail in the actual physical phenomenon. This progress is basically related toincreased precisions and usable frequency band of the wind-tunnel instrumentation and windanemometers; as well as practical issues including automated manufacturing of scale modelsfrom 3D CAD models and computational capabilities to process big amounts of data. Withimproved techniques, smaller and smaller eddies of turbulence and rapid pressure fluctuationscan be measured. Wind-tunnel findings have doubted some older believes of proper assessmentof structural wind actions. In this paper, this problematic is dealt by using actual wind-tunnel-test projects as examples.
Keywords: wind, wind load, buildings, wind tunnel, wind-tunnel testing, boundary layer windtunnels, vibration
Introduction
Structural engineers have a well established tradition of using design standards for windactions on structures. These standards contain aerodynamic parameters of usual-shapebuildings, which have been gathered in number of wind-tunnel testing projects and windmeasurements done in the past. These standards tend to become more and morecomprehensive to cover more design situations. Nevertheless, tall buildings have beenproblematic for standardizations due to various reasons, including importance ofdynamic behaviour due to low fundamental natural frequencies; size reduction effects;complex architecturally driven shapes; and effect of nearby other buildings and cityoutskirts on wind turbulence and wind loads. Wind-tunnel testing contributing thestandards before roughly the 1960’s has been conducted in aeronautical wind tunnels,mainly in non-turbulent flows. While boundary-layer wind tunnels became in use, theimplications of wind turbulence have been understood better. This tunnel type containsa long floor to generate turbulence to cope with wind velocity height profiles as well asproper turbulence characteristics, which are aimed to be similar with the windturbulence at the building site.
Wind-tunnel testing has revealed that it is not only the tall buildings which needspecial attentions and expert advice. Any low-rise structure near a wind exposed tallbuilding may be possessed to increased and highly localized peak wind loads. Here,

49
,)0.3...8.2(; =
∝ k
dfVA
k
i
some design standards define a building as ‘wind exposed’ if being twice the height ofthe average roof level of the site.
Despite the recent increase of computing power and the progress in the developmentof computational fluid dynamics (CFD) software, wind tunnel-testing has among windengineers retained its position as the only trusted method of extracting wind actions ofnon-existing tall buildings in the city terrain. Basic problem in application of CFD is thehuge amount of detail and the model size needed to model the building, terrain and thelocal turbulence with various size eddies that contribute the vibration response of thebuilding. CFD may, however, have useful applications like optimizing shape of thebuilding and visualizing the general fluid properties; and it is under continuous researchand development that evidently widens its application possibilities in the future.
In course of time, tall buildings have been designed with stiffening systems, whichminimize the material consumption and costs, as well as maximizing the usable floorarea. This has result in modern tall buildings to be vulnerable to wind-induced vibration.To characterise this chance, two recognized skyscrapers in the City of New York, theUS, are referred. Situated close to each other and having a height of order 400 m, theEmpire-State Building (completed 1931) and the former World Trade Centre TwinTowers (completed 1970) had peak wind-induced displacement of order 0.04 m and 0.9m, respectively (actual numbers vary depending on the source). The displacementresponse, known as swaying or drift of the tower, does not harm occupants if theacceleration related to swaying is small enough. Therefore, like in the former WorldTrade Centre Twin Towers, dampers are used to reduce wind-induced accelerations. Inshorter buildings, of around 30 stories, there is a substantial difference in stiffeningoptions as well. Fundamental natural frequencies of such towers lie typically in therange fi = 0.3…0.5 Hz, meaning that a more slender tower sways with an amplitudeabout 4 times the amplitude of another one. Here, the vibration amplitude (A) is roughlyproportional to the reduced wind velocity in power of three, i.e.
(1)
where V = wind speed; fi = natural frequency and d = characteristic geometricdimension of the building. Note that without aerodynamic admittance (size correction)effects, turbulence frequency-content characteristics, etc. special issues, k = 2.0. Themass of the building affects dynamic stiffness, but in many cases the mass of the lateralstiffening system is small compared to the mass of the floor slabs and other structuresretaining Eq. (1) to be valid. By using dampers, acceleration responses of skyscrapershave been reported to be halved. These have, however, their own drawbacks.
Improvements in wind-tunnel testing techniques and a number of case studiesconducted have not only given a comprehensive database of typical behaviour ofbuildings, but have also raised new issues to be solved by the wind engineers. Thisproblematic is pursued further in this paper using actual wind-tunnel test projects asexamples.
50
Wind tunnel vs. analytical procedures
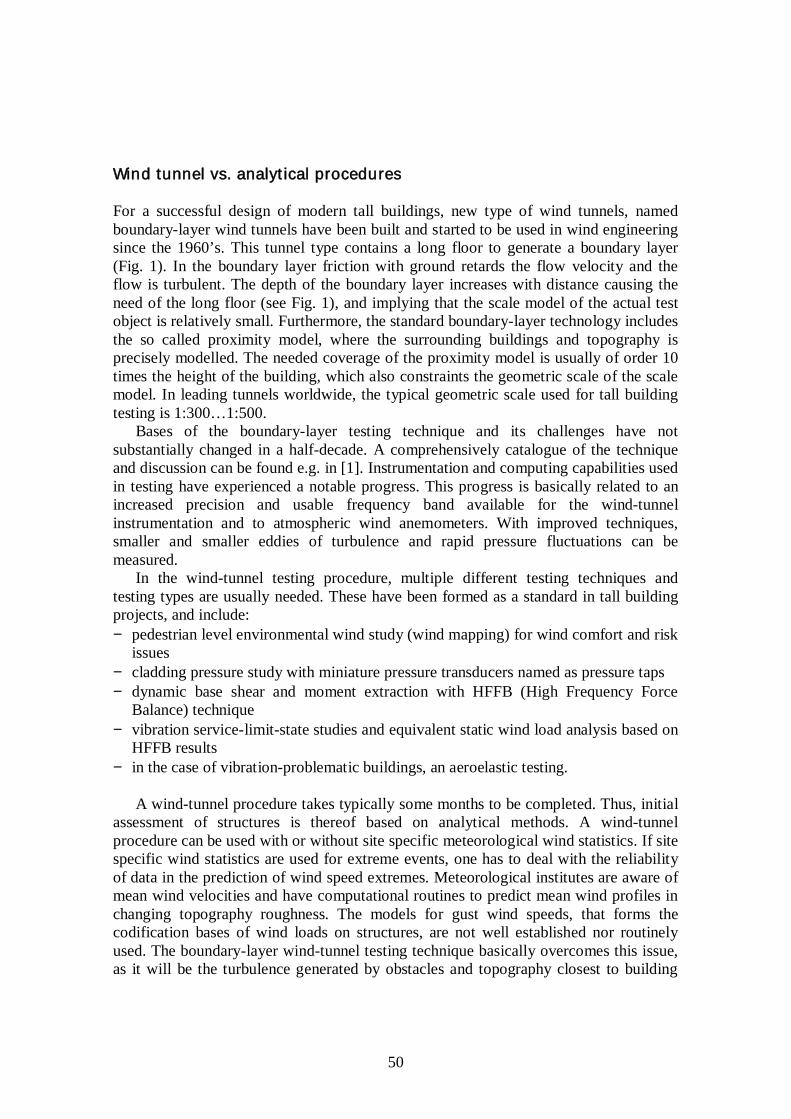
For a successful design of modern tall buildings, new type of wind tunnels, namedboundary-layer wind tunnels have been built and started to be used in wind engineeringsince the 1960’s. This tunnel type contains a long floor to generate a boundary layer(Fig. 1). In the boundary layer friction with ground retards the flow velocity and theflow is turbulent. The depth of the boundary layer increases with distance causing theneed of the long floor (see Fig. 1), and implying that the scale model of the actual testobject is relatively small. Furthermore, the standard boundary-layer technology includesthe so called proximity model, where the surrounding buildings and topography isprecisely modelled. The needed coverage of the proximity model is usually of order 10times the height of the building, which also constraints the geometric scale of the scalemodel. In leading tunnels worldwide, the typical geometric scale used for tall buildingtesting is 1:300…1:500.
Bases of the boundary-layer testing technique and its challenges have notsubstantially changed in a half-decade. A comprehensively catalogue of the techniqueand discussion can be found e.g. in [1]. Instrumentation and computing capabilities usedin testing have experienced a notable progress. This progress is basically related to anincreased precision and usable frequency band available for the wind-tunnelinstrumentation and to atmospheric wind anemometers. With improved techniques,smaller and smaller eddies of turbulence and rapid pressure fluctuations can bemeasured.
In the wind-tunnel testing procedure, multiple different testing techniques andtesting types are usually needed. These have been formed as a standard in tall buildingprojects, and include:− pedestrian level environmental wind study (wind mapping) for wind comfort and risk
issues− cladding pressure study with miniature pressure transducers named as pressure taps− dynamic base shear and moment extraction with HFFB (High Frequency Force
Balance) technique− vibration service-limit-state studies and equivalent static wind load analysis based on
HFFB results− in the case of vibration-problematic buildings, an aeroelastic testing.
A wind-tunnel procedure takes typically some months to be completed. Thus, initialassessment of structures is thereof based on analytical methods. A wind-tunnelprocedure can be used with or without site specific meteorological wind statistics. If sitespecific wind statistics are used for extreme events, one has to deal with the reliabilityof data in the prediction of wind speed extremes. Meteorological institutes are aware ofmean wind velocities and have computational routines to predict mean wind profiles inchanging topography roughness. The models for gust wind speeds, that forms thecodification bases of wind loads on structures, are not well established nor routinelyused. The boundary-layer wind-tunnel testing technique basically overcomes this issue,as it will be the turbulence generated by obstacles and topography closest to building

51
12
3
that determines the peak wind velocities. These are in turn precisely modelled with theproximity model. Several authorities internationally allow the usage of local windstatistics in structural design when, and only when, the wind-tunnel testing procedure isused. Basic wind velocities have a strong influence on the vibration response, asillustrated by Eq. (1). Therefore, at least the environmental and vibration service-limit-state studies are usually conducted by means of local wind records for reliable results.
Fig. 1. Principle of a boundary layer wind tunnel: schematic on the wind engineering tunnelowned by the Helsinki University of Technology, and sketch [4] of the development of wind
profiles over the wind tunnel floor.
Due to modern wind-tunnel testing, issues are invoked like how rapid fluctuationsand peaks need to be incorporated into the structural analysis. Another issue is how thewake buffeting due to other existing or future new tall buildings should be taken into
Wind tunnel floor with roughness elements
Test section hosting the scale model
Engine & fan
1
2
3
Wind tunnel floor with roughness elements
Test section hosting the scale model
Engine & fan
1
2
3

52
,PM d
VtdVt
=
,21; 2VqqCP p ρ==
,5.4*0V
at =
.)5.31( 0VIV u+=
account. In certain cases, this appears to double or treble the nominal accelerationresponse of the building. The acceleration will in-turn increase the equivalent staticwind load. Loosely speaking, in the past, the consensus of wind load criteria has beenbetter than today.
As the pressure load P for the surface of the body is defined as
(2)
where q = wind velocity pressure; Cp = pressure coefficient; and ρ = density of air, onefinds that peak actions could be addressed in three ways: modifying the peak windvelocity (gust) definition, modifying pressure coefficient (as function of loaded areasize) or doing the both. New wind design standards including EN 1-1-4:2005 [1] and BS6399-2:1997 [2] contain updated models for peak effects, which are strongly dependenton the size of loaded area. The aforementioned standard uses pressure coefficients asproportional to the size of the loaded area; and the latter mentioned standard a constantpressure coefficient with alteration of the gust definition time t* as
(3)
where a = diagonal length of the loaded area and V0 = mean wind velocity. This relationis approximate and empirical.
Regardless of the approach, the wind gust definition time should always beconsistent with the definition of the pressure coefficients. For example, EN 1-1-4:2005[2] gust wind velocity is implicitly defined by the peak factor of 3.5. This can be givenin the form
(4)
where Iu = longitudinal component of turbulence intensity. Eq. (4) appears to beconsistent with empirical models of [4] and yields about 1 s gust definition. The formerFinnish practise has been to use a constant ‘gust factor’ 1.5 (peak value divided by meanvalue) for 3 s gust definition, which appears to be an over-simplification in manypractical cases. In wind-tunnel studies, peaks are assessed via the fundamental timescaling
(5)
where the subscripts M and P refer to the wind-tunnel model and the prototype (realstructure), respectively. Considering e.g. the geometric scale dM / dP = 1:400 and a stormonset, 1 s. peak in full scale means about 0.005 s peak (= 200 Hz frequency band) inwind-tunnel tests. As electrical and acoustic noise issues generally get more problematicwith the increased measurement frequency band, the quality of instrumentation used inthe testing is an important issue in progress of understanding the peak effects. Here,

53
typical noise issue includes inducted voltages due to alternating electromagnetic fieldsdue to mains power lines and electronic devices nearby; including the wind tunnelengine. Due to the origin of this type of noise, it may disturb the measurements infrequencies around of order 50 Hz. True peaks of the measured quantity itself areslightly random, meaning that they could be defined in a probabilistic sense orconducting the test over sufficient long time to capture the maxima.
High-rise case study: SR-Bank Headquarters ‘Føniks’, Stavanger
SR-Bank’s new headquarters office building will be situated in Stavanger, Norway. Thebuilding, 100 m in height, is wind-exposed as situated in the open flat terrain and beingnotably taller than any other building in the area. Wind environment in Stavanger, interms of basic design wind velocity and number of breezy days, is one of the harshest inEurope.
The author conducted the wind-tunnel tests in 2008. The test setup has for the firsttime in Finland followed the testing specifications routinely used by international tallbuilding specialists. A general view of the setup is shown in Fig. 2. The geometric scaleused has been 1:400.
Fig 2. Overview of the test setup in testing of the SR-Bank Building.
An environmental wind study revealed that the tower boosts wind velocities atground level (as typical to wind-exposed tall buildings). Short duration gusts (1 s) in

54
storms could be dangerous at certain points, which lie in corner streams of the tower.Corner stream generally refers to flow that rounds the corner of a tall building and cancause high local pressures in its vicinity. The podium shape of the SR-Bank Building isfavourable as it guides streams onto the podium roof instead directly onto the courtyard.To improve wind comfort, the green plan (trees and hedges) are important and weretaken into account in testing. Due to harsh winds and possibly low temperatures inStavanger, it has been questionable to check any general-purpose windiness criteria.These criteria are dealt e.g. in [5]. Nevertheless, summer months could be separatedwhen atmospheric temperatures are modest, and people may expect to use balconies andcourtyards. The analysis gives the average duration of time when such activities areinconvenient due to windiness.
HFFB testing shows that in basic configuration, i.e. without other tall buildings inthe area, both EN 1991-1-4:2005 and wind-tunnel tests give along-wind responsereasonably close to each other. In HFFB testing, time histories of resultant forces andmoments are measured at the basement of the tower using a miniature 6-componentbalance. The test object is made of light-weight material to keep the fundamental naturalfrequency of the tower-balance system high, to allow reliable extraction of smallfluctuations of forces and moments at frequencies below it. Using the results withrandom vibration theory and normal-mode-summation of structural dynamics, it isfurther possible to assess acceleration response of the tower. This type of analysisrevealed that acceleration response of the building is actually bigger in across-winddirection than in along-wind direction. This is due to normal wind buffeting and istypical to tall buildings [1]. It should be remarked that the analytical model of EN 1991-1-4:2005 [2] is only applicable for the along-wind response, and that it is theacceleration response that fixes the lateral stiffening system of most tall buildings.Generally, allowable accelerations are of order 0.15…0.3 m/s2 in frequent storms (1…5y return period storms).
The HFFB-based analysis shows that if a new tall building will be built near (indistance about 200 m), the acceleration response could be doubled in the wind directionwhere the new building is at the upstream side. This is due to wake buffeting. The resultreproduces author’s findings with aeroleastic testing technique in another alike project[6].
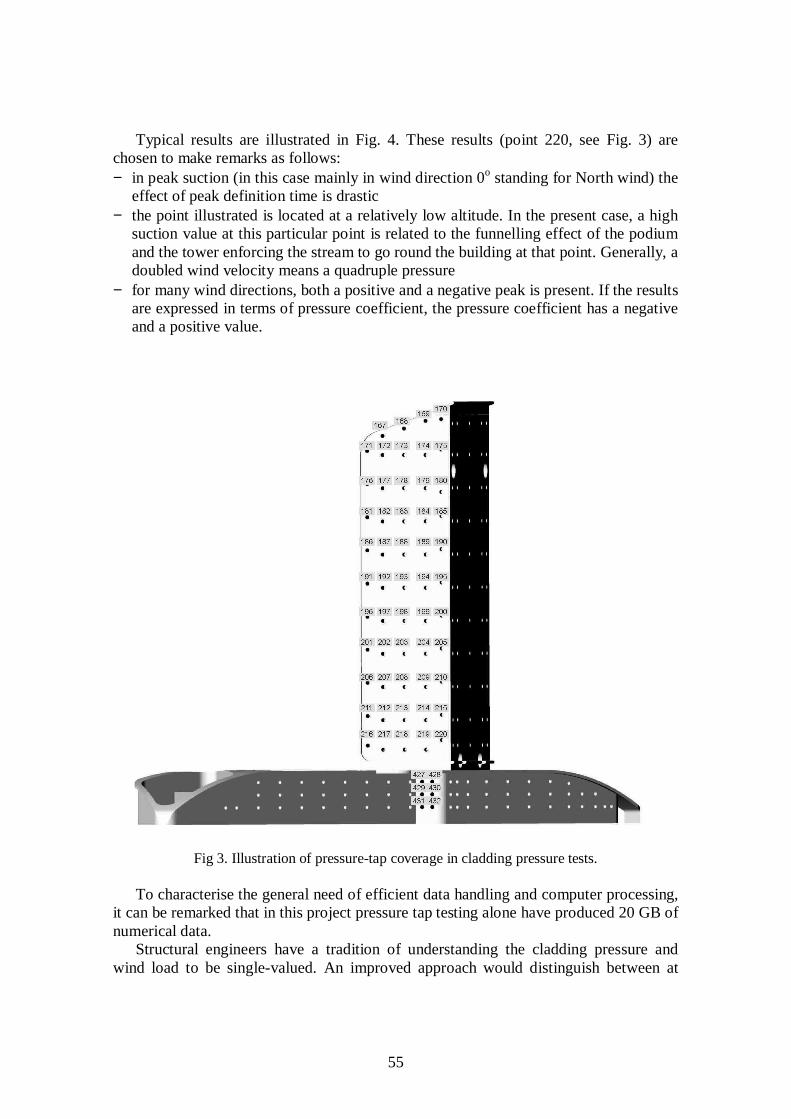
Pressure tap testing has been conducted with miniature pressure taps (1.4 mm indiameter). In this technique, taps (i.e. pressure transducers) are generally mounted eitherdirectly on the surface of the tests object, or the surface pressures are transmitted viapneumatic tubing onto the tap. The aforementioned method, known as flush mounting,has been used in the preset study as being more reliable in the sense that tubing will notcause erroneous attenuation at high frequencies. The used taps are gage-basedtransducers that measure both static and time-dependent pressures. Setup has been usedto measure the differential (net) pressure of a nominally sealed building, i.e. a buildingwhere façade openings are non-significant and are about uniformly distributed over thebuilding. Net pressure means here that the pressure difference between the outside andinside of the building is measured, i.e., the value is extracted that matters in structuraldesign of the cladding in analogue to structural design standards. Measurement pointsare spread over the podium, tower facades and the roof (Fig. 3).
55
Typical results are illustrated in Fig. 4. These results (point 220, see Fig. 3) arechosen to make remarks as follows:− in peak suction (in this case mainly in wind direction 0o standing for North wind) the
effect of peak definition time is drastic− the point illustrated is located at a relatively low altitude. In the present case, a high
suction value at this particular point is related to the funnelling effect of the podiumand the tower enforcing the stream to go round the building at that point. Generally, adoubled wind velocity means a quadruple pressure
− for many wind directions, both a positive and a negative peak is present. If the resultsare expressed in terms of pressure coefficient, the pressure coefficient has a negativeand a positive value.
Fig 3. Illustration of pressure-tap coverage in cladding pressure tests.
To characterise the general need of efficient data handling and computer processing,it can be remarked that in this project pressure tap testing alone have produced 20 GB ofnumerical data.
Structural engineers have a tradition of understanding the cladding pressure andwind load to be single-valued. An improved approach would distinguish between at

56
least three peak definitions: 1 s for design of small elements, 3 s for design of biggerelements and 10…20 s for comparing HFFB-based overall wind load. The peakdefinition time should always be indicated for glass manufacturers to design a propercladding. The risk level for glass fracture is a complex issue where the glass panels tendto bear more load when the load is applied at a short duration [1, 4]. Furthermore,fatigue and integrity-loss issues may exist in sealing and supports of panels.
a)
b)
Fig. 4. Typical pressure-tap test results at a high-suction location: a) 1 s peak definition and b) 3s peak definition.

57
Low-rise structure case study: Paddington Railway Station, London
Paddington Railway Station in London is an example of a low-rise structure in a cityterrain. The author conducted wind-tunnel testing in 2007 for assessing the windloading for the roof structure refurbishment study. The station is a Grade 1 listedstructure, meaning that any changes to the structures and appearance should beminimized. Furthermore, as the station is fully operational during the refurbishment, thestructural safety is especially important. The length of the studied roof section, knownas Span 4, is 213 m. It is supported by metallic arches having a span length of 33 m.
Wind-tunnel testing has been conducted by pressure tap technique using thegeometric scale 1:300. To account for possible wind relieving effects, the proximitymodel of the vicinity of the station has been faithfully reproduced (Fig. 5). The roof issurrounded by the buildings. Beside the station, Paddington Waterside redevelopmentproject is ongoing, meaning that several new buildings are being built near the station.Therefore, the test program included the present configuration and the study of theeffect of the planned new tall building nearest to the station. Some possiblerefurbishment schemes have also been studied, as there will be extra openings in theroof during the works.
Fig. 5. Pressure tap tests of the Paddington Railway Station Span 4 Roof.
Pressure taps have been flush mounted onto the surface of the roof. They are ofdifferential type to take into account internal and external pressures. Typical to low-risestructures, the differential pressures to be measured are relative small. To maximize the
58
signal-to-noise ratio, the tests have been conducted near the maximum flow speedavailable for the tunnel, around 30 m/s, and the electrical noise has been carefullyfiltered out.
As the study is related to structural loading, the design standard for the project BS6399-2:1997 [3] has been used as a reference. Especially, basic gust wind velocitieshave been taken from the standard as a function of the wind direction. In this kind ofapproach, the test can reveal funnelling effects, relieving effects, pressure coefficientsand special flow effects due to nearby wind-exposed tall objects.
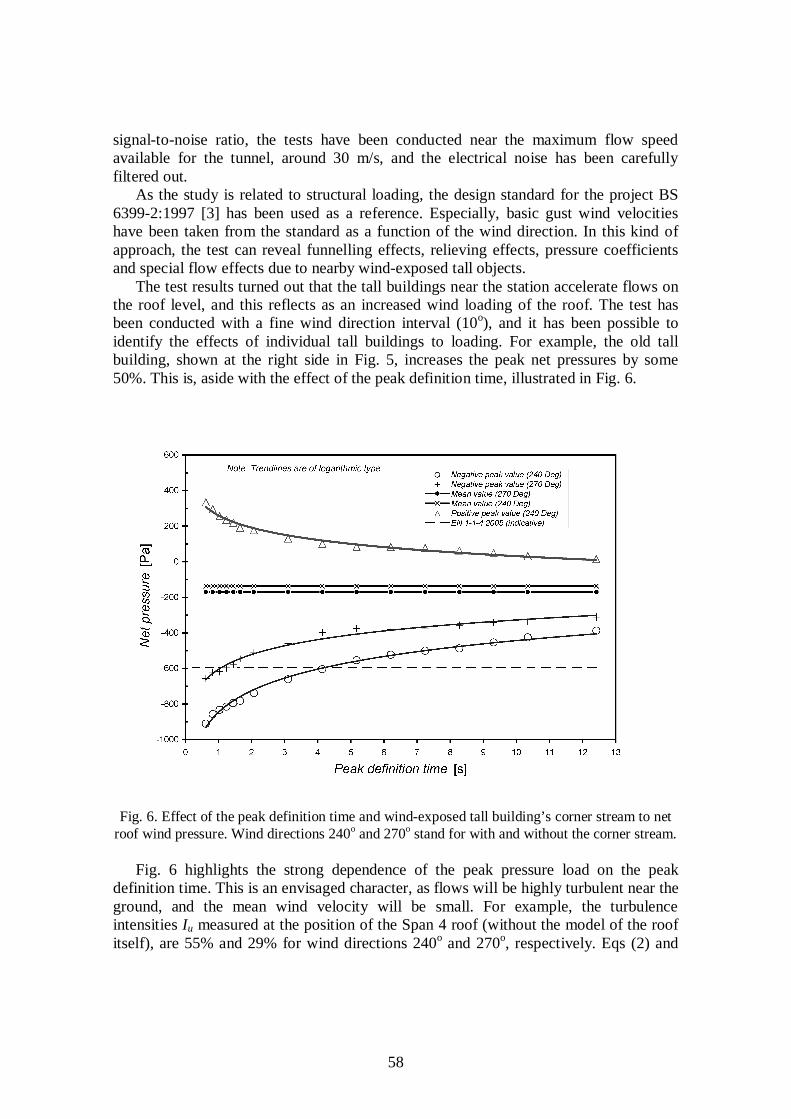
The test results turned out that the tall buildings near the station accelerate flows onthe roof level, and this reflects as an increased wind loading of the roof. The test hasbeen conducted with a fine wind direction interval (10o), and it has been possible toidentify the effects of individual tall buildings to loading. For example, the old tallbuilding, shown at the right side in Fig. 5, increases the peak net pressures by some50%. This is, aside with the effect of the peak definition time, illustrated in Fig. 6.
Fig. 6. Effect of the peak definition time and wind-exposed tall building’s corner stream to netroof wind pressure. Wind directions 240o and 270o stand for with and without the corner stream.
Fig. 6 highlights the strong dependence of the peak pressure load on the peakdefinition time. This is an envisaged character, as flows will be highly turbulent near theground, and the mean wind velocity will be small. For example, the turbulenceintensities Iu measured at the position of the Span 4 roof (without the model of the roofitself), are 55% and 29% for wind directions 240o and 270o, respectively. Eqs (2) and

59
(4) imply that close to ground the peak velocity pressure could be as high as 9 times themean velocity pressure.
A comparative study with EN 1-1-4:2005 [2] and BS 6399-2:1997 [3] suggested thatin this project the wind-tunnel testing does not yield a substantial ‘wind load reduction’due to the aforementioned tall building effects. Such a comparison is of courseindicative only, as the standards do not have pressure coefficients tabulated for the roofshape and as various assumptions could be adopted for the effective altitude of thestructures. In Fig. 6, the EN 1-1-4:2005 based result stands for roughly assuming a netpressure coefficient of 1.2.
Conclusions
− This paper deals with modern wind-tunnel-testing procedures and two case studies.The case studies are subjected to high-rise and low-rise structures in town terrain,and are conducted within actual structural engineering projects
− Referring partly to the case study results, the scope of this paper is to introduce theproblematic related to wind loading on buildings. With an improved knowledge ofwind actions and improved testing techniques, the wind-tunnel-testing procedure hasbecome as a standard in tall building design, and the new wind design codes are alsoaware of such a procedure
− in Finland, the question of the usage of the wind-tunnel-testing procedure forstructural analysis of buildings has not been topical unless recently, when plans ofbuildings of order 100 m in height are published. This range of buildings may havevariable stiffening systems and can, as their taller counterparts, suffer from anannoying wind-induced vibration. Furthermore, such buildings will be wind-exposed,increasing the windiness at ground level and wind load of nearby structures
− the boundary-layer wind-tunnel testing technique, as described in the present paper,is fundamentally an opposite approach compared to the common structuralengineering approach of using simplified assessment methods. Wind-tunnel testing isa research tool, which at the present state-of-the-art is necessary in assessment ofcertain types of structures.
Acknowledgements
The author expresses his thanks to the clients of the two case–study projects; Mr IanFrostick, Network Rail and Mr Hans Dale, Multiconsult AS; for allowing usage of theproject material.
References
[1] Tall building design criteria and loading, Vol. CL. Council of Tall Buildings &Urban Habitat, American Society of Civil Engineers, New York 1980, ChapterCL-3 pp. 145-248.

60
[2] EN 1991-1-4:2005 Eurocode 1: Actions on structures – Part 1-4 : General actions –Wind actions, p. 146.
[3] BS 6399-2:1997 British Standard: Loading for buildings – Part 2: Code forpractise for wind loads. BSI - British Standards Institute 2002, p. 124.
[4] E. Simiu & R. H. Scanlan, Wind effects on structures: Fundamentals andapplication to design, 3rd Edit., John Wiley & Sons, NewYork 1996, 688 p.
[5] R. Kiviluoma & M. Kaijansinkko, Method for mapping wind chill temperatureindex for city planning. Proc. of the 8th International Symposium on Cold RegionDevelopment ISCORD 2007, Tampere, Finland September 25-27, 2007 pp.79…80; full paper on CD 6 p.
[6] R. Kiviluoma, Aeroelastic wind-tunnel testing technique revisited. Proceedings,CTBUH 2005, 7th World Congress: Renewing the Urban Landscape, 16-19October 2005, New York City. Council on Tall Buildings & Urban Habitat, pp.1...9 on CD.
Risto KiviluomaWSP Finland LtdHeikkiläntie 7, 00210 [email protected]


![A novel formulation for determining joint constraint loads during … · 2008. 4. 3. · the optimization-based motion planning method [19]. The determination of constraint loads](https://img.dokumen.tips/doc/110x75/606f3391fd63ce266f596c65/a-novel-formulation-for-determining-joint-constraint-loads-during-2008-4-3.jpg)