Embed Size (px)
Citation preview

Probability TheoryPertemuan 4
Matakuliah : F0892 - Analisis KuantitatifTahun : 2009

Statistic Descriptive 3
Chapter 5. A Survey Of Probability Concepts
Statistic Descriptive 4
What Is A Probability?• The weather forecaster announces that there is a
70 percent chance of rain for Super Bowl Sunday.
• Probability: A value between zero and one, inclusive,
describing the relative possibility (chance or likelihood) an event will occur.

Statistic Descriptive 5
What Is A Probability? (continued)
• The probability of 1 represents something that is certain to happen.
• The probability of 0 represents something that cannot happen.
Statistic Descriptive 6
What Is A Probability? (continued)• Three key words to study probability:
1. Experiment. A process that leads to occurrence of one and only one of several possible observations. 2. Outcome. A particular result of an experiment. 3. Event. A collection of one or more outcomes of an experiment.

Statistic Descriptive 7
ExampleExperiment: Roll a die
All possible outcome: 1, 2, 3, 4, 5, 6,
Some possible outcome: - Observe an even number.- Observe a number greater than 4.- Observe a number 3 or less.
Statistic Descriptive 8
Approach To Assigning Probabilities
• Two approach: 1. Objective probability. 2. Subjective probability.

Statistic Descriptive 9
Approach To Assigning Probabilities (continued)
Objective probability is subdivided into:1. Classical probability.2. Empirical probability.

Statistic Descriptive 10
Approach To Assigning Probabilities (continued)
Classical probability:- assumption: the outcomes of an experiment are equally likely.
- Equation 5-1 Page 142. Classical Probability Probability of an event = (Number of favorable
outcomes) / (Total number of possible outcome)

Statistic Descriptive 11
ExampleConsider an experiment of rolling a six sided die. What is the
probability of the event “an even number of spots appear face up”?
The possible outcome- A one spot- A two spot- A three spot- A four spot- A five spot- A six spot

Statistic Descriptive 12
ExampleThere are three favorable outcomes:- A two- A four- A six
Probability of an even number:3 / 6 = 0.5
Statistic Descriptive 13
Approach To Assigning Probabilities (continued)
Empirical probability:- The probability of an event happening is the fraction of the time similar events happened in the past.

Statistic Descriptive 14
ExampleOn February 1, 2003, the space shuttle Columbia exploded. This was the second disaster in 113 space missions for NASA. On the basis of this information, what is the probability that a future mission is successfully completed?
A = a future mission is successfully completedProbability of a successful flight:(number of successful flight) / (total number of flight)
P(A) = 111 / 113 = 0.98
Statistic Descriptive 15
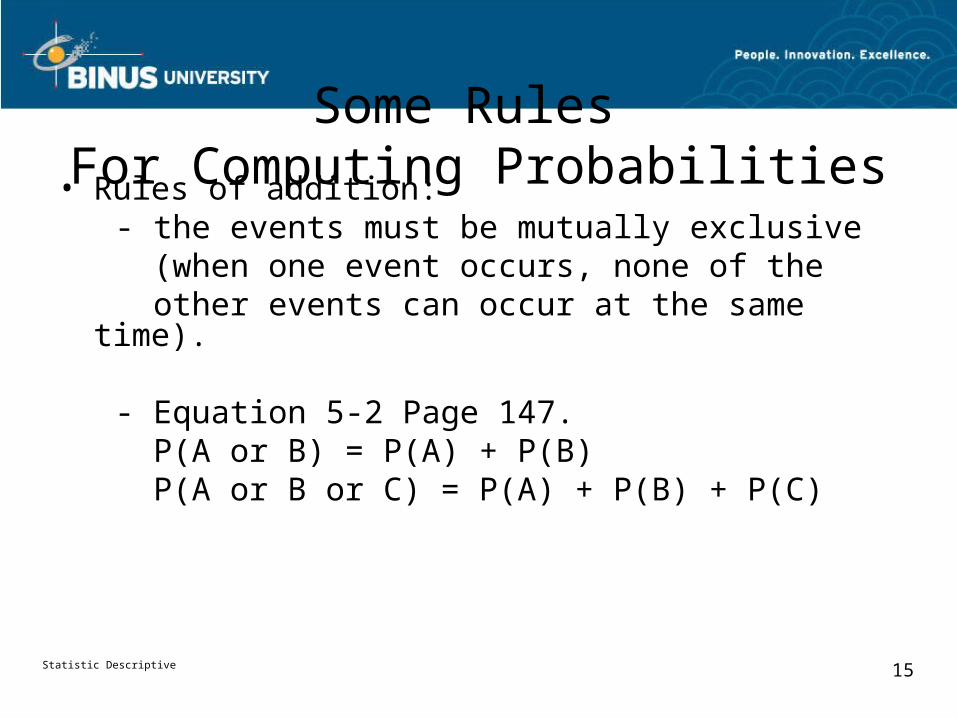
Some Rules For Computing Probabilities• Rules of addition:
- the events must be mutually exclusive (when one event occurs, none of the other events can occur at the same time).
- Equation 5-2 Page 147. P(A or B) = P(A) + P(B) P(A or B or C) = P(A) + P(B) + P(C)

Statistic Descriptive 16
Some Rules For Computing ProbabilitiesExample Page 147 and 148.
An automatic Shaw machine fills plastic bags with a mixture of beans, broccoli, and other vegetables. Most of the bags contain the correct weight, but because of the variation in the size of the beans and other vegetables, a package might be underweight or overweight. A check of 4000 packages filled in the past month revealed.

Statistic Descriptive 17
Weight Event Number Of Packages
Probability Of Occurrence
Underweight A 100 0.025 100/4000
Satisfactory B 3600 0.9 3600/4000
Overweight C 300 0.075 300/4000
TOTAL 4000 1.00

Statistic Descriptive 18
* What is the probability that a particular package will be either underweight or overweight?
P (A or C) = P(A) + P(C) = 0.025 + 0.075 = 0.10
Statistic Descriptive 19
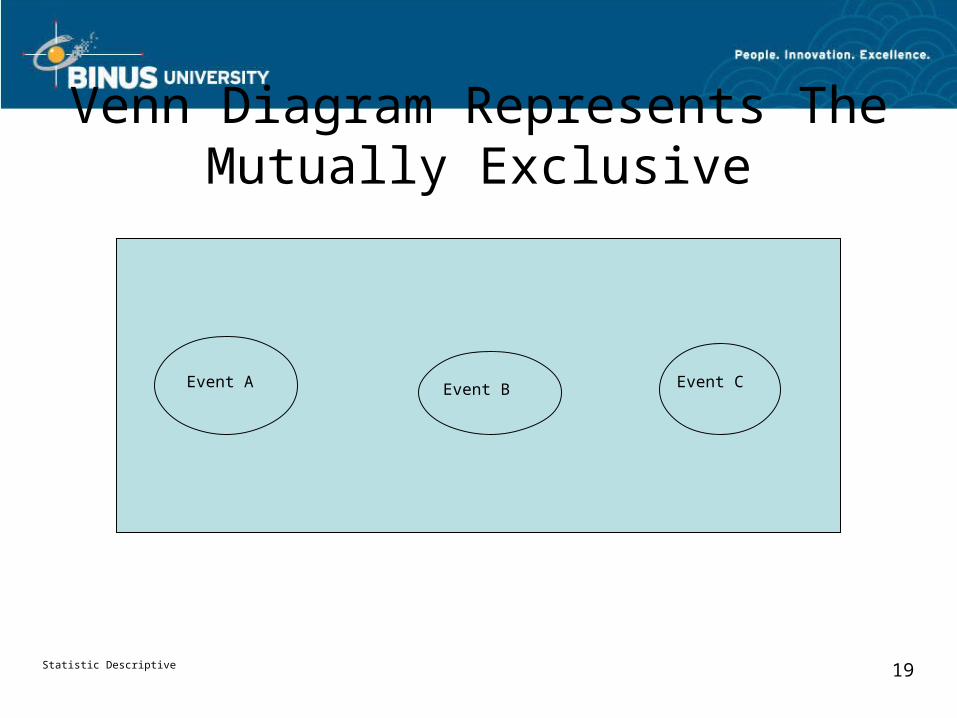
Venn Diagram Represents The Mutually Exclusive
Event A Event B Event C
Statistic Descriptive 20
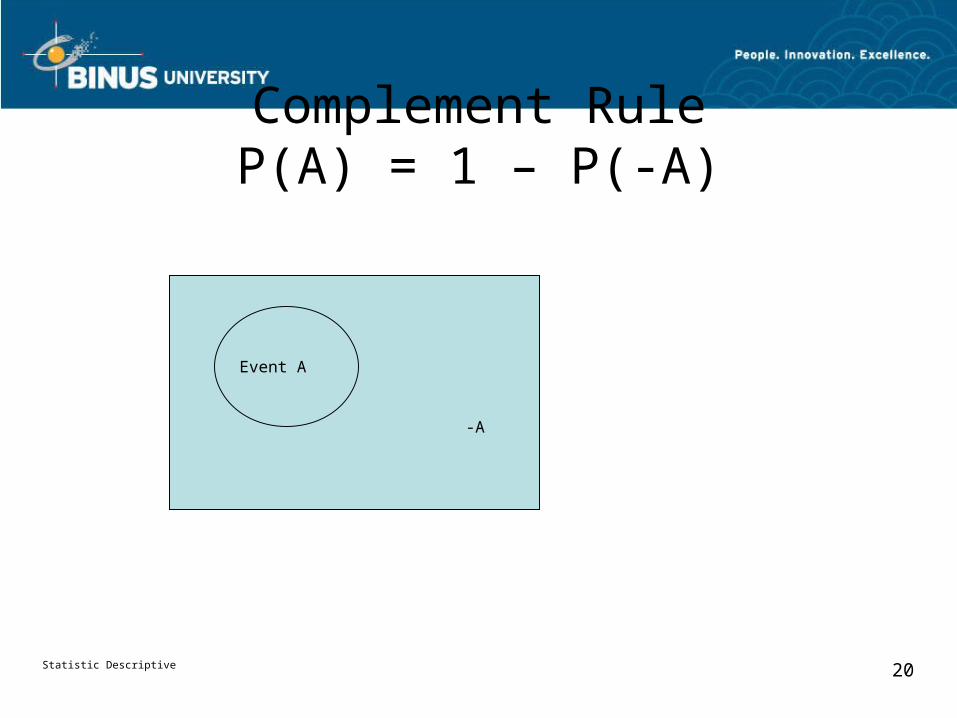
Complement RuleP(A) = 1 – P(-A)
Event A
-A
Statistic Descriptive 21
Some Rules For Computing Probabilities (continued)
• Joint probability (not mutually exclusive): - A probability that measures the likelihood two or more events will happen concurrently.
P(A or B) = P(A) + P(B) – P(A and B)

Statistic Descriptive 22
ExampleWhat is the probability that a card chosen at from a standard deck of cards will be either a king or heart?
A deck of card is 52 cardsA king, there are 4 cards (A)A heart, there are 13 cards (B)
King…………………...P(A): 4/52Heart……….…………P(B): 13/52King of Heart…………P(A and B): 1/52

Statistic Descriptive 23
Example (continued)P(A or B) = P(A) + P(B) – P(A and B) = 4/52 + 13/52 - 1/52 = 16/52
Figure Page 151

Statistic Descriptive 24
Some Rules For Computing Probabilities (continued)
• Special rule of multiplication (independence): - Two events A and B are independent. - Two events are independent if the occurrence of one event does not alter the probability of the occurrence of the other event. P(A and B) = P(A) P(B) P(A and B and C)= P(A) P(B) P(C)

Statistic Descriptive 25
ExampleA survey by the American Automobile Association (AAA) revealed 60 percent of its members made airline reservations last year. Two members are selected at random. What is the probability both made airline reservations last year?
Statistic Descriptive 26
Example (continued)R1 = the first member made an airline reservation last yearR2 = the second member made an airline reservation last yearAssuming R1 and R2 are independent
P(R1) = 0.6P(R2) = 0.6P(R1 and R2) = P(R1) P(R2) = (0.6) (0.6) = 0.36

Statistic Descriptive 27
Some Rules For Computing Probabilities (continued)
• General rule of multiplication (not independent): - Two events are not independent, they are referred to as dependent. - Conditional probability, the probability of a particular event occurring, given that another event has occurred. P(A and B) = P(A) P(B I A)

Statistic Descriptive 28
ExampleA golfer has 12 golf shirts in his closed. Suppose 9 of these shirts are white and the others are blue. He gets dressed in the dark, so he just grabs a shirt and puts it on. He plays golf two days in a row and does not do laundry. What is the likelihood both shirts selected are white?

Statistic Descriptive 29
Example (continued)W1 = the event that the first selected is whiteP(W1) = 9/12
W2 = the event that the second selected is whiteP(W2 I W1) = the conditional probability

Statistic Descriptive 30
Contingency Tables• Contingency tables A table used to classify sample observations
according to two or more identifiable characteristics.
Example Page 156. Example P

Statistic Descriptive 31
Tree Diagrams• A graph that is helpful in organizing calculations
that involve several stages.
• Each segment in the tree is one stage of problem.
• The branches of a tree diagram are weighted by probabilities.
Statistic Descriptive 32
Tree Diagrams (continued)• Example: Table 5-1 Page 157 (Lind) Chart 5-2 Page 159 (Lind)

Statistic Descriptive 33
Principles Of Counting• The Multiplication Formula: if there are “m” ways doing one thing and “n”
ways of doing another thing, there are “m x n” ways of doing both.
Equation 5-8 Page 165 (Lind)
Example: Page 165 and 166 (Lind)

Statistic Descriptive 34
Principles Of Counting (continued)• The Permutation Formula: any arrangement of r objects selected from a single group of n possible objects. The order is very important.
Equation 5-9 Page 167 (Lind).
Example: Page 167 (Lind)

Statistic Descriptive 35
Principles Of Counting (continued)• The Combination Formula: the number of r object combinations from a set of
n objects. Order of the selected is not important.
Equation 5-10 Page 168 (Lind).
Example: Page 168 (Lind)