Embed Size (px)
Citation preview

© 2
011
Car
negi
e Le
arni
ng
907
Probability of Compound Events
17.1 Is It Better to Guess?Using Models for Probability ...................................... 909
17.2 Three Girls and No Boys?Creating and Using Probability Models ........................ 917
17.3 Pet Shop ProbabilityDetermining Compound Probability .............................927
17.4 What Type of Blood Do You Have?Simulating Probability of Compound Events ................939
Many board games use round
spinners, number cubes, and numbered balls to
drive game play. The size of the wedges on a spinner and
the number on each ball determines the likelihood of
a favorable result--and sometimes the likelihood
of unfavorable results!

908 • Chapter 17 Probability of Compound Events
© 2
011
Car
negi
e Le
arni
ng

© 2
011
Car
negi
e Le
arni
ng
17.1 Using Models for Probability • 909
Have you ever encountered a test question, and you didn’t know the answer?
What did you do? Well, if the question was a multiple-choice question, did you
guess which answer was correct?
While it is not always best to guess at the correct answer, there are some
strategies to try to determine which answer choice is correct. One strategy is to
try and determine the answer choices that are not realistic. For example, on a
math test, if you are adding two positive integers, and one of the answer choices
is a sum that is a negative integer, there is no possible way for that answer
selection to be correct. So, you could eliminate that answer choice.
So, what strategies do you use when taking a test? Do you think it is better to
guess the answer to a question if you don’t know the answer?
Key Terms probability model
uniform probability model
non-uniform probability model
Learning GoalsIn this lesson, you will:
Determine the probability model for
an experiment.
Construct and interpret a uniform
probability model.
Construct and interpret a non-uniform
probability model.
Is It Better to Guess?Using Models for Probability

910 • Chapter 17 Probability of Compound Events
© 2
011
Car
negi
e Le
arni
ng
Problem 1 Using Probability Models
Previously, you conducted trials for a simulation concerning guessing correct answers for
multiple-choice questions on a test. You will continue to explore the probability of
guessing on tests.
Jorge and Tristan are discussing the likelihood of correctly guessing the answer to a
multiple-choice question on a test if there were five choices for the answer choices instead
of four. They both assume that they have no idea what the correct answer is. They also
assume that each multiple-choice question has five possible answers: A, B, C, D, and E.
1. List the sample space for answering the multiple-choice question.
2. What is the theoretical probability if the correct answer is:
A? B?
C? D?
E?
When solving a probability problem, it is helpful to construct a probability model.
A probabilitymodel is a list of each possible outcome along with its probability.
Previously, when you listed all the outcomes of an event or completed a
number array to show all outcomes of an event, you were using
a probability model. Probability models are often shown in a
table. The probability model for guessing the answer to a
multiple-choice question on a test is shown.
Outcome A B C D E
Probability 0.2 0.2 0.2 0.2 0.2
3. What is the sum of the probabilities in the probability model?
As with the sum or probabilities, a probability model will list all the
outcomes which will be greater than 0, but less than 1. The sum of
all the probabilities for the outcomes will always be 1.
4. Why is the sum of the probabilities in a probability model always 1?
Do you think a probability model
represents experimental probability or theoretical
probability?

© 2
011
Car
negi
e Le
arni
ng
17.1 Using Models for Probability • 911
5. Tristan claims, “The model is also complete because the probabilities for all outcomes
are equivalent to each other.” Jorge disagrees and says, “The sum of all the
probabilities is 1, but that does not mean the probability of each outcome is always
equivalent to the other outcomes.” Who is correct? Explain your reasoning.
A uniformprobabilitymodeloccurs when all the probabilities in a probability model are
equally likely to occur. Assuming you do not know the answer to a five-choice multiple-
choice question, each answer choice has the same probability of being correct. When all
probabilities in a probability model are not equivalent to each other, it is called a non-
uniformprobabilitymodel. An example would be a weather forecast that states there is a
30 percent chance of rain. That means there is a 70 percent chance of not raining. The
sum of these two probabilities is 1, but the outcomes do not have the same probability.
6. Suppose the correct answer to the multiple-choice question is C. Simulate answering
the multiple-choice question by randomly selecting an answer choice 10 times. Write
each answer choice on a piece of paper. Make sure all the pieces of paper are the
same size. Record the number of times you draw the letter C which represents
answering the question correctly.
7. Record your results and your classmates’ results for the number of times the question
was correctly answered on a dot plot.
0 1 2 3 4 5 6 7 8
Results of Guessing the Correct Answers9 10
Chapter-Chapter-Chapter-
8. According to the probability model, how many times should the correct answer have
been guessed? Explain how you know.

912 • Chapter 17 Probability of Compound Events
© 2
011
Car
negi
e Le
arni
ng
9. Carla says that the probability model is incorrect since everyone in the class did not
end up with 2 correct guesses as shown on the dot plot. Explain to Carla why the
probability model is correct.
Problem 2 Constructing and Interpreting Probability Models
1. Construct a probability model for each situation. Explain how you constructed
the model. Then, determine whether or not the probability model is a uniform
probability model.
a. roll an 8-sided number polyhedron
Outcome
Probability
b. choose a marble from a bag of marbles containing
1 green marble, 2 red marbles, and 7 blue marbles
Outcome
Probability
An eight-sided polyhedron is like a
six-sided number cube, but instead it has 8 sides.
Do you think each side has the same probability
as the other sides?

© 2
011
Car
negi
e Le
arni
ng
17.1 Using Models for Probability • 913
c. Randomly select a member of the Chess Club whose members are Samuel,
Martha, Carol, Jon, Sally, Ronaldo, and Simon:
Outcome
Probability
d. Randomly select a male member of the Chess Club whose members are Samuel,
Martha, Carol, Joanne, Sally, Ronaldo, and Simon:
Outcome
Probability

914 • Chapter 17 Probability of Compound Events
© 2
011
Car
negi
e Le
arni
ng
2. Use the probability model to calculate the probabilities:
Outcome 2 3 4 5 6 7
Probability 1 ___ 12
3 ___ 12
1 ___ 12
5 ___ 12
1 ___ 12
1 ___ 12
a. P(3) 5
b. P(8) 5
c. P(number less than 8) 5
d. P(prime number) 5
e. P(even number) 5

© 2
011
Car
negi
e Le
arni
ng
17.1 Using Models for Probability • 915
Problem 3 What’s in a Name?
1.The table shows how many students in Mr. York’s homeroom have first names
beginning with the letters listed.
Letter Number of students
A 7
B 4
M 5
S 12
O 2
How many students are in Mr. York’s homeroom?
2. Create a probability model for randomly selecting a student from
Mr. York’s homeroom.

916 • Chapter 17 Probability of Compound Events
© 2
011
Car
negi
e Le
arni
ng
3. What is the probability of randomly choosing a student with a first name that begins
with a vowel?
4. What is the probability of randomly choosing a student with a first name that does not
begin with S?
5. What is the probability of randomly choosing a student with a first name that begins
with C?
Talk the Talk
1. Do you think that you can use a probability model for both theoretical and
experimental probability? Explain your reasoning.
2. What is the difference between a uniform probability model and a non-uniform
probability model?
3. Will the sum of all the probabilities of the outcomes of an event be equal to 1 for both
uniform and non-uniform probability models?
Be prepared to share your solutions and methods.

© 2
011
Car
negi
e Le
arni
ng
17.2 Creating and Using Probability Models • 917
Do you think that there are the same number of girls and boys born each year?
If you said yes, your answer would appear to make sense. Since there are really
two choices of what a baby will be when he or she is born, there should be the
same number of boys and girls born each year. However, that has not been the
case in the United States. In fact, between 2000 and 2006, there have been
765,000 more baby boys born than baby girls. Do you think this trend might
continue? Do you think this trend also occurs in other countries?
Key Terms tree diagram
complementary events
Learning GoalsIn this lesson, you will:
Determine the probability model for an experiment.
Construct and interpret a non-uniform probability
model.
Three Girls and No Boys?Creating and Using Probability Models

918 • Chapter 17 Probability of Compound Events
© 2
011
Car
negi
e Le
arni
ng
Problem 1 Constructing Probability Models
What is the probability that if a family has 3 children, those 3 children are girls?
Remember, the theoretical probability of a girl being born versus a boy being born is 1 : 2.
Let’s simulate the event of a family with 3 children having 3 girls.
1. What would be an appropriate model to simulate the probability of a family
having one girl?
We will use 3 coin flips to simulate the event of a family having 3 girls. Let heads represent
a girl, and tails represent a boy.
A trial will consist of tossing a coin 3 times and counting the number of heads. Work with a
partner—one person will toss the coin 3 times, and the other will record the results.
2. Conduct 25 trials of the simulation. Record the results in the table shown.
TrialNumber of
HeadsTrial
Number of Heads
TrialNumber of
Heads
1 10 19
2 11 20
3 12 21
4 13 22
5 14 23
6 15 24
7 16 25
8 17
9 18

© 2
011
Car
negi
e Le
arni
ng
17.2 Creating and Using Probability Models • 919
3. What are all the possible outcomes for the number of girls among 3 children?
4. Use the results from your simulation to construct a probability model.
Outcome 0 girls 1 girl 2 girls 3 girls
Probability
5. What is the experimental probability that a family with 3 children has 3 girls according
to your probability model?
In the above simulation your probability model is based on experimental probabilities. In
some cases this is the only method of constructing a probability model. For example, you
previously determined the experimental probabilities of a cup landing on its top, bottom,
or side when it is tossed. It would be difficult or impossible to determine the theoretical
probabilities for the cup toss. However, it is possible to determine the theoretical
probability for a family with 3 children having 3 girls.
One method of determining the theoretical probability for a family having 3 girls is to list all
of the possible outcomes for a family having 3 children, and then determining how many
of those outcomes include 3 girls.
6. Karyl says,“I think that the probability of a family having 3 girls is 1 out of 3 because
there is only one outcome that has all three children being girls. There are only two
other outcomes.”Germaine says, “I don’t think that’s correct. I think the probability is
much lower.” Who’s correct? Explain your reasoning.

920 • Chapter 17 Probability of Compound Events
© 2
011
Car
negi
e Le
arni
ng
7. List all of the possible outcomes for having 3 children using G to represent girls, and
B to represent boys.
8. What does the outcome BGG represent?
9. Complete the probability model using all the possible outcomes.
Outcome 0 girls 1 girl 2 girls 3 girls
Probability
10. What is the theoretical probability that a family having 3 children has 3 girls?
Another method of determining the theoretical probability of an event is to construct a tree
diagram. A treediagramis a tree-shaped diagram that illustrates the possible outcomes
of a given situation.
Examine the tree diagram showing all of the possible outcomes for a family having
3 children.
1st child Boy Girl
2nd child Boy Girl Boy Girl
3rd child Boy Girl Boy Girl Boy Girl Boy Girl
To determine each possible outcome from a tree diagram, you need to start with the
first row of the tree diagram. Generally, this will be the top row, or the left-most row if
the tree diagram is horizontal. Then, you need to move down each branch until you
get to the final row.
For example, the first outcome listed would start with boy as the first child, then move
down the branch to the second child which is a boy, and finally moving down the branch
to the final row to the third child which is also a boy. So, this outcome would be BBB.

© 2
011
Car
negi
e Le
arni
ng
17.2 Creating and Using Probability Models • 921
11. Explain the meaning of each entry in the “2nd child” row in each tree diagram.
12. Explain the meaning of each entry in the “3rd child” row:
13. How does the tree diagram compare to the list you made for Question 7?

922 • Chapter 17 Probability of Compound Events
© 2
011
Car
negi
e Le
arni
ng
14. Circle the outcome(s) of a family having three children that are all girls on the tree
diagrams shown.
1st child Boy Girl
2nd child Boy Girl Boy Girl
3rd child Boy Girl Boy Girl Boy Girl Boy Girl
15. Circle the outcome(s) of a family having three children in which two of the children are
girls in the tree diagrams shown.
1st child Boy Girl
2nd child Boy Girl Boy Girl
3rd child Boy Girl Boy Girl Boy Girl Boy Girl
16. Circle the outcome BBG in the tree diagrams shown.
1st child Boy Girl
2nd child Boy Girl Boy Girl
3rd child Boy Girl Boy Girl Boy Girl Boy Girl
17. Complete the probability model shown with the information from the tree diagrams.
Outcome 0 girls 1 girl 2 girls 3 girls
Probability
18. Is there a difference in the theoretical probability of each outcome between the list of
outcomes you wrote and the tree diagrams you analyzed?

© 2
011
Car
negi
e Le
arni
ng
Problem 2 Give It A Spin—Actually Two Spins!
The 5-sided spinner is spun twice and a product is calculated.
12
3 4
5
1. Use a tree diagram to determine all the possible outcomes. Then, list the product at
the end of each branch of the tree.
17.2 Creating and Using Probability Models • 923

924 • Chapter 17 Probability of Compound Events
© 2
011
Car
negi
e Le
arni
ng
2. Construct a probability model for spinning the spinner twice and recording
the product.
Product 1 2 3 4 5 6 8
Probability
Product 9 10 12 15 16 20 25
Probability
3. Use the probability models you created to calculate the probability for each
event shown.
a. P(product is 6)
b. P(product of 16)
c. P(product is less than 10)
d. P(product is a multiple of 5)
e. P(product is not a multiple of 5)
The events of the product being a multiple of 5 and the product not being a multiple of
5 are called complementary events. Complementaryeventsare events that consist of the
desired outcomes, and the remaining events that consist of all the undesired outcomes.
Together, they include every possible outcome in the sample space.

© 2
011
Car
negi
e Le
arni
ng
17.2 Creating and Using Probability Models • 925
4. Betina says that the product being less than 10 and the product being more
than 10 are complementary events. Davika disagrees. Who is correct?
Explain your reasoning.
5. What event would be complementary to the event that the product is an even number?
6. Determine P(product is an even number) and P(product is an odd number).
7. What is the sum of the probabilities of two complementary events? Explain why your
answer makes sense.

926 • Chapter 17 Probability of Compound Events
© 2
011
Car
negi
e Le
arni
ng
Talk the Talk
1. Complete a tree diagram for all possible outcomes for correctly guessing the
answers to a 3-question true-false quiz.
1st question
2nd question
3rd question
2. Complete a probability model for the tree diagram you completed in Question 1.
Outcome 3 correct 2 correct 1 correct 0 correct
Probability
3. Calculate the probabilities:
a. P(all 3 questions correct) 5
b. P(1 or 2 questions correct) 5
c. P(0 questions are correct) 5
Be prepared to share your solutions and methods.

© 2
011
Car
negi
e Le
arni
ng
17.3 Determining Compound Probability • 927
Key Term compound event
Learning GoalIn this lesson, you will:
Use probability models to calculate compound probabilities.
Pet Shop ProbabilityDetermining Compound Probability
Have you ever heard the saying “Cats rule and dogs drool”? Or the saying
“Dogs are a human’s best friend”? It seems that people have been debating this
question forever. It has even caused people to classify themselves as “cat people”
or “dog people.” The fact of the matter is that both animals are extremely popular
and have been the center of many television shows. One show even tried to
compare the good qualities of each animal to prove which animal was the better
pet. In the end, the television program showed that dogs were just a little more
popular. Do you have a cat or dog as a pet? Are you a cat person or a dog person?

928 • Chapter 17 Probability of Compound Events
© 2
011
Car
negi
e Le
arni
ng
Problem 1 I Want a Pet—But Which Type of Pet Do I Want?
Garden Plain Pet Shop has the following animals available for purchase. You will complete
a probability model and use it to determine the probability that the next pet chosen is a
dog or a cat.
Pets Number Available
cat 4
dog 7
snake 1
rabbit 3
bird 5
1. How many pets are available for purchase?
2. Complete the probability model for purchasing a pet from Garden Plain Pet Shop.
Outcome Cat Dog Snake Rabbit Rabbit
Probability
3. Is the model a uniform or a non-uniform probability model? Explain your reasoning.
4. What is the probability the next pet purchased is:
a. a dog? b. a snake? c. a cat?

© 2
011
Car
negi
e Le
arni
ng
17.3 Determining Compound Probability • 929
5. What is the probability that the next pet purchased is a dog or a cat?
a. How many of the pets are dogs or cats?
b. How many total pets are there?
c. What is the probability the next pet purchased is a dog or a cat?
Examples of students’ methods in the Garden Plain math class to solve the Question 5
are shown.
TenishaI added the number of cats
and dogs and got a total
of 11. 4 + 7 = 11
That’s 11 pets out of 20.
desired ________ total
= 11 ___ 20
Jermaine
Don’t want 9 out of 20.
So what’s left is 11 out of 20.
DREW CATS 4 ___
20
DOGS 7 ____ + 20
11 ___ 20
Denise
2 _ 5
Cats and dogs
That’s 2 animals listed out of 5
Mark
Probabilityofacat4___20
=1__5
Probabilityofadog7___20
1__5+
7___20
=8___25

© 2
011
Car
negi
e Le
arni
ng
930 • Chapter 17 Probability of Compound Events
6. Analyze each student’s responses to the question.
a. Describe the correct strategy Jermaine used.
b. Describe the strategy Drew used.
c. What is the difference between Tenisha’s work and Drew’s work?
d. Explain to both Denise and Mark why their methods are incorrect for determining
the probability the next pet purchased will be a cat or dog.

© 2
011
Car
negi
e Le
arni
ng
17.3 Determining Compound Probability • 931
A compoundevent combines two or more events, using the word “and” or the word “or.”
Determining the probability of a compound event with the word “and” is different from a
compound event with “or.”
The difference is that a compound event with the word “and” means that you are
determining the probability for one event.
When determining a compound event with “or,” you are determining the probability for
more than one event. This is because either one event can occur or the other event can
occur.
7. What is the probability the next pet purchased is a 4-legged animal?
a. What events make up “the next pet purchased being a 4-legged animal”?
b. How many event(s) are you determining the probability for? How do you know?
c. Rewrite Question 7 using the events you wrote in part (a).
d. Determine the probability the next pet purchased is a 4-legged animal. Show how
you determined your answer.

932 • Chapter 17 Probability of Compound Events
© 2
011
Car
negi
e Le
arni
ng
Problem 2 Is It A Match?
1. The cards shown were placed face down in two piles so that they could be randomly
chosen. If one card is randomly chosen from each pile, what is the probability of
randomly choosing a matching pair?
12
3 23 4 5
a. Determine the possible outcomes for randomly choosing one card from each pile.
Make sure you show your work by either creating an organized list or constructing
a tree diagram.
b. How many possible outcomes are there?
c. What events make up randomly choosing a matching pair?
d. Rewrite Question 1 using the events you wrote in part (c).
e. Determine the probability of randomly choosing a pair.

© 2
011
Car
negi
e Le
arni
ng
17.3 Determining Compound Probability • 933
2. Determine the probability of randomly choosing two cards that are a sum of 5.
Show your work.
3. The class is asked to determine the probability of randomly choosing 2 odd cards.
Lucy says,“The probability of drawing 2 odd cards is 3 out of 7 because there are
7 cards and 3 of them are odd.”Do you agree with Lucy’s statement? If not, explain to
Lucy where her reasoning is not correct.
4. Write a problem using the number cards for which Lucy’s answer would be correct:
5. What outcomes make up the event of choosing 2 odd cards given one card is
chosen from each pile?
6. Determine the probability of randomly choosing 2 odd cards.
7. Determine the probability of selecting one card from each pile where the first card is a
2 and the second card is odd.
a. List the event(s) for determining the probability.
b. List the outcome(s) for the event(s).
c. Determine the probability of selecting one card from each pile where the first card
is a 2 and the second card is odd.

© 2
011
Car
negi
e Le
arni
ng
934 • Chapter 17 Probability of Compound Events
8. Determine the probability that the first card is a 2 or
the second card is odd.
a. List the event(s) for determining the probability.
b. Determine the outcome(s) for the event(s).
c. How many outcomes are listed? Are any of the outcomes listed in
both events?
When there are two or more events in which you are determining the
probability, an outcome might occur for both events. When this occurs and
you are determining the number of outcomes, count the repeated outcome
only once.
d. How many different outcomes are there for the two events?
e. Determine the probability that the first card is a 2 or the second card is odd.
f. Why would we not count all the outcomes when calculating the probability?
9. Explain the difference between the events in Questions 7 and 8.
Remember to carefully read the event
being asked. There is a big difference between determining
a compound event with "and," and a compound event
with "or!"”

© 2
011
Car
negi
e Le
arni
ng
17.3 Determining Compound Probability • 935
Talk the Talk
You and a friend are playing a game in which you take turns rolling a 6-sided number
cube, and spinning a 4-number spinner.
You and your friend take turns.
● If your friend rolls an odd number and spins an even number, he or she wins.
● If you roll an even number and spin an odd number, you win.
1 2
4 3
1. List the possible outcomes for playing the game using a tree diagram.
2. Explain why the events of your friend winning or of you winning are compound events.
3. List the outcomes for the event of your friend winning the game.
4. What is the probability that your friend wins the game?

936 • Chapter 17 Probability of Compound Events
© 2
011
Car
negi
e Le
arni
ng
5. List the outcomes for the event of you winning the game.
6. What is the probability that you will win the game?
7. Do you and your friend have equally likely chances of winning the game?
Explain your reasoning.
8. List the outcomes for and determine the probability for each statement.
a. P(even number on the number cube and even number on the spinner)

© 2
011
Car
negi
e Le
arni
ng
17.3 Determining Compound Probability • 937
b. P(even number on the number cube or even number on the spinner)
Be prepared to share your solutions and methods.

938 • Chapter 17 Probability of Compound Events
© 2
011
Car
negi
e Le
arni
ng

© 2
011
Car
negi
e Le
arni
ng
17.4 Simulating Probability of Compound Events • 939
Learning GoalIn this lesson, you will:
Use simulations to estimate compound probabilities.
What Type of Blood Do You Have?Simulating Probability of Compound Events
Do you know that there are four major blood groups: A, B, O, and AB. Did you
know that the percent of people having each blood group differs by race and by
country? For example, in some countries nearly everyone has the same blood
group, and in other countries there are people who have each of the 4 blood
groups. In the United States, the percent of people having each blood group
differs by race and ethnicity. You may have noticed that there are often “blood
drives” sponsored by the American Red Cross. These drives encourage people to
donate blood that others can use if they are critically injured in accidents or
natural disasters, or have serious diseases.

940 • Chapter 17 Probability of Compound Events
© 2
011
Car
negi
e Le
arni
ng
Problem 1 Blood Groups
Overall, the percent of people in the U.S. having each blood group is given in the table.
The percents have been rounded to the nearest whole number percent.
Blood Groups A B O AB
Percent of Population 42% 10% 44% 4%
Suppose the Red Cross is having a blood drive at the Community Center.
1. What is the probability that the next person who enters the Community Center to
donate blood has group A blood?
2. What is the probability that the next person who enters the Community Center to
donate blood has group A or group O blood?
The first two questions involved events that the probability could be determined by using
basic knowledge of probability. However, many events involve more advanced rules of
probability. In most cases, though, a simulation can be used to model an event.

© 2
011
Car
negi
e Le
arni
ng
17.4 Simulating Probability of Compound Events • 941
3. Determine the probability that out of the next 5 people to donate blood, at least
1 person has group AB blood.
a. What could be a good model for simulating people who donate blood?
b. You will use a random number table, a random digit generator on a calculator, or
computer spreadsheet to model the problem. How could you assign numbers to
people to account for the different blood types?
c. Describe one trial of the simulation.
d. Conduct 20 trials of the simulation and record your results in the table.

942 • Chapter 17 Probability of Compound Events
© 2
011
Car
negi
e Le
arni
ng
Trial Number Numbers Count of Numbers from 96 through 99
1
2
3
4
5
6
7
8
9
10
11
12
13
14
15
16
17
18
19
20

© 2
011
Car
negi
e Le
arni
ng
17.4 Simulating Probability of Compound Events • 943
e. Out of the 20 trials, how many had at least 1 number from 96 through 99?
f. According to your simulation, what is the probability that out of the next 5 people
to donate blood, at least one of them has type AB blood?
4. How many people would be expected to donate blood before a person with group B
blood would donate blood?
a. Describe one trial of the simulation.
b. Conduct 20 trials of the simulation and record your results in the table.

944 • Chapter 17 Probability of Compound Events
© 2
011
Car
negi
e Le
arni
ng
Trial NumberNumber of 2-digit numbers chosen until a number
from 42 through 51 appears
1
2
3
4
5
6
7
8
9
10
11
12
13
14
15
16
17
18
19
20

© 2
011
Car
negi
e Le
arni
ng
17.4 Simulating Probability of Compound Events • 945
c. Calculate the average for your 20 trials.
d. About how many people would be expected to donate blood before a person
with group B blood enters?
Problem 2 Shoot Out
The star player on the basketball team typically makes 5 out of 6 free throws. There is a
foul and the player gets to shoot 3 free throws.
1. What might be a good model for simulating the player shooting free throws?
2. How could you assign the numbers on the cube to model the player shooting
free throws?
3. What is the probability that the player makes all 3 free throws?
a. Describe one trial of the simulation.
b. Conduct 20 trials of the simulation and record your results in the table.

946 • Chapter 17 Probability of Compound Events
© 2
011
Car
negi
e Le
arni
ng
Trial Number Number of times a 1 through 5 occurs
1
2
3
4
5
6
7
8
9
10
11
12
13
14
15
16
17
18
19
20

© 2
011
Car
negi
e Le
arni
ng
17.4 Simulating Probability of Compound Events • 947
c. Count the number of times that the result of all three numbers are
between 1 and 5.
d. According to your simulation, what is the probability the player makes all 3 free
throws?
4. Design and conduct a simulation to model the number of times the player would
shoot before missing a shot.
Be prepared to share your solutions and methods.

948 • Chapter 17 Probability of Compound Events
© 2
011
Car
negi
e Le
arni
ng

© 2
011
Car
negi
e Le
arni
ng
Chapter 17 Summary • 949
Key Terms probability model (17.1)
uniform probability
model (17.1)
Chapter 17 Summary
non-uniform probability
model (17.1)
tree diagram (17.2)
Constructing and Interpreting Probability Models
A probability model is a list of each possible outcome along with its probability. In a
probability model, the probability of each outcome is greater than 0, but less than 1. The
sum of the probabilities for all outcomes in a probability model will always be 1. When all
of the probabilities in a probability model are equivalent to each other, it is called a uniform
probability model. When all of the probabilities in a probability model are not equivalent, it
is called a non-uniform probability model.
Example
Marshon spins a spinner with four equal sections on it as shown.
A B
C D
complementary
events (17.2)
compound event (17.3)
Think you are not good at math?
As long as you work hard and have a good attitude you have a 100% chance
of success!

950 • Chapter 17 Probability of Compound Events
© 2
011
Car
negi
e Le
arni
ng
The sample space for the spin is S 5 {A, B, C, D}. The probability of the spinner landing
on one particular letter is 1 __ 4
or 0.25. The probability model for the situation is shown.
Outcome A B C D
Probability 0.25 0.25 0.25 0.25
The model is a uniform probability model because all of the probabilities in the model
are equivalent to each other. The probability of spinning an A is P(A) 5 0.25. To calculate
the probability of not spinning a D, determine the sum of the probabilities of the
other outcomes.
P(not D) 5 P(A) 1 P(B) 1 P(C)
5 0.25 1 0.25 1 0.25
5 0.75
The probability of not spinning a D is 0.75 out of 1.
Using Tree Diagrams to Determine Probabilities
One method of determining theoretical probability is to construct a tree diagram. A tree
diagram is a tree-shaped diagram that illustrates sequentially the possible outcomes of a
given situation. Complementary events are events that consist of the desired outcomes
and the remaining events that consist of all the undesired outcomes. Together, they
include every possible outcome in the sample space.
© 2
011
Car
negi
e Le
arni
ng
Chapter 17 Summary • 951
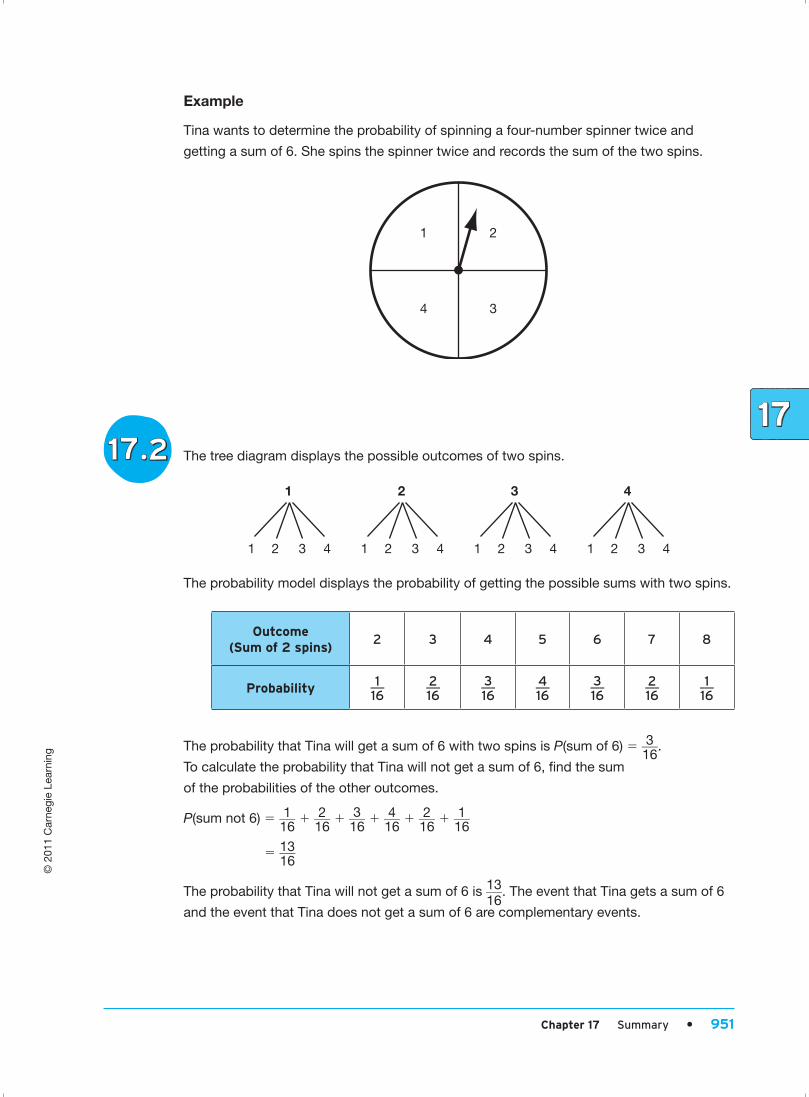
Example
Tina wants to determine the probability of spinning a four-number spinner twice and
getting a sum of 6. She spins the spinner twice and records the sum of the two spins.
1 2
4 3
The tree diagram displays the possible outcomes of two spins.
1
1
2 3 4 1
2
2 3 4 1
3
2 3 4 1
4
2 3 4
The probability model displays the probability of getting the possible sums with two spins.
Outcome (Sum of 2 spins)
2 3 4 5 6 7 8
Probability 1 ___ 16
2 ___ 16
3 ___ 16
4 ___ 16
3 ___ 16
2 ___ 16
1 ___ 16
The probability that Tina will get a sum of 6 with two spins is P(sum of 6) 5 3 ___ 16
.
To calculate the probability that Tina will not get a sum of 6, find the sum
of the probabilities of the other outcomes.
P(sum not 6) 5 1 ___ 16
1 2 ___ 16
1 3 ___ 16
1 4 ___ 16
1 2 ___ 16
1 1 ___ 16
5 13 ___ 16
The probability that Tina will not get a sum of 6 is 13 ___ 16
. The event that Tina gets a sum of 6
and the event that Tina does not get a sum of 6 are complementary events.

952 • Chapter 17 Probability of Compound Events
© 2
011
Car
negi
e Le
arni
ng
Calculating Compound Probabilities
A compound event combines two or more events using the word “and” or the word “or.”
Example
Raul flips a coin and randomly draws a card from the stack of letter cards shown. He
wants to determine the probability of flipping heads and drawing a vowel. He also wants
to determine the probability of flipping heads or drawing a vowel.
A C EDB
The ten possible outcomes are displayed in the tree diagram.
A B C D E
H
A B C D E
T
There are five outcomes that involve flipping heads, but only two of those outcomes
involve drawing a vowel. Therefore, the probability of flipping heads and drawing
a vowel is:
P(heads and vowel) 5 2 ___ 10
or 1 __ 5
To determine the probability of flipping heads or drawing a vowel, it is best to list the
possible outcomes of each event. The possible outcomes for flipping heads is (H, A),
(H, B), (H, C), (H, D), and (H, E). The possible outcomes for drawing a vowel is (H, A),
(H, E), (T, A), and (T, E). There are a total of nine outcomes listed for the two events, but
the outcomes (H, A) and (H, E) are listed in both events. Therefore, there are only seven
outcomes that involve flipping heads or drawing a vowel. So, the probability of flipping
heads or drawing a vowel is:
P(heads and vowel) 5 7 ___ 10

© 2
011
Car
negi
e Le
arni
ng
Chapter 17 Summary • 953
Using Simulations to Estimate Compound Probabilities
Many events involve very advanced rules for probability. In most cases, a simulation can
be used to model the event.
Example
The table displays the probability that Kara will knock down each number of pins with the
first ball thrown in any frame.
Number of Pins 10 9 8 7 6 5 4 3 2 1 0
Percentage of Attempts
65% 12% 8% 5% 3% 2% 1% 1% 1% 1% 1%
A simulation can be used to determine the experimental probability that Kara will throw
three consecutive strikes. A random number generator is used to generate a random
number from 00 to 99. The numbers from 00 to 64 are assigned to a strike. One trial
consists of choosing 3 random two-digit numbers and counting how many of the
two-digit numbers are from 00 to 64. The results of 20 trials are displayed in the table.
Trial Number
Count of Numbers 00 through 64
Trial Number
Count of Numbers 00 through 64
1 2 11 3
2 3 12 2
3 2 13 1
4 1 14 2
5 3 15 2
6 2 16 1
7 0 17 3
8 2 18 1
9 1 19 2
10 2 20 3
In 5 of the 20 trials, the simulation resulted in three strikes. Therefore, the experimental
probability that Kara will make three consecutive strikes is:
P(3 strikes) 5 5 ___ 10
or 0.25
The actual theoretical probability is ,0.27.

954 • Chapter 17 Probability of Compound Events
© 2
011
Car
negi
e Le
arni
ng