Embed Size (px)
Citation preview

Probabilistic forecasts of severe convection with a WRF-DART analysis and convection-permitting forecast system
Logan C. Dawson
Academic Affiliation, Fall 2012: Graduate Student, Purdue University
SOARS® Summer 2012
Science Research Mentor: Glen Romine Writing and Communication Mentor: Sarah Tessendorf
Additional Contributors: Craig Schwartz
ABSTRACT
Convection-permitting models provide useful forecast guidance on expected convective mode, but often struggle to accurately forecast timing and location for small-scale and extreme events. Additionally, with horizontal grid spacing on the order of 1-4 km, small-scale convective features and severe weather phenomena are not fully resolved, necessitating the use of severe storm proxies. In this study, a five-member Weather Research and Forecasting (WRF) model ensemble was used to assess the performance of probabilistic convection-permitting model guidance in forecasting severe storms that occurred on 19-20 May 2012 across the central Great Plains. Forecasts were initialized with an ensemble mesoscale analysis from the real-time NCAR WRF Data Assimilation Research Testbed (WRF-DART) ensemble data assimilation system. Model forecasts were subjectively evaluated by comparing radar observations and storm reports to model fields and severe storm proxies such as simulated reflectivity and maximum updraft helicity. Precipitation forecasts were verified against Stage IV analysis using a “neighborhood-based” approach, which has been shown to produce more representative forecast skill scores when verifying high-resolution model output. Results suggested the ensemble system produced a reliable forecast of convection that would have provided useful guidance on storm mode, location and intensity on this day. Probabilities of maximum updraft were found to be most useful for identifying locations of observed severe storm reports, while discriminating hazard types using their associated severe storm proxies was less skillful.
This work was performed under the auspices of the Significant Opportunities in Atmospheric Research and Science Program. SOARS is managed by the University Corporation for Atmospheric Research and is funded by the National Science Foundation, the National Oceanic and Atmospheric Administration, the Cooperative Institute for Research in Environmental Science, the University of Colorado at Boulder, and by the Center for Multiscale Modeling of Atmospheric Processes.
SOARS® 2012, Logan C. Dawson, 2
1. Introduction In recent years, increased computational power has allowed numerical models to operate
at finer spatial resolutions. This presents a momentous, and yet challenging, opportunity for the severe storms and forecasting communities to provide detailed short-term forecasts of convective storms and severe weather phenomena. Serious efforts in explicitly forecasting convection began after Weisman et al. (1997) suggested that horizontal spatial resolution as coarse as 4 km was sufficient for representing small-scale, convective processes without the use of a cumulus parameterization (CP) scheme. By omitting CP from the model configuration, forecasts do not suffer from the errors CP causes when forecasting precipitation in propagating weather systems such as mesoscale convective systems (MCSs) (Davis et al. 2003). Numerous studies over the last decade (e.g., Done et al. 2004; Kain et al. 2008; Weisman et al. 2008) have assessed the Weather Research and Forecasting (WRF) model’s ability to forecast convection when using a convection-permitting configuration (i.e., horizontal grid spacing of less than 4 km and no CP scheme). These studies found that the physical processes and evolution of mesoscale convective phenomena were adequately represented in convection-permitting models. Kain et al. (2008) and Weisman et al. (2008) further examined the potential of convection-permitting models by comparing 4-km WRF forecasts with those using 2-km grid spacing. While the 2-km simulations generally represented small-scale features better than the corresponding 4-km runs, it was determined that the decrease in grid spacing did not improve forecasts of timing and location enough to justify the additional computational expense of running the model at a finer spatial resolution.
While 4-km grid spacing is adequate for representing mesoscale convective phenomena
such as bow echoes and squall lines, such grid spacing is too coarse to completely resolve small-scale convective features and severe weather phenomena such as mesocyclones and tornadoes (Kain et al. 2008; Sobash et al. 2011). Despite this limitation, updraft helicity has been identified as a diagnostic field that can serve as a proxy for supercells in convection-permitting models (Kain et al. 2008). To better utilize such information from these models that may be useful to operational forecasters, Kain et al. (2010b) developed hourly maximum fields (HMFs), which are a method of monitoring and extracting data at each model time step. HMFs can be produced for several of the model’s diagnostic fields that may be related to severe weather phenomena (i.e., tornadoes, large hail, and severe winds) without significantly increasing the size of model output files. Recently, Dowell et al. (2010) and Sobash et al. (2011) successfully used HMFs of updraft helicity to identify supercell swaths in convection-permitting forecasts. The ability to identify these rotating thunderstorms in model forecasts can be helpful to severe weather forecasters because they account for a large portion of severe weather events, especially large hail and tornadoes (Gallus et al. 2008; Kain et al. 2008).
Because convection-permitting models are able to discriminate between discrete cells and
larger convective complexes, they can provide valuable guidance to forecasters about the expected convective mode (Kain et al. 2008; Weisman et al. 2008; Kain et al. 2010b). Despite this benefit to forecasters, the aforementioned studies noted deficiencies in the model’s performance with respect to forecasting the timing and location of convective events. This is especially true for small-scale convective cells and severe weather phenomena, which are climatologically rare events (Sobash et al. 2011). Despite these inherent predictability challenges associated with forecasting severe thunderstorms (e.g., Lilly et al. 1990), various efforts have

SOARS® 2012, Logan C. Dawson, 3
been made to improve explicit convection forecasts by addressing sources of error (i.e., initial conditions and model physics) in numerical models. Weisman et al. (2008) noted that storm-scale forcing errors, such as lack of convective initiation in the model, were often tied to synoptic and mesoscale errors in the initial conditions. Therefore, improving the model initial state at the synoptic and mesoscale could alleviate some of the storm-scale model errors. This is particularly challenging at the mesoscale because of the sparse nature of the observational network in the United States at that spatial scale. However, assimilating radar data into numerical models has shown promise in resolving mesoscale and storm-scale initial condition errors during the initial hours of a forecast. Kain et al. (2010a) described explicit convection forecasts that were initialized with radar reflectivity and radial velocity data to forecasts with no such radar data assimilation. While evaluators noted positive effects from assimilation, those effects only lasted through the first 3-6 h of the forecast; this time span was even shorter (~1 h) for small, intense convective cells. Additionally, another major source of forecast error originates from physical parameterization schemes used in the model (e.g., Davis et al. 2003), but this error source is not addressed in the present study.
While these challenges to explicit convective forecasts remain, probabilistic forecast
guidance can be used to provide information about the uncertainty in the forecast. The most common form of probabilistic forecasts originates from ensemble forecasting systems. These sets of model forecasts may be configured through perturbations to initial conditions (ICs), lateral boundary conditions (LBCs), model physics and/or the dynamical core (e.g., Schwartz et al. 2010). The different configurations of an ensemble aim to represent the uncertainty in the numerical representation of atmospheric processes and the errors in the meteorological observations that are assimilated into models. Through these perturbations, each ensemble member produces a somewhat different forecast. It is assumed that each member has an equally likely chance of producing the correct forecast and that the truth is contained within the envelope of possible solutions.
Grid scale probabilities from an ensemble are determined based on the number of
ensemble members that forecasts a particular event. This traditional ensemble probability has deficiencies when used as an objective verification metric for convection-permitting model
output (i.e., low fractions skill scores when forecasting extreme precipitation; Schwartz et al. 2010). Additionally, other traditional forecast verification metrics, such as equitable threat score (ETS; e.g., Wilks 1995), are not reliable in evaluating high-resolution model guidance because point errors produce low skill scores that generally do not match subjective evaluations from forecasters (e.g., Baldwin et al. 2001; Kain et al. 2003). Because of this issue, Clark et al. (2010) and Schwartz et al. (2010) modified traditional verification metrics and ensemble probabilities by incorporating a “neighborhood-based” approach to verify quantitative precipitation forecasts (QPFs). In this method, a neighborhood is defined as a group of grid cells within a certain radius around a specified grid box (Figure 1). Verifying the occurrence of
Figure 1: Schematic showing basis of the neighborhood verification approach. (Figure 8 from Schwartz et al. 2010)
SOARS® 2012, Logan C. Dawson, 4
an event in a grid box based on what occurs in the neighborhood allows for a level of spatial and temporal uncertainty when verifying high-resolution model output. Both studies found that this neighborhood approach produced more skillful probabilistic forecasts of explicit convection, especially as the event became more extreme and rare. Furthermore, Sobash et al. (2011) found that creating a neighborhood around HMFs of updraft helicity produced reliable forecast probabilities of severe weather events similar to the probabilistic convective outlooks provided by the Storm Prediction Center (SPC). Additionally, the authors suggested that this approach would be even more useful when applied to an ensemble forecasting system.
The present study builds on previous work by recognizing the challenges inherent to
explicitly forecasting and verifying convective events. The specific purpose is to assess the performance of probabilistic forecasts of severe weather produced using a 3-km Advanced Research WRF (WRF-ARW; Skamarock et al. 2008) ensemble forecasting system with IC perturbations generated by an ensemble data assimilation (DA) system. Dowell et al. (2010) found that ICs produced from the National Center for Atmospheric Research (NCAR) real-time WRF Data Assimilation Research Testbed (WRF-DART) ensemble analysis provided a set of equally probable initial states with potential differences across a range of spatial scales. The forecasts are evaluated using a neighborhood-based verification approach similar to the work described in Clark et al. (2010) and Schwartz et al. (2010). This approach was shown to be useful for verifying QPF in convection-permitting models and should be successful if applied to severe weather forecasting because of the rarity of severe weather occurring at a specific location. An overview of the ensemble configuration and methodology is presented in the next section. Results from a subjective and objective analysis are presented in sections 3 and 4, respectively. Finally a summary of this work and potential future work are discussed in section 5.
2. Methodology a. Ensemble configuration
Explicit convection forecasts for 19-20 May 2012 were produced from a five-member ensemble forecasting system using the WRF-ARW version 3.3.1 dynamic core. ICs and LBCs were taken retrospectively from the NCAR real-time WRF-DART mesoscale ensemble analysis at 1200 UTC 19 May 2012. Forecasts were run for 24 h on a domain covering the continental United States (CONUS) and much of Canada and Mexico with 15 km horizontal grid spacing and 40 vertical levels (Figure 2). This mesoscale outer domain provided the ICs and LBCs for the convection-permitting inner domain centered over the central United States with 3 km grid spacing (Figure 2). This method of drawing ICs from an ensemble DA system has been shown to provide a good representation of the background mesoscale environment within the convection-permitting domain (Dowell et al. 2010).

SOARS® 2012, Logan C. Dawson, 5
Figure 2: Model domain showing the mesoscale outer domain ( x = 15 km) and the convection-permitting inner domain ( x = 3 km). The selected study area is also highlighted.
The model physics configuration was the same for the 15-km and 3-km domains, with the exception of CP being turned off in the convection-permitting domain (Table 1). Physical parameterizations included the Morrison double-moment microphysics scheme (Morrison et al. 2009), the Mellor–Yamada–Janjic (MYJ; Janjic 1994) planetary boundary layer (PBL) scheme, and the Noah land surface model (Chen and Dudhia 2001). Longwave and shortwave radiation were parameterized using the Rapid Radiative Transfer Model for GCMs (RRTMG; Mlawer et al. 1997). The Tiedtke cumulus scheme (Tiedtke 1989; Zhang et al. 2011) was used to parameterize convection on the mesoscale domain.
Table 1: Summary of NCAR WRF-DART ensemble configuration
Model Parameter Outer domain Inner domain Horizontal grid 15 km 3 km
Vertical grid 40 levels 40 levels Microphysics Morrison Morrison
Cumulus Tiedtke none PBL MYJ MYJ
Land surface Noah Noah Longwave and Shortwave Radiation RRTMG RRTMG
b. Hourly maximum fields
Because observed severe weather reports of tornadoes, large hail, and severe winds are not fully resolved at 3-km grid spacing, they must be related to model output through severe storm proxies. Additionally, convective-scale features such as mesocyclones evolve at faster time scales than the hourly model output, so it is necessary to produce hourly maximum fields (HMFs; described in Kain et al. 2010b) of these proxies to detect the development and evolution of such features. This requires monitoring a model diagnostic field at each time step (19 s for the convection-permitting domain) and recording the hourly maximum in every grid column. One such proxy field is updraft helicity (UH; units of m2 s–2), which is used to identify rotating

SOARS® 2012, Logan C. Dawson, 6
updrafts in WRF simulations. Following Kain et al. (2008), the instantaneous value of UH is calculated as
, (1)
where w is the vertical velocity (m s–1), is the vertical component of vorticity (s–1), and is the depth of each computational layer. In this case, both w and are averaged over a 1000 m layer. Other HMF proxies used in this study are maximum updraft speed (units of m s–1), maximum wind speed (units of m s–1) at 10 m above ground level (AGL), and vertically integrated graupel (units of kg m–2). c. Verification approach
Explicit convection forecasts were verified both qualitatively and quantitatively. Analysis was focused on the 2100–0300 UTC period, which was the time frame when the majority of the severe weather events were reported within the study area (Figure 2). The subjective evaluation was conducted by comparing model-simulated radar reflectivity to observed composite radar reflectivity obtained from the NCAR Mesoscale and Microscale Meteorology (MMM) Division Image Archive (http://www.mmm.ucar.edu/imagearchive/). Data from five Weather Surveillance Radar-1998 Doppler (WSR-88D) radars located across the central Great Plains [Omaha, NE (KOAX), Hastings, NE (KUEX), Topeka, KS (KTWX), Wichita, KS (KICT), and Vance Air Force Base, OK (KVNX)] were also inspected for closer examination of storm evolution. During this comparison, particular attention was paid to the timing and location of convective initiation and the evolution of convective organization. Additionally, HMFs of updraft speed, updraft helicity, maximum wind speed at 10 m, and vertically integrated graupel were verified against filtered storm reports (i.e., quality controlled in an effort to eliminate duplicate reports) of tornadoes, severe winds, and large hail obtained from the SPC severe thunderstorm event database (Figure 3). Because the quality of these reports is sometimes in question (e.g., Doswell et al. 2005; Trapp et al. 2006; Verbout et al. 2006), the severe storm proxies were not objectively verified against them.
Figure 3: Severe weather reported between 1200 UTC 19 May 2012 through 1159 UTC 20 May 2012.
To aid in the verification process, ensemble probability (EP) is used to show the number of ensemble members that forecast the exceedance of a specified threshold (of UH for example) within each grid column. This is computed as
SOARS® 2012, Logan C. Dawson, 7
, (2)
where EPi is the ensemble probability at the ith grid point, k is for the ensemble member, n is the number of ensemble members and BPki is a set of binary probabilities based on the exceedance of the given threshold, such as
. (3)
Plotting the EP field of the severe storm proxies allows for an assessment of the overall performance of the ensemble system in forecasting these severe weather hazards.
Objective verification was conducted by comparing quantitative precipitation forecasts to the National Centers for Environmental Prediction (NCEP) observed stage IV quantitative precipitation estimate (QPE) analyses (Lin and Mitchell 2005). Forecasts of selected rain rate thresholds (0.2, 0.5, 1.0, 5.0, 10.0, 20.0 mm hr–1) were first verified using traditional grid-scale verification, and predictive skill was quantified using relative operating characteristic (ROC) curves and reliability diagrams. Because of the aforementioned issues with verifying high-resolution model output using a point-to-point method, a neighborhood-based approach (similar to Schwartz et al. 2010) was also applied. In this study, a neighborhood was defined as a group of grid columns with their centers falling within a 25-km radius of the grid cell of interest (Figure 1). This effectively establishes the maximum possible displacement between the forecasted and observed phenomena for the forecast to be considered correct. While temporal errors are not directly accounted for in this method, they are indirectly accounted for via the spatial considerations. Using this neighborhood method, predictive skill in each member forecast was quantified using fractions skill score (FSS).
3. Subjective evaluation As a first step in evaluating the ensemble forecasts for the 19-20 May 2012 severe
weather event, a subjective assessment was conducted by visually comparing model-simulated radar reflectivity and hourly maximum fields of severe weather proxies to radar observations and storm reports. During the comparison of simulated and observed radar reflectivity, particular attention was focused on convective initiation and storm evolution during the 2100 UTC–0300 UTC time frame.
Overall, the ensemble members produced fairly similar forecasts that represented
convective initiation and storm evolution well. The forecasts were about 1-2 h late in initiating convection across central Nebraska and Kansas (Figure 4). Despite the time lag in convective initiation, the general structure and location of storms in this area were well represented in the forecasts from members 1-3 (Figure 4b-d). As seen in Figures 4e and 4f, members 4 and 5 show more organized convection than the other ensemble members. One possibility for this organization is that these two members initiated convection across this area earlier than the other members. For the convection that developed further south in western Oklahoma, the model handled the timing of convective initiation well, but the storms were displaced to the north near the Oklahoma–Kansas border (Figure 5). Because the error was noted in all of the ensemble members, this may indicate a problem with how the cold front that helped initiate storms was handled in the initial conditions of each member.

SOARS® 2012, Logan C. Dawson, 8
Figure 4: (a) Observed composite radar reflectivity over the central Great Plains at 2055 UTC on 19 May 2012 compared to simulated radar reflectivity at 2200 UTC from (b-f) ensemble members 1-5.
Once the model forecasts developed convection, storm evolution closely matched the observations. Radar observations show discrete thunderstorms undergoing upscale growth and evolving into three distinct clusters of multicell thunderstorms located over eastern Nebraska, southern Kansas, and western Oklahoma (Figure 6). All of the members forecasted a similar evolution from single cell convection to multicellular clusters, but they maintained convection far too long in northeastern Kansas where there was minimal convective activity throughout the evening (Figure 6). In addition to the northward displacement in convective initiation in western
SOARS® 2012, Logan C. Dawson, 9
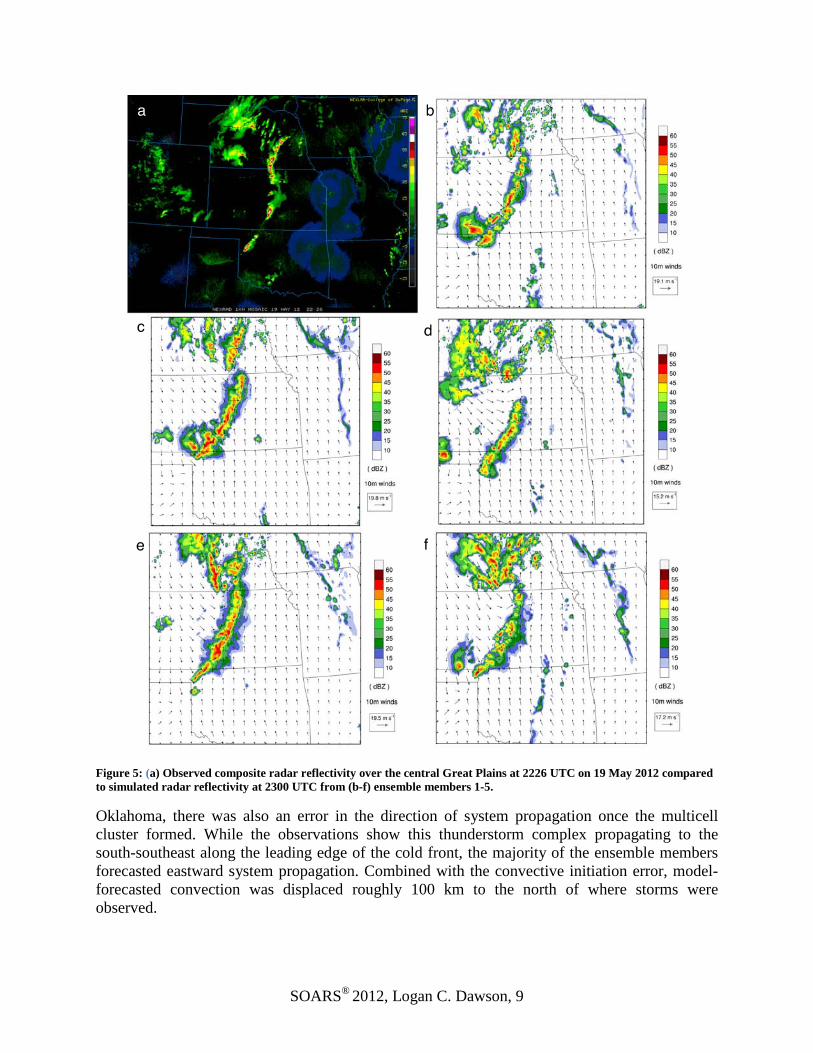
Figure 5: (a) Observed composite radar reflectivity over the central Great Plains at 2226 UTC on 19 May 2012 compared to simulated radar reflectivity at 2300 UTC from (b-f) ensemble members 1-5.
Oklahoma, there was also an error in the direction of system propagation once the multicell cluster formed. While the observations show this thunderstorm complex propagating to the south-southeast along the leading edge of the cold front, the majority of the ensemble members forecasted eastward system propagation. Combined with the convective initiation error, model-forecasted convection was displaced roughly 100 km to the north of where storms were observed.

SOARS® 2012, Logan C. Dawson, 10
Figure 6: (a) Observed composite radar reflectivity over the central Great Plains at 0053 UTC on 19 May 2012 compared to simulated radar reflectivity at 0100 UTC from (b-f) ensemble members 1-5.
The most glaring issue with the model forecasts was how they treated convection that formed in southeastern Colorado. The weak post-frontal thunderstorms that were observed in this area (Figure 4a) are common due to the moist upslope flow, but they quickly dissipated as they moved eastward away from the high terrain. Contrary to the observed evolution, some of the members forecasted a single thunderstorm with supercell characteristics (as indicated by maxima in updraft helicity) that moved from southeastern Colorado (not shown) into Kansas and Oklahoma (Figure 4b). Not only did the thunderstorm persist in some of the model forecasts, but it also strengthened and even interacted with the main line of storms in the real-time forecast.

SOARS® 2012, Logan C. Dawson, 11
In addition to the comparison of simulated and observed radar reflectivity, hourly maximum fields of updraft speed, updraft helicity, wind speed at 10 m, and vertically integrated graupel were accumulated over the 6-h period of interest (2100 UTC–0300 UTC) and compared to reports of severe weather that occurred during the same time frame. The HMF swaths were fairly well matched with the storm reports, with maximum updraft speed appearing to have the highest probability of detection (Figure 7a). The ensemble probability of maximum updraft speed greater than 20 m s–1 shows that at least one of the ensemble members forecasted intense convection where the majority of the severe weather reports are located. On an individual basis, some members captured the reports better than others, but this was highly dependent on when and where the member initiated convection and how it subsequently evolved.
Figure 7: Ensemble probability of 6-h accumulated hourly maximum fields exceeding a specified threshold for (a) maximum updraft speed, (b) updraft helicity, (c) maximum wind speed at 10 m, and (d) vertically integrated graupel. Associated storm reports over the same time frame (2100 UTC–0300 UTC) are also plotted.
While maximum updraft speed seemed to be skillful in forecasting convection in the areas where severe weather hazards were reported, it did not have skill in discriminating between different hazard types. Moreover, the other severe storm proxies were less skillful in forecasting their associated hazard types. For example, the highest probability of severe winds was located in Kansas and Oklahoma rather than in eastern Nebraska where the majority of severe winds were reported (Figure 7c). Also, while vertically integrated graupel showed high probabilities in western Oklahoma where severe hail was the primary hazard type, other areas that did not have as many hail reports, such as central Kansas, also had high probabilities for hail (Figure 7d). This suggests that this proxy would have a high probability of detection, yet also a high false alarm rate, thus limiting the discriminatory ability of this proxy.

SOARS® 2012, Logan C. Dawson, 12
Figure 8: NSSL radar-derived rotation tracks shown with tornado reports
Additionally, there were other notable issues that were consistent throughout most of the ensemble system. Because of error in the location of convective initiation in western Oklahoma and the subsequent error in the propagation direction, the HMF swaths of vertically integrated graupel were often located to the north of most of the hail reports in this area. Similarly, due to poor treatment of the system development in southern Kansas, the HMF swaths mostly missed the multitude of tornado reports southwest of Wichita and the wind and hail reports to the east of the city. While updraft helicity is the severe storm proxy most closely related to supercells (that often produce tornadoes), it did not have skill in forecasting the tornadoes that occurred on this day (Figure 7b). However, through visual inspection of radar observations and National Severe Storms Laboratory (NSSL) radar-derived rotation tracks (Smith and Elmore 2004), it was determined that these tornadoes did not form through a traditional, supercellular process characterized by long-lived rotating mesocyclones (Figure 8). With this in mind, it is reasonable that the HMF swaths of updraft helicity were not well matched with the tornado reports because neither the ensemble system nor updraft helicity would be expected to skillfully forecast tornadoes that form in the absence of a mesocyclone.
4. Precipitation verification Because of the challenges associated with objectively verifying the severe storm proxies
against storm reports, precipitation forecasts were quantitatively verified to determine if the ensemble system produced storms in locations where precipitation was observed. The forecasts were verified at grid scale against NCEP stage IV (Lin and Mitchell 2005) hourly-accumulated quantitative precipitation estimate (QPE) analyses, and predictive skill was determined using ROC curves and reliability diagrams. This analysis first required the model data to be remapped onto the stage IV grid (grid spacing of 4.7 km). Additionally, due to the poor objective skill scores often found when verifying high-resolution model output with a traditional point-to-point method, a “neighborhood-based” verification approach was also applied. For this approach, forecast skill was quantified using FSS.

SOARS® 2012, Logan C. Dawson, 13
Table 2: 2 2 contingency table for dichotomous events
Observed Not Observed Forecasted Hit False Alarm Not Forecasted Miss Correct Negative
ROC curves describe the discriminatory ability of a forecast. These curves are created by
aggregating probabilities of exceeding selected rain rate thresholds and plotting the probability of detection [POD = hits/(hits + misses)] and probability of false detection [POFD = false alarms/(false alarms + correct negatives)] using the objects in a 2 2 contingency table for dichotomous events (Table 2; Wilks 1995). The area under the ROC curve (AUC) is used to quantify the usefulness in a forecast. In this study, AUC was computed using a trapezoidal approximation. With AUC of 1.0 representing a perfect probabilistic forecast, AUC above (below) 0.5 indicates a forecast with (no) skill. Additionally, Buizza et al. (1999) and Stensrud and Yussouf (2007) determined that AUC greater than 0.7 suggests a useful forecast. Figure 9 shows that the ensemble system produced the most useful precipitation forecasts at lower rain rate thresholds for this event with predictive skill decreasing as the rain rate threshold increased. With AUC values above 0.8, the forecasts were particularly useful for rain rate thresholds up to 1 mm hr–1. However, all rain rate thresholds had AUCs above 0.5, and thus convective areas (rain rates greater than 10 mm hr–1) of modeled storms were forecasted with some skill (Table 3).
Table 3: Area under ROC curves
Figure 9: ROC curves determined from grid scale verification
Reliability diagrams illustrate the reliability in a model forecast by comparing the model forecast probability with how often the event was observed. These diagrams plot the forecast probability as a function of the observed frequency with the diagonal indicating the curve for a perfectly reliable forecast (Figure 10). The reliability diagrams show similar results to the ROC curves with the lower rain rate thresholds having more reliable forecasts than the higher rain rate thresholds. For all of the selected thresholds, the divergence from the perfect reliability diagonal at high forecast probabilities indicates that reliability in the forecasts tends to decrease as the forecast probability increases. Additionally, the reliability curves fall to the right of the perfect
Relative Operating Characteristic (ROC)
QPF Threshold (mm hr–1)
Area Under Curve (AUC)
0.2 0.863
0.5 0.857
1.0 0.845
5.0 0.751
10.0 0.686
20.0 0.558

SOARS® 2012, Logan C. Dawson, 14
reliability diagonal indicating that ensemble system has a tendency to overforecast the occurrence of precipitation events. This may be due to the ensemble system forecasting both stratiform and convective precipitation where they were not observed (Figure 6). In general, results from the reliability diagrams suggest the ensemble system has a higher probability of forecasting false alarms at both high rain rate thresholds and high forecast probabilities.
Figure 10: Reliability diagrams determined from grid scale verification
For the neighborhood-based verification, FSS was used to quantify forecast skill because of its usefulness when comparing probabilistic fields. Using a 25 km radius of influence, the neighborhood surrounding each grid column in the model output created a fractional grid that could be compared to the observations once they were also converted to a similar grid. With FSS ranging from 0 to 1, 1 indicates a perfect forecast and 0 indicates a forecast with no skill. In Figure 11, FSS is displayed for each member for forecast hours 9 through 15 (corresponding to the 2100 UTC–0300 UTC period of interest). Similar to the results suggested by the ROC curves and reliability diagrams, FSS generally shows forecast skill decreasing as the rain rate threshold increases. For rain rate thresholds up to 1 mm hr–1, the member forecasts were relatively skillful, while there was very little skill in some of the member forecasts at 20 mm hr–1. Despite the lack of skill for some of the members at the highest rain rate threshold, the ensemble system as a whole still had some skill in forecasting the regions of heavier precipitation. In addition to supporting the results of the grid scale verification, these neighborhood verification results also show trends in predictive skill throughout the forecast period. In general, FSS tends to increase throughout the period of interest, suggesting that the ensemble system’s forecasts of the mature convective systems were more skillful than the earlier forecasts around the time of convective initiation. While there were noted errors in the timing and location of convective initiation throughout the ensemble system (Figures 4 and 5), it should also be noted that skill could be expected to improve as upscale growth occurs because the larger mesoscale convective clusters are better resolved in the model than individual convective cells. Another tendency noted in Figure 11 is that scores between members at each forecast hour vary more at the higher rain rate thresholds than at the lower thresholds. This suggests that the ensemble members produce more similar forecasts of light precipitation than they do for the areas of heavier precipitation.

SOARS® 2012, Logan C. Dawson, 15
Figure 11: Fractions skill scores calculated with a 25 km radius of influence over the 6-h period of interest for rain rate thresholds of (a) 0.2 mm hr–1, (b) 0.5 mm hr–1, (c) 1.0 mm hr–1, (d) 5.0 mm hr–1, (e) 10.0 mm hr–1, and (f) 20.0 mm hr–1.

SOARS® 2012, Logan C. Dawson, 16
5. Summary and conclusions Explicit convection forecasts from a five-member WRF model ensemble were evaluated
to assess the performance of probabilistic convection-permitting model guidance in forecasting severe storms that occurred on 19-20 May 2012 across the central Great Plains. By drawing ICs and LBCs from the NCAR real-time WRF-DART ensemble mesoscale analysis, this work allowed for an exploration into the use of an ensemble data assimilation system for producing the ICs and LBCs for convection-permitting ensemble forecasts. The use of an ensemble system also allowed for an assessment of probabilistic severe weather guidance created by accumulating hourly maximum fields of severe storm proxies from model output.
Visual subjective evaluation of results suggested that the ensemble system produced
reliable explicit convection forecasts that would have provided useful guidance on storm mode, location and intensity for this event. The ensemble members generally initiated convection about 1-2 h late, but once the model developed convection, storm evolution was well represented. As for the severe storm proxies, the ensemble probability of maximum updraft speed was found to be most useful in forecasting the locations of observed severe weather. The ensemble guidance highlighted three areas with an enhanced likelihood of severe convection, and these areas agreed well with the location of severe weather reports. Somewhat contrary to the performance of maximum updraft, the other severe storm proxies were less skillful in forecasting the occurrence of their associated hazards. There are various reasons for this decrease in skill, including tornadoes forming in the absence of a true mesocyclone and ability of the model to resolve severe winds that occur on very local spatial scales.
In addition to the subjective evaluation, precipitation forecasts were verified
quantitatively at grid scale against stage IV QPE analyses. Using ROC curves and reliability diagrams, it was determined that the ensemble system produced useful and reliable precipitation forecasts. However, as rain rate thresholds and forecast probability increased, the forecasts became less skillful. The ensemble system generally forecasted the location of precipitation where it was observed. Convection locations (Figure 7a) were also well forecasted over the verification period, but timing of convective precipitation was less skillful (Figure 9). Precipitation forecasts were also verified using a neighborhood-based approach. FSS showed skill decreasing as rain rate thresholds increased, as well as skill increasing throughout the period of interest. This improvement in predictive skill throughout the period of interest could be related to the upscale growth from discrete cells into larger multicellular clusters that are better resolved by the model. Additionally, the spread in FSS between members at each forecast hour tended to grow with increasing rain rate thresholds, suggesting that the ensemble system was more variable in forecasting timing and location for intense rain cores versus regions of stratiform precipitation.
To enhance the results of this study, further analysis is needed to quantify the skill in using such severe storm proxies. The results for maximum updraft speed and updraft helicity are promising, but additional work is needed to assess whether the other severe storm proxies, at the present resolution, can be useful discriminators in identifying their associated phenomena as the primary weather hazard. Applying the neighborhood verification approach to these severe storm proxies may indicate more usefulness in these proxies. Additionally, when verifying explicit convection forecasts against observed severe weather hazards, there is some uncertainty in the quality of these severe weather reports. Factors such as the proximity to populated areas and the

SOARS® 2012, Logan C. Dawson, 17
accuracy of severe wind and large hail measurements affect the quality of these observations (e.g., Doswell et al. 2005; Trapp et al. 2006; Verbout et al. 2006). Therefore, conducting objective verification for a field such as updraft helicity against a potentially more robust observation such as the NSSL rotation tracks may be a productive endeavor. Nevertheless, the results of this work suggest there is value in these probabilistic forecasting products. Acknowledgements: First and foremost, I would like to thank my mentors, Glen Romine and Sarah Tessendorf, for their guidance, assistance, and hard work throughout the summer. Thanks are also due to Craig Schwartz for his extensive help with the precipitation verification analysis. His input greatly enhanced the scientific quality of this work. Finally, thank you to the SOARS steering committee and staff for providing me with the opportunity to participate in such an outstanding program.

SOARS® 2012, Logan C. Dawson, 18
REFERENCES Baldwin, M. E., S. Lakshmivarahan, and J. S. Kain, 2001: Verification of mesoscale features in
NWP models. Preprints, Ninth Conf. on Mesoscale Processes, Fort Lauderdale, FL, Amer. Meteor. Soc., 8.3.
Buizza, R., A. Hollingsworth, F. Lalaurette, and A. Ghelli, 1999: Probabilistic predictions of
precipitation using the ECMWF ensemble prediction system. Wea. Forecasting, 14, 168–189.
Chen, F., and J. Dudhia, 2001: Coupling an advanced land surface-hydrology model with the
Penn State–NCAR MM5 modeling system. Part I: Model implementation and sensitivity. Mon. Wea. Rev., 129, 569–585.
Clark, A. J., W. A. Gallus, and M. L. Weisman, 2010: Neighborhood-based verification of
precipitation forecasts from convection-allowing NCAR WRF simulations and the operational NAM. Wea. Forecasting, 25, 1495–1509.
Davis, C. A., K. W. Manning, R. E. Carbone, S. B. Trier, J. D. Tuttle, 2003: Coherence of warm-
season continental rainfall in numerical weather prediction models. Mon. Wea. Rev., 131, 2667–2679.
Done, J., C. A. Davis, and M. L. Weisman, 2004: The next generation of NWP: Explicit
forecasts of convection using the Weather Research and Forecast (WRF) model. Atmos. Sci. Lett., 5, 110–117.
Doswell, C. A., III, H. E. Brooks, and M. P. Kay, 2005: Climatological estimates of daily local
nontornadic severe thunderstorm probability for the United States. Wea. Forecasting, 20, 577–595.
Dowell, D. C., G. Romine, and C. Snyder, 2010: Ensemble storm-scale data assimilation and
prediction for severe convective storms. Preprints, 25th Conf. on Severe Local Storms, Denver, CO, Amer. Meteor. Soc., 9.5.
Gallus, W. A., Jr., N. A. Snook, and E. V. Johnson, 2008: Spring and summer severe weather
reports over the Midwest as a function of convective mode: A preliminary study. Wea. Forecasting, 23, 101–113.
Janjic, Z. I., 1994: The step-mountain Eta coordinate model: Further developments of the
convection, viscous sublayer, and turbulence closure schemes. Mon. Wea. Rev., 122, 927–945.
Kain, J. S., M. E. Baldwin, P. R. Janish, S. J. Weiss, M. P. Kay, and G. W. Carbin, 2003:
Subjective verification of numerical models as a component of a broader interaction between research and operations. Wea. Forecasting, 18, 847–860.

SOARS® 2012, Logan C. Dawson, 19
Kain, J. S., and Coauthors, 2008: Some practical considerations regarding horizontal resolution in the first generation of operational convection-allowing NWP. Wea. Forecasting, 23, 931–952.
Kain, J. S., and Coauthors, 2010a: Assessing advances in the assimilation of radar data and other
mesoscale observations within a collaborative forecasting–research environment. Wea. Forecasting, 25, 1510–1521.
Kain, J. S., S. R. Dembek, S. J. Weiss, J. L. Case, J. J. Levit, and R. A. Sobash, 2010b:
Extracting unique information from high-resolution forecast models: Monitoring selected fields and phenomena every time step. Wea. Forecasting, 25, 1536–1542.
Lilly, D. K., 1990: Numerical prediction of thunderstorms––Has its time come? Quart. J. Roy.
Meteor. Soc., 116, 779–798. Lin, Y., and K. E. Mitchell, 2005: The NCEP Stage II/IV hourly precipitation analyses:
Development and applications. Preprints, 19th Conf. on Hydrology, San Diego, CA, Amer. Meteor. Soc., 1.2.
Mlawer, E. J., S. J. Taubman, P. D. Brown, M. J. Iacono, and S. A. Clough, 1997: Radiative
transfer for inhomogeneous atmospheres: RRT, a validated correlated-k model for the Longwave. J. Geophys. Res., 102 (D14), 16 663–16 682.
Morrison, H., G. Thompson, V. Tatarskii, 2009: Impact of cloud microphysics on the
development of trailing stratiform precipitation in a simulated squall line: comparison of one- and two-moment schemes. Mon. Wea. Rev., 137, 991–1007.
Schwartz, C. S. and Coauthors, 2010: Toward improved convection-allowing ensembles: Model
physics sensitivities and optimizing probabilistic guidance with small ensemble membership. Wea. Forecasting, 25, 263–280.
Skamarock, W. C., J. B. Klemp, J. Dudhia, D. O. Gill, D. M. Barker, X.-Y. Huang, W. Wang,
and J. G. Powers, 2008: A description of the Advanced Research WRF version 3. NCAR Tech. Note TN-475+STR, 113 pp.
Smith, T. M. and K. L. Elmore, 2004: The use of radial velocity derivatives to diagnose rotation
and divergence. Preprints, 11th Conf. On Aviation, Range and Aerospace, Hyannis, MA. Amer. Meteor. Soc., 5.6.
Sobash, R. A., J. S. Kain, D. R. Bright, A. R. Dean, M. C. Coniglio, and S. J. Weiss, 2011:
Probabilistic forecast guidance for severe thunderstorms based on the identification of extreme phenomena in convection-allowing model forecasts. Wea. Forecasting, 26, 714–728.
Stensrud, D. J., and N. Yussouf, 2007: Reliable probabilistic quantitative precipitation forecasts
from a short-range ensemble forecasting system. Wea. Forecasting, 22, 3–17.

SOARS® 2012, Logan C. Dawson, 20
Tiedtke, M., 1989: A comprehensive mass flux scheme for cumulus parameterization in large-
scale models. Mon. Wea. Rev., 117, 1779–1800. Trapp, R. J., D. M. Wheatley, N. T. Atkins, R. W. Przybylinski, and R. Wolf, 2006: Buyer
beware: Some words of caution on the use of severe wind reports in postevent assessment and research. Wea. Forecasting, 21, 408–415.
Verbout, S. M., H. E. Brooks, L. M. Leslie, and D. M. Schultz, 2006: Evolution of the U.S.
tornado database: 1954–2003. Wea. Forecasting, 21, 86–93. Weisman, M. L., W. C. Skamarock, and J. B. Klemp, 1997: The resolution dependence of
explicitly modeled convective systems. Mon. Wea. Rev., 125, 527–548. Weisman, M. L., C. Davis, W. Wang, K. W. Manning, and J. B. Klemp, 2008: Experiences with
0-36-h explicit convective forecasts with the WRF-ARW model. Wea. Forecasting, 23, 407–437.
Wilks, D. S., 1995: Statistical Methods in the Atmospheric Sciences: An Introduction. Academic
Press, 467 pp. Zhang, C., Y. Wang, K. Hamilton, 2011: Improved representation of boundary layer clouds over
the Southeast Pacific in ARW-WRF using a modified Tiedtke cumulus parameterization scheme. Mon. Wea. Rev., 139, 3489–3513.