Embed Size (px)
Citation preview

PROACTIVE2019 ANNUAL REPORT

ARLEN D. NORDHAGEN
We’re looking forward to celebrating our fifth year as a public company in 2020, which follows another year of industry leading internal and external growth in 2019. The combination of our geographically diversified portfolio, the downside protection inherent in our Participating Regional Operator (“PRO”) structure, and our multi-faceted external growth strategy has been and will continue to be a differentiator as we deliver outsized growth in same-store NOI and core FFO per share.
In 2019, we invested nearly $450 million in the acquisition of self storage properties and welcomed two new PROs, Southern Self Storage and Moove In Self Storage, to the NSA family. We also delivered sector-leading growth in same-store NOI of 5% and core FFO per share of 11.6% in 2019. These solid results drove a 32% total return for NSA shares in 2019, which outpaced all of our storage peers, the MSCI US REIT (RMS) index and the S&P 500 index.
2020 promises to be a significant year of transition for NSA as Tammy stepped into the role of CEO effective January 1, and we will complete the internalization of our largest PRO, SecurCare Self Storage by April. Tammy’s appointment as CEO is not only a significant milestone for NSA, but also for the broader REIT industry, as she is one of just ten female REIT CEOs among over 200 REITs in the United States. The internalization of SecurCare, which is immediately accretive to core FFO per share and nearly doubles the number of corporate-managed facilities, delivers on a key part of the longer-term strategy that we’ve articulated since our IPO in 2015.
Of course, our outlook for the coming year is also impacted by the unprecedented challenges to the broader economy related to the impact from COVID-19, moderating fundamentals due to elevated new supply in the self storage sector, and potential volatility due to election-year dynamics. During such periods of heightened uncertainty, NSA remains well-positioned to withstand the inevitable strain of changing economic conditions. The self storage industry has historically demonstrated resilience through turbulent times, and we believe we have an operational advantage with the expertise and experience of our PROs and the financial strength of our investment grade balance sheet. Key attributes
of our balance sheet as of December 31, 2019 include:
no significant debt maturities until 2023;
a weighted average debt maturity of 5.9 years with an average interest rate of 3.5%;
net debt to Adjusted EBITDA ratio of 5.7 times;
an investment grade BBB Rating by Kroll Bond Rating Agency (KBRA); and
proven access to multiple sources of capital.
We are prepared to weather any potential storm, and we will remain disciplined and flexible as opportunities present themselves in 2020 and beyond. Here is what you should expect from us going forward:
continued focus on maintaining a conservative balance sheet and access to multiple sources of capital;
validation of the benefits of our innovative PRO structure;
continued execution on our multi-faceted external growth strategy;
further development of the value-add benefits of our technology platform; and
additional progress on our environmental, social and governance (“ESG”) program as we formalize and communicate our initiatives.
Since our IPO in 2015, all of our stakeholders have benefitted from outsized growth driven by our unique PRO structure. In the midst of a time of increased volatility and economic uncertainty, we’re confident that the risk-mitigating aspects of our differentiated PRO structure and our focus on ownership of stabilized properties rather than development-stage properties will prove very beneficial. We believe that dedication to our core values of Integrity, Accountability, Humility and Compassion will serve us well as we navigate through these uncertain times. We are committed to continuing our service as prudent stewards of your capital, while striving to deliver robust returns for the foreseeable future.
Finally, we thank our team members nationwide for your dedication, our PROs for your continued leadership, our investors and other stakeholders for your continued support and our Board of Trustees for your wise advice and counsel.
DEAR FELLOW SHAREHOLDERS,
ARLEN D. NORDHAGEN Executive Chairman of the Board of Trustees
TAMARA D. FISCHER President and Chief Exectuive Officer
“In 2019, we invested nearly $450 million in the acquisition of self storage properties and welcomed two new PROs to the NSA Family...”
TAMARA D. FISCHER

UNITED STATESSECURITIES AND EXCHANGE COMMISSION
WASHINGTON, D.C. 20549
FORM 10-K☒ ANNUAL REPORT PURSUANT TO SECTION 13 OR 15(d) OF THE SECURITIES EXCHANGE ACT OF 1934
For the fiscal year ended December 31, 2019
OR
☐ TRANSITION REPORT PURSUANT TO SECTION 13 OR 15(d) OF THE SECURITIES EXCHANGE ACT OF 1934
For the transition period from to
Commission file number: 001-37351
National Storage Affiliates Trust(Exact name of Registrant as specified in its charter)
Maryland 46-5053858(State or other jurisdiction of
incorporation or organization)(I.R.S. Employer
Identification No.)
8400 East Prentice Avenue, 9th Floor Greenwood Village, Colorado 80111
(Address of principal executive offices) (Zip code)
(720) 630-2600 (Registrant's telephone number including area code)
Securities registered pursuant to Section 12(b) of the Act:
Title of each class Trading symbols Name of each exchange on which registeredCommon Shares of Beneficial Interest, $0.01 par
value per shareNSA New York Stock Exchange
Series A Cumulative Redeemable Preferred Shares of Beneficial Interest, par value $0.01 per share
NSA Pr A New York Stock Exchange
Indicate by check mark if the registrant is a well-known seasoned issuer, as defined in Rule 405 of the Securities Act. Yes ☒ No ☐
Indicate by check mark if the registrant is not required to file reports pursuant to Section 13 or Section 15(d) of theAct. Yes ☐ No ☒
Indicate by check mark whether the registrant (1) has filed all reports required to be filed by Section 13 or 15(d) ofthe Securities Exchange Act of 1934 during the preceding 12 months (or for such shorter period that the registrantwas required to file such reports), and (2) has been subject to such filing requirements for the past 90 days.Yes ☒ No ☐
Indicate by check mark whether the registrant has submitted electronically every Interactive Data File required to besubmitted pursuant to Rule 405 of Regulation S-T (§232.405 of this chapter) during the preceding 12 months (or forsuch shorter period that the registrant was required to submit such files). Yes ☒ No ☐

Indicate by check mark whether the registrant is a large accelerated filer, an accelerated filer, a non-accelerated filer,or a smaller reporting company. See the definitions of "large accelerated filer," "accelerated filer" and "smallerreporting company" in Rule 12b-2 of the Exchange Act.
Large Accelerated Filer ☒ Accelerated Filer ☐Non-accelerated Filer ☐ Smaller Reporting Company ☐
Emerging Growth Company ☐If an emerging growth company, indicate by check mark if the registrant has elected not to use the extendedtransition period for complying with any new or revised financial accounting standards provided pursuant to Section13(a) of the Exchange Act. ☐
Indicate by check mark whether the registrant is a shell company (as defined in Rule 12b-2 of the ExchangeAct). Yes ☐ No ☒
The aggregate market value of the voting and non-voting common shares of beneficial interest of National StorageAffiliates Trust held by non-affiliates of National Storage Affiliates Trust was approximately $1.7 billion as ofJune 30, 2019. As of February 25, 2020, 59,683,668 common shares of beneficial interest, $0.01 par value per share,were outstanding.
Documents Incorporated by Reference
Portions of the registrant's definitive proxy statement for its annual meeting of shareholders are incorporated byreference into Part III of this Annual Report on Form 10-K.

NATIONAL STORAGE AFFILIATES TRUST
TABLE OF CONTENTS
ANNUAL REPORT ON FORM 10-KFor the Fiscal Year Ended December 31, 2019
Item PagePART I
1. Business 51A. Risk Factors 151B. Unresolved Staff Comments 332. Properties 333. Legal Proceedings 344. Mine Safety Disclosures 34
PART II
5. Market for the Registrant's Common Equity, Related Shareholder Matters and Issuer Purchases of Equity Securities 35
6. Selected Financial Data 37
7. Management's Discussion and Analysis of Financial Condition and Results of Operations 38
7A. Quantitative and Qualitative Disclosures About Market Risk 558. Financial Statements and Supplementary Data 56
9. Changes in and Disagreements With Accountants on Accounting and Financial Disclosure 56
9A. Controls and Procedures 569B. Other Information 57
PART III10. Directors, Executive Officers and Corporate Governance 5711. Executive Compensation 57
12. Security Ownership of Certain Beneficial Owners and Management and Related Stockholder Matters 57
13. Certain Relationships and Related Transactions, and Director Independence 5714. Principal Accounting Fees and Services 57
PART IV15. Exhibits and Financial Statement Schedules 5716. Form 10-K Summary 61
3

FORWARD-LOOKING STATEMENTS
National Storage Affiliates Trust and its consolidated subsidiaries (the "Company", "NSA," "we," "our", and"us") make forward-looking statements in this report that are subject to risks and uncertainties. These forward-looking statements include information about possible or assumed future results of our business, financial condition,liquidity, results of operations, plans and objectives. When we use the words "believe," "expect," "anticipate,""estimate," "plan," "continue," "intend," "should," "may," or similar expressions, we intend to identify forward-looking statements.
The forward-looking statements contained in this report reflect our current views about future events and aresubject to numerous known and unknown risks, uncertainties, assumptions, and changes in circumstances that maycause our actual results to differ significantly from those expressed in any forward-looking statement.
Statements regarding the following subjects, among others, may be forward-looking:
• market trends in our industry, interest rates, the debt and lending markets or the general economy;
• our business and investment strategy;
• the acquisition of properties, including those under contract, and the ability of our acquisitions to achieve underwritten capitalization rates and our ability to execute on our acquisition pipeline;
• the internalization of existing participating regional operators ("PROs") into the Company;
• the timing of acquisitions;
• our relationships with, and our ability and timing to attract additional, PROs;
• our ability to effectively align the interests of our PROs with us and our shareholders;
• the integration of our PROs and their managed portfolios into the Company, including into our financial and operational reporting infrastructure and internal control framework;
• our operating performance and projected operating results, including our ability to achieve market rents and occupancy levels, reduce operating expenditures and increase the sale of ancillary products and services;
• our ability to access additional off-market acquisitions;
• actions and initiatives of the U.S. federal, state and local government and changes to U.S. federal, state and local government policies and the execution and impact of these actions, initiatives and policies;
• the state of the U.S. economy generally or in specific geographic regions, states, territories or municipalities;
• economic trends and economic recoveries;
• our ability to obtain and maintain financing arrangements on favorable terms;
• general volatility of the securities markets in which we participate;
• changes in the value of our assets;
• projected capital expenditures;
• the impact of technology on our products, operations, and business;
• the implementation of our technology and best practices programs (including our ability to effectively implement our integrated Internet marketing strategy);
• changes in interest rates and the degree to which our hedging strategies may or may not protect us from interest rate volatility;
• impact of and changes in governmental regulations, tax law and rates, accounting guidance and similar matters;
• our ability to continue to qualify and maintain our qualification as a real estate investment trust for U.S. federal income tax purposes ("REIT");
Table of Contents
4

• availability of qualified personnel;
• the timing of conversions of each series of Class B common units of limited partner interest ("subordinated performance units") in NSA OP, LP (our "operating partnership") and subsidiaries of our operating partnership into Class A common units of limited partner interest ("OP units") in our operating partnership, the conversion ratio in effect at such time and the impact of such convertibility on our diluted earnings (loss) per share;
• the risks of investing through joint ventures, including whether the anticipated benefits from a joint venture are realized or may take longer to realize than expected;
• estimates relating to our ability to make distributions to our shareholders in the future; and
• our understanding of our competition.
The forward-looking statements are based on our beliefs, assumptions and expectations of our futureperformance, taking into account all information currently available to us. Forward-looking statements are notpredictions of future events. These beliefs, assumptions, and expectations can change as a result of many possibleevents or factors, not all of which are known to us. Readers should carefully review our financial statements and thenotes thereto, as well as the sections entitled "Business," "Risk Factors," "Properties," and "Management'sDiscussion and Analysis of Financial Condition and Results of Operations," described in Item 1, Item 1A, Item 2and Item 7, respectively, of this Annual Report on Form 10-K and the other documents we file from time to time withthe Securities and Exchange Commission. If a change occurs, our business, financial condition, liquidity and resultsof operations may vary materially from those expressed in our forward-looking statements. Any forward-lookingstatement speaks only as of the date on which it is made. New risks and uncertainties arise over time, and it is notpossible for us to predict those events or how they may affect us. Except as required by law, we are not obligated to,and do not intend to, update or revise any forward-looking statements, whether as a result of new information,future events or otherwise.
PART IItem 1. Business
General
National Storage Affiliates Trust is a fully integrated, self-administered and self-managed real estate investmenttrust organized in the state of Maryland on May 16, 2013. We have elected and we believe that we have qualified tobe taxed as a REIT for U.S. federal income tax purposes commencing with our taxable year ended December 31,2015. We serve as the sole general partner of our operating partnership subsidiary, NSA OP, LP (our "operatingpartnership"), a Delaware limited partnership formed on February 13, 2013 to conduct our business, which isfocused on the ownership, operation, and acquisition of self storage properties located within the top100 metropolitan statistical areas ("MSAs") throughout the United States. As of December 31, 2019, we heldownership interests in and operated a geographically diversified portfolio of 742 self storage properties, located in35 states and Puerto Rico, comprising approximately 47.1 million rentable square feet, configured in approximately378,000 storage units. According to the 2020 Self-Storage Almanac, we are the sixth largest owner and operator ofself storage properties in the United States based on number of properties, self storage units, and rentable squarefootage. We completed our initial public offering in 2015 and our common shares of beneficial interest, $0.01 parvalue per share ("common shares") are listed on the New York Stock Exchange under the symbol "NSA."
Our executive chairman of the board of trustees and former chief executive officer, Arlen D. Nordhagen, co-founded SecurCare Self Storage, Inc. in 1988 to invest in and manage self storage properties. While growingSecurCare to over 150 self storage properties, Mr. Nordhagen recognized a market opportunity for a differentiatedpublic self storage REIT that would leverage the benefits of national scale by integrating multiple experiencedregional self storage operators with local operational focus and expertise. We believe that his vision, which is thefoundation of the Company, aligns the interests of our participating regional operators ("PROs"), with those of ourpublic shareholders by allowing our PROs to participate alongside our shareholders in our financial performance andthe performance of our PROs' "managed portfolios", which means, with respect to each PRO, the portfolio ofproperties that such PRO manages on our behalf. A key component of this strategy is to capitalize on the localmarket expertise and knowledge of regional self storage operators by maintaining the continuity of their roles asproperty managers.
Table of Contents
5

We believe that our structure creates the right financial incentives to accomplish these objectives. We requireour PROs to exchange the self storage properties they contribute to the Company for a combination of OP units andsubordinated performance units in our operating partnership or subsidiaries of our operating partnership that issueunits intended to be economically equivalent to the OP units and subordinated performance units issued by ouroperating partnership ("DownREIT partnerships"). OP units, which are economically equivalent to our commonshares, create alignment with the performance of the Company as a whole. Subordinated performance units, whichare linked to the performance of specific managed portfolios, incentivize our PROs to drive operating performanceand support the sustainability of the operating cash flow generated by the self storage properties that they manage onour behalf. Because subordinated performance unit holders receive distributions only after portfolio-specificminimum performance thresholds are satisfied, subordinated performance units play a key role in aligning theinterests of our PROs with us and our shareholders. Our structure thus offers PROs a unique opportunity to serve asregional property managers for their managed portfolios and directly participate in the potential upside of thoseproperties while simultaneously diversifying their investment to include a broader portfolio of self storageproperties. We believe our structure provides us with a competitive growth advantage over self storage companiesthat do not offer property owners the ability to participate in the performance and potential future growth of theirmanaged portfolios.
We believe that our national platform has significant potential for continued external and internal growth. Weseek to further expand our platform by continuing to recruit additional established self storage operators as well asopportunistically partnering with institutional funds and other institutional investors in strategic joint venturearrangements while integrating our operations through the implementation of centralized initiatives, includingmanagement information systems, revenue enhancement, and cost optimization programs. We are currently engagedin preliminary discussions with additional self storage operators and believe that we could add one to three morePROs in addition to the PROs we have currently, which will enhance our existing geographic footprint and allow usto enter regional markets in which we currently have limited or no market share. We are also currently undercontract to internalize an existing PRO, subject to the satisfaction of customary closing conditions. See "SecurCareInternalization" below.
Our PROs
The Company had ten PROs as of December 31, 2019: SecurCare Self Storage, Inc. and its controlled affiliates("SecurCare"), Kevin Howard Real Estate Inc., d/b/a Northwest Self Storage and its controlled affiliates("Northwest"), Optivest Properties LLC and its controlled affiliates ("Optivest"), Guardian Storage Centers LLC andits controlled affiliates ("Guardian"), Move It Self Storage and its controlled affiliates ("Move It"), Arizona MiniStorage Management Company d/b/a Storage Solutions and its controlled affiliates ("Storage Solutions"), Hide-Away Storage Services, Inc. and its controlled affiliates ("Hide-Away"), an affiliate of Shader Brothers Corporationd/b/a Personal Mini Storage ("Personal Mini"), Southern Storage Management Systems, Inc. d/b/a Southern SelfStorage ("Southern") and affiliates of Investment Real Estate Management, LLC d/b/a Moove In Self Storage("Moove In").
To capitalize on their recognized and established local brands, our PROs continue to function as propertymanagers for their managed portfolios under their existing brands (which include various brands in addition to thosediscussed below). Over the long-run, we may seek to brand or co-brand each location as part of NSA.
• SecurCare, which is headquartered in Lone Tree, Colorado, has been operating since 1988 and is one of ourPROs responsible for covering the west, mountain, midwest and southeast regions. SecurCare providedproperty management services to 215 of our properties located in California, Colorado, Florida, Georgia,Indiana, Kentucky, Louisiana, Mississippi, North Carolina, Ohio, Oklahoma, South Carolina and Texas asof December 31, 2019. SecurCare is currently managed by David Cramer, who has worked in the selfstorage industry for more than 20 years.
• Northwest, which is headquartered in Portland, Oregon, is our PRO responsible for covering the northwestregion. Northwest provided property management services to 78 of our properties located in Idaho, Oregonand Washington as of December 31, 2019. Northwest is led by Kevin Howard, a former member of ourboard of trustees, who founded Northwest over 30 years ago and is recognized in the industry for hissuccessful track record as a self storage specialist in the areas of design and development, operations andproperty management, consultation, and brokerage.
Table of Contents
6

• Optivest, which is based in Dana Point, California, is one of our PROs responsible for covering portions ofthe northeast and southwest regions. Optivest managed 64 of our properties located in Arizona, California,Massachusetts, Nevada, New Hampshire, New Mexico and Texas as of December 31, 2019. Optivest is runby its co-founder, Warren Allan, who has more than 25 years of financial and operational managementexperience in the self storage industry and is recognized as a self storage acquisition and developmentspecialist.
• Guardian, which is based in Irvine, California, is one of our PROs responsible for covering portions of thesouthern California and southwest regions. Guardian managed 55 of our properties located in California,Arizona and Nevada as of December 31, 2019. Guardian is led by John Minar, who has nearly 40 years ofself storage acquisition, rehabilitation, ownership, operations and development experience.
• Move It, which is based in Dallas, Texas, is one of our PROs responsible for covering portions of the Texasand southeast markets. Move It managed 33 of our properties located in Alabama, Florida, Louisiana,Mississippi and Texas as of December 31, 2019. Move It is led by its founder, Tracy Taylor, who has morethan 40 years of experience in self storage development, acquisition and management, and is currently onthe board of directors for the Large Owners Council of the Self Storage Association and is a formerChairman of the Self Storage Association.
• Storage Solutions, which is based in Chandler, Arizona, is our PRO responsible for covering portions of theArizona and Nevada markets. Storage Solutions managed 10 of our properties in Arizona and Nevada as ofDecember 31, 2019. Storage Solutions is led by its founder, Bill Bohannan, who is one of the largestoperators in Phoenix and has more than 35 years of self storage acquisition, development and managementexperience. Mr. Bohannan is recognized in the industry as a self storage acquisition, development andmanagement specialist.
• Hide-Away, which is based in Sarasota, Florida, is our PRO responsible for covering the western Floridamarket. Hide-Away managed 22 of our properties in western Florida as of December 31, 2019. Hide-Awayis led by its founder, Steve Wilson, one of the early developers of the self storage business, who served formore than 35 years as the President of Hide-Away and its related entities, and is a former Chairman of theSelf Storage Association.
• Personal Mini, which is based in Orlando, Florida, is our PRO responsible for covering portions of thecentral Florida market. Personal Mini managed eight of our properties in central Florida as of December 31,2019. Personal Mini is led by Marc Smith, a self storage investor who has been involved in all facets of theself storage business. Mr. Smith is a past Chairman of the Self Storage Association, and also previouslyserved as president of the Southeast Region of the Self Storage Association.
• Southern, which is based in Palm Beach Gardens, Florida, is one of our PROs responsible for coveringportions of Arizona and the southeast region, including New Orleans, the Florida Panhandle, southernGeorgia, and Puerto Rico. Southern managed 29 of our properties in Arizona, Louisiana, the FloridaPanhandle, southern Georgia, and Puerto Rico as of December 31, 2019. Southern is led by Bob McIntoshand Peter Cowie, who are active real estate operators with more than 30 years of self storage experience.
• Moove In, which is based in York, Pennsylvania, is our PRO responsible for covering portions of thenortheast region, including portions of Pennsylvania, Massachusetts, and New Jersey. Moove In managed11 of our properties in Pennsylvania, Massachusetts, and New Jersey as of December 31, 2019. Moove Inis led by John Gilliland, a past Chairman of the Self Storage Association.
We benefit from the local market knowledge and active presence of our PROs, allowing us to build and fosterimportant customer and industry relationships. These local relationships provide attractive off-market acquisitionopportunities that we believe will continue to fuel additional external growth.
We believe our structure allows our PROs to optimize their established property management platforms whileaddressing financial and operational hurdles. Before joining us, our PROs faced challenges in securing low costcapital and had to manage multiple investors and lending relationships, making it difficult to compete with largercompetitors, including public REITs, for acquisition and investment opportunities. Our PROs were also limited intheir ability to raise growth capital through the sale of assets, a portfolio refinancing, or capital contributions fromnew equity partners. Serving as our on-the-ground acquisition teams, our PROs now have access to our broader
Table of Contents
7

financing sources and lower cost of capital, while our national platform allows them to benefit from economies ofscale to drive operating efficiencies in a rapidly evolving, technology-driven industry.
SecurCare Internalization
On February 24, 2020, we entered into a definitive agreement with SecurCare to merge SecurCare into a whollyowned subsidiary of the Company. As a result of the merger, SecurCare's property management platform and relatedintellectual property will be internalized by us. As part of the internalization, most of SecurCare's employees,including its president and chief executive officer, David Cramer, and its other key persons, will be offeredemployment by us and will continue managing SecurCare's portfolio of properties under the brand SecurCare asmembers of our existing property management platform. Mr. Cramer will replace Steven B. Treadwell as our chiefoperating officer and executive vice president effective at or around the closing of the merger. As a result of themerger, we will no longer pay any fees or reimbursements to SecurCare and distributions on the series ofsubordinated performance units related to SecurCare's managed portfolio will be discontinued. The transactions areexpected to close during the second quarter of 2020, subject to customary closing conditions. However, there is noassurance that the transactions will be consummated at all or at the time or pursuant to the terms currentlycontemplated. For additional information, see the current report on Form 8-K that we filed with the Securities andExchange Commission on February 24, 2020.
Our Consolidated Properties
We seek to own properties that are well located in high quality sub-markets with highly accessible street accessand attractive supply and demand characteristics, providing our properties with strong and stable cash flows that areless sensitive to the fluctuations of the general economy. Many of these markets have multiple barriers to entryagainst increased supply, including zoning restrictions against new construction and new construction costs that webelieve are higher than our properties' fair market value. As of December 31, 2019, we owned a geographicallydiversified portfolio of 567 self storage properties, located in 29 states and Puerto Rico, comprising approximately34.5 million rentable square feet, configured in approximately 275,000 storage units. Of these properties, 265 wereacquired by us from our PROs, 301 were acquired by us from third-party sellers and one was acquired by us fromthe 2016 Joint Venture (as defined in Note 5 to the consolidated financial statements in Item 8). A complete listingof, and additional information about, our self storage properties is included in Item 2 of this report.
During the year ended December 31, 2019, we acquired 69 consolidated self storage properties, of which 19were acquired by us from our PROs, 49 were acquired by us from third-party sellers and one was acquired by usfrom the 2016 Joint Venture. The following is a summary of our 2019 consolidated acquisition activity (dollars inthousands):
Number of Number of RentableState Properties Units Square Feet Fair Value2019 Acquisitions:Florida 12 5,400 653,564 $ 90,580Louisiana 12 6,052 682,729 69,330Texas 11 5,292 801,344 79,688Georgia 10 5,113 658,636 70,134Pennsylvania 6 2,665 299,125 33,162Idaho 3 925 202,545 12,450New Jersey 3 1,436 191,304 18,182New Mexico 3 1,950 233,868 28,221Arizona 2 801 97,320 11,475Massachusetts 2 1,454 124,200 12,312Missouri 2 861 103,726 9,066Other(1) 3 1,011 128,937 13,230Total 69 32,960 4,177,298 $ 447,830
(1) Self storage properties in other states acquired during the year ended December 31, 2019 include Maryland, New Hampshire and Oregon.
Table of Contents
8

During the year ended December 31, 2019, we sold one self storage property to an unrelated third party for $6.5million. The self storage property comprised less than 0.1 million rentable square feet configured in approximately500 storage units.
During the year ended December 31, 2018, we acquired 57 consolidated self storage properties and anexpansion project adjacent to an existing property, of which four were acquired by us from our PROs and 53 wereacquired by us from third-party sellers. The following is a summary of our 2018 consolidated acquisition activity(dollars in thousands):
Number of Number of RentableState/Territory Properties Units Square Feet Fair Value2018 Acquisitions:Arizona 13 6,943 758,623 $ 74,168Kansas 13 4,443 548,415 59,876Florida 5 2,893 322,111 32,483Missouri 4 2,000 235,300 28,175North Carolina 4 2,296 285,975 39,596California 2 895 102,207 15,741Nevada 2 837 108,065 11,172Oregon 2 486 63,805 8,137Texas 2 956 125,087 9,549Other(1) 10 6,411 662,175 77,752Total 57 28,160 3,211,763 356,649
(1) Self storage properties in other states and territories acquired during the year ended December 31, 2018 include Georgia, Maryland, Ohio,Washington, and Puerto Rico.
During the year ended December 31, 2018, we sold two self storage properties to unrelated third parties for $5.5million. The self storage properties comprised approximately 0.1 million rentable square feet configured inapproximately 1,500 storage units.
Our Unconsolidated Real Estate Ventures
We seek to opportunistically partner with institutional funds and other institutional investors to acquireattractive portfolios utilizing a promoted return structure. We believe there is significant opportunity for continuedexternal growth by partnering with institutional investors seeking to deploy capital in the self storage industry.
2018 Joint Venture
As of December 31, 2019, our 2018 Joint Venture (as defined in Note 5 to the consolidated financial statementsin Item 8), in which we have a 25% ownership interest, owned and operated 103 self storage properties containingapproximately 7.7 million rentable square feet, configured in over 63,000 storage units and located across 17 states.
2016 Joint Venture
As of December 31, 2019, our 2016 Joint Venture, in which we have a 25% ownership interest, owned andoperated a portfolio of 72 properties containing approximately 4.9 million rentable square feet, configured inapproximately 40,000 storage units and located across 13 states. During the year ended December 31, 2019, our2016 Joint Venture sold to the Company one self storage property for $4.1 million, comprising less than 0.1 millionrentable square feet, configured in approximately 300 storage units.
Our Property Management Platform
Through our property management platform, branded iStorage, we direct, manage and control the day-to-dayoperations and affairs of certain consolidated properties and our unconsolidated real estate ventures. We earn certaincustomary fees for managing and operating the properties in the unconsolidated real estate ventures and we facilitatetenant insurance and/or tenant warranty protection programs for tenants at these properties in exchange for half of allproceeds from such programs. Over time, as PROs retire, we may we transfer management of all or part of anexisting PRO's managed portfolio to our or another PRO's property management platform.
Table of Contents
9

As of December 31, 2019, our property management platform managed and controlled 42 of our consolidatedproperties in select markets in California, Illinois, Kansas, Maryland, Missouri, Ohio, Texas and Virginia.
Our Competitive Strengths
We believe our unique PRO structure combined with our property management platform allows us todifferentiate ourselves from other self storage operators, and the following competitive strengths enable us toeffectively compete against our industry peers:
High Quality Properties in Key Growth Markets. We held ownership interests in and operated ageographically diversified portfolio of 742 self storage properties, located in 35 states and Puerto Rico, comprisingapproximately 47.1 million rentable square feet, configured in approximately 378,000 storage units as ofDecember 31, 2019. Over 75% of our consolidated portfolio is located in the top 100 MSAs, based on our 2019 netoperating income ("NOI"). We believe that these properties are primarily located in high quality growth markets thathave attractive supply and demand characteristics and are less sensitive to the fluctuations of the general economy.Many of these markets have multiple barriers to entry against increased supply, including zoning restrictions againstnew construction and new construction costs that we believe are higher than our properties' fair market value.Furthermore, we believe that our significant size and the overall geographic diversification of our portfolio reducesrisks associated with specific local or regional economic downturns or natural disasters.
Differentiated, Growth-Oriented Strategy Focused on Established Operators. We are a self storage REITwith a unique structure that supports our differentiated external growth strategy. Our PRO structure appeals tooperators who are looking for access to growth capital while maintaining an economic stake in the self storageproperties that each manages on the Company's behalf. These attributes entice operators to join the Company ratherthan sell their properties for cash consideration. Through our PRO structure, we seek to attract operators who areconfident in the future performance of their properties and desire to participate in the growth of the Company. Wehave successfully recruited established operators across the United States with a history of efficient propertymanagement and a track record of successful acquisitions. Our structure and differentiated strategy have enabled usto build a substantial captive pipeline from existing operators as well as potentially create external growth from therecruitment of additional PROs.
Integrated Platform Utilizing Advanced Technology for Enhanced Operational Performance and BestPractices. Our national platform allows us to capture cost savings through integration and centralization, therebyeliminating redundancies and utilizing economies of scale across the property management platforms of us and ourPROs. As compared to a stand-alone operator, our national platform has greater access to lower-cost capital, reducedInternet marketing costs per customer lead, discounted property insurance expense, and reduced overhead costs. Inaddition, the Company has sufficient scale for various centralized functions, including financial reporting, theoperation of call centers, expanding cell tower leasing, a national credit card processing program, marketing,information technology, legal support, and capital market functions, to achieve substantial cost savings over smaller,individual operators.
Our national platform utilizes advanced technology for our data warehouse program, Internet marketing, ourcentralized call centers, financial and property analytic dashboards, revenue optimization analytics and expensemanagement tools to enhance operational performance. These centralized programs, which are run through ourTechnology and Best Practices Group, are positively impacting our business performance, and we believe that theywill continue to be a driver of organic growth going forward. We will continue to utilize our Technology and BestPractices Group to help us benefit from the collective sharing of key operating strategies among our PROs in areaslike human resource management, local marketing and operating procedures and building tenant insurance-relatedarrangements.
Aligned Incentive Structure with Shareholder Downside Protection. Our structure promotes operatoraccountability as subordinated performance units issued to our PROs in exchange for the contribution of theirproperties are entitled to distributions only after those properties satisfy minimum performance thresholds. In theevent of a material reduction in operating cash flow, distributions on our subordinated performance units will bereduced before or disproportionately to distributions on our common shares held by our common shareholders. Inaddition, we expect our PROs will generally co-invest subordinated equity in the form of subordinated performanceunits in each acquisition that they source from a third-party seller, and the value of these subordinated performanceunits will fluctuate with the performance of their managed portfolios. Therefore, our PROs are incentivized to selectacquisitions that are expected to exceed minimum performance thresholds, thereby increasing the value of their
Table of Contents
10

subordinated equity stake. We expect that our shareholders will benefit from the higher levels of propertyperformance that our PROs are incentivized to deliver.
Our Business and Growth Strategies
By capitalizing on our competitive strengths, we seek to increase scale, achieve optimal revenue-producingoccupancy and rent levels, and increase long-term shareholder value by achieving sustainable long-term growth. Ourbusiness and growth strategies to achieve these objectives are as follows:
Maximize Property Level Cash Flow. We strive to maximize the cash flows at our properties by leveragingthe economies of scale provided by our national platform, including through the implementation of new ideasderived from our Technology and Best Practices Group. We believe that our unique PRO structure, centralizedinfrastructure and efficient national platform will enable us to achieve optimal market rents and occupancy, reduceoperating expenses and increase the sale by our PROs of ancillary products and services, including tenant insurance,of which we receive a portion of the proceeds, truck rentals and packing supplies.
Acquire Built-in Captive Pipeline of Target Properties from Existing PROs. We have an attractive, highquality potential acquisition pipeline (our "captive pipeline") of approximately 140 self storage properties valued atapproximately $1.4 billion that will continue to drive our future growth. We consider a property to be in our captivepipeline if it (i) is under a management service agreement with one of our PROs, (ii) meets our property qualitycriteria, and (iii) is either required to be offered to us under the applicable facilities portfolio management agreementor a PRO has a reasonable basis to believe that the controlling owner of the property intends to sell the property inthe next seven years.
Our PROs have management service agreements with all of the properties in our captive pipeline and holdcontrolling and non-controlling ownership interests in some of these properties. With respect to each property in ourcaptive pipeline in which a PRO holds a controlling ownership interest, such PRO has agreed that it will not transfer(or permit the transfer of, to the extent possible) any interest in such self storage property without first offering orcausing to be offered (if permissible) such interest to us. In addition, upon maturity of the outstanding mortgageindebtedness encumbering such property, so long as occupancy is consistent with or exceeds average local marketlevels, which we determine in our sole discretion, such PRO has agreed to offer or cause to be offered (ifpermissible) such interest to us. With respect to captive pipeline properties in which our PROs have a non-controlling ownership interest or no ownership interest, each PRO has agreed to use commercially reasonable goodfaith efforts to facilitate our purchase of such property. We preserve the discretion to accept or reject any of theproperties that our PROs are required to, or elect to, offer (or cause to be offered) to us.
Access Additional Off-Market Acquisition Opportunities. Our PROs and their "on-the-ground" personnelhave established an extensive network of industry relationships and contacts in their respective markets. Throughthese local connections, our PROs are able to access acquisition opportunities that are not publicly marketed or soldthrough auctions. Our structure incentivizes our PROs to source acquisitions in their markets from third-party sellersand consolidate these properties into the Company. Other public self storage companies generally have acquisitionteams located at their central offices, which in many instances are far removed from regional and local markets. Webelieve our operators' networks and close familiarity with the other operators in their markets provide us clearcompetitive advantages in identifying and selecting attractive acquisition opportunities. Our PROs have sourced265 acquisitions from third-party sellers comprising approximately 18.0 million rentable square feet as ofDecember 31, 2019.
Recruit Additional New PROs in Target Markets. We intend to continue to execute on our external growthstrategy through additional acquisitions and contributions from future PROs in key markets. We believe there issignificant opportunity for growth through consolidation of the highly fragmented composition of the market. Webelieve that future operators will be attracted to our unique structure, providing them with lower cost of capital,better economies of scale, and greater operational and overhead efficiencies while preserving their existing propertymanagement platforms. We intend to add one to three additional PROs to complement our existing geographicfootprint and to achieve our goal of creating a highly diversified nationwide portfolio of properties focused in the top100 MSAs. When considering a PRO candidate, we consider various factors, including the size of the potentialPRO's portfolio, the quality and location of its properties, its market exposure, its operating expertise, its ability togrow its business, and its reputation with industry participants.
Strategic Joint Venture Arrangements. We intend to continue to opportunistically partner with institutionalfunds and other institutional investors to acquire attractive portfolios utilizing a promoted return structure. We
Table of Contents
11

believe there is significant opportunity for continued external growth by partnering with institutional investorsseeking to deploy capital in the self storage industry. We intend to leverage our property management platform toprovide property and asset management services for future strategic joint ventures, generating additional operatingprofits and third party fee income.
Our Financing Strategy
We expect to maintain a flexible approach in financing new property acquisitions. In general, we expect to fundour property acquisitions through a combination of borrowings under bank credit facilities (including term loans andrevolving facilities), property-level debt, issuances of OP equity and public and private equity and debt issuances.
As of December 31, 2019, our unsecured credit facility provided for total borrowings of $1.275 billion (the"credit facility"). The credit facility consists of the following components: (i) a revolving line of credit (the"Revolver") which provides for a total borrowing commitment up to $500.0 million, under which we may borrow,repay and re-borrow amounts, (ii) a $125.0 million tranche A term loan facility (the "Term Loan A"), (iii) a $250.0million tranche B term loan facility (the "Term Loan B"), (iv) a $225.0 million tranche C term loan facility (the"Term Loan C"), and (v) a $175.0 million tranche D term loan facility (the "Term Loan D"). As of December 31,2019, we had the entire amounts drawn on Term Loan A, Term Loan B, Term Loan C and Term Loan D and we hadno outstanding borrowings under the Revolver, and the capacity to borrow an additional $494.3 million under theRevolver while remaining in compliance with the credit facility's financial covenants. As of December 31, 2019, wehave an expansion option under the credit facility, which, if exercised in full, would provide for a total credit facilityof $1.750 billion.
We have a credit agreement with a syndicated group of lenders for a term loan facility that matures in June 2023(the "2023 Term Loan Facility") and is separate from the credit facility in an aggregate amount of $175.0 million. Asof December 31, 2019 the entire amount was outstanding under the 2023 Term Loan Facility with an effectiveinterest rate of 2.83%. We have an expansion option under the 2023 Term Loan Facility, which, if exercised in full,would provide for total borrowings in an aggregate amount of $400.0 million.
We have a credit agreement with a lender for a term loan facility that matures in December 2028 (the "2028Term Loan Facility") and is separate from the credit facility and 2023 Term Loan Facility in an aggregate amount of$75.0 million. As of December 31, 2019 the entire amount was outstanding under the 2028 Term Loan Facility withan effective interest rate of 4.62%. We have an expansion option under the 2028 Term Loan Facility, which, ifexercised in full, would provide for total borrowings in an aggregate amount up to $125.0 million.
On April 24, 2019, we entered into a credit agreement with a lender for a term loan facility that matures in April2029 (the "2029 Term Loan Facility") and is separate from the credit facility, 2023 Term Loan Facility and 2028Term Loan Facility in an aggregate amount of $100.0 million. As of December 31, 2019 the entire amount wasoutstanding under the 2029 Term Loan Facility with an effective interest rate of 4.27%.
The credit facility, 2023 Term Loan Facility, 2028 Term Loan Facility and 2029 Term Loan Facility eachcontain the same financial covenants and customary affirmative and negative covenants that, among other things,could limit the Company's ability to make distributions or certain investments, incur debt, incur liens and enter intocertain transactions.
On August 30, 2019, our operating partnership issued $100.0 million of 3.98% senior unsecured notes dueAugust 30, 2029 (the "2029 Senior Unsecured Notes") and $50.0 million of 4.08% senior unsecured notes dueAugust 30, 2031 (the "2031 Senior Unsecured Notes" and together with the 2029 Senior Unsecured Notes, the"Senior Unsecured Notes") in a private placement to certain institutional accredited investors. The Senior UnsecuredNotes are subject to customary affirmative and negative covenants that, among other things, limit the Company'sability to make distributions or certain investments, incur debt, incur liens and enter into certain transactions.
We expect to employ leverage in our capital structure in amounts determined from time to time by our board oftrustees. Although our board of trustees has not adopted a policy which limits the total amount of indebtedness thatwe may incur, it will consider a number of factors in evaluating our level of indebtedness from time to time, as wellas the amount of such indebtedness that will be either fixed and variable-rate, and in making financial decisions,including, among others, the following:
• the interest rate of the proposed financing;
• the extent to which the financing impacts our flexibility in managing our properties;
Table of Contents
12

• prepayment penalties and restrictions on refinancing;
• the purchase price of properties we acquire with debt financing;
• our long-term objectives with respect to the financing;
• our target investment returns;
• the ability of particular properties, and the Company as a whole, to generate cash flow sufficient to cover expected debt service payments;
• overall level of consolidated indebtedness;
• timing of debt maturities;
• provisions that require recourse and cross-collateralization;
• corporate credit ratios including debt service coverage, debt to total market capitalization and debt to undepreciated assets; and
• the overall ratio of fixed- and variable-rate debt.
Our indebtedness may be recourse, non-recourse or cross-collateralized. If the indebtedness is non-recourse, thecollateral will be limited to the particular properties to which the indebtedness relates. In addition, we may invest inproperties subject to existing loans secured by mortgages or similar liens on our properties, or may refinanceproperties acquired on a leveraged basis. We may use the proceeds from any borrowings to refinance existingindebtedness, to refinance investments, including the redevelopment of existing properties, for general workingcapital or for other purposes when we believe it is advisable.
Dividend Reinvestment Plan
In the future, we may adopt a dividend reinvestment plan that will permit shareholders who elect to participatein the plan to have their cash dividends reinvested in additional common shares.
Regulation
General
Generally, self storage properties are subject to various laws, ordinances and regulations, including thoserelating to lien sale rights and procedures, public accommodations, insurance, and the environment. Changes in anyof these laws, ordinances or regulations could increase the potential liability existing or created by tenants or otherson our properties. Laws, ordinances, or regulations affecting development, construction, operation, upkeep, safetyand taxation requirements may result in significant unanticipated expenditures, loss of self storage sites or otherimpairments to operations, which would adversely affect our cash flows from operating activities.
Under the Americans with Disabilities Act of 1990 (the "ADA"), all places of public accommodation arerequired to meet certain federal requirements related to access and use by disabled persons. For additionalinformation on the ADA, see "Item 1A. Risk Factors—Risks Related to Our Business—Costs associated withcomplying with the ADA may result in unanticipated expenses."
Insurance activities are subject to state insurance laws and regulations as determined by the particular insurancecommissioner for each state in accordance with the McCarran-Ferguson Act, as well as subject to the Gramm-Leach-Bliley Act and the privacy regulations promulgated by the Federal Trade Commission pursuant thereto.
Under the Comprehensive Environmental Response Compensation and Liability Act of 1980, as amended("CERCLA"), and comparable state laws, we may be required to investigate and remediate regulated hazardousmaterials at one or more of our properties. For additional information on environmental matters and regulation, see"Item 1A. Risk Factors—Risks Related to Our Business—Environmental compliance costs and liabilities associatedwith operating our properties may affect our results of operations."
Property management activities are often subject to state real estate brokerage laws and regulations asdetermined by the particular real estate commission for each state.
Table of Contents
13

REIT Qualification
We have elected and we believe that we have qualified to be taxed as a REIT under the Internal Revenue Codeof 1986, as amended, (the "Code"), commencing with our taxable year ended on December 31, 2015. We generallywill not be subject to U.S. federal income tax on our net taxable income to the extent that we distribute annually allof our net taxable income to our shareholders and maintain our qualification as a REIT. We believe that we havebeen organized and have operated in conformity with the requirements for qualification and taxation as a REITunder the Code, and we expect that our intended manner of operation will enable us to continue to meet therequirements for qualification and taxation as a REIT. To qualify, and maintain our qualification, as a REIT, wemust meet on a continuing basis, through our organization and actual investment and operating results, variousrequirements under the Code relating to, among other things, the sources of our gross income, the composition andvalues of our assets, our distribution levels and the diversity of ownership of our shares. If we fail to qualify as aREIT in any taxable year and do not qualify for certain statutory relief provisions, we will be subject to U.S. federalincome tax at regular corporate rates and may be precluded from qualifying as a REIT for the subsequent fourtaxable years following the year during which we failed to qualify as a REIT. Even if we qualify for taxation as aREIT, we still may be subject to some U.S. federal, state and local taxes on our income or assets. In addition, subjectto maintaining our qualification as a REIT, a portion of our business is conducted through, and a portion of ourincome is earned by, one or more taxable REIT subsidiaries ("TRSs"), which are subject to U.S. federal corporateincome tax at regular rates. Distributions paid by us generally will not be eligible for taxation at the preferential U.S.federal income tax rates that currently apply to certain distributions received by individuals from taxablecorporations, unless such distributions are attributable to dividends received by us from a TRS.
U.S. Federal Income Tax Legislation
On December 22, 2017, Congress enacted H.R. 1, also known as the Tax Cuts and Jobs Act of 2017 ("TCJA").The TCJA made major changes to the Internal Revenue Code, including the reduction of the tax rates applicable toindividuals and subchapter C corporations, a reduction or elimination of certain deductions (including newlimitations on the deductibility of interest expense), permitting immediate expensing of capital expenditures andsignificant changes in the taxation of earnings from non-U.S. sources. The effect of the significant changes made bythe TCJA remains uncertain, and additional administrative guidance is still required in order to fully evaluate theeffect of many provisions. In addition, final regulations implementing certain of these new rules have not yet beenissued and additional changes or corrections may still be forthcoming. While we do not currently expect this reformto have a significant impact to the Company's consolidated financial statements, stockholders are urged to consultwith their tax advisors regarding the effects of the TCJA or other legislative, regulatory or administrativedevelopments on an investment in the Company's common stock.
Competition
We compete with many other entities engaged in real estate investment activities for customers and acquisitionsof self storage properties and other assets, including national, regional, and local owners, operators, and developersof self storage properties. We compete based on a number of factors including location, rental rates, security,suitability of the property's design to prospective tenants' needs, and the manner in which the property is operatedand marketed. We believe that the primary competition for potential customers comes from other self storageproperties within a three to five mile radius. We have positioned our properties within their respective markets ashigh-quality operations that emphasize tenant convenience, security, and professionalism.
We also may compete with numerous other potential buyers when pursuing a possible property for acquisition,which can increase the potential cost of a project. These competing bidders also may possess greater resources thanus and therefore be in a better position to acquire a property. However, our use of OP units and subordinatedperformance units as transactional currency allows us to structure our acquisitions in tax-deferred transactions. As aresult, potential targets who are tax-sensitive might favor us as a suitor.
Our primary national competitors in many of our markets for both tenants and acquisition opportunities includelocal and regional operators, institutional investors, private equity funds, as well as the other public self storageREITs, including Public Storage, CubeSmart, Extra Space Storage Inc. and Life Storage, Inc. These entities alsoseek financing through similar channels to the Company. Therefore, we will continue to compete for institutionalinvestors in a market where funds for real estate investment may decrease.
Table of Contents
14

Employees
As of December 31, 2019, the Company had 459 employees, which includes employees of our propertymanagement platform but does not include persons employed by our PROs. As of December 31, 2019, our PROs,collectively, had approximately 1,100 full-time and part-time employees involved in management, operations, andreporting with respect to our self storage property portfolio.
Available Information
We file registration statements, proxy statements, our Annual Report on Form 10-K, Quarterly Reports onForm 10-Q, Current Reports on Form 8-K, and all amendments to those statements and reports with the Securitiesand Exchange Commission (the "SEC"). Investors may obtain copies of these statements and reports by accessingthe SEC's website at www.sec.gov. Our statements and reports and any amendments to any of those statements andreports that we file with the Securities and Exchange Commission are available free of charge as soon as reasonablypracticable on our website at www.nationalstorageaffiliates.com. The information contained on our website is notincorporated into this Annual Report on Form 10-K. Our common shares are listed on the New York StockExchange under the symbol "NSA."
Item 1A. Risk Factors
An investment in our common shares involves a high degree of risk. Before making an investment decision, youshould carefully consider the following risk factors, together with the other information contained in this AnnualReport on Form 10-K. If any of the risks discussed in this Annual Report on Form 10-K occurs, our business,financial condition, liquidity and results of operations could be materially and adversely affected.
Risks Related to Our Business
Adverse economic or other conditions in the markets in which we do business and more broadly associated withthe real estate industry could negatively affect our occupancy levels and rental rates and therefore our operatingresults and the value of our self storage properties.
Our operating results are dependent upon our ability to achieve optimal occupancy levels and rental rates at ourself storage properties. Adverse economic or other conditions in the markets in which we do business, particularly inour markets in California, Oregon, Florida, Texas, Georgia, Arizona and North Carolina, which accounted forapproximately 22%, 11%, 10%, 10%, 6%, 6% and 5%, respectively, of our total rental and other property-relatedrevenues for the year ended December 31, 2019, may lower our occupancy levels and limit our ability to maintain orincrease rents or require us to offer rental discounts. No single customer represented a significant concentration ofour 2019 revenues. The following adverse developments, among others, in the markets in which we do business mayadversely affect the operating performance of our properties:
• business layoffs or downsizing, industry slowdowns, relocation of businesses and changing demographics;
• periods of economic slowdown or recession, declining demand for self storage or the public perception that any of these events may occur;
• local or regional real estate market conditions, such as competing properties or products, the oversupply of self storage, vacancies or changes in self storage space market rents, or a reduction in demand for self storage in a particular area; and
• perceptions by prospective tenants of the safety, convenience and attractiveness of our properties and the neighborhoods in which they are located.
We are also susceptible to the effects of adverse macro-economic events and business conditions that can resultin higher unemployment, shrinking demand for products, large-scale business failures and tight credit markets. Ourresults of operations are sensitive to changes in overall economic conditions that impact consumer spending,including discretionary spending, as well as to increased bad debts due to recessionary pressures. Adverse economicconditions affecting disposable consumer income, such as employment levels, business conditions, interest rates andthe availability of financing, tax rates, fuel and energy costs, could reduce consumer spending or cause consumers toshift their spending to other products and services. A general reduction in the level of discretionary spending orshifts in consumer discretionary spending could adversely affect our growth and profitability. Our operating resultsand cash available for distribution could also be adversely impacted if we experience increased operating costs,including maintenance, insurance premiums and real estate taxes, whether due to economic conditions, government
Table of Contents
15

regulation or otherwise. In addition, our operating expenses, including taxes, insurance, maintenance and debtservice payments, may not be reduced even if we experience a reduction in revenues, which may exacerbate theimpact on our profitability.
We may not be successful in identifying and consummating suitable acquisitions, adding additional suitable newPROs, or integrating and operating such acquisitions, including integrating them into our financial andoperational reporting infrastructure and internal control framework in a timely manner, which may impede ourgrowth.
Our ability to expand through acquisitions is integral to our business strategy and requires us to identify suitableacquisition candidates or investment opportunities that meet our criteria and are compatible with our growthstrategy. We may not be successful in identifying suitable properties or other assets that meet our acquisition criteriaor in consummating acquisitions on satisfactory terms or at all. Failure to identify or consummate acquisitions willslow our growth, which could in turn adversely affect our share price.
For the potential acquisitions in our captive pipeline, we have not entered into negotiations with the respectiveowners of these properties and there can be no assurance as to whether we will acquire any of these properties or theactual timing of any such acquisitions. Each captive pipeline property is subject to additional due diligence and thedetermination by us to pursue the acquisition of the property. In addition, with respect to the captive pipelineproperties in which our PROs have a non-controlling ownership interest or no ownership interest, the current ownerof each property is not required to offer such property to us and there can be no assurance that we will acquire theseproperties.
Our ability to acquire properties on favorable terms and successfully integrate and operate them, includingintegrating them into our financial and operational reporting infrastructure in a timely manner, may be constrainedby the following significant risks:
• we face competition from national (e.g., large public and private self storage companies, institutional investors and private equity funds), regional and local owners, operators and developers of self storage properties, which may result in higher property acquisition prices and reduced yields;
• we may not be able to achieve satisfactory completion of due diligence investigations and other customary closing conditions;
• we may fail to finance an acquisition on favorable terms or at all;
• we may spend more time and incur more costs than budgeted to make necessary improvements or renovations to acquired properties;
• we may experience difficulties in effectively integrating the financial and operational reporting systems of the properties or portfolios we acquire into (or supplanting such systems with) our financial and operational reporting infrastructure and internal control framework in a timely manner; and
• we may acquire properties subject to liabilities without any recourse, or with only limited recourse, with respect to unknown liabilities such as liabilities for clean-up of undisclosed environmental contamination, tax liabilities, claims by persons dealing with the former owners of the properties and claims for indemnification by general partners, trustees, officers and others indemnified by the former owners of the properties. The sellers or contributors of properties may make limited representations and warranties to us about the properties and may agree to indemnify us for a certain period of time following the closing for breaches of those representations and warranties. However, any resulting liabilities identified may not fall within the scope or time frame covered by the indemnification, and we may be required to bear those liabilities, which may materially and adversely affect our operating results, financial condition and business.
We face competition for tenants.
We compete with many other entities engaged in real estate investment activities for tenants, including national,regional and local owners, operators and developers of self storage properties. Our primary national competitors fortenants in many of our markets are the large public and private self storage companies, institutional investors, andprivate equity funds. Actions by our competitors may decrease or prevent increases in the occupancy and rentalrates, while increasing the operating expenses of our properties.
Table of Contents
16

Rental revenues are significantly influenced by demand for self storage space generally, and a decrease in suchdemand would likely have a greater adverse effect on our rental revenues than if we owned a more diversifiedreal estate portfolio.
Because our portfolio of properties consists primarily of self storage properties, we are subject to risks inherentin investments in a single industry. A decrease in the demand for self storage space would have a greater adverseeffect on our rental revenues than if we owned a more diversified real estate portfolio. Demand for self storage spacehas been and could be adversely affected by weakness in the national, regional and local economies, changes insupply of, or demand for, similar or competing self storage properties in an area and the excess amount of selfstorage space in a particular market. To the extent that any of these conditions occur, they are likely to affect marketrents for self storage space, which could cause a decrease in our rental revenue. Any such decrease could impair ouroperating results, ability to satisfy debt service obligations and ability to make cash distributions to our shareholders.
Increases in taxes and regulatory compliance costs may reduce our income and adversely impact our cash flows.
Increases in income or other taxes generally are not passed through to tenants under leases and may reduce ournet income, funds from operations ("FFO"), cash flows, financial condition, ability to pay or refinance our debtobligations, ability to make cash distributions to shareholders, and the trading price of our securities. Similarly,changes in laws increasing the potential liability for environmental conditions existing on properties or increasingthe restrictions on discharges or other conditions may result in significant unanticipated expenditures, which couldresult in similar adverse effects.
Many states and jurisdictions are facing severe budgetary problems. Action that may be taken in response tothese problems, such as changes to sales taxes or other governmental efforts, including mandating medical insurancefor employees, could adversely impact our business and results of operations.
Our property taxes could increase due to various reasons, including changes in law and a reassessment as aresult of our contribution transactions, which could adversely impact our operating results and cash flow.
The value of our properties may be reassessed for property tax purposes by taxing authorities including as aresult of our acquisition and contribution transactions. Our property taxes could also increase due to changes in taxrates or removal of limitations on the amount by which our property taxes or property reassessments may increase.For example, there is a vote to remove certain Proposition 13 protections in the State of California for owners ofcommercial real estate, including self storage properties, which will be included on California's November 2020ballot. Proposition 13 currently limits annual real estate tax increases of assessed value of real property. If the voteto remove these protections is successful, it would increase the assessed value and/or tax rates applicable tocommercial property in California, including self storage properties. We currently have 83 consolidated propertiesand 10 unconsolidated properties in California. Accordingly, the amount of property taxes we pay in the future mayincrease substantially from what we have paid in the past or from what we expected in connection with ourunderwriting activities. If the property taxes we pay increase, our operating results and cash flow would be adverselyimpacted, and our ability to pay any expected dividends to our shareholders could be adversely affected.
Our storage leases are relatively short-term in nature, which exposes us to the risk that we may have to re-leaseour units and we may be unable to do so on attractive terms, on a timely basis or at all.
Our storage leases are relatively short-term in nature, typically month-to-month, which exposes us to the riskthat we may have to re-lease our units frequently and we may be unable to do so on attractive terms, on a timelybasis or at all. Because these leases generally permit the tenant to leave at the end of the month without penalty, ourrevenues and operating results may be impacted by declines in market rental rates more quickly than if our leaseswere for longer terms. In addition, any delay in re-leasing units as vacancies arise would reduce our revenues andharm our operating results.
Security breaches through cyber-attacks, cyber-intrusions, or other methods could disrupt our informationtechnology networks and related systems.
We and our PROs are increasingly dependent upon automated information technology processes and Internetcommerce, and many of our and their tenants come from the telephone or over the Internet. Moreover, the nature ofour and our PROs' business involves the receipt and retention of certain personal information about such tenants. Inmany cases, we and our PROs also rely significantly on third-party vendors to retain data, process transactions andprovide other systems services. Our networks and operations could be disrupted, and sensitive data could becompromised, by physical or electronic security breaches, targeted against us, our PROs, our vendors or other
Table of Contents
17

organizations, including financial markets or institutions, including by way of or through cyber-attacks or cyber-intrusions over the Internet, malware, computer viruses, attachments to e-mails, phishing, employee theft or misuse,or inadequate security controls. Although we make efforts to protect the security and integrity of our networks andsystems, there can be no assurance that these efforts and measures will be effective or that attempted securitybreaches or disruptions would not be successful, as such attacks and breaches may be difficult to detect (or notdetected at all) and are becoming more sophisticated. In such event, we may experience business interruptions; dataloss, ransom, misappropriation, or corruption; theft or misuse of confidential or proprietary information; or litigationand investigation by tenants, governmental or regulatory agencies, or other third parties, which could result in thepayment of fines, penalties and other damages. Such events could also have other adverse impacts on us, includingbreaches of debt covenants or other contractual or REIT compliance obligations, late or misstated financial reports,and significant diversion of management attention and resources. As a result, such events could have a materialadverse effect on our financial condition, results of operations and cash flows and harm our business reputation orhave such effects on our PROs.
We may become subject to litigation or threatened litigation that may divert management's time and attention,require us to pay damages and expenses or restrict the operation of our business.
We may become subject to disputes, including class or collective actions, with customers (or prospectivecustomers), employees, commercial parties with whom we maintain relationships or other parties with whom we dobusiness or have interacted. Any such dispute could result in litigation between us and the other parties. Whether ornot any dispute actually proceeds to litigation, we may be required to devote significant management time andattention to its successful resolution (through litigation, settlement or otherwise), which would detract from ourmanagement's ability to focus on our business. Any such resolution could involve the payment of damages orexpenses by us, which may be significant and may not be covered by insurance. In addition, any such resolutioncould involve our agreement with terms that restrict the operation of our business.
There are other commercial parties, at both a local and national level, that may assert that our use of our brandnames and other intellectual property conflict with their rights to use brand names and other intellectual propertythat they consider to be similar to ours. Any such commercial dispute and related resolution would involve all of therisks described above, including, in particular, our agreement to restrict the use of our brand name or otherintellectual property.
We also could be sued for personal injuries and/or property damage occurring on our properties. The liabilityinsurance we maintain may not cover all costs and expenses arising from such lawsuits.
The acquisition of new properties that lack operating history with us will make it more difficult to predict ouroperating results.
With respect to acquisitions, if we fail to accurately estimate occupancy levels, rental rates, operating costs orcosts of improvements to bring an acquired property up to the standards established for our intended marketposition, the performance of the property may be below expectations. Acquired properties may have characteristicsor deficiencies affecting their valuation or profitability potential that we have not yet discovered. We cannot assurethat the performance of properties acquired by us will increase or be maintained following our acquisition.
Costs associated with complying with the ADA may result in unanticipated expenses.
Under the ADA, places of public accommodation are required to meet certain federal requirements related toaccess and use by disabled persons. A number of additional U.S. federal, state and local laws may also requiremodifications to our properties, or restrict certain further renovations of the properties, with respect to access theretoby disabled persons. Noncompliance with the ADA could result in the imposition of fines or an award of damages toprivate litigants and also could result in an order to correct any non-complying feature, which could result insubstantial capital expenditures. If one or more of our properties is not in compliance with the ADA or otherlegislation, then we would be required to incur additional costs to bring the property into compliance. If we incursubstantial costs to comply with the ADA or other legislation, our financial condition, results of operations, cashflow, per share trading price of our common shares and our ability to satisfy our debt service obligations and tomake cash distributions to our shareholders could be adversely affected.
Table of Contents
18

Environmental compliance costs and liabilities associated with operating our properties may affect our results ofoperations.
Under various U.S. federal, state and local laws, ordinances and regulations, owners and operators of real estatemay be liable for the costs of investigating and remediating certain hazardous substances or other regulated materialson or in such property. CERCLA and comparable state laws typically impose strict joint and several liabilitieswithout regard to whether the owner or operator knew of, or was responsible for, the presence of such substances ormaterials. The presence of such substances or materials, or the failure to properly remediate such substances, mayadversely affect the owner's or operator's ability to lease, sell or rent such property or to borrow using such propertyas collateral. Persons who arrange for the disposal or treatment of hazardous substances or other regulated materialsmay be liable for the costs of removal or remediation of such substances at a disposal or treatment facility, whetheror not such facility is owned or operated by such person. Certain environmental laws impose liability for release ofasbestos-containing materials into the air and third-parties may seek recovery from owners or operators of realproperties for personal injury associated with asbestos-containing materials.
Certain environmental laws also impose liability, without regard to knowledge or fault, for removal orremediation of hazardous substances or other regulated materials upon owners and operators of contaminatedproperty even after they no longer own or operate the property. Moreover, the past or present owner or operator of aproperty from which a release emanates could be liable for any personal injuries or property damages that may resultfrom such releases, as well as any damages to natural resources that may arise from such releases.
Certain environmental laws impose compliance obligations on owners and operators of real property withrespect to the management of hazardous materials and other regulated substances. For example, environmental lawsgovern the management of asbestos-containing materials and lead-based paint. Failure to comply with these lawscan result in penalties or other sanctions.
In connection with the ownership, operation and management of our current or past properties and anyproperties that we may acquire and/or manage in the future, we could be legally responsible for environmentalliabilities or costs relating to a release of hazardous substances or other regulated materials at or emanating fromsuch property. In order to assess the potential for such liability, we conduct an environmental assessment of eachproperty prior to acquisition and manage our properties in accordance with environmental laws while we own oroperate them. We have engaged qualified, reputable and adequately insured environmental consulting firms toperform environmental site assessments of all of our properties prior to acquisition and are not aware of anyenvironmental issues that are expected to materially impact the operations of any property.
No assurances can be given that existing environmental studies with respect to any of our properties reveal allenvironmental liabilities, that any prior owner or operator of our properties did not create any materialenvironmental condition not known to us, or that a material environmental condition does not otherwise exist as toany one or more of our properties. There also exists the risk that material environmental conditions, liabilities orcompliance concerns may have arisen after the review was completed or may arise in the future. Finally, future laws,ordinances or regulations and future interpretations of existing laws, ordinances or regulations may imposeadditional material environmental liability.
We rely on on-site personnel to maximize tenant satisfaction at each of our properties, and any difficulties we orthey encounter in hiring, training and maintaining skilled on-site personnel may harm our operatingperformance.
The general professionalism of site managers and staff are contributing factors to a site's ability to successfullysecure rentals and retain tenants and we rely on on-site personnel to maintain clean and secure self storageproperties. If we or our PROs are unable to successfully recruit, train and retain qualified on-site personnel, thequality of service we and our PROs strive to provide at our properties could be adversely affected, which could leadto decreased occupancy levels and reduced operating performance of our properties.
We and certain of our PROs have tenant insurance- and/or tenant protection plan-related arrangements that arein some cases subject to state-specific governmental regulation, which may adversely affect our results.
We and certain of our PROs have tenant insurance- and/or tenant protection plan-related arrangements withregulated insurance companies and our tenants. Some of our PROs earn access fees in connection with thesearrangements. We receive a portion of the fees from these PROs. The tenant insurance and tenant protection planbusinesses, including the payments associated with these arrangements, are in some cases subject to state-specific
Table of Contents
19

governmental regulation. State regulatory authorities generally have broad discretion to grant, renew and revokelicenses and approvals, to promulgate, interpret and implement regulations, and to evaluate compliance withregulations through periodic examinations, audits and investigations of the affairs of insurance industry participants.Although these arrangements are managed by our property management platform and/or certain of our PROs whohave developed marketing programs and management procedures to navigate the regulatory environment, as a resultof regulatory or private action in any jurisdiction in which we operate, we may be temporarily or permanentlysuspended from continuing some or all of our tenant insurance- and/or tenant protection plan-related activities, orotherwise fined or penalized or suffer an adverse judgment, which could adversely affect our business and results ofoperations.
Privacy concerns could result in regulatory changes that may harm our business.
Personal privacy has become a significant issue in the jurisdictions in which we operate. Many jurisdictions inwhich we operate have imposed or in the future may impose restrictions and requirements on the use of personalinformation by those collecting such information. For example, the California Consumer Privacy Act of 2018, whichbecame effective as of January 1, 2020, provides consumers with expansive rights and control over personalinformation obtained by or shared with certain covered businesses. Changes to law or regulations or the passage ofnew laws affecting privacy, if applicable to our business, could impose additional costs and liability on us and couldlimit our use and disclosure of such information.
Uninsured losses or losses in excess of our insurance coverage could adversely affect our financial condition,operating results and cash flow.
We maintain comprehensive liability, fire, flood, earthquake, wind (as deemed necessary or as required by ourlenders), extended coverage and rental loss insurance with respect to our properties. Certain types of losses,however, may be either uninsurable or not economically insurable either in total or in part (due to location orotherwise), such as losses due to earthquakes, hurricanes, tornadoes, floods, riots, acts of war or terrorism. Should anuninsured loss occur, we could lose both our investment in and anticipated profits and cash flow from a property. Inaddition, if any such loss is insured, we may be required to pay significant amounts on any claim for recovery ofsuch a loss prior to our insurer being obligated to reimburse us for the loss, or the amount of the loss may exceed ourcoverage for the loss. We currently self-insure a portion of our commercial insurance deductible risk through ourcaptive insurance company. To the extent that our captive insurance company is unable to bear that risk, we may berequired to fund additional capital to our captive insurance company or we may be required to bear that loss. As aresult, our operating results may be adversely affected.
Illiquidity of real estate investments could significantly impede our ability to respond to adverse changes in theperformance of our properties.
Because real estate investments are relatively illiquid, our ability to promptly sell one or more properties in ourportfolio in response to changing economic, financial and investment conditions is limited. The real estate market isaffected by many factors, such as general economic conditions, availability of financing, interest rates and otherfactors, including supply and demand, that are beyond our control. We cannot predict whether we will be able to sellany property for the price or on the terms set by us or whether any price or other terms offered by a prospectivepurchaser would be acceptable to us. We also cannot predict the length of time needed to find a willing purchaserand to close the sale of a property. In addition, we may be required to expend funds to correct defects or to makeimprovements before a property can be sold. We cannot assure you that we will have funds available to correct thosedefects or to make those improvements.
In acquiring a property, we may agree to transfer restrictions that materially restrict us from selling that propertyfor a period of time or impose other restrictions, such as a limitation on the amount of debt that can be placed orrepaid on that property. For example, we are party to certain agreements with our PROs that provide that, untilMarch 31, 2023, our operating partnership shall not, and shall cause its subsidiaries not to, sell, dispose or otherwisetransfer any property that is a part of the applicable self storage property portfolio relating to a series of subordinatedperformance units without the consent of the partners (including us) holding at least 50% of the then outstanding OPunits and the partners holding at least 50% of the then outstanding series of subordinated performance units thatrelate to the applicable property, except for sales, dispositions or other transfers of a property to wholly ownedsubsidiaries of our operating partnership. These restrictions may require us to keep certain properties that we wouldotherwise sell, which could have an adverse effect on our results of operations, financial condition, cash flow andability to execute our business plan.
Table of Contents
20

Our business could be harmed if key personnel terminate their employment with us.
Our success depends, to a significant extent, on the continued services of Arlen D. Nordhagen, Tamara D.Fischer and Brandon S. Togashi and the other members of our senior management team. We have entered intoemployment agreements with Mr. Nordhagen, Ms. Fischer and Mr. Togashi and these employment agreementsprovide for an initial three-year term of employment and automatic one-year extensions thereafter unless either partyprovides at least 90 days' notice of non-renewal. Notwithstanding these agreements, there can be no assurance thatany of them will remain employed by us. The loss of services of one or more members of our senior managementteam could harm our business and our prospects.
We invest in strategic joint ventures that subject us to additional risks.
Some of our investments are, and in the future may be, structured as strategic joint ventures. Part of our strategyis to opportunistically partner with institutional funds and other institutional investors to acquire attractive portfoliosthrough a promoted return structure. These arrangements are driven by the magnitude of capital required to completethe acquisitions and maintain the acquired portfolios. Such arrangements involve risks not present where a thirdparty is not involved, including the possibility that partners or co-venturers might become bankrupt or otherwise failto fund their share of required capital contributions. Additionally, partners or co-venturers might at any time haveeconomic or other business interests or goals different from us and or in competition with us.
Joint ventures generally provide for a reduced level of control over an acquired project because governancerights are shared with others. Accordingly, certain major decisions relating to joint ventures, including decisionsrelating to, among other things, the approval of annual budgets, sales and acquisitions of properties, financings, andcertain actions relating to bankruptcy, are often made by a majority vote of the investors or by separate agreementsthat are reached with respect to individual decisions. In addition, such decisions may be subject to the risk that thepartners or co-venturers may make business, financial or management decisions with which we do not agree or takerisks or otherwise act in a manner that does not serve our best interests. Because we may not have the ability toexercise control over such operations, we may not be able to realize some or all of the benefits that we believe willbe created from our involvement. At times, we and our partners or co-venturers may also each have the right totrigger a buy-sell arrangement, which could cause us to sell our interest, or acquire our partners' or co-venturers'interest, at a time when we otherwise would not have initiated such a transaction. If any of the foregoing were tooccur, our business, financial condition and results of operations could suffer as a result.
Risks Related to Our Structure and Our Relationships with Our PROs
Some of our PROs have limited experience operating under the Company's capital structure, and we may not beable to achieve the desired outcomes that the structure is intended to produce.
Some of our PROs have limited experience operating under our capital structure. As a means of incentivizingour PROs to drive operating performance and support the sustainability of the operating cash flow from theproperties they manage on our behalf, we issued each PRO subordinated performance units aimed at aligning theinterests of our PROs with our interests and those of our shareholders. The subordinated performance units areentitled to distributions exclusively tied to the performance of each PRO's managed portfolios but only afterminimum performance thresholds are satisfied. Our issuance of such units, however, may have been and could bebased on inaccurate valuations and thus misallocated, which would limit or eliminate the effectiveness of ourintended incentive-based program. Moreover, difficulties in aligning incentives and implementing our structurecould allow a PRO to underperform without triggering our right to terminate the applicable facilities portfolio andasset management agreements and transfer management rights of the PRO to us (or a designee) or cause ourmanagement to be distracted from other aspects of our business, which could adversely affect our operating resultsand business.
We are restricted in making certain property sales on account of agreements with our PROs that may require usto keep certain properties that we would otherwise sell.
The partnership unit designations related to our subordinated performance units provide that, until March 31,2023, our operating partnership may not sell, dispose or otherwise transfer any property that is a part of theapplicable self storage property portfolio relating to a series of subordinated performance units without the consentof the partners (including us) holding at least 50% of the then outstanding OP units and the consent of partnersholding at least 50% of the then outstanding series of subordinated performance units that relate to the applicableproperty, except for sales, dispositions or other transfers of a property to wholly owned subsidiaries of our operating
Table of Contents
21

partnership. This restriction may require us to keep certain properties that we would otherwise sell, which couldhave an adverse effect on our results of operations, financial condition, cash flow and ability to execute our businessplan. In addition, we may enter into agreements with future PROs that contain the same or similar restrictions or thatimpose such restrictions for different periods.
Our ability to terminate our facilities portfolio management agreements and asset management agreements witha PRO is limited, which may adversely affect our ability to execute our business plan.
We may elect to terminate our facilities portfolio management agreements and asset management agreementswith a PRO and transfer property management responsibilities over the properties managed by such PRO to us (orour designee), (i) upon certain defaults by a PRO as set forth in these agreements, or (ii) if the PRO's properties, on aportfolio basis, fail to meet certain pre-determined performance thresholds for more than two consecutive calendaryears or if the operating cash flow generated by the properties of the PRO for any calendar year falls below a levelthat will enable us to fund minimum levels of distributions, debt service payments attributable to the properties, andfund the properties' allocable operating expenses. Consequently, to the extent a PRO complies with these covenants,standards, and minimum requirements, we may not be able to terminate the applicable facilities portfoliomanagement agreements and asset management agreements and transfer property management responsibilities oversuch properties even if our board of trustees believes that such PRO is not properly executing our business plan and/or is failing to operate its properties to their full potential. Moreover, transferring the management responsibilitiesover the properties managed by a PRO may be costly or difficult to implement or may be delayed, even if we areable to and believe that such a change in portfolio and property management would be beneficial to us and ourshareholders.
We may less vigorously pursue enforcement of terms of agreements entered into with our PROs because ofconflicts of interest with our PROs.
Our PROs are entities that have contributed or will contribute through contribution agreements, self storageproperties, or legal entities owning self storage properties, to our operating partnership or DownREIT partnerships inexchange for ownership interests in our operating partnership or DownREIT partnerships. As part of eachtransaction, our PROs make and have made limited representations and warranties to our operating partnershipregarding the entities, properties and other assets to be acquired by our operating partnership or DownREITpartnerships in the contribution and generally agree to indemnify our operating partnership for 12 months after theclosing of the contribution for breaches of such representations. Such indemnification is limited, however, and ouroperating partnership is not entitled to any other indemnification in connection with the contributions. In addition,following each contribution from a PRO, the day-to-day operations of each of the managed properties will bemanaged by the PRO who was the principal of the applicable self storage property portfolios prior to thecontribution. In addition, certain key persons of our PROs are members of our board of trustees, members of ourPRO advisory committee or are executive officers of the Company. Consequently, we may choose not to enforce, orto enforce less vigorously, our rights under these agreements and any other agreements with our PROs due to ourdesire to maintain our ongoing relationship with our PROs, which could adversely affect our operating results andbusiness.
We own self storage properties in some of the same geographic regions as our PROs and may compete for tenantswith other properties managed by our PROs.
Pursuant to the facilities portfolio management agreements with our PROs, each PRO has agreed that, withoutour consent, the PRO will not, and it will cause its affiliates not to, enter into any new agreements or arrangementsfor the management of additional self storage properties, other than the properties we are not acquiring and theproperties each PRO contributes to our operating partnership. However, we have not and will not acquire all of theself storage properties of our PROs. We will therefore own self storage properties in some of the same geographicregions as our PROs, and, as a result, we may compete for tenants with our PROs. This competition may affect ourability to attract and retain tenants and may reduce the rental rates we are able to charge, which could adverselyaffect our operating results and business.
Our PROs may engage in other activities, diverting their attention from the management of our properties, whichcould adversely affect the execution of our business plan and our operating results.
Our PROs and their employees and personnel are in the business of managing self storage properties. We haveagreed that our PROs may continue to manage properties not included in our portfolio, and our PROs are notobligated to dedicate any specific employees or personnel exclusively to the management of our properties. As a
Table of Contents
22

result, their time and efforts may be diverted from the management of our properties, which could adversely affectthe execution of our business plan and our operating results.
When a PRO elects or is required to "retire" we may become exposed to new and additional costs and risks.
Under the facilities portfolio management agreements, after a two year period following the later of completionof our initial public offering or the initial contribution of their properties to us, a PRO may elect, or be required, to"retire" from the self storage business. Upon a retirement event, management of the properties will be transferred tous (or our designee) in exchange for OP units with a value equal to four times the average of the normalized annualEBITDA from the management contracts related to such PRO's managed portfolio over the immediately preceding24-month period. As a result of this transfer, we may become exposed to new and additional costs and risks.Accordingly, the retirement of a PRO may adversely effect our financial condition and operating results. Forexample, in connection with a retiring PRO's internalization into the Company, there can be no assurance that theCompany will be able to retain such retiring PRO's employees, successfully hire new employees, or effectivelyintegrate such employees and the retiring PRO's property management platform into the Company's or anotherPRO's property management platforms.
Our formation transactions and subsequent contribution transactions were generally not negotiated on an arm's-length basis and may not be as favorable to us as if they had been negotiated with unaffiliated third parties.
We did not conduct arm's-length negotiations with certain of the parties involved regarding the terms of theformation transactions and subsequent contribution transactions, including the contribution agreements, facilitiesportfolio management agreements, sales commission agreements, asset management agreements and registrationrights agreements. In the course of structuring the formation transactions and subsequent contribution transactions,certain members of our senior management team and other contributors had the ability to influence the type andlevel of benefits that they received from us. Accordingly, the terms of the formation transactions and subsequentcontribution transactions may not solely reflect the best interests of us or our shareholders and may be overlyfavorable to the other party to such transactions and agreements.
Conflicts of interest could arise with respect to certain transactions between the holders of OP units (includingsubordinated performance units), which include our PROs, on the one hand, and us and our shareholders, on theother.
Conflicts of interest could arise with respect to the interests of holders of OP units (including subordinatedperformance units), on the one hand, which include members of our senior management team, PROs, and trustees(including Arlen D. Nordhagen, our executive chairman of the board of trustees and former chief executive officer)and us and our shareholders, on the other. In particular, the consummation of certain business combinations, the sale,disposition or transfer of certain of our assets or the repayment of certain indebtedness that may be desirable to usand our shareholders could have adverse tax consequences to such unit holders. In addition, our trustees and officershave duties to the Company under applicable Maryland law in connection with their management of the Company.At the same time, we have fiduciary duties, as a general partner, to our operating partnership and to the limitedpartners under Delaware law in connection with the management of our operating partnership. Our duties as ageneral partner to our operating partnership and its partners may come into conflict with the duties of our trusteesand officers to the Company and our shareholders. The partnership agreement of our operating partnership does notrequire us to resolve such conflicts in favor of either the Company or the limited partners in our operatingpartnership. Further, there can be no assurance that any procedural protections we implement to address these orother conflicts of interest will result in optimal outcomes for us and our shareholders.
The partnership agreement of our operating partnership contains provisions that may delay, defer or prevent achange in control.
The partnership agreement of our operating partnership provides that subordinated performance unit holdersholding more than 50% of the voting power of the subordinated performance units must approve certain change ofcontrol transactions involving us unless, as a result of such transactions, the holders of subordinated performanceunits are offered a choice (1) to allow their subordinated performance units to remain outstanding without the termsthereof being materially and adversely changed or the subordinated performance units are converted into orexchanged for equity securities of the surviving entity having terms and conditions that are substantially similar tothose of the subordinated performance units (it being understood that we may not be the surviving entity and that theparent of the surviving entity or the surviving entity may not be publicly traded) or (2) to receive for eachsubordinated performance unit an amount of cash, securities or other property payable to a holder of OP units had
Table of Contents
23
such holder exercised its right to exchange its subordinated performance units for OP units without taking intoconsideration a specified conversion penalty associated with such an exchange. In addition, in the case of any suchchange of control transactions in which we have not received the consent of OP unit holders holding more than 50%of the OP units (other than those held by the Company or its subsidiaries) and of subordinated performance unitholders holding more than 50% of the voting power of the subordinated performance units (other than those held bythe Company or its subsidiaries), such transaction is required to be approved by a companywide vote of limitedpartners holding more than 50% of our outstanding OP units in which OP units (including for this purpose OP unitsheld by us and our subsidiaries) are voted and subordinated performance units (not held by us and our subsidiaries)are voted on an applicable as converted basis and in which we will be deemed to vote the OP units held by us andour subsidiaries in proportion to the manner in which all of our outstanding common shares were voted at ashareholders meeting relating to such transaction. These approval rights could delay, deter, or prevent a transactionor a change in control that might involve a premium price for our common shares or otherwise be in the bestinterests of our shareholders.
We may change our investment and financing strategies and enter into new lines of business without shareholderconsent, which may subject us to different risks.
We may change our business and financing strategies and enter into new lines of business at any time withoutthe consent of our shareholders, which could result in our making investments and engaging in business activitiesthat are different from, and possibly riskier than, the investments and businesses described in this document. Achange in our strategy or our entry into new lines of business may increase our exposure to other risks or real estatemarket fluctuations.
Certain provisions of Maryland law could inhibit a change in our control.
Certain provisions of the Maryland General Corporation Law (the "MGCL") applicable to a Maryland realestate investment trust may have the effect of inhibiting a third-party from making a proposal to acquire us or ofimpeding a change in our control under circumstances that otherwise could provide the holders of our commonshares with the opportunity to realize a premium over the then prevailing market price of such shares. The "businesscombination" provisions of the MGCL, subject to limitations, prohibit certain business combinations between aREIT and an "interested shareholder" (defined generally as any person who beneficially owns 10% or more of thevoting power of our then outstanding voting shares or an affiliate or associate of ours who, at any time within thetwo-year period prior to the date in question, was the beneficial owner, directly or indirectly, of 10% or more of ourthen outstanding voting shares) or an affiliate thereof for five years after the most recent date on which theshareholder becomes an interested shareholder and, thereafter, imposes special appraisal rights and specialshareholder voting requirements on these combinations. These provisions of the MGCL do not apply, however, tobusiness combinations that are approved or exempted by the board of trustees of a REIT prior to the time that theinterested shareholder becomes an interested shareholder. Pursuant to the statute, our board of trustees has byresolution exempted business combinations between us and (1) any other person, provided that the businesscombination is first approved by our board of trustees (including a majority of trustees who are not affiliates orassociates of such person), (2) Arlen D. Nordhagen and any of his affiliates and associates and (3) any person actingin concert with the foregoing, from these provisions of the MGCL. As a result, such persons may be able to enterinto business combinations with us that may not be in the best interests of our shareholders without compliance byus with the supermajority vote requirements and other provisions of the statute. This resolution, however, may bealtered or repealed in whole or in part at any time. If this resolution is repealed, or our board of trustees does nototherwise approve a business combination, this statute may discourage others from trying to acquire control of usand increase the difficulty of consummating any offer.
The "control share" provisions of the MGCL provide that holders of "control shares" of a Maryland real estateinvestment trust (defined as voting shares which, when aggregated with all other shares controlled by theshareholder, entitle the shareholder to exercise one of three increasing ranges of voting power in the election oftrustees) acquired in a "control share acquisition" (defined as the direct or indirect acquisition of ownership orcontrol of issued and outstanding "control shares," subject to certain exceptions) have no voting rights with respectto such shares except to the extent approved by our shareholders by the affirmative vote of at least two-thirds of allthe votes entitled to be cast on the matter, excluding votes entitled to be cast by the acquirer of control shares, ourofficers and our trustees who are also our employees. Our bylaws contain a provision exempting from the controlshare acquisition statute any and all acquisitions by any person of our shares. There can be no assurance that thisprovision will not be amended or eliminated at any time in the future.
Table of Contents
24

Our authorized but unissued common and preferred shares may prevent a change in our control.
Our declaration of trust authorizes us to issue additional authorized but unissued common shares and preferredshares. In addition, our board of trustees may, without common shareholder approval, increase the aggregate numberof our authorized shares or the number of shares of any class or series that we have authority to issue and classify orreclassify any unissued common shares or preferred shares, and may set or change the preferences, rights and otherterms of any unissued classified or reclassified shares. As a result, among other things, our board may establish aclass or series of common shares or preferred shares that could delay or prevent a transaction or a change in ourcontrol that might involve a premium price for our common shares or otherwise be in the best interests of ourshareholders.
Our rights and the rights of our shareholders to take action against our trustees and officers are limited, whichcould limit your recourse in the event of actions not in your best interest.
Our declaration of trust limits the liability of our present and former trustees and officers to us and ourshareholders for money damages to the maximum extent permitted under Maryland law. Under current Marylandlaw, our present and former trustees and officers will not have any liability to us or our shareholders for moneydamages other than liability resulting from:
• actual receipt of an improper benefit or profit in money, property or services; or
• active and deliberate dishonesty by the trustee or officer that was established by a final judgment and is material to the cause of action.
Our declaration of trust authorizes us to indemnify our present and former trustees and officers for actions takenby them in those capacities to the maximum extent permitted by Maryland law. Our bylaws require us to indemnifyeach present and former trustee or officer, to the maximum extent permitted by Maryland law, in connection withany proceeding to which he or she is made, or threatened to be made, a party to or witness in by reason of his or herservice to us as a trustee or officer or in certain other capacities. In addition, we may be obligated to pay orreimburse the expenses incurred by our present and former trustees and officers without requiring a preliminarydetermination of their ultimate entitlement to indemnification. As a result, we and our shareholders may have morelimited rights against our present and former trustees and officers than might otherwise exist absent the currentprovisions in our declaration of trust and bylaws or that might exist with other companies, which could limit yourrecourse in the event of actions not in your best interest.
Our declaration of trust contains provisions that make removal of our trustees difficult, which could make itdifficult for our shareholders to effect changes to our management.
Our declaration of trust provides that, subject to the rights of holders of one or more classes or series ofpreferred shares, a trustee may be removed with or without cause, by the affirmative vote of at least two-thirds of thevotes entitled to be cast generally in the election of trustees. Vacancies on our board of trustees generally may befilled only by a majority of the remaining trustees in office, even if less than a quorum. These requirements make itmore difficult to change our management by removing and replacing trustees and may prevent a change in ourcontrol that is in the best interests of our shareholders.
Restrictions on ownership and transfer of our shares may restrict change of control or business combinationopportunities in which our shareholders might receive a premium for their shares.
In order for us to qualify as a REIT for each taxable year, no more than 50% in value of our outstanding sharesmay be owned, directly or constructively, by five or fewer individuals during the last half of any calendar year, andat least 100 persons must beneficially own our shares during at least 335 days of a taxable year of 12 months, orduring a proportionate portion of a shorter taxable year. "Individuals" for this purpose include natural persons,private foundations, some employee benefit plans and trusts, and some charitable trusts. To assist us in preservingour REIT qualification, among other purposes, our declaration of trust generally prohibits, among other limitations,any person from beneficially or constructively owning more than 9.8% in value or in number of shares, whichever ismore restrictive, of our aggregate outstanding shares of all classes and series, the outstanding shares of any class orseries of our preferred shares or our outstanding common shares. These ownership limits and the other restrictionson ownership and transfer of our shares contained in our declaration of trust could have the effect of discouraging atakeover or other transaction in which holders of our common shares might receive a premium for their shares overthe then prevailing market price or which holders might believe to be otherwise in their best interests. Our board of
Table of Contents
25

trustees has established exemptions from these ownership limits which permits certain of our institutional investorsto hold up to 20% of our common shares and up to 25% of our preferred shares.
Risks Related to Our Debt Financings
There are risks associated with our indebtedness.
There is no assurance that we will succeed in securing expansions of our credit facility, 2023 Term LoanFacility or 2028 Term Loan Facility, if we desire to do so.
Our level of debt and the limitations imposed on us by our debt agreements could have significant adverseconsequences, including the following:
• our cash flow may be insufficient to meet our required principal and interest payments;
• we may be unable to borrow additional funds as needed or on favorable terms, including to make acquisitions or to continue to make distributions required to maintain our qualification as a REIT;
• we may be unable to refinance our indebtedness at maturity or the refinancing terms may be less favorable than the terms of our original indebtedness;
• because a portion of our debt may bear interest at variable rates that are not hedged, a material increase in interest rates could materially increase our interest expense;
• we may be forced to dispose of one or more of our properties, possibly on disadvantageous terms;
• our debt level could place us at a competitive disadvantage compared to our competitors with less debt;
• we may experience increased vulnerability to economic and industry downturns, reducing our ability to respond to changing business and economic conditions;
• we may default on our obligations and the lenders or mortgagees may foreclose on our properties that secure their loans and receive an assignment of rents and leases;
• we may default on our obligations and the lenders or mortgagees may enforce our guarantees;
• we may violate restrictive covenants in our loan documents, which would entitle the lenders to accelerate our debt obligations; and
• our default under any one of our mortgage loans with cross-default or cross-collateralization provisions could result in a default on other indebtedness or result in the foreclosures of other properties.
Disruptions in the financial markets could affect our ability to obtain debt financing on reasonable terms or at alland have other adverse effects on us.
Uncertainty in the credit markets may negatively impact our ability to access additional debt financing or torefinance existing debt maturities on favorable terms (or at all), which may negatively affect our ability to makeacquisitions. A downturn in the credit markets may cause us to seek alternative sources of potentially less attractivefinancing, and may require us to adjust our business plans accordingly. In addition, these factors may make it moredifficult for us to sell properties or may adversely affect the price we receive for properties that we do sell, asprospective buyers may experience increased costs of debt financing or difficulties in obtaining debt financing.
We depend on external sources of capital that are outside of our control, which could adversely affect our abilityto acquire or develop properties, satisfy our debt obligations and/or make distributions to shareholders.
We depend on external sources of capital to acquire properties, to satisfy our debt obligations and to makedistributions to our shareholders required to maintain our qualification as a REIT, and these sources of capital maynot be available on favorable terms, or at all. Our access to external sources of capital depends on a number offactors, including the market's perception of our growth potential and our current and potential future earnings andour ability to continue to qualify as a REIT for U.S. federal income tax purposes. If we are unable to obtain externalsources of capital, we may not be able to acquire properties when strategic opportunities exist, satisfy our debtobligations or make cash distributions to our shareholders that would permit us to qualify as a REIT or avoid payingtax on all of our net taxable income.
Table of Contents
26
Increases in interest rates may increase our interest expense and adversely affect our cash flow and our ability toservice our indebtedness and make cash distributions to our shareholders, and our decision to hedge againstinterest rate risk might not be effective.
As of December 31, 2019, we had approximately $1.5 billion of debt outstanding, of which all debt subject tovariable interest rates was fixed pursuant to interest rate swap agreements with no debt subject to variable interestrates (excluding variable-rate debt subject to interest rate swaps). Although the credit markets have recentlyexperienced historic lows in interest rates, if interest rates rise, the interest rates on variable-rate debt that we mayincur in the future could be higher than current levels, which could increase our financing costs and decrease ourcash flow and our ability to pay cash distributions to our shareholders.
Although we have historically sought, and may in the future seek, to manage our exposure to interest ratevolatility by using interest rate hedging arrangements, these arrangements may not be effective. Developing aneffective interest rate risk strategy is complex and no strategy can completely insulate us from risks associated withinterest rate fluctuations. Failure to hedge effectively against interest rate changes may adversely affect our financialcondition, results of operations and ability to make cash distributions to our shareholders.
The terms and covenants relating to our indebtedness could adversely impact our economic performance.
Our credit facility, 2023 Term Loan Facility, 2028 Term Loan Facility, 2029 Term Loan Facility and SeniorUnsecured Notes contain (and any new or amended facility we may enter into from time to time will likely contain)customary affirmative and negative covenants, including financial covenants that, among other things, cap our totalleverage at 60% of our gross asset value, provided, however, that we are permitted to maintain a ratio of up to 65%up to two (2) consecutive fiscal quarters immediately following the quarter in which a material acquisition (asdefined in our credit facility, 2023 Term Loan Facility, 2028 Term Loan Facility, 2029 Term Loan Facility andSenior Unsecured Notes) occurs, require us to have a maximum unsecured debt to unencumbered asset value rationot to exceed 60%, provided, however, the we are be permitted to maintain a ratio of up to 65% up to two (2)consecutive fiscal quarters immediately following the quarter in which a material acquisition (as defined in ourcredit facility, 2023 Term Loan Facility, 2028 Term Loan Facility, 2029 Term Loan Facility and Senior UnsecuredNotes) occurs. In the event that we fail to satisfy our covenants, we would be in default under our credit agreementsor note purchase agreement and may be required to repay such debt with capital from other sources. Under suchcircumstances, other sources of debt or equity capital may not be available to us, or may be available only onunattractive terms. Moreover, the presence of such covenants could cause us to operate our business with a viewtoward compliance with such covenants, which might not produce optimal returns for shareholders.
Uncertainty regarding the London interbank offered rate ("LIBOR") may adversely impact our borrowings andinterest rating hedging.
In July 2017, the U.K. Financial Conduct Authority announced that it would cease to compel banks toparticipate in setting LIBOR as a benchmark by the end of 2021 (the "LIBOR Transition Date"). It is unclear ifLIBOR will cease to exist at that time, whether new methods of calculating LIBOR will be established, or if analternative reference rate will be established. The Alternative Reference Rates Committee, a steering committeecomprised of large U.S. financial institutions convened by the U.S. Federal Reserve, has recommended the SecuredOvernight Financing Rate ("SOFR") as a more robust reference rate alternative to U.S. dollar LIBOR. SOFR iscalculated based on overnight transactions under repurchase agreements, backed by Treasury securities. SOFR isobserved and backward looking, which stands in contrast with LIBOR under the current methodology, which is anestimated forward-looking rate and relies, to some degree, on the expert judgment of submitting panel members.Given that SOFR is a secured rate backed by government securities, it will be a rate that does not take into accountbank credit risk (as is the case with LIBOR). SOFR is therefore likely to be lower than LIBOR and is less likely tocorrelate with the funding costs of financial institutions. Whether or not SOFR attains market traction as a LIBORreplacement tool remains in question. As such, the future of LIBOR at this time is uncertain. Many of our debtagreements and our interest rate swap agreements are linked to LIBOR, including our Credit Facility, 2023 TermLoan Facility, 2028 Term Loan Facility and 2029 Term Loan Facility. Before the LIBOR Transition Date, we mayneed to amend such agreements that utilize LIBOR as a factor in determining the interest rate based on a newstandard that is established, if any. However, these efforts may not be successful in mitigating the legal and financialrisk from changing the reference rate in our legacy agreements. Furthermore, the transition away from LIBOR mayadversely impact our ability to manage and hedge exposures to fluctuations in interest rates using derivativeinstruments. There is no guarantee that a transition from LIBOR to an alternative will not result in financial market
Table of Contents
27

disruptions, significant increases in benchmark rates, or borrowing costs to borrowers, any of which could have anadverse effect on our business, results of operations, financial condition, and the market price of our common shares.
Risks Related to Our Qualification as a REIT
Our failure to remain qualified as a REIT would subject us to U.S. federal income tax and applicable state andlocal taxes, which would reduce the amount of operating cash flow to our shareholders.
We have elected and we believe that we have qualified to be taxed as a REIT commencing with our taxable yearended December 31, 2015. We have not requested, and do not intend to request a ruling from the Internal RevenueService ("IRS"), that we qualify as a REIT. Qualification as a REIT involves the application of highly technical andcomplex Code provisions and Treasury Regulations promulgated thereunder for which there are limited judicial andadministrative interpretations. The complexity of these provisions and of applicable Treasury Regulations is greaterin the case of a REIT that, like us, holds its assets through partnerships, and judicial and administrativeinterpretations of the U.S. federal income tax laws governing REIT qualification are limited. To qualify as a REIT,we must meet, on an ongoing basis through actual operating results, various tests regarding the nature anddiversification of our assets and our income, the ownership of our outstanding shares and the amount of ourdistributions. Our compliance with the REIT income and quarterly asset requirements also depends upon our abilityto manage successfully the composition of our income and assets on an ongoing basis. Our ability to satisfy theseasset tests depends upon our analysis of the characterization and fair market values of our assets, some of which arenot susceptible to a precise determination, and for which we will not obtain independent appraisals. Moreover, newlegislation, court decisions or administrative guidance may, in each case possibly with retroactive effect, make itmore difficult or impossible for us to qualify as a REIT. Thus, while we believe that we have been organized andoperated and we intend to operate so that we will continue to qualify as a REIT, given the highly complex nature ofthe rules governing REITs, the ongoing importance of factual determinations and the possibility of future changes inour circumstances, no assurance can be given that we have qualified or will so qualify for any particular year. Theseconsiderations also might restrict the types of assets that we can acquire or services that we can provide in the future.
If we fail to qualify as a REIT in any taxable year, and we do not qualify for certain statutory relief provisions,we would be required to pay U.S. federal income tax on our taxable income at regular corporate rates, anddistributions to our shareholders would not be deductible by us in determining our taxable income. In such a case,we might need to borrow money, sell assets, or reduce or even cease making distributions in order to pay our taxes.Our payment of income tax would reduce significantly the amount of operating cash flow to our shareholders.Furthermore, if we fail to maintain our qualification as a REIT, we no longer would be required to makedistributions to our shareholders. In addition, unless we were eligible for certain statutory relief provisions, we couldnot re-elect to be taxed as a REIT until the fifth calendar year following the year in which we failed to qualify.
Even if we qualify as a REIT, we may face other tax liabilities that reduce our cash flow.
Even if we qualify for taxation as a REIT, we may be subject to certain U.S. federal, state and local taxes on ourincome and assets, including taxes on any undistributed income, state or local income and property and transfertaxes, including real property transfer taxes. In addition, we could, in certain circumstances, be required to pay anexcise or penalty tax (which could be significant in amount) in order to utilize one or more relief provisions underthe Code to maintain our qualification as a REIT. Any of these taxes would decrease operating cash flow to ourshareholders. In addition, in order to meet the REIT qualification requirements, or to avert the imposition of a 100%tax that applies to certain gains derived by a REIT from dealer property or inventory, we may hold some of ourassets or provide certain services to our tenants through one or more TRSs, or other subsidiary corporations that willbe subject to corporate-level income tax at regular corporate rates. Any TRSs or other taxable corporations in whichwe invest will be subject to U.S. federal, state and local corporate taxes. Furthermore, if we acquire appreciatedassets from a corporation that is or has been a subchapter C corporation in a transaction in which the adjusted taxbasis of such assets in our hands is less than the fair market value of the assets, determined at the time we acquiredsuch assets, and if we subsequently dispose of any such assets during the 5-year period following the acquisition ofthe assets from the C corporation, we will be subject to tax at the highest corporate tax rates on any gain from thedisposition of such assets to the extent of the excess of the fair market value of the assets on the date that weacquired such assets over the basis of such assets on such date, which we refer to as built-in gains. Payment of thesetaxes generally could materially and adversely affect our income, cash flow, results of operations, financialcondition, liquidity and prospects, and could adversely affect the value of our common shares and our ability tomake distributions to our shareholders.
Table of Contents
28

Failure to make required distributions would subject us to tax, which would reduce the operating cash flow to ourshareholders.
In order to qualify as a REIT, we must distribute to our shareholders each calendar year at least 90% of our nettaxable income (excluding net capital gain). To the extent that we satisfy the 90% distribution requirement, butdistribute less than 100% of our net taxable income (including net capital gain), we would be subject to U.S. federalcorporate income tax on our undistributed net taxable income. In addition, we will incur a 4% non-deductible excisetax on the amount, if any, by which our distributions in any calendar year are less than a minimum amount specifiedunder U.S. federal income tax laws. Although we intend to distribute our net taxable income to our shareholders in amanner intended to satisfy the REIT 90% distribution requirement and to avoid the 4% non-deductible excise tax, itis possible that we, from time to time, may not have sufficient cash to distribute 100% of our net taxable income.There may be timing differences between our actual receipt of cash and the inclusion of items in our income for U.S.federal income tax purposes. Accordingly, there can be no assurance that we will be able to distribute net taxableincome to shareholders in a manner that satisfies the REIT distribution requirements and avoids the 4% non-deductible excise tax.
To maintain our REIT qualification, we may be forced to borrow funds during unfavorable market conditions.
In order to maintain our REIT qualification and avoid the payment of income and excise taxes, we may need toborrow funds to meet the REIT distribution requirements even if the then prevailing market conditions are notfavorable for these borrowings. These borrowing needs could result from, among other things, timing differencesbetween the actual receipt of cash and inclusion of income for federal income tax purposes, or the effect of non-deductible capital expenditures, the creation of reserves or required debt or amortization payments. These sources,however, may not be available on favorable terms or at all. Our access to third-party sources of capital depends on anumber of factors, including the market's perception of our growth potential, our current debt levels, the per sharetrading price of our common shares, and our current and potential future earnings. We cannot assure you that wewill have access to such capital on favorable terms at the desired times, or at all, which may cause us to curtail ourinvestment activities and/or to dispose of assets at inopportune times, and could adversely affect our financialcondition, results of operations, cash flows and our ability to pay distributions on, and the per share trading price of,our common shares.
Complying with the REIT requirements may cause us to forgo and/or liquidate otherwise attractive investments.
To qualify as a REIT, we must ensure that at least 75% of our gross income for each taxable year, excludingcertain amounts, is derived from certain real property-related sources, and at least 95% of our gross income for eachtaxable year, excluding certain amounts, is derived from certain real property-related sources and passive incomesuch as dividends and interest. In addition, we must ensure that, at the end of each calendar quarter, at least 75% ofthe value of our total assets consists of cash, cash items, U.S. government securities and qualified real estate assets.The remainder of our investment in securities generally cannot include more than 10% of the outstanding votingsecurities of any one issuer (other than U.S. government securities, securities of corporations that are treated asTRSs and qualified real estate assets) or more than 10% of the total value of the outstanding securities of any oneissuer (other than government securities, securities of corporations that are treated as TRSs and qualified real estateassets). In addition, in general, no more than 5% of the value of our assets can consist of the securities of any oneissuer (other than U.S. government securities, securities of corporations that are treated as TRSs and qualified realestate assets), no more than 20% of the value of our total assets can be represented by securities of one or moreTRSs and no more than 25% of the value of our assets can consist of debt instruments issued by publicly offeredREITs that are not otherwise secured by real property. If we fail to comply with these asset requirements at the endof any calendar quarter, we must correct the failure within 30 days after the end of the calendar quarter or qualify forcertain statutory relief provisions to avoid losing our REIT qualification and suffering adverse tax consequences.
To meet these tests, we may be required to take or forgo taking actions that we would otherwise consideradvantageous. For instance, in order to satisfy the gross income or asset tests applicable to REITs under the Code,we may be required to forgo investments that we otherwise would make. Furthermore, we may be required toliquidate from our portfolio otherwise attractive investments. In addition, we may be required to make distributionsto shareholders at disadvantageous times or when we do not have funds readily available for distribution. Theseactions could reduce our income and amounts available for distribution to our shareholders. Thus, compliance withthe REIT requirements may hinder our investment performance.
Table of Contents
29
We may be subject to a 100% tax on income from "prohibited transactions," and this tax may limit our ability tosell assets or require us to restructure certain of our activities in order to avoid being subject to the tax.
We will be subject to a 100% tax on any income from a prohibited transaction. "Prohibited transactions"generally include sales or other dispositions of property (other than property treated as foreclosure property underthe Code) that is held as inventory or primarily for sale to customers in the ordinary course of a trade or business bya REIT, either directly or indirectly through certain pass-through subsidiaries. The characterization of an asset saleas a prohibited transaction depends on the particular facts and circumstances.
The 100% tax will not apply to gains from the sale of inventory that is held through a TRS or other taxablecorporation, although such income will be subject to tax in the hands of the corporation at regular corporate incometax rates.
Our TRSs will be subject to U.S. federal income tax and will be required to pay a 100% penalty tax on certainincome or deductions if our transactions with our TRSs are not conducted on arm's length terms.
We may conduct certain activities (such as facilitating sales by our PROs of tenant insurance, of which wereceive a portion of the proceeds, selling packing supplies and locks and renting trucks or other moving equipment)through one or more TRSs.
A TRS is a corporation other than a REIT in which a REIT directly or indirectly holds stock, and that has madea joint election with such REIT to be treated as a TRS. If a TRS owns more than 35% of the total voting power orvalue of the outstanding securities of another corporation, such other corporation will also be treated as a TRS. Otherthan some activities relating to lodging and health care properties, a TRS may generally engage in any business,including the provision of customary or non-customary services to tenants of its parent REIT. A TRS is subject toU.S. federal income tax as a regular C corporation.
No more than 20% of the value of a REIT's total assets may consist of stock or securities of one or more TRSs.This requirement limits the extent to which we can conduct our activities through TRSs. The values of some of ourassets, including assets that we hold through TRSs, may not be subject to precise determination, and values aresubject to change in the future. Furthermore, if a REIT lends money to a TRS, the TRS may be unable to deduct allor a portion of the interest paid to the REIT, which could increase the tax liability of the TRS. In addition, the Codeimposes a 100% tax on certain transactions between a TRS and its parent REIT that are not conducted on an arm'slength basis. We intend to structure transactions with any TRS on terms that we believe are arm's length to avoidincurring the 100% excise tax described above. There can be no assurances, however, that we will be able to avoidapplication of the 100% tax.
If our operating partnership is treated as a corporation for U.S. federal income tax purposes, we will cease toqualify as a REIT.
We believe our operating partnership qualifies as a partnership for U.S. federal income tax purposes. As apartnership for U.S. federal income tax purposes, our operating partnership will not be subject to U.S. federalincome tax on its income. Instead, each of its partners, including us, will be required to pay tax on its allocable shareof our operating partnership's income. No assurance can be provided, however, that the IRS will not challenge ouroperating partnership's status as a partnership for U.S. federal income tax purposes, or that a court would not sustainsuch a challenge. If the IRS were successful in treating our operating partnership as a corporation for U.S. federalincome tax purposes, we would fail to meet the gross income tests and certain of the asset tests applicable to REITs.As a result, we would cease to qualify as a REIT and both we and our operating partnership would become subjectto U.S. federal, state and local income tax. The payment by our operating partnership of income tax would reducesignificantly the amount of cash available to our operating partnership to satisfy obligations to make principal andinterest payments on its debt and to make distribution to its partners, including us.
Complying with REIT requirements may limit our ability to hedge effectively and may cause us to incur tax liabilities.
The REIT provisions of the Code may limit our ability to hedge our assets and operations. Under theseprovisions, any income that we generate from transactions intended to hedge our interest rate risk will be excludedfrom gross income for purposes of the REIT 75% and 95% gross income tests if (i) the instrument (a) hedges interestrate risk on liabilities used to carry or acquire real estate assets or (b) hedges an instrument described in clause (a)for a period following the extinguishment of the liability or the disposition of the asset that was previously hedgedby the hedged instrument, and (ii) the relevant instrument is properly identified under applicable Treasury
Table of Contents
30

regulations. Income from hedging transactions that does not meet these requirements will generally constitute non-qualifying income for purposes of both the REIT 75% and 95% gross income tests. As a result of these rules, wemay have to limit our use of hedging techniques that might otherwise be advantageous or implement those hedgesthrough a TRS. This could increase the cost of our hedging activities because our TRS would be subject to tax ongains or expose us to greater risks associated with changes in interest rates than we would otherwise want to bear. Inaddition, losses in our TRS will generally not provide any tax benefit to us, although, subject to limitation, suchlosses may be carried forward to offset future taxable income of the TRS.
The ability of our board of trustees to revoke our REIT election without shareholder approval may cause adverseconsequences to our shareholders.
Our declaration of trust provides that the board of trustees may revoke or otherwise terminate our REITelection, without the approval of our shareholders, if the board determines that it is no longer in our best interest toattempt to, or continue to, qualify as a REIT. If we cease to qualify as a REIT, we would become subject to U.S.federal income tax on our net taxable income and we generally would no longer be required to distribute any of ournet taxable income to our shareholders, which may have adverse consequences on our total return to ourshareholders.
Legislative or regulatory tax changes related to REITs could materially and adversely affect our business.
At any time, the U.S. federal income tax laws or regulations governing REITs or the administrativeinterpretations of those laws or regulations may be changed, possibly with retroactive effect. We cannot predict if orwhen any new U.S. federal income tax law, regulation or administrative interpretation, or any amendment to anyexisting U.S. federal income tax law, regulation or administrative interpretation, will be adopted, promulgated orbecome effective or whether any such law, regulation or interpretation may take effect retroactively. We and ourshareholders could be adversely affected by any such change in, or any new, U.S. federal income tax law, regulationor administrative interpretation.
The TCJA, which was signed into law on December 22, 2017, significantly changes U.S. federal income taxlaws applicable to businesses and their owners, including REITs and their shareholders, and may lessen the relativecompetitive advantage of operating as a REIT rather than as a C corporation. For additional discussion, see "U.S.Federal Income Tax Legislation".
Risks Related to Our Common Shares and Preferred Shares
Common shares and preferred shares eligible for future sale may have adverse effects on our share price.
Subject to applicable law and the rules of any stock exchange on which our shares may be listed or traded, ourboard of trustees, without common shareholder approval, may authorize us to issue additional authorized andunissued common shares and preferred shares on the terms and for the consideration it deems appropriate and mayamend our declaration of trust to increase the total number of shares, or the number of shares of any class or series,that we are authorized to issue. In addition, our operating partnership may issue OP units, which are redeemable forcash or, at our option exchangeable on a one-for-one basis into common shares after an agreed period of time andcertain other conditions, preferred units of limited partnership interest, which are redeemable for cash or, at ouroption exchangeable on a one-for-one basis into our 6.000% Series A cumulative redeemable preferred shares ofbeneficial interest ("Series A Preferred Shares") and subordinated performance units, which are only convertible intoOP units beginning two years following the initial issuance of the applicable series and then (i) at the holder'selection only upon the achievement of certain performance thresholds relating to the properties to which suchsubordinated performance units relate or (ii) at our election upon a retirement event of a PRO that holds suchsubordinated performance units or upon certain qualifying terminations. Notwithstanding the two-year lock outperiod on conversions of subordinated performance units into OP units, if all such subordinated performance unitswere convertible into OP units as of December 31, 2019, each subordinated performance unit would on averagehypothetically convert into 1.48 OP units, or into an aggregate of approximately 22.8 million OP units. Theseamounts are based on historical financial information for the trailing twelve months ended December 31, 2019. Thehypothetical conversion is calculated by dividing the average cash available for distribution, or CAD, persubordinated performance unit by 110% of the CAD per OP unit over the same period. We anticipate that as ourCAD grows over time, the conversion ratio will also grow, including to levels that may exceed this amount. Theactual number of OP units into which such subordinated performance units will become convertible may varysignificantly and will depend upon the applicable conversion penalty and the actual CAD to the OP units and theactual CAD to the converted subordinated performance units in the one-year period ending prior to conversion. We
Table of Contents
31

have also granted registration rights to those persons who will be eligible to receive common shares issuable uponexchange of OP units issued in our formation transactions and certain contribution transactions.
Pursuant to the registration rights agreements, we have filed a shelf registration statement on Form S-3 toregister the offer and resale of the common shares issuable upon exchange of OP units (or securities convertible intoor exchangeable for OP units and we expect to file a shelf registration statement on Form S-3 to register the offerand resale of the Series A Preferred Shares issuable upon the exchange of our 6.000% Series A-1 cumulativeredeemable preferred units of limiting partnership interest ("Series A-1 preferred units") in the Company's operatingpartnership). We have the right to include common shares to be sold for our own account or other holders in theshelf registration statement. We are required to use all commercially reasonable efforts to keep such shelfregistration statement continuously effective for a period ending when all common shares covered by the shelfregistration statement are no longer Registrable Shares, as defined in the shelf registration statement.
We intend to bear the expenses incident to these registration requirements except that we will not bear the costsof (i) any underwriting fees, discounts or commissions, (ii) out-of-pocket expenses of the persons exercising theregistration rights or (iii) transfer taxes.
We cannot predict the effect, if any, of future sales of our common or preferred shares or the availability ofshares for future sales, on the market price of our common or preferred shares. The market price of our commonshares may decline significantly when the restrictions on resale by certain of our shareholders lapse. Sales ofsubstantial amounts of common or preferred shares or the perception that such sales could occur may adverselyaffect the prevailing market price for our common shares.
We cannot assure our ability to pay dividends in the future.
Historically, we have paid quarterly common share dividends to our shareholders and quarterly distributions toour operating partnership unitholders, and we intend to continue to pay quarterly dividends to our shareholders andto make quarterly distributions to our operating partnership unitholders in amounts such that all or substantially allof our net taxable income in each year is distributed, which, along with other factors, should enable us to continue toqualify for the tax benefits accorded to a REIT under the Code. We have not established a minimum dividendspayment level, and all future distributions will be made at the discretion of our board of trustees. Our ability to paydividends will depend upon, among other factors:
• the operational and financial performance of our properties;
• capital expenditures with respect to existing and newly acquired properties;
• general and administrative expenses associated with our operation as a publicly-held REIT;
• maintenance of our REIT qualification;
• the amount of, and the interest rates on, our debt and the ability to refinance our debt;
• the absence of significant expenditures relating to environmental and other regulatory matters; and
• other risk factors described in this Annual Report on Form 10-K.
Certain of these matters are beyond our control and any significant difference between our expectations andactual results could have a material adverse effect on our cash flow and our ability to make distributions toshareholders.
Future offerings of debt or equity securities, which may rank senior to our common shares, may adversely affectthe market price of our common shares.
If we decide to issue debt securities in the future, which would rank senior to our common shares, it is likelythat they will be governed by an indenture or other instrument containing covenants restricting our operatingflexibility. Additionally, any equity securities or convertible or exchangeable securities that we issue in the futuremay have rights, preferences and privileges more favorable than those of our common shares and may result indilution to owners of our common shares. We and, indirectly, our shareholders will bear the cost of issuing andservicing such securities. Because our decision to issue debt or equity securities in any future offering will dependon market conditions and other factors beyond our control, we cannot predict or estimate the amount, timing ornature of our future offerings. Thus, holders of our common shares will bear the risk of our future offerings reducingthe market price of our common shares and diluting the value of their share holdings in us.
Table of Contents
32

Item 1B. Unresolved Staff Comments
None.Item 2. Properties
As of December 31, 2019, we held ownership interests in and operated a geographically diversified portfolio of742 self storage properties, located in 35 states and Puerto Rico, comprising approximately 47.1 million rentablesquare feet, configured in approximately 378,000 storage units. Of these properties, we consolidated 567 selfstorage properties that contain approximately 34.5 million rentable square feet and we held a 25% ownership interestin 175 unconsolidated real estate venture properties that contain approximately 12.6 million rentable square feet.
The following table sets forth summary information regarding our consolidated properties by state as ofDecember 31, 2019.
Number of Number of Rentable % of Rentable Period-endState/Territory Properties Units Square Feet Square Feet OccupancyCalifornia(1) 83 49,618 6,226,952 18.1 % 88.4 %Texas 71 29,465 4,218,584 12.2 % 86.6 %Oregon 61 24,498 3,105,199 8.9 % 81.1 %Florida 46 28,956 3,021,295 8.8 % 86.4 %Georgia 44 19,044 2,547,949 7.4 % 87.7 %North Carolina 33 15,377 1,885,479 5.5 % 90.8 %Arizona 31 16,893 1,925,442 5.6 % 86.9 %Oklahoma 30 13,848 1,902,842 5.5 % 87.5 %Louisiana(1) 26 12,336 1,538,959 4.5 % 84.8 %Indiana 16 8,777 1,134,820 3.3 % 89.6 %Kansas 16 5,713 763,249 2.2 % 86.6 %Washington 14 4,496 578,723 1.7 % 80.1 %Nevada 13 6,678 844,811 2.4 % 89.4 %Colorado 11 5,048 615,456 1.8 % 84.2 %New Hampshire 11 4,727 576,995 1.7 % 90.3 %Missouri 9 3,859 490,023 1.4 % 74.7 %Ohio 8 3,642 461,393 1.3 % 88.5 %Puerto Rico 6 4,460 431,612 1.3 % 89.9 %Pennsylvania 6 2,647 298,615 0.9 % 89.4 %New Mexico 5 3,108 389,743 1.1 % 87.1 %Illinois 4 1,993 271,136 0.8 % 86.0 %Maryland 4 1,993 214,337 0.6 % 88.5 %South Carolina 4 1,212 147,580 0.4 % 91.2 %Idaho 3 843 170,229 0.5 % 94.3 %Massachusetts 3 1,737 166,650 0.5 % 95.0 %Mississippi 3 864 114,311 0.3 % 79.6 %New Jersey 3 1,436 191,124 0.6 % 83.7 %Kentucky 1 380 60,950 0.2 % 83.7 %Alabama 1 762 110,616 0.3 % 84.7 %Virginia 1 597 80,335 0.2 % 83.4 %Total/Weighted Average 567 275,007 34,485,409 100.0 % 86.8 %
(1) Six of the California properties and two of the Louisiana properties are subject to non-cancelable leasehold interest agreements that are classified as operating leases. See "Note 13. Leases" in Item 8. "Financial Statements and Supplementary Data."
33

The following table sets forth summary information regarding our unconsolidated real estate venture propertiesby state as of December 31, 2019.
Number of Number of Rentable % of Rentable Period-endState Properties Units Square Feet Square Feet OccupancyFlorida 27 15,374 1,721,835 13.6 % 81.7 %Michigan 24 15,616 1,977,773 15.7 % 87.6 %New Jersey 15 10,524 1,225,838 9.7 % 88.1 %Alabama 14 5,533 826,475 6.6 % 86.1 %Ohio 14 8,787 1,064,746 8.4 % 85.6 %Georgia 11 6,141 872,333 6.9 % 87.0 %California 10 6,197 754,379 6.0 % 87.2 %Other(1) 60 34,938 4,171,544 33.1 % 84.6 %Total 175 103,110 12,614,923 100.0 % 85.5 %
(1) Other states in the unconsolidated real estate ventures include Arizona, Delaware, Illinois, Massachusetts, Minnesota, Mississippi, Nevada,New York, Oklahoma, Pennsylvania, Rhode Island, Tennessee, Texas and Virginia.
Our portfolio consists of self storage properties that are designed to offer customers convenient, affordable, andsecure storage units. Generally, our properties are in highly visible locations clustered in states or markets withstrong population and job growth and are specifically designed to accommodate residential and commercial tenantswith features such as security systems, electronic gate entry, easy access, climate control, and pest control. Our unitstypically range from 25 square feet to 300 square feet, and some of our properties also offer outside storage forvehicles, boats, and equipment. We provide 24-hour access to many storage units through computer controlledaccess systems, as well as alarm and sprinkler systems on many of our individual storage units. Almost all of thestorage units in our portfolio are leased on a month-to-month basis providing us the flexibility to increase rental ratesover time as market conditions permit. Additional information on our consolidated self storage properties iscontained in "Schedule III - Real Estate and Accumulated Depreciation" in this Annual Report on Form 10-K.
Item 3. Legal Proceedings
We are not currently subject to any legal proceedings that we consider to be material.
Item 4. Mine Safety Disclosures
Not applicable.
34

PART IIItem 5. Market for the Registrant's Common Equity, Related Stockholder Matters and Issuer Purchases of
Equity Securities
Market Information
Our common shares have been listed and traded on the NYSE under the symbol "NSA" since April 22, 2015.Prior to that time there was no public market for our common shares.
Holders
As of February 25, 2020, the Company had 55 record holders of its common shares. The 55 holders of record donot include the beneficial owners of common shares whose shares are held by a broker or bank. Such informationwas obtained from our transfer agent and registrar.
Dividends
Since our initial quarter as a publicly-traded REIT, we have made regular quarterly distributions to ourshareholders. Holders of common shares are entitled to receive distributions when declared by our board of trusteesout of any assets legally available for that purpose. In order to maintain our status as a REIT, we are required todistribute at least 90% of our "REIT taxable income," which is generally equivalent to our net taxable ordinaryincome, determined without regard to the deduction for dividends paid and excluding net capital gains to ourshareholders annually in order to maintain our REIT qualification for U.S. federal income tax purposes.
Common share dividends are characterized for U.S. federal income tax purposes as ordinary income, capitalgains, return of capital or a combination thereof. Each year we communicate to shareholders the tax characterizationof the common share dividends paid during the preceding year. Our tax return for the year ended December 31, 2019has not yet been filed and consequently, the taxability information presented for our dividends paid in 2019 is basedupon management's estimate. The following table summarizes the taxability of our dividends per common share forthe year ended December 31, 2019:
Year EndedDecember 31, 2019
Ordinary Income $ 0.841586 66.3 %Return of Capital 0.428414 33.7 %Total $ 1.270000 100.0 %
Equity Compensation Plan Information
Information about our equity compensation plans is incorporated by reference to Item 12 of Part III of thisAnnual Report on Form 10-K.
Unregistered Sales of Equity Securities
During the three months ended December 31, 2019, the Company, in its capacity as general partner of itsoperating partnership, caused the operating partnership to issue 293,522 common shares to satisfy redemptionrequests from certain limited partners.
On October 24, 2019, the operating partnership issued 21,752 subordinated performance units to an affiliate ofMoove In, one of the Company's existing PROs, in exchange for cash in connection with the acquisition of a selfstorage property.
On December 18, 2019, the operating partnership issued 6,662 OP units and 20,197 subordinated performanceunits to an affiliate of Hide-Away, one of the Company's existing PROs, in connection with the acquisition of a selfstorage property.
On December 19, 2019, the operating partnership issued 11,100 subordinated performance units to an affiliateof Personal Mini, one of the Company's existing PROs, in exchange for cash in connection with the acquisition of aself storage property.
On January 16, 2020, the operating partnership issued 73,329 OP units to an unrelated third party in connectionwith the acquisition of a self storage property.
Table of Contents
35

On January 16, 2020, the operating partnership issued 13,105 subordinated performance units to an affiliate ofMove It, one of the Company's existing PROs, in exchange for cash in connection with the acquisition of a selfstorage property.
As of February 25, 2020, other than those OP units held by the Company, 33,301,798 OP units wereoutstanding (including 773,568 outstanding Long-Term Incentive Plan Units ("LTIP units") and 1,848,261outstanding OP units in certain consolidated subsidiaries of the operating partnership ("DownREIT OP units"),which are convertible into, or exchangeable for, OP units on a one-for-one basis, subject to certain conditions).
These issuances were exempt from registration under Section 4(a)(2) of the Securities Act of 1933, as amended.
Performance Graph
The following chart compares the yearly cumulative total shareholder return for our common shares with thecumulative shareholder return of companies on (i) the S&P 500 Index, (ii) the Russell 2000 and (iii) the Nareit AllEquity REIT Index as provided by Nareit for the period beginning April 23, 2015 and ending December 31, 2019.
Period Ending
Inde
x V
alue
Total Return Performance
National Storage Affiliates Trust S&P 500Russell 2000 Nareit All Equity REIT Index
04/23/15 12/31/15 12/31/16 12/31/17 12/31/18 12/31/190
50
100
150
200
250
300
350
Period EndingIndex 4/23/2015 12/31/2015 12/31/2016 12/31/2017 12/31/2018 12/31/2019
National Storage Affiliates Trust $ 100 $ 137 $ 184 $ 238 $ 240 $ 318S&P 500 100 98 110 134 128 168Russell 2000 100 91 109 126 112 140Nareit All Equity REIT Index 100 101 109 119 114 147
The foregoing item assumes $100.00 invested on April 23, 2015, with dividends reinvested. The PerformanceGraph will not be deemed to be incorporated by reference into any filing by NSA under the Securities Act of 1933,as amended, or the Securities Exchange Act of 1934, as amended, except to the extent that NSA specificallyincorporates the same by reference.
Table of Contents
36

Item 6. Selected Financial Data
The following table sets forth our selected historical financial and operating data as of and for the periodsindicated. You should read the information below in conjunction with the financial statements and notes theretoincluded in Item 8. "Financial Statements and Supplementary Data" and Item 7. "Management's Discussion andAnalysis of Financial Condition and Results of Operations" in this Annual Report on Form 10-K or in previousfilings with the SEC. Dollars in the following table are in thousands, except per share amounts.
Year Ended December 31,2019 2018 2017 2016 2015
OPERATING DATA:Total revenue $ 387,896 $ 330,896 $ 268,130 $ 199,046 $ 133,919Total operating expenses 261,047 229,242 189,630 141,390 102,328Net income 66,013 56,326 45,998 24,866 4,796
Net (income) loss attributable to noncontrolling interests (62,030) (42,217) (43,037) (6,901) 7,644
Net income attributable to the Company 3,983 14,109 2,961 17,965 12,440
Earnings (loss) per share—basic $ (0.15) $ 0.07 $ 0.01 $ 0.60 $ 0.80Earnings (loss) per share—diluted $ (0.15) $ 0.07 $ 0.01 $ 0.31 $ 0.17Weighted average shares outstanding
—basic (in thousands) 58,208 53,293 44,423 29,887 15,463Weighted average shares outstanding
—diluted (in thousands) 58,208 53,293 44,423 78,747 45,409Dividends declared per common
share $ 1.27 $ 1.16 $ 1.04 $ 0.88 $ 0.54BALANCE SHEET DATA (at end of period)Self storage properties, net $ 2,753,897 $ 2,391,462 $ 2,104,875 $ 1,733,533 $ 1,079,101Total assets 3,084,245 2,729,263 2,266,730 1,892,092 1,099,049Debt financing 1,534,047 1,278,102 958,097 878,954 567,795Total equity $ 1,452,101 $ 1,402,299 $ 1,271,487 $ 979,068 $ 516,047OTHER DATA (at end of period)Number of properties(1) 567 499 444 382 277Rentable square feet (in thousands)(2) 34,485 30,366 27,182 23,077 15,770Occupancy percentage(3) 87 % 87 % 87 % 88 % 89 %
(1) For a discussion of our acquisition and disposition activity during the years ended December 31, 2019 and 2018, see "Note 6. Self StorageProperty Acquisitions and Dispositions" in Item 8. "Financial Statements and Supplementary Data."
(2) Rentable square feet includes all enclosed self storage units but excludes commercial, residential, and covered parking space. (3) Represents total occupied rentable square feet divided by total rentable square feet as of the end of the period.
Table of Contents
37
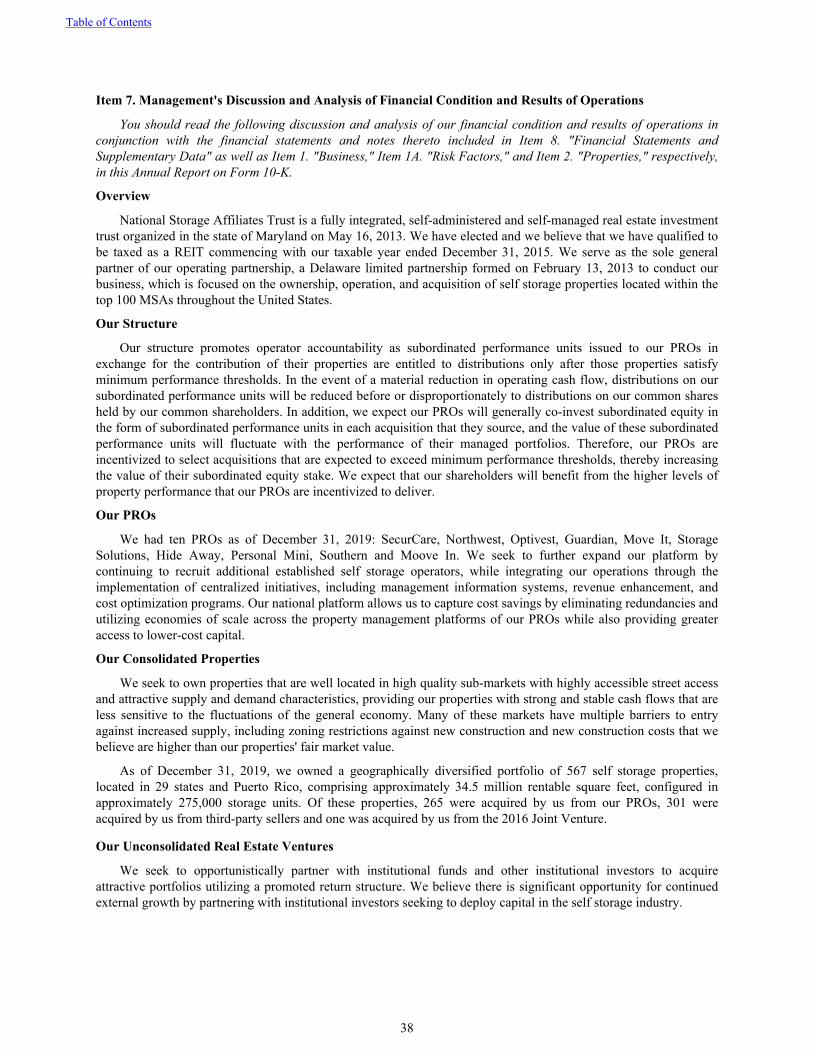
Item 7. Management's Discussion and Analysis of Financial Condition and Results of Operations
You should read the following discussion and analysis of our financial condition and results of operations inconjunction with the financial statements and notes thereto included in Item 8. "Financial Statements andSupplementary Data" as well as Item 1. "Business," Item 1A. "Risk Factors," and Item 2. "Properties," respectively,in this Annual Report on Form 10-K.
Overview
National Storage Affiliates Trust is a fully integrated, self-administered and self-managed real estate investmenttrust organized in the state of Maryland on May 16, 2013. We have elected and we believe that we have qualified tobe taxed as a REIT commencing with our taxable year ended December 31, 2015. We serve as the sole generalpartner of our operating partnership, a Delaware limited partnership formed on February 13, 2013 to conduct ourbusiness, which is focused on the ownership, operation, and acquisition of self storage properties located within thetop 100 MSAs throughout the United States.
Our Structure
Our structure promotes operator accountability as subordinated performance units issued to our PROs inexchange for the contribution of their properties are entitled to distributions only after those properties satisfyminimum performance thresholds. In the event of a material reduction in operating cash flow, distributions on oursubordinated performance units will be reduced before or disproportionately to distributions on our common sharesheld by our common shareholders. In addition, we expect our PROs will generally co-invest subordinated equity inthe form of subordinated performance units in each acquisition that they source, and the value of these subordinatedperformance units will fluctuate with the performance of their managed portfolios. Therefore, our PROs areincentivized to select acquisitions that are expected to exceed minimum performance thresholds, thereby increasingthe value of their subordinated equity stake. We expect that our shareholders will benefit from the higher levels ofproperty performance that our PROs are incentivized to deliver.
Our PROs
We had ten PROs as of December 31, 2019: SecurCare, Northwest, Optivest, Guardian, Move It, StorageSolutions, Hide Away, Personal Mini, Southern and Moove In. We seek to further expand our platform bycontinuing to recruit additional established self storage operators, while integrating our operations through theimplementation of centralized initiatives, including management information systems, revenue enhancement, andcost optimization programs. Our national platform allows us to capture cost savings by eliminating redundancies andutilizing economies of scale across the property management platforms of our PROs while also providing greateraccess to lower-cost capital.
Our Consolidated Properties
We seek to own properties that are well located in high quality sub-markets with highly accessible street accessand attractive supply and demand characteristics, providing our properties with strong and stable cash flows that areless sensitive to the fluctuations of the general economy. Many of these markets have multiple barriers to entryagainst increased supply, including zoning restrictions against new construction and new construction costs that webelieve are higher than our properties' fair market value.
As of December 31, 2019, we owned a geographically diversified portfolio of 567 self storage properties,located in 29 states and Puerto Rico, comprising approximately 34.5 million rentable square feet, configured inapproximately 275,000 storage units. Of these properties, 265 were acquired by us from our PROs, 301 wereacquired by us from third-party sellers and one was acquired by us from the 2016 Joint Venture.
Our Unconsolidated Real Estate Ventures
We seek to opportunistically partner with institutional funds and other institutional investors to acquireattractive portfolios utilizing a promoted return structure. We believe there is significant opportunity for continuedexternal growth by partnering with institutional investors seeking to deploy capital in the self storage industry.
Table of Contents
38

2018 Joint Venture
As of December 31, 2019, our 2018 Joint Venture, in which we have a 25% interest, owned and operated aportfolio of 103 properties containing approximately 7.7 million rentable square feet, configured in approximately63,000 storage units and located across 17 states.
2016 Joint Venture
As of December 31, 2019, our 2016 Joint Venture, in which we have a 25% ownership interest, owned andoperated a portfolio of 72 properties containing approximately 4.9 million rentable square feet, configured inapproximately 40,000 storage units and located across 13 states.
During the year ended December 31, 2019, our 2016 Joint Venture sold to the Company one self storageproperty for $4.1 million, comprising less than 0.1 million rentable square feet, configured in approximately 300storage units.
Our Property Management Platform
Through our property management platform, branded iStorage, we direct, manage and control the day-to-dayoperations and affairs of certain consolidated properties and our unconsolidated real estate ventures. We earn certaincustomary fees for managing and operating the properties in the unconsolidated real estate ventures and we facilitatetenant insurance and/or tenant warranty protection programs for tenants at these properties in exchange for half of allproceeds from such programs.
As of December 31, 2019, our property management platform managed and controlled 42 of our consolidatedproperties in select markets in California, Illinois, Kansas, Maryland, Missouri, Ohio, Texas and Virginia.
Results of Operations
When reviewing our results of operations it is important to consider the timing of acquisition activity. Weacquired 69 self storage properties during the year ended December 31, 2019 and 57 self storage properties duringthe year ended December 31, 2018. As a result of these and other factors, we do not believe that our historical resultsof operations discussed and analyzed below are comparable or necessarily indicative of our future results ofoperations or cash flows.
To help analyze the operating performance of our self storage properties, we also discuss and analyze operatingresults relating to our same store portfolio. Our same store portfolio is defined as those properties owned andoperated since the first day of the earliest year presented, excluding any properties sold, expected to be sold orsubject to significant changes such as expansions or casualty events which cause the portfolio's year-over-yearoperating results to no longer be comparable.
The following discussion and analysis of the results of our operations and financial condition for the year endedDecember 31, 2019 compared to the year ended December 31, 2018 should be read in conjunction with theaccompanying consolidated financial statements included in Item 8. The discussion and analysis of the results of ouroperations and financial condition for the year ended December 31, 2018 compared to the year ended December 31,2017, can be found in Part II, "Item 7. Management’s Discussion and Analysis of Financial Condition and Results ofOperations" of our Annual Report on Form 10-K for the year ended December 31, 2018, which was filed with theSEC on February 26, 2019.
Certain figures, such as interest rates and other percentages, included in this section have been rounded for easeof presentation. Percentage figures included in this section have not in all cases been calculated on the basis of suchrounded figures but on the basis of such amounts prior to rounding. For this reason, percentage amounts in thissection may vary slightly from those obtained by performing the same calculations using the figures in ourconsolidated financial statements or in the associated text. Certain other amounts that appear in this section maysimilarly not sum due to rounding.
Table of Contents
39

Year Ended December 31, 2019 compared to the Year Ended December 31, 2018
Net income was $66.0 million for the year ended December 31, 2019, compared to $56.3 million for the yearended December 31, 2018, an increase of $9.7 million. The increase was primarily due to an increase in netoperating income ("NOI") resulting from self storage properties acquired during 2018 and 2019, increases inmanagement fees and other revenue, partially offset by increases in depreciation and amortization, interest expenseand general and administrative expenses. For a description of NOI, see "Non-GAAP Financial measures – NOI".
Overview
As of December 31, 2019, our same store portfolio consisted of 439 self storage properties. See "---Results ofOperations" above for the definition of our same store portfolio. The following table illustrates the changes in rentalrevenue, other property-related revenue, management fees and other revenue, property operating expenses, and otherexpenses for the year ended December 31, 2019 compared to the year ended December 31, 2018 (dollars inthousands):
Year Ended December 31,2019 2018 Change
Rental revenueSame store portfolio $ 287,179 $ 276,377 $ 10,802Non-same store portfolio 67,680 23,462 44,218Effect of bad debt expense classification resulting from
adoption of leasing standard — 8,564 (8,564)Total rental revenue 354,859 308,403 46,456
Other property-related revenueSame store portfolio 9,998 9,443 555Non-same store portfolio 2,304 740 1,564
Total other property-related revenue 12,302 10,183 2,119Property operating expenses
Same store portfolio 88,694 87,262 1,432Non-same store portfolio 21,653 8,049 13,604Effect of bad debt expense classification resulting from
adoption of leasing standard — 8,564 (8,564)Total property operating expenses 110,347 103,875 6,472
Net operating incomeSame store portfolio 208,483 198,558 9,925Non-same store portfolio 48,331 16,153 32,178
Total net operating income 256,814 214,711 42,103Management fees and other revenue 20,735 12,310 8,425General and administrative expenses (45,581) (36,220) (9,361)Depreciation and amortization (105,119) (89,147) (15,972)Other (expense) income
Interest expense (56,464) (42,724) (13,740)Equity in losses of unconsolidated real estate ventures (4,970) (1,423) (3,547)Acquisition costs (1,317) (663) (654)Non-operating income (expense) 452 (91) 543Gain on sale of self storage properties 2,814 391 2,423
Other expense (59,485) (44,510) (14,975)Income before income taxes 67,364 57,144 10,220
Income tax expense (1,351) (818) (533)Net income 66,013 56,326 9,687
Table of Contents
40

Year Ended December 31,2019 2018 Change
Net income attributable to noncontrolling interests (62,030) (42,217) (19,813)Net income attributable to National Storage
Affiliates Trust 3,983 14,109 (10,126)Distributions to preferred shareholders (12,390) (10,350) (2,040)
Net (loss) income attributable to common shareholders $ (8,407) $ 3,759 $ (12,166)
Total Revenue
Our total revenue increased by $57.0 million, or 17.2%, for the year ended December 31, 2019, as compared tothe year ended December 31, 2018. This increase was primarily attributable to incremental revenue from 69 selfstorage properties acquired during the year ended December 31, 2019, increases in management fees and otherrevenue from our unconsolidated real estate ventures and regular rental increases for in-place tenants.
Rental Revenue
Rental revenue increased by $46.5 million, or 15.1%, for the year ended December 31, 2019, as compared to theyear ended December 31, 2018. As discussed in Note 2 to the consolidated financial statements in Item 8, weadopted ASU 2016-02 and ASU 2018-11 effective January 1, 2019. As a result of this adoption, beginning onJanuary 1, 2019, activity related to uncollectible accounts is recognized as a current-period adjustment withinrevenue. For periods prior to January 1, 2019, such amounts were previously included in operating expenses, and assuch, for comparability, we have presented $8.6 million of activity related to uncollectible accounts as a reduction tosame store and non-same store rental revenue for the year ended December 31, 2018. The increase in rental revenuewas due to a $44.2 million increase in non-same store rental revenue which was primarily attributable to incrementalrental revenue of $29.6 million from 69 self storage properties acquired during 2019, and $15.4 million from 57 selfstorage properties acquired during 2018. Same store portfolio rental revenues increased $10.8 million, or 3.9%, dueto a 3.5% increase, from $11.58 to $11.98, in annualized same store rental revenue (including fees and net of anydiscounts and uncollectible customer amounts) divided by average occupied square feet ("average annualized rentalrevenue per occupied square foot"), driven primarily by increased contractual lease rates for in-place tenants andfees and an increase in average occupancy from 88.5% for the year ended December 31, 2018 to 88.8% for the yearended December 31, 2019. Average occupancy is calculated based on the average of the month-end occupancyimmediately preceding the period presented and the month-end occupancies included in the respective periodpresented.
Other Property-Related Revenue
Other property-related revenue represents ancillary income from our self storage properties, such as tenantinsurance-related access fees and sales of storage supplies. Other property-related revenue increased by $2.1 million,or 20.8%, for the year ended December 31, 2019, as compared to the year ended December 31, 2018. This increaseprimarily resulted from a $1.6 million increase in non-same store other property-related revenue which wasprimarily attributable to incremental other property-related revenue of $0.8 million from 69 self storage propertiesacquired during 2019, and $0.8 million from 57 self storage properties acquired during 2018.
Management Fees and Other Revenue
Management fees and other revenue, which are primarily related to managing and operating the unconsolidatedreal estate ventures, were $20.7 million for the year ended December 31, 2019, compared to $12.3 million for theyear ended December 31, 2018, an increase of $8.4 million or 68.4%. This increase was primarily attributable toincremental fees earned from the 2018 Joint Venture following the acquisition of the Initial 2018 JV Portfolio (asdefined in Note 2 to the consolidated financial statements in Item 8) in September 2018.
Property Operating Expenses
Property operating expenses were $110.3 million for the year ended December 31, 2019 compared to $103.9million for the year ended December 31, 2018, an increase of $6.4 million, or 6.2%. As discussed in Note 2 to theconsolidated financial statements in Item 8, we adopted ASU 2016-02 and ASU 2018-11 effective January 1, 2019.As a result of this adoption, beginning on January 1, 2019, activity related to uncollectible accounts is recognized asa current-period adjustment within revenue. For periods prior to January 1, 2019, such amounts were previously
Table of Contents
41

included in operating expenses, and as such, for comparability, we have presented $8.6 million of activity related touncollectible accounts as a reduction to same store and non-same store property operating expenses for the yearended December 31, 2018. The increase in property operating expenses resulted from a $13.6 million increase innon-same store property operating expenses that was primarily attributable to incremental property operatingexpenses of $9.3 million from 69 self storage properties acquired during 2019, and $4.6 million from 57 self storageproperties acquired during 2018.
General and Administrative Expenses
General and administrative expenses increased $9.4 million, or 25.8%, for the year ended December 31, 2019,compared to the year ended December 31, 2018. This increase was attributable to increases in supervisory andadministrative fees charged by our PROs of $3.1 million primarily as a result of incremental fees related to the 69self storage properties acquired during 2019, costs related to our property management platform of $2.3 million,salaries and benefits of $2.2 million, equity-based compensation expense of $0.7 million and $1.1 million of othergeneral and administrative expenses.
Depreciation and Amortization
Depreciation and amortization increased $16.0 million, or 17.9%, for the year ended December 31, 2019,compared to the year ended December 31, 2018. This increase was primarily attributable to incremental depreciationexpense related to the 69 self storage properties acquired during 2019, partially offset by a decrease in amortizationof customer in-place leases from $11.6 million for the year ended December 31, 2018 to $11.3 million for the yearended December 31, 2019.
Interest Expense
Interest expense increased $13.7 million, or 32.2%, for the year ended December 31, 2019, compared to theyear ended December 31, 2018. The increase in interest expense was primarily attributable to additional borrowingsconsisting of $155.0 million of additional term loan borrowings under the Company's credit facility on July 29, 2019and $100.0 million of borrowings under the 2029 Term Loan Facility. Additionally, on August 30, 2019, ouroperating partnership issued the $150.0 million Senior Unsecured Notes in a private placement to certain accreditedinvestors. The increase in interest expense from these additional borrowings was partially offset by loweroutstanding borrowings under the Revolver.
Equity In Losses Of Unconsolidated Real Estate Ventures
Equity in losses of unconsolidated real estate ventures represents our share of losses incurred through our 25%ownership interests in the 2018 Joint Venture and the 2016 Joint Venture. During the year ended December 31,2019, we recorded $5.0 million of equity in losses from our unconsolidated real estate ventures compared to $1.4million of losses for the year ended December 31, 2018. This was primarily the result of incremental losses from our2018 Joint Venture driven by real estate depreciation and amortization of customer in-place leases following theacquisition of the Initial 2018 JV Portfolio in September 2018.
Gain On Sale of Self Storage Properties
Gain on sale of self storage properties was $2.8 million for the year ended December 31, 2019, compared to$0.4 million for the year ended December 31, 2018. During the year ended December 31, 2019, we sold one selfstorage property to an unrelated third party for gross proceeds of $6.5 million and during the year ended December31, 2018, we sold two self storage properties to unrelated third parties for gross proceeds of $5.5 million.
Net Income Attributable to Noncontrolling Interests
As discussed in Note 2 to the consolidated financial statements in Item 8, we allocate U.S. generally acceptedaccounting principles ("GAAP") income (loss) utilizing the HLBV method, in which we allocate income or lossbased on the change in each unitholders' claim on the net assets of our operating partnership at period end afteradjusting for any distributions or contributions made during such period.
Due to the stated liquidation priorities and because the HLBV method incorporates non-cash items such asdepreciation expense, in any given period, income or loss may be allocated disproportionately to noncontrollinginterests. Net income attributable to noncontrolling interests was $62.0 million for the year ended December 31,2019, compared to $42.2 million for the year ended December 31, 2018.
Table of Contents
42

Critical Accounting Policies and Use of Estimates
Our financial statements have been prepared on the accrual basis of accounting in accordance with GAAP. Thepreparation of these financial statements requires us to make estimates and assumptions that affect the reportedamounts of assets and liabilities and disclosure of contingent assets and liabilities at the date of the financialstatements and the reported amounts of revenues and expenses during the reporting period. On an ongoing basis, weevaluate our estimates and assumptions, including those that impact our most critical accounting policies. We baseour estimates and assumptions on historical experience and on various other factors that we believe are reasonableunder the circumstances. Actual results may differ from these estimates. We believe the following are our mostcritical accounting policies.
Principles of Consolidation and Presentation of Noncontrolling Interests
Our consolidated financial statements include the accounts of our operating partnership and its controlledsubsidiaries. All significant intercompany balances and transactions have been eliminated in the consolidation ofentities.
The limited partner ownership interests in our operating partnership that are held by owners other than us arereferred to as noncontrolling interests. Noncontrolling interests also include ownership interests in DownREITpartnerships held by entities other than our operating partnership. Noncontrolling interests in a subsidiary aregenerally reported as a separate component of equity in our consolidated balance sheets. In our statements ofoperations, the revenues, expenses and net income or loss related to noncontrolling interests in our operatingpartnership are included in the consolidated amounts, with net income or loss attributable to the noncontrollinginterests deducted separately to arrive at the net income or loss solely attributable to us.
When we obtain an economic interest in an entity, we evaluate the entity to determine if the entity is deemed avariable interest entity ("VIE"), and if we are deemed to be the primary beneficiary, in accordance with authoritativeguidance issued on the consolidation of VIEs. When an entity is not deemed to be a VIE, we consider the provisionsof additional guidance to determine whether the general partner controls a limited partnership or similar entity whenthe limited partners have certain rights. We consolidate all entities that are VIEs and of which the Company isdeemed to be the primary beneficiary.
Self Storage Properties and Customer In-Place Leases
Self storage properties are carried at historical cost less accumulated depreciation and any impairment losses.When self storage properties are acquired, the purchase price is allocated to the tangible and intangible assetsacquired and liabilities assumed based on estimated fair values. The purchase price is allocated to the individualproperties based on the fair value determined using an income approach or a cash flow analysis using appropriaterisk adjusted capitalization rates, which take into account the relative size, age, and location of the individualproperties along with current and projected occupancy and relative rental rates or appraised values, if available.Tangible assets are allocated to land, buildings and related improvements, and furniture and equipment.
In allocating the purchase price for a self storage property acquisition, we determine whether the acquisitionincludes intangible assets. We allocate a portion of the purchase price to an intangible asset attributed to the value ofcustomer in-place leases. Because the majority of tenant leases are on a month-to-month basis, this intangible assetrepresents the estimated value of the leases in effect on the acquisition date. This intangible asset is amortized toexpense using the straight-line method over 12 months, the estimated average remaining rental period for the leases.
Table of Contents
43

Non-GAAP Financial Measures
FFO and Core FFO
Funds from operations, or FFO, is a widely used performance measure for real estate companies and is providedhere as a supplemental measure of the Company's operating performance. The December 2018 Nareit Funds FromOperations White Paper - 2018 Restatement, which we refer to as the White Paper, defines FFO as net income (asdetermined under GAAP), excluding: real estate depreciation and amortization, gains and losses from the sale ofcertain real estate assets, gains and losses from change in control, mark-to-market changes in value recognized onequity securities, impairment write-downs of certain real estate assets and impairment of investments in entitieswhen it is directly attributable to decreases in the value of depreciable real estate held by the entity and after items torecord unconsolidated partnerships and joint ventures on the same basis. Distributions declared on subordinatedperformance units and DownREIT subordinated performance units represent our allocation of FFO to noncontrollinginterests held by subordinated performance unitholders and DownREIT subordinated performance unitholders. Forpurposes of calculating FFO attributable to common shareholders, OP unitholders, and LTIP unitholders, weexclude distributions declared on subordinated performance units, DownREIT subordinated performance units,preferred shares and preferred units. We define Core FFO as FFO, as further adjusted to eliminate the impact ofcertain items that we do not consider indicative of our core operating performance. These further adjustments consistof acquisition costs, organizational and offering costs, gains on debt forgiveness, gains (losses) on earlyextinguishment of debt, and after adjustments for unconsolidated partnerships and joint ventures.
Management uses FFO and Core FFO as key performance indicators in evaluating the operations of ourproperties. Given the nature of our business as a real estate owner and operator, we consider FFO and Core FFO askey supplemental measures of our operating performance that are not specifically defined by GAAP. We believethat FFO and Core FFO are useful to management and investors as a starting point in measuring our operationalperformance because FFO and Core FFO exclude various items included in net income (loss) that do not relate to orare not indicative of our operating performance such as gains (or losses) from sales of self storage properties anddepreciation, which can make periodic and peer analyses of operating performance more difficult. Our computationof FFO and Core FFO may not be comparable to FFO reported by other REITs or real estate companies.
FFO and Core FFO should be considered in addition to, but not as a substitute for, other measures of financialperformance reported in accordance with GAAP, such as total revenues, operating income and net income (loss).FFO and Core FFO do not represent cash generated from operating activities determined in accordance with GAAPand are not a measure of liquidity or an indicator of our ability to make cash distributions. We believe that to furtherunderstand our performance, FFO and Core FFO should be compared with our reported net income (loss) andconsidered in addition to cash flows computed in accordance with GAAP, as presented in our consolidated financialstatements.
Table of Contents
44
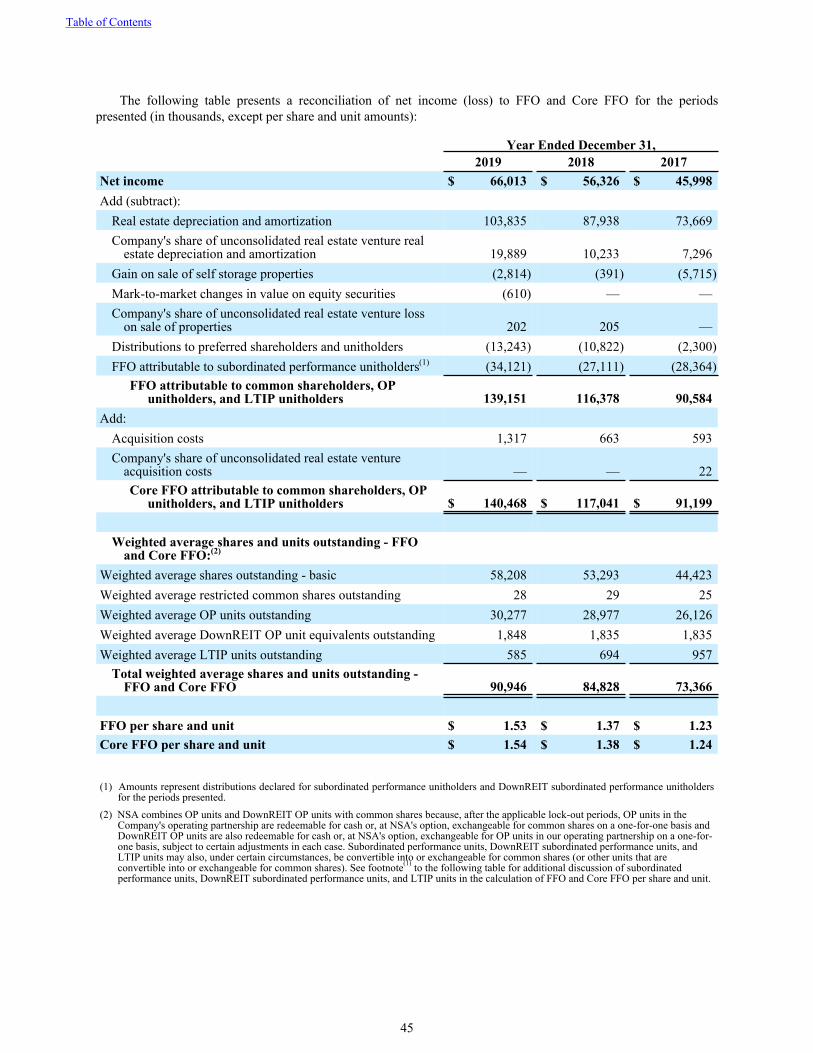
The following table presents a reconciliation of net income (loss) to FFO and Core FFO for the periodspresented (in thousands, except per share and unit amounts):
Year Ended December 31,2019 2018 2017
Net income $ 66,013 $ 56,326 $ 45,998Add (subtract):
Real estate depreciation and amortization 103,835 87,938 73,669Company's share of unconsolidated real estate venture real
estate depreciation and amortization 19,889 10,233 7,296Gain on sale of self storage properties (2,814) (391) (5,715)Mark-to-market changes in value on equity securities (610) — —Company's share of unconsolidated real estate venture loss
on sale of properties 202 205 —Distributions to preferred shareholders and unitholders (13,243) (10,822) (2,300)FFO attributable to subordinated performance unitholders(1) (34,121) (27,111) (28,364)
FFO attributable to common shareholders, OP unitholders, and LTIP unitholders 139,151 116,378 90,584
Add:Acquisition costs 1,317 663 593Company's share of unconsolidated real estate venture
acquisition costs — — 22Core FFO attributable to common shareholders, OP
unitholders, and LTIP unitholders $ 140,468 $ 117,041 $ 91,199
Weighted average shares and units outstanding - FFO and Core FFO:(2)
Weighted average shares outstanding - basic 58,208 53,293 44,423Weighted average restricted common shares outstanding 28 29 25Weighted average OP units outstanding 30,277 28,977 26,126Weighted average DownREIT OP unit equivalents outstanding 1,848 1,835 1,835Weighted average LTIP units outstanding 585 694 957
Total weighted average shares and units outstanding - FFO and Core FFO 90,946 84,828 73,366
FFO per share and unit $ 1.53 $ 1.37 $ 1.23Core FFO per share and unit $ 1.54 $ 1.38 $ 1.24
(1) Amounts represent distributions declared for subordinated performance unitholders and DownREIT subordinated performance unitholdersfor the periods presented.
(2) NSA combines OP units and DownREIT OP units with common shares because, after the applicable lock-out periods, OP units in the Company's operating partnership are redeemable for cash or, at NSA's option, exchangeable for common shares on a one-for-one basis and DownREIT OP units are also redeemable for cash or, at NSA's option, exchangeable for OP units in our operating partnership on a one-for-one basis, subject to certain adjustments in each case. Subordinated performance units, DownREIT subordinated performance units, and LTIP units may also, under certain circumstances, be convertible into or exchangeable for common shares (or other units that are convertible into or exchangeable for common shares). See footnote(1) to the following table for additional discussion of subordinated performance units, DownREIT subordinated performance units, and LTIP units in the calculation of FFO and Core FFO per share and unit.
Table of Contents
45

The following table presents a reconciliation of earnings (loss) per share - diluted to FFO and Core FFO pershare and unit for the periods presented:
Year Ended December 31,2019 2018 2017
Earnings (loss) per share - diluted $ (0.15) $ 0.07 $ 0.01Impact of the difference in weighted average number of
shares(1) 0.05 (0.03) —Impact of GAAP accounting for noncontrolling interests,
two-class method and treasury stock method(2) 0.69 0.49 0.59Add real estate depreciation and amortization 1.14 1.04 1.00Add Company's share unconsolidated venture real estate
depreciation and amortization 0.22 0.12 0.10Subtract gain on sale of self storage properties (0.03) — (0.08)Mark-to-market changes in value recognized on equity
securities (0.01) — —FFO attributable to subordinated performance unitholders (0.38) (0.32) (0.39)
FFO per share and unit 1.53 1.37 1.23Add acquisition costs and Company's share of unconsolidated
real estate venture acquisition costs 0.01 0.01 0.01Core FFO per share and unit $ 1.54 $ 1.38 $ 1.24
(1) Adjustment accounts for the difference between the weighted average number of shares used to calculate diluted earnings per share and theweighted average number of shares used to calculate FFO and Core FFO per share and unit. Diluted earnings per share is calculated usingthe two-class method for the company's restricted common shares, the treasury stock method for certain unvested LTIP units, and includesthe assumption of a hypothetical conversion of subordinated performance units and DownREIT subordinated performance units into OPunits, even though such units may only be convertible into OP units (i) after a lock-out period and (ii) upon certain events or conditions. Foradditional information about the conversion of subordinated performance units, DownREIT subordinated performance units and LTIP unitsinto OP units, see Note 10 to the consolidated financial statements in Item 8. The computation of weighted average shares and units forFFO and Core FFO per share and unit includes all restricted common shares and LTIP units that participate in distributions and excludes allsubordinated performance units and DownREIT subordinated performance units because their effect has been accounted for through theallocation of FFO to the related unitholders based on distributions declared.
(2) Represents the effect of adjusting the numerator to consolidated net income (loss) prior to GAAP allocations for noncontrolling interests, after deducting preferred share and unit distributions, and before the application of the two-class method and treasury stock method, as described in footnote (1).
NOI
We define NOI as net income (loss), as determined under GAAP, plus general and administrative expenses,depreciation and amortization, interest expense, loss on early extinguishment of debt, equity in earnings (losses) ofunconsolidated real estate ventures, acquisition costs, organizational and offering expenses, income tax expense,impairment of long-lived assets, losses on the sale of properties and non-operating expense and by subtractingmanagement fees and other revenue, gains on sale of properties, debt forgiveness, and non-operating income. NOI isnot a measure of performance calculated in accordance with GAAP.
We believe NOI is useful to investors in evaluating our operating performance because:
• NOI is one of the primary measures used by our management and our PROs to evaluate the economic productivity of our properties, including our ability to lease our properties, increase pricing and occupancy and control our property operating expenses;
• NOI is widely used in the real estate industry and the self storage industry to measure the performance and value of real estate assets without regard to various items included in net income that do not relate to or are not indicative of operating performance, such as depreciation and amortization, which can vary depending upon accounting methods, the book value of assets, and the impact of our capital structure; and
• We believe NOI helps our investors to meaningfully compare the results of our operating performance from period to period by removing the impact of our capital structure (primarily interest expense on our outstanding indebtedness) and depreciation of the cost basis of our assets from our operating results.
Table of Contents
46

There are material limitations to using a non-GAAP measure such as NOI, including the difficulty associatedwith comparing results among more than one company and the inability to analyze certain significant items,including depreciation and interest expense, that directly affect our net income (loss). We compensate for theselimitations by considering the economic effect of the excluded expense items independently as well as in connectionwith our analysis of net income (loss). NOI should be considered in addition to, but not as a substitute for, othermeasures of financial performance reported in accordance with GAAP, such as total revenues, income fromoperations and net loss.
The following table presents a reconciliation of net income (loss) to NOI for the periods presented (dollars inthousands):
Year Ended December 31,2019 2018 2017
Net income $ 66,013 $ 56,326 $ 45,998(Subtract) add:
Management fees and other revenue (20,735) (12,310) (8,061)General and administrative expenses 45,581 36,220 30,060Depreciation and amortization 105,119 89,147 75,115Interest expense 56,464 42,724 34,068Equity in losses of unconsolidated real estate venture 4,970 1,423 2,339Acquisition costs 1,317 663 593Income tax expense 1,351 818 1,159Gain on sale of self storage properties (2,814) (391) (5,715)Non-operating (income) expense (452) 91 58
Net operating income $ 256,814 $ 214,711 $ 175,614
Our consolidated NOI shown in the table above does not include our proportionate share of NOI for ourunconsolidated real estate ventures. For additional information about our 2018 Joint Venture and 2016 JointVenture see Note 5 to the consolidated financial statements in Item 8.
EBITDA and Adjusted EBITDA
We define EBITDA as net income (loss), as determined under GAAP, plus interest expense, loss on earlyextinguishment of debt, income taxes, depreciation and amortization expense and the Company's share ofunconsolidated real estate venture depreciation and amortization. We define Adjusted EBITDA as EBITDA plusacquisition costs, organizational and offering expenses, equity-based compensation expense, losses on sale ofproperties and impairment of long-lived assets, minus gains on sale of properties and debt forgiveness, and afteradjustments for unconsolidated partnerships and joint ventures. These further adjustments eliminate the impact ofitems that we do not consider indicative of our core operating performance. In evaluating EBITDA and AdjustedEBITDA, you should be aware that in the future we may incur expenses that are the same as or similar to some ofthe adjustments in this presentation. Our presentation of EBITDA and Adjusted EBITDA should not be construed asan inference that our future results will be unaffected by unusual or non-recurring items.
We present EBITDA and Adjusted EBITDA because we believe they assist investors and analysts in comparingour performance across reporting periods on a consistent basis by excluding items that we do not believe areindicative of our core operating performance. EBITDA and Adjusted EBITDA have limitations as an analytical tool.Some of these limitations are:
• EBITDA and Adjusted EBITDA do not reflect our cash expenditures, or future requirements, for capital expenditures, contractual commitments or working capital needs;
• EBITDA and Adjusted EBITDA do not reflect the significant interest expense, or the cash requirements necessary to service interest or principal payments, on our debts;
• although depreciation and amortization are non-cash charges, the assets being depreciated and amortized will often have to be replaced in the future, and EBITDA and Adjusted EBITDA do not reflect any cash requirements for such replacements;
Table of Contents
47

• Adjusted EBITDA excludes equity-based compensation expense, which is and will remain a key element of our overall long-term incentive compensation package, although we exclude it as an expense when evaluating our ongoing operating performance for a particular period;
• EBITDA and Adjusted EBITDA do not reflect the impact of certain cash charges resulting from matters we consider not to be indicative of our ongoing operations; and
• other companies in our industry may calculate EBITDA and Adjusted EBITDA differently than we do, limiting their usefulness as comparative measures.
We compensate for these limitations by considering the economic effect of the excluded expense itemsindependently as well as in connection with our analysis of net income (loss). EBITDA and Adjusted EBITDAshould be considered in addition to, but not as a substitute for, other measures of financial performance reported inaccordance with GAAP, such as total revenues, income from operations, and net income (loss).
The following table presents a reconciliation of net loss to EBITDA and Adjusted EBITDA for the periodspresented (dollars in thousands):
Year Ended December 31,2019 2018 2017
Net income $ 66,013 $ 56,326 $ 45,998Add:
Depreciation and amortization 105,119 89,147 75,115Company's share of unconsolidated real estate venture
depreciation and amortization 19,889 10,233 7,296Income tax expense 1,351 818 1,159Interest expense 56,464 42,724 34,068
EBITDA 248,836 199,248 163,636Add:
Acquisition costs 1,317 663 593Company's share of unconsolidated real estate venture
acquisition costs — — 22Gain on sale of self storage properties (2,814) (391) (5,715)Company's share of unconsolidated real estate venture loss
on sale of properties 202 205 —Equity-based compensation expense 4,527 3,837 3,764
Adjusted EBITDA $ 252,068 $ 203,562 $ 162,300
Liquidity and Capital Resources
Liquidity Overview
Liquidity is the ability to meet present and future financial obligations. Our primary source of liquidity is cashflow from our operations. Additional sources are proceeds from equity and debt offerings, and debt financingsincluding borrowings under the credit facility, 2023 Term Loan Facility, 2028 Term Loan Facility and 2029 TermLoan Facility.
Our short-term liquidity requirements consist primarily of property operating expenses, property acquisitions,capital expenditures, general and administrative expenses and principal and interest on our outstanding indebtedness.A further short-term liquidity requirement relates to distributions to our common and preferred shareholders andholders of preferred units, OP units, subordinated performance units, DownREIT OP units and DownREITsubordinated performance units. We expect to fund short-term liquidity requirements from our operating cash flow,cash on hand and borrowings under our credit facility.
Our long-term liquidity needs consist primarily of the repayment of debt, property acquisitions, and capitalexpenditures. We acquire properties through the use of cash, preferred units, OP units and subordinated performanceunits in our operating partnership or DownREIT partnerships. We expect to meet our long-term liquidity
Table of Contents
48

requirements with operating cash flow, cash on hand, secured and unsecured indebtedness, and the issuance ofequity and debt securities.
The availability of credit and its related effect on the overall economy may affect our liquidity and futurefinancing activities, both through changes in interest rates and access to financing. Currently, interest rates are lowcompared to historical levels and many lenders are active in the market. We believe that, as a publicly-traded REIT,we will have access to multiple sources of capital to fund our long-term liquidity requirements, including theincurrence of additional debt and the issuance of debt and additional equity securities. However, we cannot assureyou that this will be the case.
Cash Flows
At December 31, 2019, we had $20.6 million in cash and cash equivalents and $3.7 million of restricted cash,an increase in cash and cash equivalents of $7.4 million and an increase in restricted cash of $0.5 million fromDecember 31, 2018. Restricted cash primarily consists of escrowed funds deposited with financial institutions forreal estate taxes, insurance, and other reserves for capital improvements in accordance with our loan agreements.The following discussion relates to changes in cash due to operating, investing, and financing activities, which arepresented in our consolidated statements of cash flows included in Item 8 of this report.
Operating Activities
Cash provided by our operating activities was $196.7 million for the year ended December 31, 2019 comparedto $161.8 million for the year ended December 31, 2018, an increase of $34.9 million. Our operating cash flowincreased primarily due to 57 self storage properties acquired during the year ended December 31, 2018 thatgenerated cash flow for the entire year ended December 31, 2019 and 69 self storage properties that were acquiredduring the year ended December 31, 2019. In addition, operating distributions from our unconsolidated real estateventures increased by $6.4 million for the year ended December 31, 2019 compared to the year ended December 31,2018. These increases were partially offset by higher cash payments for general and administrative expenses andinterest expense.
Investing Activities
Cash used in investing activities was $393.0 million for the year ended December 31, 2019 compared to $514.5million for the year ended December 31, 2018. The primary uses of cash for the year ended December 31, 2019were for our acquisition of 69 self storage properties for cash consideration of $371.1 million, the acquisition ofequity securities for $12.7 million, deposits for potential acquisitions of $4.4 million, capital expenditures of $20.6million and the acquisition of the interest in a reinsurance company and related cash flows of $6.6 million, partiallyoffset by distributions from unconsolidated real estate ventures of $11.5 million, $6.3 million of proceeds from thesale of one self storage property and $5.4 million of proceeds from the sale of equity securities. The primary uses ofcash for the year ended December 31, 2018 were for our acquisition of 57 self storage properties and an expansionproject for cash consideration of $313.7 million, investments in our unconsolidated real estate ventures of $165.6million, deposits for acquisitions of $21.0 million and capital expenditures of $19.0 million, partially offset by $5.3million of proceeds from the sale of two self storage properties.
Capital expenditures totaled $20.6 million, $19.0 million and $14.7 million during the years endedDecember 31, 2019, 2018 and 2017 respectively, we generally fund post-acquisition capital additions from cashprovided by operating activities.
We categorize our capital expenditures broadly into three primary categories:
• recurring capital expenditures, which represent the portion of capital expenditures that are deemed to replace the consumed portion of acquired capital assets and extend their useful life;
• value enhancing capital expenditures, which represent the portion of capital expenditures that are made to enhance the revenue and value of an asset from its original purchase condition; and
• acquisitions capital expenditures, which represent the portion of capital expenditures capitalized during the current period that were identified and underwritten prior to a property's acquisition.
Table of Contents
49

The following table presents a summary of the capital expenditures for these categories, along with areconciliation of the total for these categories to the capital expenditures reported in the accompanying consolidatedstatements of cash flows for the periods presented (dollars in thousands):
Year Ended December 31,2019 2018 2017
Recurring capital expenditures $ 8,708 $ 6,001 $ 3,495Value enhancing capital expenditures 4,420 3,563 2,755Acquisitions capital expenditures 8,305 9,356 8,953
Total capital expenditures 21,433 18,920 15,203Change in accrued capital spending (839) 94 (547)
Capital expenditures per statement of cash flows $ 20,594 $ 19,014 $ 14,656
Financing Activities
Cash provided by our financing activities was $204.3 million for the year ended December 31, 2019 comparedto $352.6 million for the year ended December 31, 2018. Our sources of financing cash flows for the year endedDecember 31, 2019 primarily consisted of $572.0 million of borrowings under our credit facility, $100.0 million ofborrowings under our 2029 Term Loan Facility, $150.0 million of borrowings under our Senior Unsecured Notes,$70.6 million of proceeds from the issuance of common shares and $43.6 million of proceeds from the issuance ofSeries A Preferred Shares. Our primary uses of financing cash flows for the year ended December 31, 2019 werefor principal payments on existing debt of $561.6 million (which included $556.5 million of principal repaymentsunder the Revolver and $5.1 million of scheduled fixed rate mortgage principal payments), distributions tononcontrolling interests of $76.0 million, distributions to common shareholders of $74.5 million and distributions topreferred shareholders of $12.4 million. Our sources of financing cash flows for the year ended December 31, 2018primarily consisted of $175.6 million of proceeds from the issuance of common shares, $672.5 million ofborrowings under our credit facility, $75.0 million of borrowings under our 2023 Term Loan Facility and $75.0million of borrowings under our 2028 Term Loan Facility. Our primary uses of financing cash flows for the yearended December 31, 2018 were for principal payments on existing debt of $507.2 million (which included $496.5million of principal repayments under the Revolver, $5.8 million of fixed rate mortgage principal payoffs and $4.9million of scheduled fixed rate mortgage principal payments), distributions to noncontrolling interests of $63.4million, distributions to common shareholders of $62.2 million and distributions to preferred shareholders of $10.4million.
Credit Facility and Term Loan Facilities
As of December 31, 2019, our credit facility provided for total borrowings of $1.275 billion, consisting of fivecomponents: (i) a Revolver which provides for a total borrowing commitment up to $500.0 million, whereby wemay borrow, repay and re-borrow amounts under the Revolver, (ii) a $125.0 million Term Loan A, (iii) a $250.0million Term Loan B, (iv) a $225.0 million Term Loan C and (v) a $175.0 million Term Loan D. The Revolvermatures in January 2024; provided that we may elect to extend the maturity to July 2024 by paying an extension feeof 0.075% of the total borrowing commitment thereunder at the time of extension and meeting other customaryconditions with respect to compliance. The Term Loan A matures in January 2023, the Term Loan B matures in July2024, the Term Loan C matures in January 2025 and the Term Loan D matures in July 2026. The Revolver, TermLoan A, Term Loan B, Term Loan C and Term Loan D are not subject to any scheduled reduction or amortizationpayments prior to maturity. As of December 31, 2019, we have an expansion option under the credit facility, which,if exercised in full, would provide for a total credit facility of $1.750 billion.
As of December 31, 2019, $125.0 million was outstanding under the Term Loan A with an effective interest rateof 3.74%, $250.0 million was outstanding under the Term Loan B with an effective interest rate of 2.91%, $225.0million was outstanding under the Term Loan C with an effective interest rate of 2.80%, $175.0 million wasoutstanding under the Term Loan D with an effective interest rate of 3.57%. As of December 31, 2019, we wouldhave had the capacity to borrow remaining Revolver commitments of $494.3 million while remaining in compliancewith the credit facility's financial covenants.
We have a 2023 Term Loan Facility that matures in June 2023 and is separate from the credit facility in anaggregate amount of $175.0 million. As of December 31, 2019 the entire amount was outstanding under the 2023
Table of Contents
50

Term Loan Facility with an effective interest rate of 2.83%. We have an expansion option under the 2023 TermLoan Facility, which, if exercised in full, would provide for total borrowings in an aggregate amount of $400.0million.
We have a 2028 Term Loan Facility that matures in December 2028 and is separate from the credit facility and2023 Term Loan Facility in an aggregate amount of $75.0 million. As of December 31, 2019 the entire amount wasoutstanding under the 2028 Term Loan Facility with an effective interest rate of 4.62%. We have an expansionoption under the 2028 Term Loan Facility, which, if exercised in full, would provide for total borrowings in anaggregate amount up to $125.0 million.
During the year ended December 31, 2019, we entered into a credit agreement with a lender for the 2029 TermLoan Facility that matures in April 2029 and is separate from the credit facility, 2023 Term Loan Facility and 2028Term Loan Facility in an aggregate amount of $100.0 million. As of December 31, 2019 the entire amount wasoutstanding under the 2029 Term Loan Facility with an effective interest rate of 4.27%.
For a summary of our financial covenants and additional detail regarding our credit facility, 2023 Term LoanFacility, 2028 Term Loan Facility and 2029 Term Loan Facility, please see Note 8 to the consolidated financialstatements in Item 8.
2029 And 2031 Senior Unsecured Notes
As discussed in Note 8 to the consolidated financial statements in Item 8, on August 30, 2019, our operatingpartnership issued $100.0 million of 3.98% senior unsecured notes due August 30, 2029 and $50.0 million of 4.08%senior unsecured notes due August 30, 2031 in a private placement to certain accredited investors.
Contractual Obligations
The following table summarizes information contained elsewhere in this Annual Report on Form 10-Kregarding payments due under contractual obligations and commitments on an undiscounted basis as ofDecember 31, 2019 (dollars in thousands):
Year Ending December 31,2020 2021 2022 2023 2024 Thereafter Total
Debt financings:Principal(1) $ 40,647 $ 7,603 $ 4,205 $ 377,049 $ 271,964 $ 837,792 $1,539,260Interest(2) 54,498 53,571 53,381 44,468 36,474 89,512 331,904Real estate leasehold
interests 1,419 1,444 1,459 1,464 1,470 36,728 43,984Office lease 286 387 381 346 353 691 2,444Total $ 96,850 $ 63,005 $ 59,426 $ 423,327 $ 310,261 $ 964,723 $1,917,592
(1) Includes scheduled principal and maturity payments related to our debt financings.(2) Interest is calculated until the maturity date (without regard to any extension that may be elected by the Company) based on the outstanding
principal balance and the effective interest rate as of December 31, 2019.
Equity Transactions
Issuance of Common Shares and Series A Preferred Shares
During the year ended December 31, 2019, we sold 2,375,000 of our common shares and 1,785,680 of ourSeries A Preferred Shares through at the market offerings. The common shares were sold at an average offeringprice of $30.06 per share, resulting in net proceeds to us of approximately $70.6 million after deductingcompensation payable by us to such agents and offering expenses. The Series A Preferred Shares were sold at anaverage offering price of $24.84 per share, resulting in net proceeds to us of approximately $43.6 million afterdeducting compensation payable by us to such agents and offering expenses.
During the year ended December 31, 2019, after receiving notices of redemption from certain OP unitholders,we elected to issue 581,001 common shares to such holders in exchange for 581,001 OP units in satisfaction of theoperating partnership's redemption obligations.
Table of Contents
51

During the year ended December 31, 2019, the Company issued 37,770 common shares in exchange for $1.3million of principal payment reimbursements received during the year ended December 31, 2019 related tomortgages assumed in connection with the acquisition of self storage properties from PROs during the year endedDecember 31, 2014.
Issuance of OP Equity
In connection with the 69 properties acquired during the year ended December 31, 2019, $51.8 million of OPequity was issued (consisting of 350,319 OP units, 340,702 Series A-1 preferred units and 1,178,400 subordinatedperformance units).
During the year ended December 31, 2019, the Company issued 863,148 OP units upon conversion of 913,680subordinated performance units and 13,475 DownREIT OP units upon conversion of 15,377 DownREITsubordinated performance units as further described under "Subordinated Performance Units and DownREITSubordinated Performance Units" in Note 3 to the consolidated financial statements in Item 8.
Dividends and Distributions
During the year ended December 31, 2019, the Company paid $74.5 million of distributions to commonshareholders, $12.4 million of distributions to preferred shareholders and distributed $76.0 million to noncontrollinginterests.
On February 20, 2020, our board of trustees declared a cash dividend and distribution, respectively, of $0.33 percommon share and OP unit to shareholders and OP unitholders of record as of March 13, 2020. On February 20,2020, our board of trustees also declared cash distributions of $0.375 per Series A Preferred Share and Series A-1preferred unit to shareholders and unitholders of record as of March 13, 2020. In addition, we expect to declare acash distribution in the first quarter of 2020 to our subordinated performance unitholders of record as of March 13,2020. Such dividends and distributions are expected to be paid on March 31, 2020.
Cash Distributions from our Operating Partnership
Under the LP Agreement of our operating partnership, to the extent that we, as the general partner of ouroperating partnership, determine to make distributions to the partners of our operating partnership out of theoperating cash flow or capital transaction proceeds generated by a real property portfolio managed by one of ourPROs, the holders of the series of subordinated performance units that relate to such portfolio are entitled to share insuch distributions. Under the LP Agreement of our operating partnership, operating cash flow with respect to aportfolio of properties managed by one of our PROs is generally an amount determined by us, as general partner ofour operating partnership, equal to the excess of property revenues over property related expenses from thatportfolio. In general, property revenue from the portfolio includes:
(i) all receipts, including rents and other operating revenues;
(ii) any incentive, financing, break-up and other fees paid to us by third parties;
(iii) amounts released from previously set aside reserves; and
(iv) any other amounts received by us, which we allocate to the particular portfolio of properties.
In general, property-related expenses include all direct expenses related to the operation of the properties in thatportfolio, including real property taxes, insurance, property-level general and administrative expenses, employeecosts, utilities, property marketing expense, property maintenance and property reserves and other expenses incurredat the property level. In addition, other expenses incurred by our operating partnership will also be allocated by us,as general partner, to the property portfolio and will be included in the property-related expenses of that portfolio.Examples of such other expenses include:
(i) corporate-level general and administrative expenses;
(ii) out-of-pocket costs, expenses and fees of our operating partnership, whether or not capitalized;
(iii) the costs and expenses of organizing and operating our operating partnership;
(iv) amounts paid or due in respect of any loan or other indebtedness of our operating partnership during such period;
Table of Contents
52

(v) extraordinary expenses of our operating partnership not previously or otherwise deducted under item (ii) above;
(vi) any third-party costs and expenses associated with identifying, analyzing, and presenting a proposed property to us and/or our operating partnership; and
(vii) reserves to meet anticipated operating expenditures, debt service or other liabilities, as determined by us.
To the extent that we, as the general partner of our operating partnership, determine to make distributions to thepartners of our operating partnership out of the operating cash flow of a real property portfolio managed by one ofour PROs, operating cash flow from a property portfolio is required to be allocated to OP unitholders and to theholders of series of subordinated performance units that relate to such property portfolio as follows:
First, an amount is allocated to OP unitholders in order to provide OP unitholders (together with any priorallocations of capital transaction proceeds) with a cumulative preferred allocation on the unreturned capitalcontributions attributed to the OP units in respect of such property portfolio. The preferred allocation for all of ourexisting portfolios is 6%. As of December 31, 2019, our operating partnership had an aggregate of $1,632.2 millionof unreturned capital contributions with respect to common shareholders and OP unitholders, with respect to thevarious property portfolios.
Second, an amount is allocated to the holders of the series of subordinated performance units relating to suchproperty portfolio in order to provide such holders with an allocation (together with prior distributions of capitaltransaction proceeds) on their unreturned capital contributions. Although the subordinated allocation for thesubordinated performance units is non-cumulative from period to period, if the operating cash flow from a propertyportfolio related to a series of subordinated performance units is sufficient, in the judgment of the general partner(with the approval of a majority of our independent trustees), to fund distributions to the holders of such series ofsubordinated performance units, but we, as the general partner of our operating partnership, decline to makedistributions to such holders, the amount available but not paid as distributions will be added to the subordinatedallocation corresponding to such series of subordinated performance units. The subordinated allocation for theoutstanding subordinated performance units is 6%. As of December 31, 2019, an aggregate of $152.8 million ofunreturned capital contributions has been allocated to the various series of subordinated performance units.
Thereafter, any additional operating cash flow is allocated to OP unitholders and the applicable series ofsubordinated performance units equally.
Following the allocation described above, we as the general partner of our operating partnership, will generallycause our operating partnership to distribute the amounts allocated to the relevant series of subordinatedperformance units to the holders of such series of subordinated performance units. We, as the general partner, maycause our operating partnership to distribute the amounts allocated to OP unitholders or may cause our operatingpartnership to retain such amounts to be used by our operating partnership for any purpose. Any operating cash flowthat is attributable to amounts retained by our operating partnership pursuant to the preceding sentence will generallybe available to be allocated as an additional capital contribution to the various property portfolios.
The foregoing description of the allocation of operating cash flow between the OP unitholders and subordinatedperformance unitholders is used for purposes of determining distributions to holders of subordinated performanceunits but does not necessarily represent the operating cash flow that will be distributed to OP unitholders (or paid asdividends to holders of our common shares). Any distribution of operating cash flow allocated to the OP unitholderswill be made at our discretion (and paid as dividends to holders of our common shares at the discretion of our boardof trustees).
Under the LP Agreement of our operating partnership, capital transactions are transactions that are outside theordinary course of our operating partnership's business, involve the sale, exchange, other disposition, or refinancingof any property, and are designated as capital transactions by us, as the general partner. To the extent the generalpartner determines to distribute capital transaction proceeds, the proceeds from capital transactions involving aparticular property portfolio are required to be allocated to OP unitholders and to the series of subordinatedperformance units that relate to such property portfolio as follows:
First, an amount determined by us, as the general partner, of such capital transaction proceeds is allocated to OPunitholders in order to provide OP unitholders (together with any prior allocations of operating cash flow) with acumulative preferred allocation on the unreturned capital contributions attributed to the OP unitholders in respect of
Table of Contents
53

such property portfolio that relate to such capital transaction plus an additional amount equal to such unreturnedcapital contributions.
Second, an amount determined by us, as the general partner, is allocated to the holders of the series ofsubordinated performance units relating to such property portfolio in order to provide such holders with a non-cumulative subordinated allocation on the unreturned capital contributions made by such holders in respect of suchproperty portfolio that relate to such capital transaction plus an additional amount equal to such unreturned capitalcontributions.
The preferred allocation and subordinated allocation with respect to capital transaction proceeds for eachportfolio is equal to the preferred allocation and subordinated allocation for distributions of operating cash flow withrespect to that portfolio.
Thereafter, any additional capital transaction proceeds are allocated to OP unitholders and the applicable seriesof subordinated performance units equally.
Following the allocation described above, we, as the general partner of our operating partnership, will generallycause our operating partnership to distribute the amounts allocated to the relevant series of subordinatedperformance units to the holders of such series of subordinated performance units. We, as general partner of ouroperating partnership, may cause our operating partnership to distribute the amounts allocated to the OP unitholdersor may cause our operating partnership to retain such amounts to be used by our operating partnership for anypurpose. Any capital transaction proceeds that are attributable to amounts retained by our operating partnershippursuant to the preceding sentence will generally be available to be allocated as an additional capital contribution tothe various property portfolios.
The foregoing allocation of capital transaction proceeds between the OP unitholders and subordinatedperformance unitholders is used for purposes of determining distributions to holders of subordinated performanceunits but does not necessarily represent the capital transaction proceeds that will be distributed to OP unitholders (orpaid as dividends to holders of our common shares). Any distribution of capital transaction proceeds allocated to theOP unitholders will be made at our discretion (and paid as dividends to holders of our common shares at thediscretion of our board of trustees).
Our OP units are redeemable for cash or, at our option exchangeable on a one-for-one basis into common sharesafter an agreed period of time and certain other conditions. Our subordinated performance units are only convertibleinto OP units following a two year lock-out period and then (i) at the holder's election only upon the achievement ofcertain performance thresholds relating to the properties to which such subordinated performance units relate or(ii) at our election upon a retirement event of a PRO that holds such subordinated performance units or upon certainqualifying terminations.
Notwithstanding the two-year lock out period on conversions of subordinated performance units into OP units,if such subordinated performance units were convertible into OP units as of December 31, 2019, each subordinatedperformance unit would on average hypothetically convert into 1.48 OP units, or into an aggregate of approximately22.8 million OP units. These amounts are based on historical financial information for the trailing twelve monthsended December 31, 2019. The hypothetical conversion is calculated by dividing the average cash available fordistribution, or CAD, per subordinated performance unit by 110% of the CAD per OP unit over the same period. Weanticipate that as our CAD grows over time, the conversion ratio will also grow, including to levels that may exceedthis amount. The actual number of OP units into which such subordinated performance units will becomeconvertible may vary significantly and will depend upon the applicable conversion penalty and the actual CAD tothe OP units and the actual CAD to the converted subordinated performance units in the one-year period endingprior to conversion. We have also granted registration rights to those persons who will be eligible to receivecommon shares issuable upon exchange of OP units issued in our formation transactions and certain contributiontransactions.
Table of Contents
54
Allocation of Capital Contributions
We, as the general partner of our operating partnership, in our discretion, have the right to increase or decrease,as appropriate, the amount of capital contributions allocated to our operating partnership in general and to eachseries of subordinated performance units to reflect capital expenditures made by our operating partnership in respectof each portfolio, the sale or refinancing of all or a portion of the properties comprising the portfolio, the distributionof capital transaction proceeds by our operating partnership, the retention by our operating partnership of cash forworking capital purposes and other events impacting the amount of capital contributions allocated to the holders. Inaddition, to avoid conflicts of interests, any decision by us to increase or decrease allocations of capital contributionsmust also be approved by a majority of our independent trustees.
Off-Balance Sheet Arrangements
Except as disclosed in the notes to our financial statements, as of December 31, 2019, we did not have anyrelationships with unconsolidated entities or financial partnerships, such as entities often referred to as structuredfinance or special purposes entities, which typically are established for the purpose of facilitating off-balance sheetarrangements or other contractually narrow or limited purposes. Further, except as disclosed in the notes to ourfinancial statements, as of December 31, 2019, we have not guaranteed any obligations of unconsolidated entitiesnor made any commitments to provide funding to any such entities that creates any material exposure to anyfinancing, liquidity, market or credit risk.
Segment
We manage our business as one reportable segment consisting of investments in self storage properties locatedin the United States. Although we operate in several markets, these operations have been aggregated into onereportable segment based on the similar economic characteristics among all markets.
Seasonality
The self storage business is subject to minor seasonal fluctuations. A greater portion of revenues and profits arerealized from May through September. Historically, our highest level of occupancy has typically been in July, whileour lowest level of occupancy has typically been in February. Results for any quarter may not be indicative of theresults that may be achieved for the full fiscal year.
Inflation
Inflation in the United States has been relatively low in recent years and did not have a material impact on ourresults of operations for the years ended December 31, 2019, 2018 and 2017. Although the impact of inflation hasbeen relatively insignificant in recent years, it remains a factor in the U.S. economy and may increase the cost ofacquiring or replacing self storage properties and related improvements, as well as real estate property taxes,employee salaries, wages and benefits, utilities, and other expenses. Because our tenant leases are month-to-month,we may be able to rapidly adjust our rental rates to minimize the adverse impact of any inflation which couldmitigate our exposure to increases in costs and expenses resulting from inflation.
ITEM 7A. Quantitative and Qualitative Disclosures About Market Risk
Market risk refers to the risk of loss from adverse changes in market prices and interest rates. Our futureincome, cash flows, and fair values of financial instruments are dependent upon prevailing market interest rates. Theprimary market risk to which we believe we are exposed is interest rate risk. Interest rate risk is highly sensitive tomany factors, including governmental monetary and tax policies, domestic and international economic and politicalconsiderations, and other factors beyond our control. We use interest rate swaps to moderate our exposure to interestrate risk by effectively converting the interest on variable rate debt to a fixed rate. We make limited use of otherderivative financial instruments and we do not use them for trading or other speculative purposes.
As of December 31, 2019, all our debt subject to variable interest rates was fixed pursuant to interest rate swapagreements.
When we have variable interest rate debt, we determine the interest rate risk amounts by considering the impactof hypothetical interest rates on our financial instruments. These analyses do not consider the effect of any change inoverall economic activity that could occur. Further, in the event of a change, we may take actions to further mitigateour exposure to the change. However, due to the uncertainty of the specific actions that would be taken and theirpossible effects, these analyses would assume no changes in our financial structure.
Table of Contents
55

Item 8. Financial Statements and Supplementary Data
The independent registered public accounting firm's reports, consolidated financial statements and schedulelisted in the accompanying index are filed as part of this report and incorporated herein by this reference. See "Indexto Financial Statements" on page F-1 of this Annual Report on Form 10-K.
Item 9. Changes in and Disagreements With Accountants on Accounting and Financial Disclosure
None.
Item 9A. Controls and Procedures
Disclosure Controls and Procedures
A review and evaluation was performed by our management, including our Chief Executive Officer (the"CEO") and Chief Financial Officer (the "CFO"), of the effectiveness of the design and operation of our disclosurecontrols and procedures (as such term is defined in Rules 13a-15(e) and 15d-15(e) under the Exchange Act), as ofthe end of the period covered by this Annual Report on Form 10-K. Based on that review and evaluation, the CEOand CFO have concluded that our current disclosure controls and procedures, as designed and implemented, wereeffective.
Notwithstanding the foregoing, a control system, no matter how well designed and operated, can provide onlyreasonable, not absolute, assurance that it will detect or uncover failures within the Company to disclose materialinformation otherwise required to be set forth in our periodic reports.
Management's Report on Internal Control Over Financial Reporting
Our management is responsible for establishing and maintaining adequate internal control over financialreporting. Internal control over financial reporting is defined in Rules 13a-15(f) and 15d-15(f) promulgated underthe Exchange Act as a process designed by, or under the supervision of, our principal executive and principalfinancial officers and effected by our board of trustees, audit committee, management and other personnel to providereasonable assurance regarding the reliability of financial reporting and the preparation of financial statements forexternal purposes in accordance with U.S. GAAP and includes those policies and procedures that:
• pertain to the maintenance of records that in reasonable detail accurately and fairly reflect the transactions and dispositions of the assets of the Company;
• provide reasonable assurance that transactions are recorded as necessary to permit preparation of financial statements in accordance with U.S. GAAP, and that our receipts and expenditures are being made only in accordance with authorizations of our management and trustees; and
• provide reasonable assurance regarding prevention or timely detection of unauthorized acquisition, use or disposition of our assets that could have a material effect on the financial statements.
Because of its inherent limitations, internal control over financial reporting may not prevent or detectmisstatements. Projections of any evaluation of effectiveness to future periods are subject to the risks that controlsmay become inadequate because of changes in conditions or that the degree of compliance with the policies orprocedures may deteriorate.
Our management assessed the effectiveness of our internal control over financial reporting as of December 31,2019. In making this assessment, our management used criteria set forth by the Committee of SponsoringOrganizations of the Treadway Commission in Internal Control-Integrated Framework (2013 Framework).
Based on this assessment, our management believes that, as of December 31, 2019, our internal control overfinancial reporting was effective based on those criteria.
The Company’s independent registered public accounting firm has issued an attestation report on theCompany’s internal control over financial reporting.
Changes in Internal Control Over Financial Reporting
There have been no changes in our internal control over financial reporting that occurred during the quarterended December 31, 2019 that have materially affected, or are reasonably likely to materially affect, our internalcontrol over financial reporting.
56

Item 9B. Other Information
None.
PART III
Item 10. Directors, Executive Officers and Corporate Governance
The information regarding our trustees, executive officers and certain other matters required by Item 401 ofRegulation S-K is incorporated herein by reference to our definitive proxy statement relating to our annual meetingof shareholders (the "Proxy Statement"), to be filed with the SEC within 120 days after December 31, 2019.
The information regarding compliance with Section 16(a) of the Exchange Act required by Item 405 ofRegulation S-K is incorporated herein by reference to the Proxy Statement to be filed with the SEC within 120 daysafter December 31, 2019.
The information regarding our Code of Business Conduct and Ethics required by Item 406 of Regulation S-K isincorporated herein by reference to the Proxy Statement to be filed with the SEC within 120 days afterDecember 31, 2019.
The information regarding certain matters pertaining to our corporate governance required by Item 407(c)(3),(d)(4) and (d)(5) of Regulation S-K is incorporated by reference to the Proxy Statement to be filed with the SECwithin 120 days after December 31, 2019.
Item 11. Executive Compensation
The information regarding executive compensation and other compensation related matters required by Items402 and 407(e)(4) and (e)(5) of Regulation S-K is incorporated herein by reference to the Proxy Statement to befiled with the SEC within 120 days after December 31, 2019.
Item 12. Security Ownership of Certain Beneficial Owners and Management and Related Stockholder Matters
The tables on equity compensation plan information and beneficial ownership of the Company required byItems 201(d) and 403 of Regulation S-K are incorporated herein by reference to the Proxy Statement to be filed withthe SEC within 120 days after December 31, 2019.
Item 13. Certain Relationships and Related Transactions, and Director Independence
The information regarding transactions with related persons, promoters and certain control persons and trusteeindependence required by Items 404 and 407(a) of Regulation S-K is incorporated herein by reference to the ProxyStatement to be filed with the SEC within 120 days after December 31, 2019.
Item 14. Principal Accounting Fees and Services
The information concerning principal accounting fees and services and the Audit Committee's pre-approvalpolicies and procedures required by Item 14 is incorporated herein by reference to the Proxy Statement to be filedwith the SEC within 120 days after December 31, 2019.
PART IV
Item 15. Exhibits, Financial Statement Schedules
(a)(1) The financial statements listed in the Index to Financial Statements on Page F-1 of this report arefiled as part of this report and incorporated herein by reference.
(a)(2) The financial statement schedule listed in the Index to Financial Statements on Page F-1 of thisreport is filed as part of this report and incorporated herein by reference.
(a)(3) The Exhibit Index is incorporated herein by reference.
INDEX TO EXHIBITSExhibit Number Exhibit Description
57

3.1 Articles of Amendment and Restatement of National Storage Affiliates Trust (Exhibit 3.1 to the Quarterly Report on Form 10-Q, filed with the SEC on June 5, 2015, is incorporated herein by this reference)
3.2 Second Amended and Restated Bylaws of National Storage Affiliates Trust (Exhibit 3.1 to the Current Report on Form 8-K, filed with the SEC on April 3, 2018, is incorporated herein by this reference)
3.3 Articles Supplementary designating the Series A Preferred Shares of National Storage Affiliates Trust (Exhibit 3.3 to the Form 8-A filed with the SEC on October 10, 2017, is incorporated herein by this reference)
3.4 Articles Supplementary designating the Series A Preferred Shares of National Storage Affiliates Trust (Exhibit 3.4 to the Form S-3ASR, filed with the SEC on March 14, 2018, is incorporated herein by this reference)
3.5 Articles Supplementary designating the Series A Preferred Shares of National Storage Affiliates Trust (Exhibit 3.5 to the Quarterly Report on Form 10-Q, filed with the SEC on May 3, 2019, is incorporated herein by this reference)
4.1 Specimen Common Share Certificate of National Storage Affiliates Trust (Exhibit 4.1 to the Registration Statement on Form S-11/A filed with the SEC on April 20, 2015, is incorporated herein by this reference)
4.2 Form of Specimen Certificate of Series A Preferred Shares of National Storage Affiliates Trust (Exhibit 4.1 to the Registration Statement on Form 8-A filed with the SEC on October 10, 2017, is incorporated herein by this reference)
4.3* Description of Common Shares of Beneficial Interest and 6.000% Series A Cumulative Redeemable Preferred Shares of Beneficial Interest
10.1 Third Amended and Restated Agreement of Limited Partnership of NSA OP, LP (Exhibit 3.3 to the Quarterly Report on Form 10-Q, filed with the SEC on June 5, 2015, is incorporated herein by this reference)
10.2 Amended and Restated Partnership Unit Designation of Series GN Class B OP Units of NSA OP, LP (Exhibit 3.4 to the Quarterly Report on Form 10-Q, filed with the SEC on June 5, 2015, is incorporated herein by this reference)
10.3 Third Amended and Restated Partnership Unit Designation of Series NW Class B OP Units of NSA OP, LP (Exhibit 3.5 to the Quarterly Report on Form 10-Q, filed with the SEC on June 5, 2015, is incorporated herein by this reference)
10.4 Third Amended and Restated Partnership Unit Designation of Series OV Class B OP Units of NSA OP, LP (Exhibit 3.6 to the Quarterly Report on Form 10-Q, filed with the SEC on June 5, 2015, is incorporated herein by this reference)
10.5 Second Amended and Restated Partnership Unit Designation of Series SC Class B OP Units of NSA OP, LP (Exhibit 3.7 to the Quarterly Report on Form 10-Q, filed with the SEC on June 5, 2015, is incorporated herein by this reference)
10.6 Partnership Unit Designation of Series SS Class B OP Units of NSA OP, LP (Exhibit 3.8 to the Quarterly Report on Form 10-Q, filed with the SEC on June 5, 2015, is incorporated herein by this reference)
10.7 Partnership Unit Designation of Series HA Class B OP Units of NSA OP, LP (Exhibit 10.1 to the Quarterly Report on Form 10-Q, filed with SEC on August 9, 2016, is incorporated herein by this reference)
10.8 First Amendment to Partnership Unit Designation of Series HA Class B OP Units of NSA OP, LP (Exhibit 10.8 to the Annual Report on Form 10-K, filed with SEC on February 28, 2017, is incorporated herein by this reference)
10.9 Partnership Unit Designation of Series PM Class B OP Units of NSA OP, LP (Exhibit 10.2 to the Quarterly Report on Form 10-Q, filed with the SEC on May 4, 2017, is incorporated herein by this reference)
10.10 Partnership Unit Designation of Series MI Class B OP Units of NSA OP, LP (Exhibit 10.1 to the Quarterly Report on Form 10-Q, filed with the SEC on November 7, 2017, is incorporated herein by this reference)
10.11 Partnership Unit Designation of Series A-1 Preferred Units of NSA OP, LP dated as of January 5, 2018 (Exhibit 10.12 to the Annual Report on Form 10-K, filed with the SEC on February 27, 2018, is incorporated herein by this reference)
Table of Contents
58

10.12 Partnership Unit Designation of Series SO Class B OP Units of NSA OP, LP (Exhibit 10.1 to the Quarterly Report on Form 10-Q, filed with the SEC on May 3, 2019, is incorporated herein by this reference)
10.13 Partnership Unit Designation of Series MO Class B OP Units of NSA OP, LP (Exhibit 10.2 to the Quarterly Report on Form 10-Q, filed with the SEC on May 3, 2019, is incorporated herein by this reference)
10.14 Sixty-First Amendment to the Third Amended and Restated Agreement of Limited Partnership of NSA OP, LP (Exhibit 10.1 to the Form 8-K filed with the SEC on October 11, 2017, is incorporated herein by this reference)
10.15 Form of Second Amended and Restated DownREIT Partnership Agreement (including a schedule of existing DownREIT limited partnership agreements and limited liability company agreements) (Exhibit 10.7 to the Quarterly Report on Form 10-Q, filed with the SEC on November 10, 2015, is incorporated herein by this reference)
10.16 Second Amended and Restated Credit Agreement dated as of July 29, 2019 by and among NSA OP, LP, as Borrower, the lenders from time to time party hereto, and KeyBank National Association, as Administrative Agent, and joined in for certain purposes by certain Subsidiaries of the Borrower and National Storage Affiliates Trust, with Keybanc Capital Markets Inc., and PNC Capital Markets LLC, as Co-Bookrunners and Co-Lead Arrangers, PNC Bank, National Association, as Syndication Agent, U.S. Bank National Association and BMO Capital Markets Corp. as Co-Lead Arrangers and Co-Documentation Agents, Wells Fargo Securities, LLC as Co-Lead Arranger, Wells Fargo Bank, National Association, as Co-Documentation Agent, and CitiBank, N.A., as Co-Lead Arranger and Co-Documentation Agent for the Revolving Credit Facility (Exhibit 10.1 to the Quarterly Report on Form 10-Q, filed with the SEC on November 1, 2019, is incorporated herein by this reference)
10.17 National Storage Affiliates Trust Equity Incentive Plan (Exhibit 10.1 to the Quarterly Report on Form 10-Q, filed with the SEC on June 5, 2015, is incorporated herein by this reference)
10.18 NSA OP, LP, 2013 Long-Term Incentive Plan (Exhibit 10.2 to the Registration Statement on Form S-11/A, filed with SEC on April 1, 2015, is incorporated herein by this reference).
10.19 Amended and Restated Registration Rights Agreement, by and among National Storage Affiliates Trust and the parties listed on Schedule I thereto (Exhibit 10.2 to the Quarterly Report on Form 10-Q, filed with the SEC on June 5, 2015, is incorporated herein by reference)
10.20 Registration Rights Agreement, by and among National Storage Affiliates Trust and the parties listed on Schedule 1 thereto (Exhibit 10.2 to the Quarterly Report on Form 10-Q, filed with the SEC on May 4, 2018, is incorporated by this reference)
10.21 Employment Agreement, dated April 28, 2015, by and between National Storage Affiliates Trust and Arlen D. Nordhagen (Exhibit 10.3 to the Quarterly Report on Form 10-Q, filed with the SEC on June 5, 2015, is incorporated herein by this reference)
10.22 Employment Agreement, dated April 28, 2015, by and between National Storage Affiliates Trust and Tamara D. Fischer (Exhibit 10.4 to the Quarterly Report on Form 10-Q, filed with the SEC on June 5, 2015, is incorporated herein by this reference)
10.23 Employment Agreement, dated April 28, 2015, by and between National Storage Affiliates Trust and Steven B. Treadwell (Exhibit 10.5 to the Quarterly Report on Form 10-Q, filed with the SEC on June 5, 2015, is incorporated herein by this reference)
10.24 Employment Agreement, dated January 1, 2017, by and between National Storage Affiliates Trust and Brandon Togashi (Exhibit 10.19 to the Annual Report on Form 10-K, filed with SEC on February 28, 2017, is incorporated by this reference)
10.25 First Amendment to Employment Agreement, dated March 29, 2018, by and between National Storage Affiliates Trust and Arlen D. Nordhagen (Exhibit 10.3 to the Quarterly Report on Form 10-Q, filed with the SEC on May 4, 2018, is incorporated herein by this reference)
10.26 First Amendment to Employment Agreement, dated March 29, 2018, by and between National Storage Affiliates Trust and Tamara D. Fischer (Exhibit 10.4 to the Quarterly Report on Form 10-Q, filed with the SEC on May 4, 2018, is incorporated herein by this reference)
10.27 First Amendment to Employment Agreement, dated March 29, 2018, by and between National Storage Affiliates Trust and Steven B. Treadwell (Exhibit 10.5 to the Quarterly Report on Form 10-Q, filed with the SEC on May 4, 2018, is incorporated herein by this reference)
10.28 First Amendment to Employment Agreement, dated March 29, 2018, by and between National Storage Affiliates Trust and Brandon Togashi (Exhibit 10.6 to the Quarterly Report on Form 10-Q, filed with the SEC on May 4, 2018, is incorporated herein by this reference)
Table of Contents
59

10.29 Form of Amended and Restated Restricted Share Unit Award Agreement (Exhibit 10.17 to the Annual Report on Form 10-K, filed with the SEC on March 10, 2016, is incorporated herein by this reference)
10.30 Form of Amended and Restated Restricted Share Award Agreement (Exhibit 10.18 to the Annual Report on Form 10-K, filed with the SEC on March 10, 2016, is incorporated herein by this reference)
10.31 Form of LTIP Unit Award Agreement to Trustees under the NSA OP, LP, 2013 Long-Term Incentive Plan (Exhibit 10.5 to the Registration Statement on Form S-11/A, filed with the SEC on April 1, 2015, is incorporated herein by this reference)
10.32 Form of LTIP Unit Award Agreement for Executive Officers (Exhibit 10.28 to the Annual Report on Form 10-K, filed with the SEC on February 27, 2018, is incorporated herein by this reference)
10.33 Form of Contribution Agreement among each contributor named therein, NSA OP, LP and any indirectly wholly owned subsidiary of NSA OP, LP named therein (Exhibit 10.13 to the Registration Statement on Form S-11/A, filed with the SEC on April 1, 2015, is incorporated herein by this reference)
10.34 Form of Purchase and Sale Agreement among each seller named therein, National Storage Affiliates Trust and NSA OP, LP (Exhibit 10.14 to the Registration Statement on Form S-11/A, filed with the SEC on April 1, 2015, is incorporated herein by this reference)
10.35 Form of Indemnification Agreement (Exhibit 10.7 to the Registration Statement on Form S-11/A, filed with the SEC on April 1, 2015, is incorporated herein by this reference)
10.36 Facilities Portfolio Management Agreement, dated April 28, 2015, by and among (i) NSA OP, LP, (ii) the property owners listed therein, (iii) Guardian Storage Centers, LLC, a California limited liability company d/b/a StorAmerica Management, and (iv) John Minar and David Lamb, each an individual (Exhibit 10.6 to the Quarterly Report on Form 10-Q, filed with the SEC on June 5, 2015, is incorporated herein by this reference)
10.37 Facilities Portfolio Management Agreement, dated April 28, 2015, by and among (i) NSA OP, LP, (ii) the property owners listed therein, (iii) Kevin Howard Real Estate, Inc., an Oregon corporation, and (iv) Kevin Howard, an individual (Exhibit 10.7 to the Quarterly Report on Form 10-Q, filed with the SEC on June 5, 2015, is incorporated herein by this reference)
10.38 Facilities Portfolio Management Agreement, dated April 28, 2015, by and among (i) NSA OP, LP, (ii) the property owners listed therein, (iv) Optivest Properties, LLC, a California limited liability company, and (iv) Warren Allen, an individual (Exhibit 10.8 to the Quarterly Report on Form 10-Q, filed with the SEC on June 5, 2015, is incorporated herein by this reference)
10.39 Facilities Portfolio Management Agreement, dated April 28, 2015, by and among (i) NSA OP, LP, (ii) the property owners listed therein, (iii) SecurCare Self Storage, Inc. a Colorado corporation, and (iv) David Cramer, Justin Hlibichuk and Arlen Nordhagen, each an individual (Exhibit 10.9 to the Quarterly Report on Form 10-Q, filed with the SEC on June 5, 2015, is incorporated herein by this reference)
10.40 Facilities Portfolio Management Agreement, dated April 28, 2015, by and among (i) NSA OP, LP, (ii) the property owners listed therein (iii) Arizona Mini Storage Management Company, an Arizona corporation, and (iv) William F. Bohannan, Jr. and Raymond McRae, each an individual (Exhibit 10.10 to the Quarterly Report on Form 10-Q, filed with the SEC on June 5, 2015, is incorporated herein by this reference)
10.41 Facilities Portfolio Management Agreement, dated April 1, 2016, by and among (i) NSA OP, LP, (ii) the property owners listed therein (iii) the property owners listed as "Deferred Management Property Owners" therein (iv) Hide-Away Storage Services, Inc., a Florida Corporation and, (v) Stephen A. Wilson, Paul Feikema, and Meisha Wilson, each an individual (Exhibit 10.2 to the Quarterly Report on Form 10-Q, filed with the SEC on August 9, 2016, is incorporated herein by this reference)
10.42 Facilities Portfolio Management Agreement, dated February 24, 2017, by and among (i) NSA OP, LP, (ii) the property owners listed therein (iii) Shader Brothers Corporation, and (iv) Marc M. Smith and Laurie Shader Smith, each an individual (Exhibit 10.3 to the Quarterly Report on Form 10-Q, filed with the SEC on May 4, 2017, is incorporated herein by this reference)
10.43 Facilities Portfolio Management Agreement, dated July 1, 2017, by and among (i) NSA OP, LP, (ii) the property owners listed therein, (iii) Move It Self Storage, LP, a Texas limited partnership, and (iv) Austin Starke Taylor III, an individual (Exhibit 10.2 to the Quarterly Report on Form 10-Q, filed with the SEC on November 7, 2017, is incorporated herein by this reference)
Table of Contents
60

10.44 Facilities Portfolio Management Agreement, dated January 1, 2019, by and among (i) NSA OP, LP, (ii) the property owners listed as "Owners" therein, (iii) the property owners listed as "Deferred Management Property Owners" therein, (iv) Southern Storage Management Systems, Inc., a Florida Corporation, and (v) Robert A. McIntosh and Peter V. Cowie, each an individual (Exhibit 10.3 to the Quarterly Report on Form 10-Q, filed with the SEC on May 3, 2019, is incorporated herein by this reference)
10.45 Facilities Portfolio Management Agreement, dated March 1, 2019, by and among (i) NSA OP, LP, (ii) the property owners listed as "Owners" therein, (iii) the property owners listed as "Deferred Management Property Owners" therein, (iv) Investment Real Estate Management, LLC, a Pennsylvania Limited Liability Company, and (v) John H. Gilliland, an individual (Exhibit 10.4 to the Quarterly Report on Form 10-Q, filed with the SEC on May 3, 2019, is incorporated herein by this reference)
10.46 Sales Agreement dated February 27, 2019, by and among (i) National Storage Affiliates Trust, (ii) NSA OP, LP and (iii) the Agents listed therein (Exhibit 1.1 to the Form 8-K filed with the SEC on March 1, 2019, is incorporated herein by this reference)
21.1* List of subsidiaries of National Storage Affiliates Trust23.1* Consent of KPMG LLP for National Storage Affiliates Trust24.1* Power of Attorney (included on signature page)31.1* Certification of Chief Executive Officer pursuant to Rule 13a-14(a)/15d-14(a) of the Securities
Exchange Act of 1934, as amended, as adopted pursuant to Section 302 of the Sarbanes-Oxley Act of 2002
31.2* Certification of Chief Financial Officer pursuant to Rule 13a-14(a)/15d-14(a) of the Securities Exchange Act of 1934, as amended, as adopted pursuant to Section 302 of the Sarbanes-Oxley Act of 2002
32.1* Certification of Chief Executive Officer and Chief Financial Officer pursuant to 18 U.S.C. 1350, as adopted pursuant to Section 906 of the Sarbanes-Oxley Act of 2002
101.INS* XBRL Instance Document - the instance document does not appear in the Interactive Data File because its XBRL tags are embedded within the Inline XBRL document.
101.SCH* Inline XBRL Taxonomy Extension Schema101.CAL* Inline XBRL Taxonomy Extension Calculation Linkbase101.DEF* Inline XBRL Taxonomy Extension Definition Linkbase101.LAB* Inline XBRL Taxonomy Extension Label Linkbase101.PRE* Inline XBRL Taxonomy Extension Presentation Linkbase
104* Cover Page Interactive Data File (formatted as inline XBRL and contained in Exhibit 101)* Filed herewith.
Item 16. Form 10-K Summary
None.
Table of Contents
61

SIGNATURES
Pursuant to the requirements of Section 13 or 15(d) of the Securities Exchange Act of 1934, the registrant hasduly caused this report to be signed on its behalf by the undersigned thereunto duly authorized.
National Storage Affiliates Trust
By: /s/ TAMARA D. FISCHERTamara D. Fischer
president and chief executive officer(principal executive officer)
Date: February 26, 2020
POWER OF ATTORNEY
KNOW ALL PERSONS BY THESE PRESENTS, that each person whose signature appears below constitutes andappoints Tamara D. Fischer and Brandon S. Togashi, and each of them, with full power to act without the other,such person's true and lawful attorneys-in-fact and agents, with full power of substitution and resubstitution, for himor her and in his or her name, place and stead, in any and all capacities, to sign this Form 10-K and any and allamendments thereto, and to file the same, with exhibits and schedules thereto, and other documents in connectiontherewith, with the Securities and Exchange Commission, granting unto said attorneys-in-fact and agents, and eachof them, full power and authority to do and perform each and every act and thing necessary or desirable to be donein and about the premises, as fully to all intents and purposes as he or she might or could do in person, herebyratifying and confirming all that said attorneys-in-fact and agents, or any of them, or their or his or her substitute orsubstitutes, may lawfully do or cause to be done by virtue hereof.
Table of Contents
62

Pursuant to the requirements of the Securities Exchange Act of 1934, the registrant has duly caused this reportto be signed on its behalf by the undersigned and in the capacities and on the dates indicated.
Signature Title DateNational Storage Affiliates Trust
/s/ TAMARA D. FISCHER trustee, president and chief executive officer February 26, 2020Tamara D. Fischer (principal executive officer)
/s/ BRANDON S. TOGASHI chief financial officer February 26, 2020Brandon S. Togashi (principal accounting and financial officer)
/s/ ARLEN D. NORDHAGEN executive chairman of the board of trustees February 26, 2020Arlen D. Nordhagen
/s/ GEORGE L. CHAPMAN trustee February 26, 2020George L. Chapman
/s/ PAUL W. HYLBERT, JR. trustee February 26, 2020Paul W. Hylbert, Jr.
/s/ CHAD L. MEISINGER trustee February 26, 2020Chad L. Meisinger
/s/ STEVEN G. OSGOOD trustee February 26, 2020Steven G. Osgood
/s/ DOMINIC M. PALAZZO trustee February 26, 2020Dominic M. Palazzo
/s/ REBECCA L. STEINFORT trustee February 26, 2020Rebecca L. Steinfort
/s/ MARK VAN MOURICK trustee February 26, 2020Mark Van Mourick
/s/ J. TIMOTHY WARREN trustee February 26, 2020J. Timothy Warren
Table of Contents
63
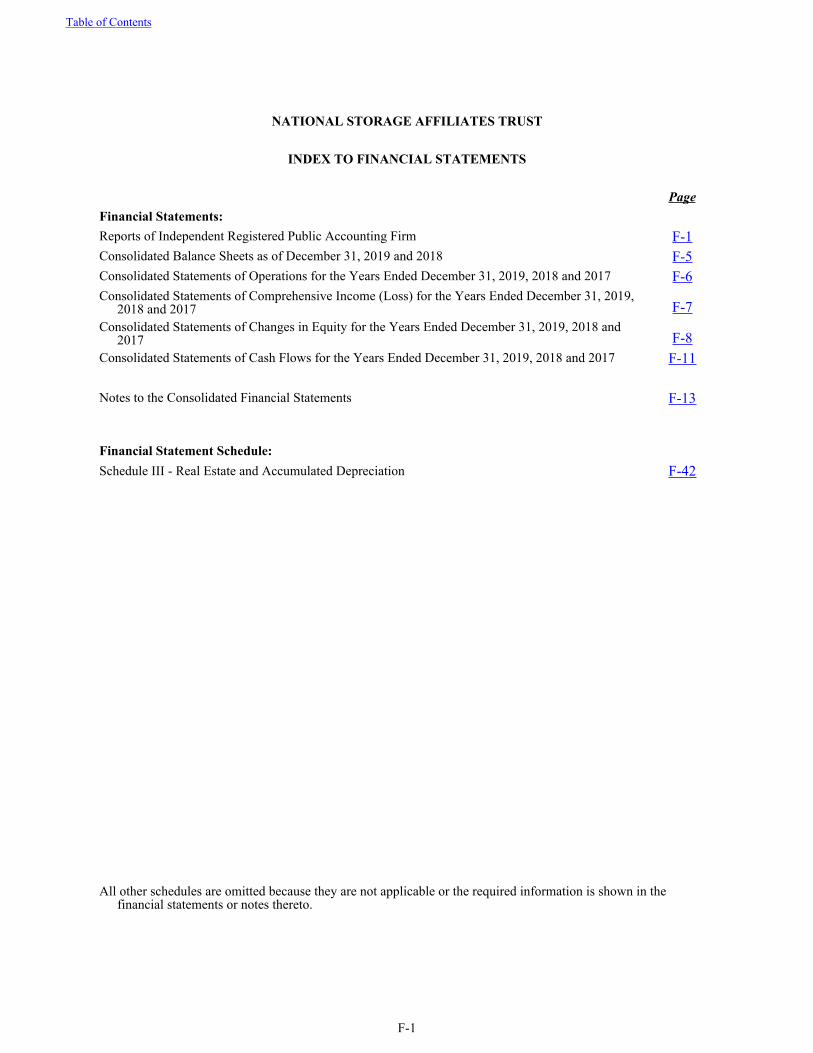
NATIONAL STORAGE AFFILIATES TRUST
INDEX TO FINANCIAL STATEMENTS
PageFinancial Statements:Reports of Independent Registered Public Accounting Firm F-1Consolidated Balance Sheets as of December 31, 2019 and 2018 F-5Consolidated Statements of Operations for the Years Ended December 31, 2019, 2018 and 2017 F-6Consolidated Statements of Comprehensive Income (Loss) for the Years Ended December 31, 2019,
2018 and 2017 F-7Consolidated Statements of Changes in Equity for the Years Ended December 31, 2019, 2018 and
2017 F-8Consolidated Statements of Cash Flows for the Years Ended December 31, 2019, 2018 and 2017 F-11
Notes to the Consolidated Financial Statements F-13
Financial Statement Schedule:Schedule III - Real Estate and Accumulated Depreciation F-42
All other schedules are omitted because they are not applicable or the required information is shown in the financial statements or notes thereto.
Table of Contents
F-1

Report of Independent Registered Public Accounting Firm
To the Shareholders and Board of Trustees National Storage Affiliates Trust:
Opinion on the Consolidated Financial Statements
We have audited the accompanying consolidated balance sheets of National Storage Affiliates Trust and subsidiaries(the Company) as of December 31, 2019 and 2018, the related consolidated statements of operations, comprehensiveincome (loss), changes in equity, and cash flows for each of the years in the three-year period ended December 31,2019, and the related notes, and the financial statement schedule, Schedule III – Real Estate and AccumulatedDepreciation (collectively, the consolidated financial statements). In our opinion, the consolidated financialstatements present fairly, in all material respects, the financial position of the Company as of December 31, 2019and 2018, and the results of its operations and its cash flows for each of the years in the three-year period endedDecember 31, 2019, in conformity with U.S. generally accepted accounting principles.
We also have audited, in accordance with the standards of the Public Company Accounting Oversight Board (UnitedStates) (PCAOB), the Company’s internal control over financial reporting as of December 31, 2019, based oncriteria established in Internal Control – Integrated Framework (2013) issued by the Committee of SponsoringOrganizations of the Treadway Commission, and our report dated February 26, 2020 expressed an unqualifiedopinion on the effectiveness of the Company’s internal control over financial reporting.
Basis for Opinion
These consolidated financial statements are the responsibility of the Company’s management. Our responsibility isto express an opinion on these consolidated financial statements based on our audits. We are a public accountingfirm registered with the PCAOB and are required to be independent with respect to the Company in accordance withthe U.S. federal securities laws and the applicable rules and regulations of the Securities and Exchange Commissionand the PCAOB.
We conducted our audits in accordance with the standards of the PCAOB. Those standards require that we plan andperform the audit to obtain reasonable assurance about whether the consolidated financial statements are free ofmaterial misstatement, whether due to error or fraud. Our audits included performing procedures to assess the risksof material misstatement of the consolidated financial statements, whether due to error or fraud, and performingprocedures that respond to those risks. Such procedures included examining, on a test basis, evidence regarding theamounts and disclosures in the consolidated financial statements. Our audits also included evaluating the accountingprinciples used and significant estimates made by management, as well as evaluating the overall presentation of theconsolidated financial statements. We believe that our audits provide a reasonable basis for our opinion.
Critical Audit Matter
The critical audit matter communicated below is a matter arising from the current period audit of the consolidatedfinancial statements that was communicated or required to be communicated to the audit committee and that: (1)relates to accounts or disclosures that are material to the consolidated financial statements and (2) involved ourespecially challenging, subjective, or complex judgment. The communication of a critical audit matter does not alterin any way our opinion on the consolidated financial statements, taken as a whole, and we are not, bycommunicating the critical audit matter below, providing a separate opinion on the critical audit matter or on theaccounts or disclosures to which it relates.
Evaluation of purchase price allocation for self storage property acquisitions
As discussed in Notes 2 and 6 to the consolidated financial statements, during 2019, the Company acquired$447.8 million of self storage properties that were recorded as asset acquisitions. The purchase price in anasset acquisition is allocated to the tangible and intangible assets acquired and liabilities assumed based ontheir relative fair value. Assets acquired and liabilities assumed primarily comprise land, buildings andrelated improvements, customer in-place leases, furniture and equipment, and assumed mortgage loans.
We identified the evaluation of purchase price allocation of self storage property acquisitions as a criticalaudit matter. This is due to the subjective and complex auditor judgment that was required to evaluate theCompany’s estimated fair value of land, buildings, and improvements. In particular, there was a high
Table of Contents
F-2

degree of auditor judgment required to evaluate the comparable sales information and costs that would beincurred to replace building and improvement assets.
The primary procedures we performed to address this critical audit matter included the following. Wetested certain internal controls over the Company’s process to estimate fair value, including developingestimated fair values of land, buildings, and improvements. We compared and evaluated estimated fairvalue of land, buildings, and improvements against purchase price allocations for similar land, buildings,and improvements acquired by the Company. With the assistance of valuation professionals withspecialized skills and knowledge, we evaluated the estimated fair value of land by comparing theCompany’s estimates to independently developed ranges using publicly available market data of recent landsales. We evaluated the Company’s estimated costs of replacing buildings and improvements. Wecompared the estimated costs to market data, including appraisal guides used to estimate the depreciatedvalue of similar self storage structures.
/s/ KPMG LLP
We have served as the Company’s auditor since 2013.
Denver, Colorado February 26, 2020
Table of Contents
F-3

Report of Independent Registered Public Accounting Firm
To the Shareholders and Board of Trustees National Storage Affiliates Trust:
Opinion on Internal Control Over Financial Reporting
We have audited National Storage Affiliates Trust and subsidiaries’ (the Company) internal control over financialreporting as of December 31, 2019 based on criteria established in Internal Control - Integrated Framework (2013)issued by the Committee of Sponsoring Organizations of the Treadway Commission. In our opinion, the Companymaintained, in all material respects, effective internal control over financial reporting as of December 31, 2019,based on criteria established in Internal Control - Integrated Framework (2013) issued by the Committee ofSponsoring Organizations of the Treadway Commission.
We also have audited, in accordance with the standards of the Public Company Accounting Oversight Board (UnitedStates) (PCAOB), the consolidated balance sheets of the Company as of December 31, 2019 and 2018, the relatedconsolidated statements of operations, comprehensive income (loss), changes in equity, and cash flows for each ofthe years in the three-year period ended December 31, 2019, and the related notes, and the financial statementschedule, Schedule III - Real Estate and Accumulated Depreciation (collectively, the consolidated financialstatements), and our report dated February 26, 2020 expressed an unqualified opinion on those consolidatedfinancial statements.
Basis for Opinion
The Company’s management is responsible for maintaining effective internal control over financial reporting andfor its assessment of the effectiveness of internal control over financial reporting, included in the accompanyingManagement’s Report on Internal Control Over Financial Reporting. Our responsibility is to express an opinion onthe Company’s internal control over financial reporting based on our audit. We are a public accounting firmregistered with the PCAOB and are required to be independent with respect to the Company in accordance with theU.S. federal securities laws and the applicable rules and regulations of the Securities and Exchange Commission andthe PCAOB.
We conducted our audit in accordance with the standards of the PCAOB. Those standards require that we plan andperform the audit to obtain reasonable assurance about whether effective internal control over financial reportingwas maintained in all material respects. Our audit of internal control over financial reporting included obtaining anunderstanding of internal control over financial reporting, assessing the risk that a material weakness exists, andtesting and evaluating the design and operating effectiveness of internal control based on the assessed risk. Our auditalso included performing such other procedures as we considered necessary in the circumstances. We believe thatour audit provides a reasonable basis for our opinion.
Definition and Limitations of Internal Control Over Financial Reporting
A company’s internal control over financial reporting is a process designed to provide reasonable assuranceregarding the reliability of financial reporting and the preparation of financial statements for external purposes inaccordance with generally accepted accounting principles. A company’s internal control over financial reportingincludes those policies and procedures that (1) pertain to the maintenance of records that, in reasonable detail,accurately and fairly reflect the transactions and dispositions of the assets of the company; (2) provide reasonableassurance that transactions are recorded as necessary to permit preparation of financial statements in accordancewith generally accepted accounting principles, and that receipts and expenditures of the company are being madeonly in accordance with authorizations of management and directors of the company; and (3) provide reasonableassurance regarding prevention or timely detection of unauthorized acquisition, use, or disposition of the company’sassets that could have a material effect on the financial statements.
Because of its inherent limitations, internal control over financial reporting may not prevent or detect misstatements.Also, projections of any evaluation of effectiveness to future periods are subject to the risk that controls may becomeinadequate because of changes in conditions, or that the degree of compliance with the policies or procedures maydeteriorate.
/s/ KPMG LLPDenver, Colorado February 26, 2020
Table of Contents
F-4

December 31,2019 2018
ASSETSReal estate
Self storage properties $ 3,091,719 $ 2,637,723Less accumulated depreciation (337,822) (246,261)
Self storage properties, net 2,753,897 2,391,462Cash and cash equivalents 20,558 13,181Restricted cash 3,718 3,182Debt issuance costs, net 3,264 1,260Investment in unconsolidated real estate ventures 214,061 245,125Other assets, net 65,441 75,053Operating lease right-of-use assets 23,306 —
Total assets $ 3,084,245 $ 2,729,263LIABILITIES AND EQUITY
LiabilitiesDebt financing $ 1,534,047 $ 1,278,102Accounts payable and accrued liabilities 57,909 33,130Operating lease liabilities 24,665 —Deferred revenue 15,523 15,732
Total liabilities 1,632,144 1,326,964Commitments and contingencies (Note 12)Equity
Preferred shares of beneficial interest, par value $0.01 per share. 50,000,000 authorized, 8,727,119 and 6,900,000 issued and outstanding at December 31, 2019 and 2018, at liquidation preference 218,178 172,500
Common shares of beneficial interest, par value $0.01 per share. 250,000,000 authorized, 59,659,108 and 56,654,009 shares issued and outstanding at December 31, 2019 and 2018, respectively 597 567
Additional paid-in capital 905,763 844,276Distributions in excess of earnings (197,075) (114,122)Accumulated other comprehensive (loss) income (7,833) 13,618
Total shareholders' equity 919,630 916,839Noncontrolling interests 532,471 485,460
Total equity 1,452,101 1,402,299Total liabilities and equity $ 3,084,245 $ 2,729,263
Table of ContentsNATIONAL STORAGE AFFILIATES TRUST
CONSOLIDATED BALANCE SHEETS (dollars in thousands, except per share amounts)
See notes to consolidated financial statements.
F-5

Year Ended December 31,2019 2018 2017
REVENUERental revenue $ 354,859 $ 308,403 $ 251,814Other property-related revenue 12,302 10,183 8,255Management fees and other revenue 20,735 12,310 8,061
Total revenue 387,896 330,896 268,130OPERATING EXPENSES
Property operating expenses 110,347 103,875 84,455General and administrative expenses 45,581 36,220 30,060Depreciation and amortization 105,119 89,147 75,115
Total operating expenses 261,047 229,242 189,630OTHER (EXPENSE) INCOME
Interest expense (56,464) (42,724) (34,068)Equity in losses of unconsolidated real estate ventures (4,970) (1,423) (2,339)Acquisition costs (1,317) (663) (593)Non-operating income (expense) 452 (91) (58)Gain on sale of self storage properties 2,814 391 5,715
Other expense (59,485) (44,510) (31,343)Income before income taxes 67,364 57,144 47,157
Income tax expense (1,351) (818) (1,159)Net income 66,013 56,326 45,998
Net income attributable to noncontrolling interests (62,030) (42,217) (43,037)Net income attributable to National Storage
Affiliates Trust 3,983 14,109 2,961Distributions to preferred shareholders (12,390) (10,350) (2,300)
Net (loss) income attributable to common shareholders $ (8,407) $ 3,759 $ 661
Earnings (loss) per share - basic and diluted $ (0.15) $ 0.07 $ 0.01
Weighted average shares outstanding - basic and diluted 58,208 53,293 44,423
Table of ContentsNATIONAL STORAGE AFFILIATES TRUST
CONSOLIDATED STATEMENTS OF OPERATIONS (in thousands, except per share amounts)
See notes to consolidated financial statements.
F-6

Year Ended December 31,2019 2018 2017
Net income $ 66,013 $ 56,326 $ 45,998Other comprehensive income (loss)
Unrealized (loss) gain on derivative contracts (29,941) 3,598 1,935Reclassification of other comprehensive (income) loss to
interest expense (3,337) (1,817) 2,308Other comprehensive (loss) income (33,278) 1,781 4,243
Comprehensive income 32,735 58,107 50,241Comprehensive income attributable to noncontrolling
interests (49,977) (43,244) (44,697)Comprehensive (loss) income attributable to National
Storage Affiliates Trust $ (17,242) $ 14,863 $ 5,544
Table of ContentsNATIONAL STORAGE AFFILIATES TRUST
CONSOLIDATED STATEMENTS OF COMPREHENSIVE INCOME (LOSS) (dollars in thousands)
See notes to consolidated financial statements.
F-7

AccumulatedAdditional Distributions Other
Preferred Shares Common Shares Paid-in in Excess of Comprehensive Noncontrolling TotalNumber Amount Number Amount Capital Earnings (Loss) Income Interests Equity
Balances, December 31, 2016 — $ — 43,110,362 $ 431 $ 576,365 $ (8,719) $ 9,025 $ 401,966 $ 979,068Issuance of preferred shares, net
of offering costs 6,900,000 172,500 — — (5,934) — — — 166,566OP equity recorded in connection
with property acquisitions:OP units and subordinated
performance units, net of offering costs — — — — — — — 29,900 29,900
LTIP units — — — — — — — 854 854Issuance of subordinated
performance units — — — — — — — 7,000 7,000Redemptions of OP units — — 1,409,715 14 18,389 — 289 (18,692) —Issuance of common shares, net
of offering costs — — 5,750,000 58 140,203 — — — 140,261Issuance of common shares,
share based compensation plans — — 6,862 — — — — — —
Effect of changes in ownership for consolidated entities — — — — (17,749) — 385 17,364 —
Issuance of OP units — — — — — — — 1,262 1,262Equity-based compensation
expense — — — — 244 — — 3,520 3,764Issuance of LTIP units for
acquisition expenses — — — — — — — 15 15Issuance of restricted common
shares — — 16,525 — — — — — —Vesting and forfeitures of
restricted common shares — — (8,530) — (51) — — — (51)Reduction in receivables from
partners of OP — — — — — — — 812 812Preferred share dividends — — — — — (2,300) — — (2,300)Common share dividends — — — — — (47,671) — — (47,671)Distributions to noncontrolling
interests — — — — — — — (58,234) (58,234)
Table of ContentsNATIONAL STORAGE AFFILIATES TRUST
CONSOLIDATED STATEMENT OF CHANGES IN EQUITY (dollars in thousands, except share amounts)
See notes to consolidated financial statements.
F-8

AccumulatedAdditional Distributions Other
Preferred Shares Common Shares Paid-in in Excess of Comprehensive Noncontrolling TotalNumber Amount Number Amount Capital Earnings (Loss) Income Interests Equity
Other comprehensive income — — — — — — 2,583 1,660 4,243Net income — — — — — 2,961 — 43,037 45,998
Balances, December 31, 2017 6,900,000 172,500 50,284,934 503 711,467 (55,729) 12,282 430,464 1,271,487OP equity recorded in connection
with property acquisitions:Series A-1 preferred units, OP
units and subordinated performance units, net of offering costs — — — — — — — 27,962 27,962
Redemptions of OP units — — 462,778 5 5,904 — 172 (6,081) —Issuance of common shares, net
of offering costs — — 5,900,000 59 175,557 — — — 175,616Effect of changes in ownership
for consolidated entities — — — — (48,830) — 410 48,420 —Issuance of OP units — — — — — — — 1,236 1,236Equity-based compensation
expense — — — — 253 — — 3,584 3,837Issuance of restricted common
shares — — 12,311 — — — — — —Vesting and forfeitures of
restricted common shares, net — — (6,014) — (75) — — — (75)Reduction in receivables from
partners of the operating partnership — — — — — — — 642 642
Preferred share dividends — — — — — (10,350) — — (10,350)Common share dividends — — — — — (62,152) — — (62,152)Distributions to noncontrolling
interests — — — — — — — (64,011) (64,011)Other comprehensive income — — — — — — 754 1,027 1,781Net income — — — — — 14,109 — 42,217 56,326
Balances, December 31, 2018 6,900,000 172,500 56,654,009 567 844,276 (114,122) 13,618 485,460 1,402,299Issuance of preferred shares, net
of offering costs 1,785,680 44,642 — — (1,018) — — — 43,624OP equity issued for property
acquisitions:
Table of ContentsNATIONAL STORAGE AFFILIATES TRUST
CONSOLIDATED STATEMENT OF CHANGES IN EQUITY (CONTINUED) (dollars in thousands, except share amounts)
See notes to consolidated financial statements.
F-9

AccumulatedAdditional Distributions Other
Preferred Shares Common Shares Paid-in in Excess of Comprehensive Noncontrolling TotalNumber Amount Number Amount Capital Earnings (Loss) Income Interests Equity
Series A-1 preferred units, OP units and subordinated performance units, net of offering costs — — — — — — — 51,321 51,321
Redemptions of Series A-1 preferred units 41,439 1,036 — — 20 — — (1,056) —
Redemptions of OP units — — 581,001 6 4,794 — (41) (4,759) —Issuance of common shares, net
of offering costs — — 2,412,770 24 71,867 — — — 71,891Effect of changes in ownership
for consolidated entities — — — — (14,429) — (185) 14,614 —Issuance of OP units — — — — — — — 8,540 8,540Equity-based compensation
expense — — — — 322 — — 4,205 4,527Issuance of LTIP units for
acquisition expenses — — — — — — — 179 179Issuance of restricted common
shares — — 18,218 — — — — — —Vesting and forfeitures of
restricted common shares, net — — (6,890) — (69) — — — (69)Reduction in receivables from
partners of the operating partnership — — — — — — — 505 505
Preferred share dividends — — — — — (12,390) — — (12,390)Common share dividends — — — — — (74,546) — — (74,546)Distributions to noncontrolling
interests — — — — — — — (76,515) (76,515)Other comprehensive loss — — — — — — (21,225) (12,053) (33,278)Net income — — — — — 3,983 — 62,030 66,013
Balances, December 31, 2019 8,727,119 $ 218,178 59,659,108 $ 597 $ 905,763 $ (197,075) $ (7,833) $ 532,471 $ 1,452,101
Table of ContentsNATIONAL STORAGE AFFILIATES TRUST
CONSOLIDATED STATEMENT OF CHANGES IN EQUITY (CONTINUED) (dollars in thousands, except share amounts)
See notes to consolidated financial statements.
F-10

Year Ended December 31,2019 2018 2017
OPERATING ACTIVITIESNet income $ 66,013 $ 56,326 $ 45,998Adjustments to reconcile net income to net cash provided
by operating activities:Depreciation and amortization 105,119 89,147 75,115Amortization of debt issuance costs 2,913 2,569 2,175Amortization of debt discount and premium, net (1,427) (1,469) (1,570)Gain on sale of self storage properties (2,814) (391) (5,715)Mark-to-market changes in value on equity securities (610) — —Equity-based compensation expense 4,527 3,837 3,764Equity in losses of unconsolidated real estate ventures 4,970 1,423 2,339Distributions from unconsolidated real estate ventures 14,551 8,187 5,093Change in assets and liabilities, net of effects of self
storage property acquisitions: Other assets 110 (5,713) (2,398)Accounts payable and accrued liabilities 5,617 6,597 1,200Deferred revenue (2,318) 1,283 (1,713)
Net Cash Provided by Operating Activities 196,651 161,796 124,288INVESTING ACTIVITIES
Acquisition of self storage properties (371,096) (313,712) (391,619)Capital expenditures (20,594) (19,014) (14,656)Investments in and advances to unconsolidated real estate
ventures — (165,642) (15,289)Distributions from unconsolidated real estate ventures 11,543 — 250Deposits and advances for self storage property and other
acquisitions (4,438) (20,977) (4,923)Expenditures for corporate furniture, equipment and other (862) (403) (588)Acquisition of equity securities (12,674) — —Proceeds from sale of equity securities 5,356 — —Acquisition of interest in reinsurance company and
related cash flows (6,600) — —Net proceeds from sale of self storage properties 6,335 5,259 17,534
Net Cash Used In Investing Activities (393,030) (514,489) (409,291)FINANCING ACTIVITIES
Proceeds from issuance of common shares 70,637 175,616 140,261Proceeds from issuance of preferred shares 43,624 — 166,566Proceeds from issuance of subordinated performance
units — — 7,000Borrowings under debt financings 822,000 822,500 760,900Receipts for OP unit subscriptions 1,271 1,211 1,150Principal payments under debt financings (561,628) (507,239) (679,104)Payment of dividends to common shareholders (74,546) (62,152) (47,671)Payment of dividends to preferred shareholders (12,390) (10,350) (2,300)Distributions to noncontrolling interests (76,010) (63,350) (57,314)
Table of ContentsNATIONAL STORAGE AFFILIATES TRUST
CONSOLIDATED STATEMENTS OF CASH FLOWS(dollars in thousands)
See notes to consolidated financial statements.
F-11

Year Ended December 31,2019 2018 2017
Debt issuance costs (8,487) (2,860) (2,381)Equity offering costs (179) (727) (1,034)
Net Cash Provided by Financing Activities 204,292 352,649 286,073Increase (Decrease) in Cash, Cash Equivalents and
Restricted Cash 7,913 (44) 1,070CASH, CASH EQUIVALENTS AND RESTRICTED
CASHBeginning of year 16,363 16,407 15,337End of year $ 24,276 $ 16,363 $ 16,407
Supplemental Cash Flow InformationCash paid for interest $ 52,666 $ 40,475 $ 32,951
Supplemental Disclosure of Non-Cash Investing and Financing ActivitiesConsideration exchanged in property acquisitions:
Issuance of OP units and subordinated performance units $ 51,826 $ 28,063 $ 30,327
Deposits on acquisitions applied to purchase price 20,977 5,050 350LTIP units vesting upon acquisition of properties — — 854Assumption of mortgages payable — 7,581 —Other net liabilities assumed 2,403 2,167 3,616
Issuance of OP unit subscription liability through reduced distributions 1,253 1,236 1,262
Settlement of acquisition receivables through reduced distributions 505 642 812
Increase in OP unit subscription liability through reduced distributions — 19 108
Change in payables for offering costs (321) 626 600Settlement of offering expenses from equity issuance
proceeds 1,241 575 12,299Operating lease right-of-use assets on balance sheet due
to implementation of leases standard 23,306 — —Operating lease liabilities on balance sheet due to
implementation of leases standard 24,665 — —
Table of ContentsNATIONAL STORAGE AFFILIATES TRUST
CONSOLIDATED STATEMENTS OF CASH FLOWS (CONTINUED)(dollars in thousands)
See notes to consolidated financial statements.
F-12

1. ORGANIZATION AND NATURE OF OPERATIONS
National Storage Affiliates Trust was organized in the state of Maryland on May 16, 2013 and is a fullyintegrated, self-administered and self-managed real estate investment trust focused on the self storage sector. Asused herein, "NSA," the "Company," "we," "our," and "us" refers to National Storage Affiliates Trust and itsconsolidated subsidiaries, except where the context indicates otherwise. The Company has elected and believes thatit has qualified to be taxed as a real estate investment trust for U.S. federal income tax purposes ("REIT")commencing with its taxable year ended December 31, 2015.
Through its controlling interest as the sole general partner of NSA OP, LP (its "operating partnership"), aDelaware limited partnership formed on February 13, 2013, the Company is focused on the ownership, operation,and acquisition of self storage properties located within the top 100 MSAs in the United States. Pursuant to theAgreement of Limited Partnership (as amended, the "LP Agreement") of its operating partnership, the Company'soperating partnership is authorized to issue preferred units, Class A Units ("OP units"), different series of Class BUnits ("subordinated performance units"), and Long-Term Incentive Plan Units ("LTIP units"). The Company alsoowns certain of its self storage properties through other consolidated limited partnership subsidiaries of its operatingpartnership, which the Company refers to as "DownREIT partnerships." The DownREIT partnerships issue equityownership interests that are intended to be economically equivalent to the Company's OP units ("DownREIT OPunits") and subordinated performance units ("DownREIT subordinated performance units").
The Company owned 567 consolidated self storage properties in 29 states and Puerto Rico with approximately34.5 million rentable square feet (unaudited) in approximately 275,000 storage units as of December 31, 2019.These properties are managed with local operational focus and expertise by the Company and its participatingregional operators ("PROs"). These PROs are SecurCare Self Storage, Inc. and its controlled affiliates("SecurCare"), Kevin Howard Real Estate Inc., d/b/a Northwest Self Storage and its controlled affiliates("Northwest"), Optivest Properties LLC and its controlled affiliates ("Optivest"), Guardian Storage Centers LLC andits controlled affiliates ("Guardian"), Move It Self Storage and its controlled affiliates ("Move It"), Arizona MiniStorage Management Company d/b/a Storage Solutions and its controlled affiliates ("Storage Solutions"), Hide-Away Storage Services, Inc. and its controlled affiliates ("Hide-Away"), an affiliate of Shader Brothers Corporationd/b/a Personal Mini Storage ("Personal Mini"), Southern Storage Management Systems, Inc. d/b/a Southern SelfStorage ("Southern") and affiliates of Investment Real Estate Management, LLC d/b/a Moove In Self Storage("Moove In").
As of December 31, 2019, the Company also managed through its property management platform an additionalportfolio of 175 properties owned by the Company's unconsolidated real estate ventures. These properties containapproximately 12.6 million rentable square feet, configured in approximately 103,000 storage units and locatedacross 21 states. The Company owns a 25% equity interest in each of its unconsolidated real estate ventures.
As of December 31, 2019, in total, the Company operated and held ownership interests in 742 self storageproperties located across 35 states and Puerto Rico with approximately 47.1 million rentable square feet inapproximately 378,000 storage units.
2. SUMMARY OF SIGNIFICANT ACCOUNTING POLICIES
Basis of Presentation
The accompanying consolidated financial statements are presented on the accrual basis of accounting inaccordance with U.S. generally accepted accounting principles ("GAAP").
Table of ContentsNATIONAL STORAGE AFFILIATES TRUST
NOTES TO CONSOLIDATED FINANCIAL STATEMENTS
F-13

Principles of Consolidation
The Company's consolidated financial statements include the accounts of its operating partnership and itscontrolled subsidiaries. All significant intercompany balances and transactions have been eliminated in theconsolidation of entities.
When the Company obtains an economic interest in an entity, the Company evaluates the entity to determine ifthe entity is deemed a variable interest entity ("VIE"), and if the Company is deemed to be the primary beneficiary,in accordance with authoritative guidance issued on the consolidation of VIEs. When an entity is not deemed to be aVIE, the Company considers the provisions of additional guidance to determine whether the general partner controlsa limited partnership or similar entity when the limited partners have certain rights. The Company consolidates allentities that are VIEs and of which the Company is deemed to be the primary beneficiary. The Company hasdetermined that its operating partnership is a VIE. The sole significant asset of National Storage Affiliates Trust isits investment in its operating partnership, and consequently, substantially all of the Company's assets and liabilitiesrepresent those assets and liabilities of its operating partnership.
As of December 31, 2019, the Company's operating partnership was the primary beneficiary of, and thereforeconsolidated, 21 DownREIT partnerships that are considered VIEs, which owned 34 self storage properties. The netbook value of the real estate owned by these VIEs was $233.1 million and $240.4 million as of December 31, 2019and December 31, 2018, respectively. For certain DownREIT partnerships which are subject to fixed rate mortgagespayable, the carrying value of such fixed rate mortgages payable held by these VIEs was $136.4 million and $138.4million as of December 31, 2019 and December 31, 2018, respectively. The creditors of the consolidated VIEs donot have recourse to the Company's general credit.
Noncontrolling Interests
All of the limited partner equity interests ("OP equity") in its operating partnership not held by the Company arereflected as noncontrolling interests. Noncontrolling interests also include ownership interests in DownREITpartnerships held by entities other than the Company's operating partnership. In the consolidated statements ofoperations, the Company allocates net income (loss) attributable to noncontrolling interests to arrive at net income(loss) attributable to National Storage Affiliates Trust.
For transactions that result in changes to the Company's ownership interest in its operating partnership, thecarrying amount of noncontrolling interests is adjusted to reflect such changes. The difference between the fair valueof the consideration received or paid and the amount by which the noncontrolling interests is adjusted is reflected asan adjustment to additional paid-in capital on the consolidated balance sheets.
Self Storage Properties
Self storage properties are carried at historical cost less accumulated depreciation and any impairment losses.Major replacements and betterments, which improve or extend the life of an asset, are capitalized. Expenditures forordinary repairs and maintenance are expensed as incurred and are included in property operating expenses.Estimated depreciable lives of self storage properties are determined by considering the age and other indicatorsabout the condition of the assets at the respective dates of acquisition, resulting in a range of estimated useful livesfor assets within each category. All self storage property assets are depreciated using the straight-line method.Buildings and improvements are depreciated over estimated useful lives primarily between seven and 40 years;furniture and equipment are depreciated over estimated useful lives primarily between three and 10 years.
When a self storage property is acquired, the purchase price of the acquired self storage property is allocated toland, buildings and improvements, furniture and equipment, customer in-place leases, assumed real estate leaseholdinterests, and other assets acquired and liabilities assumed, based on the estimated fair value of each component.When a portfolio of self storage properties is acquired, the purchase price is allocated to the individual self storageproperties based on the fair value determined using an income approach with appropriate risk-adjusted capitalizationrates, which take into account the relative size, age and location of the individual self storage properties.
Cash and Cash Equivalents
The Company considers all highly-liquid investments purchased with original maturities of three months or lessto be cash equivalents. From time to time, the Company maintains cash balances in financial institutions in excess offederally insured limits. The Company has never experienced a loss that resulted from exceeding federally insuredlimits.
Table of Contents
F-14

Restricted Cash
The Company's restricted cash consists of escrowed funds deposited with financial institutions for real estatetaxes, insurance and other reserves for capital improvements in accordance with the Company's loan agreements.
Customer In-place Leases
In allocating the purchase price for a self storage property acquisition, the Company determines whether theacquisition includes intangible assets. The Company allocates a portion of the purchase price to an intangible assetattributed to the value of customer in-place leases. This intangible asset is amortized to expense using the straight-line method over 12 months, the estimated average rental period for the leases. Substantially all of the leases in placeat acquired properties are at market rates, as the leases are month-to-month contracts.
Impairment of Long-Lived Assets
The Company evaluates long-lived assets for impairment when events and circumstances indicate that theremay be impairment. When events or changes in circumstances indicate that the Company's long-lived assets may notbe recoverable, the carrying value of these long-lived assets is compared to the undiscounted future net operatingcash flows, plus a terminal value attributable to the assets. If an asset's carrying value is not considered recoverable,an impairment loss is recorded to the extent the net carrying value of the asset exceeds the fair value. For the periodspresented, no assets were determined to be impaired under this policy.
Costs of Raising Capital
Commissions, legal fees and other costs that are directly associated with equity offerings are capitalized asdeferred offering costs, pending a determination of the success of the offering. Deferred offering costs related tosuccessful offerings are charged to additional paid-in capital within equity in the period it is determined that theoffering was successful.
Debt issuance costs are amortized over the estimated life of the related debt using the straight-line method,which approximates the effective interest rate method. Amortization of debt issuance costs is included in interestexpense in the accompanying statements of operations.
Revenue Recognition
Rental revenue
Rental revenue consists of space rentals and related fees. Management has determined that all of the Company'sleases are operating leases. Substantially all leases may be terminated on a month-to-month basis and rental incomeis recognized ratably over the lease term using the straight-line method. Rents received in advance are deferred andrecognized on a straight-line basis over the related lease term associated with the prepayment. Promotional discountsand other incentives are recognized as a reduction to rental income over the applicable lease term.
Other property-related revenue
Other property-related revenue primarily consists of ancillary revenues such as tenant insurance and/or tenantwarranty protection-related access fees and sales of storage supplies which are recognized in the period earned.
The Company and certain of the Company’s PROs have tenant insurance- and/or tenant warranty protectionplan-related arrangements with insurance companies and the Company’s tenants. During the years endedDecember 31, 2019, 2018 and 2017, the Company recognized $9.1 million, $7.5 million and $6.0 million,respectively, of tenant insurance and tenant warranty protection plan revenues.
The Company sells boxes, packing supplies, locks and other retail merchandise at its properties. During theyears ended December 31, 2019, 2018 and 2017, the Company recognized retail sales of $1.7 million, $1.5 millionand $1.3 million, respectively.
Management fees and other revenue
Management fees and other revenue consist of property management fees, platform fees, call center fees,acquisition fees, and a portion of tenant warranty protection or tenant insurance proceeds that the Company earns formanaging and operating its unconsolidated real estate ventures.
With respect to both the 2018 Joint Venture and the 2016 Joint Venture, the Company provides supervisory andadministrative property management services, centralized call center services, and technology platform and revenue
Table of Contents
F-15

management services to the properties in the unconsolidated real estate ventures. The property management fees areequal to 6% of monthly gross revenues and net sales revenues from the assets of the unconsolidated real estateventures, and the platform fees are equal to $1,250 per month per unconsolidated real estate venture property. Withrespect to the 2016 Joint Venture only, the call center fees are equal to 1% of each of monthly gross revenues andnet sales revenues from the 2016 Joint Venture properties. During the years ended December 31, 2019, 2018 and2017, the Company recognized property management fees, call center fees and platform fees of $12.8 million, $7.8million and $4.8 million, respectively.
For acquisition fees, the Company provides sourcing, underwriting and administration services to theunconsolidated real estate ventures. The 2016 Joint Venture paid the Company a $4.1 million acquisition fee equalto 0.65% of the gross capitalization (including debt and equity) of the original 66-property 2016 Joint Ventureportfolio (the "Initial 2016 JV Portfolio") in 2016, at the time of the Initial 2016 JV Portfolio acquisition. The 2018Joint Venture paid the Company a $4.0 million acquisition fee related to the initial acquisition of properties by the2018 Joint Venture (the "Initial 2018 JV Portfolio") during the year ended December 31, 2018, at the time of theInitial 2018 JV Portfolio acquisition. These fees are refundable to the unconsolidated real estate ventures, on aprorated basis, if the Company is removed as the managing member during the initial four year life of theunconsolidated real estate ventures and as such, the Company's performance obligation for these acquisition fees aresatisfied over a four year period. As of December 31, 2019 and 2018, the Company had deferred revenue related tothe acquisition fees of $2.8 million and $4.6 million, respectively.
The Company also earns acquisition fees for properties acquired by the unconsolidated real estate venturessubsequent to the Initial 2016 JV Portfolio and the Initial 2018 JV Portfolio. These fees are based on a percentage ofthe gross capitalization of the acquired assets determined by the members of the 2016 Joint Venture and the 2018Joint Venture, and are generally earned when the unconsolidated real estate ventures obtain title and control of anacquired property. During the years ended December 31, 2019, 2018 and 2017, the Company recognized acquisitionfees of $1.8 million, $1.6 million and $1.5 million, respectively.
An affiliate of the Company facilitates tenant warranty protection or tenant insurance programs for tenants ofthe properties in the unconsolidated real estate ventures in exchange for 50% of all proceeds from such programs ateach unconsolidated real estate venture property. During the years ended December 31, 2019, 2018 and 2017, theCompany recognized $4.7 million, $2.4 million and $1.9 million, respectively, of revenue related to these activities.
Advertising Costs
The Company incurs advertising costs primarily attributable to internet, directory and other advertising.Advertising costs are included in property operating expenses in the accompanying statements of operations. Thesecosts are expensed in the period in which the cost is incurred. The Company incurred advertising costs of $5.2million, $4.1 million and $3.7 million for the years ended December 31, 2019, 2018 and 2017, respectively.
Acquisition Costs
The Company incurs title, legal and consulting fees, and other costs associated with the completion ofacquisitions. During the year ended December 31, 2017, the Company adopted Accounting Standards Update("ASU") 2017-01 and as a result, the Company's self storage property acquisitions during the years endedDecember 31, 2019 and 2018 were accounted for as asset acquisitions, and accordingly, acquisition costs directlyrelated to the self storage property acquisitions were capitalized as part of the basis of the acquired properties.Indirect acquisition costs remain included in acquisition costs in the accompanying statements of operations in theperiod in which they were incurred. Prior to the Company's adoption of ASU 2017-01, direct and indirect costs wereincluded in acquisition costs in the accompanying statements of operations in the period in which they wereincurred.
Table of Contents
F-16

Income Taxes
The Company has elected and believes it has qualified to be taxed as a REIT under sections 856 through 860 ofthe U.S. Internal Revenue Code (the "Code") commencing with the taxable year ended December 31, 2015. Toqualify as a REIT, among other things, the Company is required to distribute at least 90% of its REIT taxableincome to its shareholders and meet certain tests regarding the nature of its income and assets. As a REIT, theCompany is not subject to federal income tax on the earnings distributed currently to its shareholders that it derivesfrom its REIT qualifying activities. If the Company fails to qualify as a REIT in any taxable year, and is unable toavail itself of certain provisions set forth in the Code, all of the Company's taxable income would be subject tofederal and state income taxes at regular corporate rates.
The Company will not be required to make distributions with respect to income derived from the activitiesconducted through subsidiaries that the Company elects to treat as taxable REIT subsidiaries ("TRS") for federalincome tax purposes. Certain activities that the Company undertakes must be conducted by a TRS, such asperforming non-customary services for its customers, facilitating sales by PROs of tenant insurance and holdingassets that the Company is not permitted to hold directly. A TRS is subject to federal and state income taxes.
On June 25, 2014, the Company formed NSA TRS, LLC ("NSA TRS"), a Delaware limited liability company.The Company has elected to treat NSA TRS as a TRS, and consequently, NSA TRS is subject to U.S. federal andstate corporate income taxes. Deferred tax assets and liabilities are recognized to the extent of any differencesbetween the financial reporting and tax bases of assets and liabilities. No material deferred tax assets and liabilitieswere recorded as of December 31, 2019 and 2018.
The Company did not have any unrecognized tax benefits related to uncertain tax positions as of December 31,2019 and 2018. Future amounts of accrued interest and penalties, if any, related to uncertain tax positions will berecorded as a component of income tax expense. The Company does not expect that the amount of unrecognized taxbenefits will change significantly in the next 12 months.
The Company's material taxing jurisdiction is the U.S. federal jurisdiction; the 2016 tax year is the earliestperiod that remains open to examination by these taxing jurisdictions.
Earnings per Share
Basic earnings per share is calculated based on the weighted average number of the Company's common sharesof beneficial interest, $0.01 par value per share ("common shares"), outstanding during the period. Diluted earningsper share is calculated by further adjusting for the dilutive impact using the treasury stock method for any shareoptions and unvested share equivalents outstanding during the period and the if-converted method for anyconvertible securities outstanding during the period.
As more fully described below under "–Allocation of Net Income (Loss)", the Company allocates GAAP income(loss) utilizing the hypothetical liquidation at book value ("HLBV") method, which could result in net income (ornet loss) attributable to National Storage Affiliates Trust during a period when the Company reports consolidated netloss (or net income), or net income (or net loss) attributable to National Storage Affiliates Trust in excess of theCompany's consolidated net income (or net loss). The computations of basic and diluted earnings (loss) per sharemay be materially affected by these disproportionate income (loss) allocations, resulting in volatile fluctuations ofbasic and diluted earnings (loss) per share.
Equity-Based Awards
The measurement and recognition of compensation cost for all equity-based awards granted to officers,employees and consultants is based on estimated fair values. Compensation cost is recognized on a straight-linebasis over the requisite service periods of each award with non-graded vesting. For awards granted which contain agraded vesting schedule and the only condition for vesting is a service condition, compensation cost is recognized asan expense on a straight-line basis over the requisite service period as if the award was, in substance, a single award.For awards granted for which vesting is subject to a performance condition, compensation cost is recognized overthe requisite service period if and when the Company concludes it is probable that the performance condition will beachieved.
The estimated fair value of all equity-based awards issued to PROs and their affiliates in connection with selfstorage property acquisitions is included in the cost of the respective acquisitions. The estimated fair value of such
Table of Contents
F-17

awards is measured at the date the self storage properties are acquired, as this date represents satisfaction of theperformance condition and coincides with the award vesting.
Derivative Financial Instruments
The Company carries all derivative financial instruments on the balance sheet at fair value. Fair value ofderivatives is determined by reference to observable prices that are based on inputs not quoted on active markets, butcorroborated by market data. The accounting for changes in the fair value of a derivative instrument depends onwhether the derivative has been designated and qualifies as part of a hedging relationship. The Company's use ofderivative instruments has been limited to interest rate swap and cap agreements. The fair values of derivativeinstruments are included in other assets and accounts payable and accrued liabilities in the accompanying balancesheets. For derivative instruments not designated as cash flow hedges, the unrealized gains and losses are included ininterest expense in the accompanying statements of operations. For derivatives designated as cash flow hedges, theeffective portion of the changes in the fair value of the derivatives is initially reported in accumulated othercomprehensive income (loss) in the Company's balance sheets and subsequently reclassified into earnings when thehedged transaction affects earnings.
The valuation of interest rate swap and cap agreements is determined using widely accepted valuationtechniques including discounted cash flow analysis on the expected cash flows of each derivative. This analysisreflects the contractual terms of derivatives, including the period to maturity, and uses observable market-basedinputs, including interest rate curves. The fair values of interest rate swaps are determined using the market standardmethodology of netting the discounted future fixed cash payments and the discounted expected variable cashreceipts. The variable cash receipts are based on an expectation of future interest rates (forward curves) derived fromobservable market interest rate forward curves. The Company may enter into derivative contracts that are intended toeconomically hedge certain of its risk, even though hedge accounting does not apply or the Company elects not toapply hedge accounting.
Fair Value Measurements
When measuring fair value of financial instruments that are required to be recorded or disclosed at fair value,the Company uses a three-tier measurement hierarchy which prioritizes the inputs used to calculate fair value. Thesetiers include Level 1, defined as observable inputs such as quoted prices in active markets; Level 2, defined as inputsother than quoted prices in active markets that are either directly or indirectly observable; and Level 3, defined asunobservable inputs in which little or no market data exists, therefore requiring an entity to develop its ownassumptions.
Investments in Unconsolidated Real Estate Ventures
The Company’s investments in its unconsolidated real estate ventures are recorded under the equity method ofaccounting in the accompanying consolidated financial statements. Under the equity method, the Company’sinvestments in unconsolidated real estate ventures are stated at cost and adjusted for the Company’s share of netearnings or losses and reduced by distributions. Equity in earnings (losses) is recognized based on the Company’sownership interest in the earnings (losses) of the unconsolidated real estate ventures. The Company follows the"nature of the distribution approach" for classification of distributions from its unconsolidated real estate ventures inits consolidated statements of cash flows. Under this approach, distributions are reported on the basis of the nature ofthe activity or activities that generated the distributions as either a return on investment, which are classified asoperating cash flows, or a return of investment (e.g., proceeds from the unconsolidated real estate ventures' sale ofassets) which are reported as investing cash flows.
Segment Reporting
The Company manages its business as one reportable segment consisting of investments in self storageproperties located in the United States. Although the Company operates in several markets, these operations havebeen aggregated into one reportable segment based on the similar economic characteristics among all markets.
Table of Contents
F-18

Allocation of Net Income (Loss)
The distribution rights and priorities set forth in the operating partnership's LP Agreement differ from what isreflected by the underlying percentage ownership interests of the operating partnership's unitholders. Accordingly,the Company allocates GAAP income (loss) utilizing the HLBV method, in which the Company allocates income orloss based on the change in each unitholders’ claim on the net assets of its operating partnership at period end afteradjusting for any distributions or contributions made during such period. The HLBV method is commonly applied toequity investments where cash distribution percentages vary at different points in time and are not directly linked toan equity holder’s ownership percentage.
The HLBV method is a balance sheet-focused approach to income (loss) allocation. A calculation is prepared ateach balance sheet date to determine the amount that unitholders would receive if the operating partnership were toliquidate all of its assets (at GAAP net book value) and distribute the resulting proceeds to its creditors andunitholders based on the contractually defined liquidation priorities. The difference between the calculatedliquidation distribution amounts at the beginning and the end of the reporting period, after adjusting for capitalcontributions and distributions, is used to derive each unitholder's share of the income (loss) for the period. Due tothe stated liquidation priorities and because the HLBV method incorporates non-cash items such as depreciationexpense, in any given period, income or loss may be allocated disproportionately to unitholders as compared to theirrespective ownership percentage in the operating partnership, and net income (loss) attributable to National StorageAffiliates Trust could be more or less net income than actual cash distributions received and more or less income orloss than what may be received in the event of an actual liquidation. Additionally, the HLBV method could result innet income (or net loss) attributable to National Storage Affiliates Trust during a period when the Company reportsconsolidated net loss (or net income), or net income (or net loss) attributable to National Storage Affiliates Trust inexcess of the Company's consolidated net income (or net loss). The computations of basic and diluted earnings (loss)per share may be materially affected by these disproportionate income (loss) allocations, resulting in volatilefluctuations of basic and diluted earnings (loss) per share.
Other Comprehensive Income (Loss)
The Company has cash flow hedge derivative instruments that are measured at fair value with unrealized gainsor losses recognized in other comprehensive income (loss) with a corresponding adjustment to accumulated othercomprehensive income (loss) within equity, as discussed further in Note 14. Under the HLBV method of allocatingincome (loss) discussed above, a calculation is prepared at each balance sheet date by applying the HLBV methodincluding, and excluding, the assets and liabilities resulting from the Company's cash flow hedge derivativeinstruments to determine comprehensive income (loss) attributable to National Storage Affiliates Trust. As a resultof the distribution rights and priorities set forth in the operating partnership's LP Agreement, in any given period,other comprehensive income (loss) may be allocated disproportionately to unitholders as compared to theirrespective ownership percentage in the operating partnership and as compared to their respective allocation of netincome (loss).
Gain on sale of self storage properties
The Company recognizes gains from disposition of facilities only upon closing in accordance with the guidanceon sales of nonfinancial assets. Profit on real estate sold is recognized upon closing when all, or substantially all, ofthe promised consideration has been received and is nonrefundable and the Company has transferred control of thefacilities to the purchaser.
Goodwill
Goodwill represents the costs of business acquisitions in excess of the fair value of identifiable net assetsacquired. The Company evaluates goodwill for potential impairment annually, or whenever impairment indicatorsare present. The Company determined that there was no impairment to goodwill during the years endedDecember 31, 2019 and 2018.
Use of Estimates
The preparation of financial statements in conformity with GAAP requires management to make estimates andassumptions that affect the reported amounts of assets and liabilities and disclosure of contingent assets andliabilities at the date of the financial statements and the reported amounts of revenues and expenses during thereporting period. Actual results could differ from those estimates.
Table of Contents
F-19

Recent Accounting Pronouncements
In February 2016, the Financial Accounting Standards Board ("FASB") issued ASU 2016-02, Leases, whichamends the existing guidance for accounting for leases, including requiring lessors to account for leases using anapproach that is substantially equivalent to existing guidance for sales-type leases, direct financing leases andoperating leases and lessees to recognize most leases on-balance sheet as lease liabilities with corresponding right-of-use assets. In July 2018, the FASB issued ASU 2018-11, Leases - Targeted Improvements, which allows entitiesthe option to apply the new standard at adoption date with a cumulative-effect adjustment in the period of adoption.
The Company adopted ASU 2016-02 and ASU 2018-11 effective January 1, 2019 and applied it to leases thatwere in place on the effective date. The Company elected the practical expedients which permit the Company tocombine lease and nonlease components and to not reassess (i) whether any expired or existing contracts are orcontain leases, (ii) the lease classification for any expired or existing leases, and (iii) any initial direct costs for anyexisting leases as of the effective date. Results for reporting periods beginning January 1, 2019 are presented underASU 2016-02 and ASU 2018-11. As a result, beginning on January 1, 2019, activity related to uncollectibleaccounts are recognized as a current-period adjustment within revenue. For periods prior to January 1, 2019, suchamounts were previously included in operating expenses. The adoption of the lease standard did not result in acumulative catch-up adjustment to opening equity. See Note 13 for additional detail about the Company's non-cancelable leasehold interest agreements where the Company is a lessee.
3. SHAREHOLDERS' EQUITY AND NONCONTROLLING INTERESTS
Shareholders' Equity
At the Market ("ATM") Program
On February 27, 2019, the Company entered into a sales agreement with certain sales agents, pursuant to whichthe Company may sell from time to time up to $250.0 million of the Company's common shares and 6.000% SeriesA Preferred Shares in sales deemed to be "at the market" offerings. The sales agreement contemplates that, inaddition to the issuance and sale by the Company of offered shares to or through the sale agents, the Company mayenter into separate forward sale agreements with any forward purchaser. Forward sale agreements, if any, willinclude only the Company's common shares and will not include any Series A Preferred Shares. If the Companyenters into a forward sale agreement with any forward purchaser, such forward purchaser will attempt to borrowfrom third parties and sell, through the related agent, acting as sales agent for such forward purchaser (each, a"forward seller"), offered shares, in an amount equal to the offered shares subject to such forward sale agreement, tohedge such forward purchaser’s exposure under such forward sale agreement. The Company may offer the commonshares and Series A Preferred Shares through the agents, as the Company's sales agents, or, as applicable, as forwardseller, or directly to the agents or forward sellers, acting as principals, by means of, among others, ordinary brokers’transactions on the NYSE or otherwise at market prices prevailing at the time of sale or at negotiated prices.
During the year ended December 31, 2019, the Company sold 2,375,000 of its common shares through theATM program at an average offering price of $30.06 per share, resulting in net proceeds to the Company ofapproximately $70.6 million, after deducting compensation payable by the Company to such agents and offeringexpenses. In addition, during the year ended December 31, 2019, the Company sold 1,785,680 of its Series APreferred Shares through the ATM program at an average offering price of $24.84 per share, resulting in netproceeds to the Company of approximately $43.6 million, after deducting compensation payable by the Company tosuch agents and offering expenses.
Common Share Offerings
On July 13, 2018, the Company closed a follow-on offering of 5,900,000 of its common shares at an offeringprice of $29.86 per share. The Company received aggregate net proceeds from the offering of approximately $175.6million after deducting expenses associated with the offering.
On December 11, 2017, the Company closed a follow-on public offering of 5,750,000 of its common shares,which included 750,000 common shares sold upon the exercise in full by the underwriters of their option to purchaseadditional common shares, at a public offering price of $25.50 per share. The Company received aggregate netproceeds from the offering of approximately $140.3 million after deducting the underwriting discount and additionalexpenses associated with the offering.
Table of Contents
F-20

Series A Preferred Share Offering
On October 11, 2017, the Company completed an underwritten public offering of 6,900,000 of its 6.000%Series A Preferred Shares, which included 900,000 Series A Preferred Shares sold upon the exercise in full by theunderwriters of their option to purchase additional Series A Preferred Shares, resulting in net proceeds to theCompany of approximately $166.6 million, after deducting the underwriting discount and the Company's otheroffering expenses. Dividends on the Series A Preferred Shares, which are payable quarterly in arrears, arecumulative from the date of original issuance in the amount of $1.50 per share each year. The Series A PreferredShares rank senior to the Company's common shares with respect to rights and rights upon our liquidation,dissolution or winding up. Generally, the Series A Preferred Shares become redeemable by the Company beginningin October 2022 for a cash redemption price of $25.00 per share, plus accrued but unpaid dividends.
Noncontrolling Interests
All of the OP equity in the Company's operating partnership not held by the Company is reflected asnoncontrolling interests. Noncontrolling interests also include ownership interests in DownREIT partnerships heldby entities other than the Company's operating partnership. NSA is the general partner of its operating partnershipand is authorized to cause its operating partnership to issue additional partner interests, including OP units andsubordinated performance units, at such prices and on such other terms as it determines in its sole discretion.
As of December 31, 2019 and 2018, units reflecting noncontrolling interests consisted of the following:
December 31,2019 2018
Series A-1 preferred units 642,982 343,719OP units 30,188,305 28,874,103Subordinated performance units 11,014,195 10,749,475LTIP units 743,566 931,671DownREIT units
DownREIT OP units 1,848,261 1,834,786DownREIT subordinated performance units 4,371,622 4,386,999
Total 48,808,931 47,120,753
Series A-1 Preferred Units
The 6.000% Series A-1 Cumulative Redeemable Preferred Units ("Series A-1 preferred units") rank senior toOP units and subordinated performance units in the Company's operating partnership with respect to distributionsand liquidation. The Series A-1 preferred units have a stated value of $25.00 per unit and receive distributions at anannual rate of 6.000%. These distributions are cumulative. The Series A-1 preferred units are redeemable at theoption of the holder after the first anniversary of the date of issuance, which redemption obligations may be satisfiedat the Company’s option in cash in an amount equal to the market value of an equivalent number of the Company's6.000% Series A Preferred Shares or the issuance of 6.000% Series A Preferred Shares on a one-for-one basis,subject to adjustments. Generally, the Series A-1 preferred units become redeemable by the Company beginning tenyears after the initial issuance of each Series A-1 preferred unit at a stated value of $25.00 per unit, plus accrued butunpaid distributions. The increase in Series A-1 preferred units outstanding from December 31, 2018 toDecember 31, 2019 was due to the issuance of Series A-1 preferred units in connection with the acquisition of selfstorage properties partially offset by the redemption of 41,439 Series A-1 preferred units for Series A preferredshares.
OP Units and DownREIT OP units
OP units in the Company's operating partnership are redeemable for cash or, at the Company's option,exchangeable for common shares on a one-for-one basis, and DownREIT OP units are redeemable for cash or, at theCompany's option, exchangeable for OP units in its operating partnership on a one-for-one basis, subject to certainadjustments in each case. The holders of OP units are generally not entitled to elect redemption until one year afterthe issuance of the OP units. The holders of DownREIT OP units are generally not entitled to elect redemption untilfive years after the date of the contributor's initial contribution.
Table of Contents
F-21

The increase in OP Units outstanding from December 31, 2018 to December 31, 2019 was due to the issuanceof 863,148 OP units related to the voluntary conversions of 913,680 subordinated performance units (as discussedfurther below), the issuance of 350,319 OP units in connection with the acquisition of self storage properties,396,224 LTIP units which were converted into OP units and the issuance of 285,512 OP units in connection with theacquisition of an interest in a tenant reinsurance company and related cash flows, as discussed in Note 11, partiallyoffset by the redemption of 581,001 OP units for common shares.
The increase in DownREIT OP units outstanding from December 31, 2018 to December 31, 2019 was due tothe issuance of 13,475 DownREIT OP units related to the conversion of 15,377 DownREIT subordinatedperformance units (as discussed further below).
Subordinated Performance Units and DownREIT Subordinated Performance Units
Subordinated performance units may also, under certain circumstances, be convertible into OP units which areexchangeable for common shares as described above, and DownREIT subordinated performance units may, undercertain circumstances, be exchangeable for subordinated performance units on a one-for-one basis. Subordinatedperformance units are only convertible into OP units after a two year lock-out period and then generally (i) at theholder’s election only upon the achievement of certain performance thresholds relating to the properties to whichsuch subordinated performance units relate or (ii) at the Company's election upon a retirement event of a PRO thatholds such subordinated performance units or upon certain qualifying terminations. The holders of DownREITsubordinated performance units are generally not entitled to elect redemption until at least five years after the date ofthe contributor's initial contribution.
Following such lock-out period, a holder of subordinated performance units in the Company's operatingpartnership may elect a voluntary conversion one time each year on or prior to December 1st to convert a pre-determined portion of such subordinated performance units into OP units in the Company's operating partnership,with such conversion effective January 1st of the following year, with each subordinated performance unit beingconverted into the number of OP units determined by dividing the average cash available for distribution, or CAD,per unit on the series of specific subordinated performance units over the one-year period prior to conversionby 110% of the CAD per unit on the OP units determined over the same period. CAD per unit on the series ofspecific subordinated performance units and OP units is determined by the Company based generally upon theapplication of the provisions of the LP Agreement applicable to the distributions of operating cash flow and capitaltransactions proceeds.
The increase in subordinated performance units outstanding from December 31, 2018 to December 31, 2019was due to the issuance of 1,178,400 subordinated performance units for co-investment by certain of the Company'sPROs in connection with the acquisition of self storage properties partially offset by the voluntary conversion of913,680 subordinated performance units into 863,148 OP units.
The decrease in DownREIT subordinated performance units outstanding from December 31, 2018 toDecember 31, 2019 was due to the conversion of 15,377 DownREIT subordinated performance units into13,475 DownREIT OP units.
LTIP Units
LTIP units are a special class of partnership interest in the Company's operating partnership that allow theholder to participate in the ordinary and liquidating distributions received by holders of the OP units (subject to theachievement of specified levels of profitability by the Company's operating partnership or the achievement of certainevents). LTIP units may also, under certain circumstances, be convertible into OP units on a one-for-one basis,which are then exchangeable for common shares as described above. LTIP units do not have full parity with OPunits with respect to liquidating distributions and may not receive ordinary distributions until such parity is reachedpursuant to the terms of the LP Agreement. If such parity is reached under the LP Agreement, upon vesting, vestedLTIP units may be converted into an equal number of OP units, and thereafter have all the rights of OP units,including redemption rights. See Note 9 for additional information about the Company's LTIP Units.
The decrease in LTIP units outstanding from December 31, 2018 to December 31, 2019 was due to theconversion of 396,224 LTIP units into OP units partially offset by the issuance of 208,119 compensatory LTIP unitsto employees, trustees and consultants, net of forfeitures.
Table of Contents
F-22

4. SELF STORAGE PROPERTIES
Self storage properties are summarized as follows (dollars in thousands):
December 31,2019 2018
Land $ 649,938 $ 583,455Buildings and improvements 2,435,171 2,048,281Furniture and equipment 6,610 5,987
Total self storage properties 3,091,719 2,637,723Less accumulated depreciation (337,822) (246,261)
Self storage properties, net $ 2,753,897 $ 2,391,462
Depreciation expense related to self storage properties amounted to $92.2 million, $76.3 million and $60.5million for the years ended December 31, 2019, 2018 and 2017, respectively.
5. INVESTMENT IN UNCONSOLIDATED REAL ESTATE VENTURES
2018 Joint Venture
As of December 31, 2019, the Company's unconsolidated real estate venture, formed in September 2018 with anaffiliate of Heitman America Real Estate REIT LLC (the "2018 Joint Venture"), in which the Company has a 25%ownership interest, owned and operated a portfolio of 103 self storage properties containing approximately7.7 million rentable square feet, configured in over 63,000 storage units and located across 17 states.
2016 Joint Venture
As of December 31, 2019, the Company's unconsolidated real estate venture, formed in September 2016 with astate pension fund advised by Heitman Capital Management LLC (the "2016 Joint Venture"), in which the Companyhas a 25% ownership interest, owned and operated a portfolio of 72 properties containing approximately 4.9 millionrentable square feet, configured in approximately 40,000 storage units and located across 13 states.
During the year ended December 31, 2019, the 2016 Joint Venture sold to the Company one self storageproperty for a gross sales price of $4.1 million. See Note 11 for additional details about the Company's acquisition ofthe self storage property from the 2016 Joint Venture.
The Company's investments in the 2018 Joint Venture and 2016 Joint Venture are accounted for using theequity method of accounting and are included in investment in unconsolidated real estate ventures in the Company’sconsolidated balance sheets. The Company’s earnings from its investments in the 2018 Joint Venture and 2016 JointVenture are presented in equity in earnings (losses) of unconsolidated real estate ventures on the Company’sconsolidated statements of operations.
F-23

The following table presents the combined condensed financial position of the Company's unconsolidated realestate ventures as of December 31, 2019 and December 31, 2018 (in thousands):
December 31,2019 2018
ASSETSSelf storage properties, net $ 1,835,235 $ 1,894,412Other assets 22,413 50,915
Total assets $ 1,857,648 $ 1,945,327LIABILITIES AND EQUITYDebt financing $ 989,182 $ 956,357Other liabilities 20,487 16,516Equity 847,979 972,454
Total liabilities and equity $ 1,857,648 $ 1,945,327
The following table presents the combined condensed operating information of the Company's unconsolidatedreal estate ventures for the years ended December 31, 2019 and 2018 and the period ended December 31, 2017 (inthousands):
Year Ended December 31,2019 2018 2017
Total revenue $ 162,827 $ 94,507 $ 54,747Property operating expenses 49,845 30,229 18,463
Net operating income 112,982 64,278 36,284Supervisory, administrative and other
expenses (10,818) (6,397) (3,921)Depreciation and amortization (79,556) (40,930) (29,192)Interest expense (39,936) (20,718) (11,389)Loss on sale of self storage properties (806) (820) —Acquisition and other expenses (1,971) (1,188) (1,146)
Net loss $ (20,105) $ (5,775) $ (9,364)
The combined condensed operating information in the table above only includes information for the 2018 JointVenture following the acquisition of the Initial 2018 JV Portfolio in September 2018.
6. SELF STORAGE PROPERTY ACQUISITIONS AND DISPOSITIONS
Acquisitions
The Company acquired 69 self storage properties with an estimated fair value of $447.8 million during the yearended December 31, 2019 and 57 self storage properties and an expansion project adjacent to an existing propertywith an estimated fair value of $356.6 million during the year ended December 31, 2018. Of these acquisitions,during the year ended December 31, 2019, 19 self storage properties with an estimated fair value of $131.3 millionwere acquired by the Company from its PROs and one self storage property with an estimated fair value of$4.1 million was acquired by the Company from the 2016 Joint Venture. During the year ended December 31, 2018,four self storage properties and the expansion project adjacent to an existing property with an estimated fair value of$23.1 million were acquired by the Company from its PROs.
The self storage property acquisitions were accounted for as asset acquisitions and accordingly, during the yearsended December 31, 2019 and 2018, $3.6 million and $1.9 million, respectively, of transaction costs related to theacquisitions were capitalized as part of the basis of the acquired properties. The Company recognized the estimatedfair value of the acquired assets and assumed liabilities on the respective dates of such acquisitions. The Companyallocated a portion of the purchase price to identifiable intangible assets consisting of customer in-place leases whichwere recorded at estimated fair values of $10.9 million and $9.1 million during the years ended December 31, 2019
Table of Contents
F-24

and 2018, respectively, resulting in a total fair value of $436.9 million and $347.5 million allocated to real estateduring the years ended December 31, 2019 and 2018, respectively.
The following table summarizes, by calendar quarter, the investments in self storage property acquisitionscompleted by the Company during the years ended December 31, 2019 and 2018 (dollars in thousands):
Acquisitions closed during the Three Months Ended:
Summary of Investment
Number of Properties
Cash and Acquisition
CostsValue of OP
Equity(1)
Liabilities AssumedTotalMortgages(2) Other
March 31, 2019 32 $ 160,531 $ 33,356 $ — $ 674 $ 194,561June 30, 2019 24 168,442 15,515 — 1,378 185,335September 30, 2019 6 34,624 950 — 197 35,771December 31, 2019 7 30,004 2,005 — 154 32,163
Total 69 $ 393,601 $ 51,826 $ — $ 2,403 $ 447,830
March 31, 2018 25 $ 105,135 $ 22,403 $ 7,581 $ 670 $ 135,789June 30, 2018 12 62,470 — — 467 62,937September 30, 2018 13 102,012 3,660 — 856 106,528December 31, 2018 7 49,221 2,000 — 174 51,395
Total 57 $ 318,838 $ 28,063 $ 7,581 $ 2,167 $ 356,649(1) Value of OP equity represents the fair value of Series A-1 preferred units, OP units, subordinated performance units, and LTIP units.(2) Includes fair value of debt adjustment for assumed mortgages of approximately $0.2 million during the year ended December 31, 2018.
The results of operations for these self storage acquisitions are included in the Company's statements ofoperations beginning on the respective closing date for each acquisition. The accompanying statements of operationsincludes aggregate revenue of $30.4 million and operating income of $2.5 million related to the 69 self storageproperties acquired during the year ended December 31, 2019. For the year ended December 31, 2018, theaccompanying statements of operations includes aggregate revenue of $21.9 million and operating income of$2.5 million related to the 57 self storage properties acquired during such period.
Dispositions
During the year ended December 31, 2019, the Company sold one self storage property to an unrelated thirdparty. The gross sales price was $6.5 million and the Company recognized $2.8 million of gain on the sale.
During the year ended December 31, 2018, the Company sold to unrelated third parties two self storageproperties. The gross sales price was $5.5 million and the Company recognized $0.4 million of gains on the sales.
Table of Contents
F-25

7. OTHER ASSETS
Other assets consist of the following (dollars in thousands):
December 31,2019 2018
Customer in-place leases, net of accumulated amortization of $7,267 and $5,090, respectively $ 3,704 $ 4,063
Receivables:Trade, net 2,809 3,402PROs and other affiliates 2,773 2,027
Receivable from unconsolidated real estate ventures 4,765 4,573Property acquisition deposits 4,438 20,977Interest rate swaps 980 16,164Equity securities 7,703 —Prepaid expenses and other 4,762 4,266Corporate furniture, equipment and other, net 1,925 1,574Trade name 3,200 3,200Management contract, net of accumulated amortization of $2,272 and $1,564,
respectively 8,349 9,057Tenant reinsurance intangible, net of accumulated amortization of $317 14,283 —Goodwill 5,750 5,750
Total $ 65,441 $ 75,053
Amortization expense related to customer in-place leases amounted to $11.3 million, $11.6 million and$13.5 million for the years ended December 31, 2019, 2018 and 2017, respectively.
The Company measured the fair value of the trade name, which has an indefinite life and is not amortized, usingthe relief from royalty method at acquisition.
The management contract asset is charged to amortization expense on a straight-line basis over 15 years, whichrepresents the time period over which the majority of value was attributed in the Company’s discounted cash flowmodel. Amortization expense related to the management contract amounted to $0.7 million, $0.7 million and$0.7 million for the years ended December 31, 2019, 2018 and 2017 respectively.
Amortization expense related to the tenant reinsurance intangible amounted to $0.3 million for the year endedDecember 31, 2019. See Note 11 for additional details about the Company's tenant reinsurance intangible asset.
F-26

8. DEBT FINANCING
The Company's outstanding debt as of December 31, 2019 and 2018 is summarized as follows (dollars inthousands):
December 31,Interest Rate(1) 2019 2018
Credit Facility:Revolving line of credit 3.06% $ — $ 139,500Term loan A 3.74% 125,000 235,000Term loan B 2.91% 250,000 155,000Term loan C 2.80% 225,000 105,000Term loan D 3.57% 175,000 125,000
2023 Term loan facility 2.83% 175,000 175,0002028 Term loan facility 4.62% 75,000 75,0002029 Term loan facility 4.27% 100,000 —2029 Senior Unsecured Notes 3.98% 100,000 —2031 Senior Unsecured Notes 4.08% 50,000 —Fixed rate mortgages payable 4.16% 264,260 268,138
Total principal 1,539,260 1,277,638Unamortized debt issuance costs and
debt premium, net (5,213) 464Total debt $ 1,534,047 $ 1,278,102
(1) Represents the effective interest rate as of December 31, 2019. Effective interest rate incorporates the stated rate plus the impact of interest rate cash flow hedges and discount and premium amortization, if applicable. For the revolving line of credit, the effective interest rate excludes fees for unused borrowings.
Credit Facility
On July 29, 2019, the operating partnership, as borrower, the Company, and certain of the operatingpartnership's subsidiaries, as subsidiary guarantors, entered into a second amended and restated credit agreementwith a syndicated group of lenders, which extended the maturities, enhanced the terms in line with the currentmarket and increased the total borrowing capacity under the Company's unsecured credit facility by $255.0 millionfor a total of $1.275 billion (the "credit facility"). The credit facility consists of the following components: (i) arevolving line of credit (the "Revolver") which provides for a total borrowing commitment up to $500.0 million,under which the Company may borrow, repay and re-borrow amounts, (ii) a $125.0 million tranche A term loanfacility (the "Term Loan A"), (iii) a $250.0 million tranche B term loan facility (the "Term Loan B"), (iv) a $225.0million tranche C term loan facility (the "Term Loan C"), and (v) a $175.0 million tranche D term loan facility (the"Term Loan D"). The Company has an expansion option under the credit facility, which if exercised in full, wouldprovide for a total borrowing capacity under the credit facility of $1.750 billion.
The Revolver matures in January 2024; provided that the Company may elect to extend the maturity to July2024 by paying an extension fee of 0.075% of the total borrowing commitment thereunder at the time of extensionand meeting other customary conditions with respect to compliance. The Term Loan A matures in January 2023, theTerm Loan B matures in July 2024, the Term Loan C matures in January 2025 and the Term Loan D matures in July2026. The credit facility is not subject to any scheduled reduction or amortization payments prior to maturity.
Interest rates applicable to loans under the credit facility are determined based on a 1, 2, 3 or 6 month LIBORperiod (as elected by the Company at the beginning of any applicable interest period) plus an applicable margin or abase rate, determined by the greatest of the Key Bank prime rate, the federal funds rate plus 0.50% or one monthLIBOR plus 1.00%, plus an applicable margin. The applicable margins for the credit facility are leverage based andrange from 1.15% to 2.20% for LIBOR loans and 0.15% to 1.20% for base rate loans; provided that after such timeas the Company achieves an investment grade rating as defined in the credit facility, the Company may elect (but is
Table of Contents
F-27

not required to elect) (a "credit rating pricing election") that the credit facility be subject to applicable marginsranging from 0.78% to 2.25% for LIBOR loans and 0.00% to 1.25% for base rate loans. The Company is alsorequired to pay usage based fees ranging from 0.15% to 0.20% with respect to the unused portion of the Revolver;provided that if the Company makes a credit rating pricing election under the credit facility, the Company will berequired to pay rating based fees ranging from 0.125% to 0.300% with respect to the entire Revolver in lieu of anyusage based fees.
On July 29, 2019, the Company entered into interest rate swap agreements which together with the Company'sexisting interest rate swap agreements, fix the interest rates through maturity for the Term Loan A, Term Loan B,Term Loan C and Term Loan D. As of December 31, 2019, the Term Loan A, Term Loan B, Term Loan C andTerm Loan D had effective interest rates of 3.74%, 2.91%, 2.80% and 3.57%, respectively.
As of December 31, 2019, the Company had outstanding letters of credit totaling $5.7 million and would havehad the capacity to borrow remaining Revolver commitments of $494.3 million while remaining in compliance withthe credit facility's financial covenants described in the following paragraph.
The Company is required to comply with the following financial covenants under the credit facility:
• Maximum total leverage ratio not to exceed 60%, provided, however, the Company is permitted to maintain a ratio of up to 65% up to two (2) consecutive fiscal quarters immediately following the quarter in which a material acquisition (as defined in the credit facility) occurs
• Minimum fixed charge coverage ratio of at least 1.5x• Maximum unsecured debt to unencumbered asset value ratio not to exceed 60%, provided, however, the
Company shall be permitted to maintain a ratio of up to 65% up to two (2) consecutive fiscal quarters immediately following the quarter in which a material acquisition (as defined in the credit facility) occurs
• Unencumbered adjusted net operating income to unsecured interest expense of at least 2.0xOn July 29, 2019, the financial covenants and certain other terms of the 2023 Term Loan Facility, 2028 Term
Loan Facility and 2029 Term Loan Facility were amended to make such terms substantially similar to those in thecredit facility.
In addition, the terms of the credit facility contain customary affirmative and negative covenants that, amongother things, limit the Company's ability to make distributions or certain investments, incur debt, incur liens andenter into certain transactions. At December 31, 2019, the Company was in compliance with all such covenants.
2023 Term Loan Facility
On June 30, 2016, the Company entered into a credit agreement with a syndicated group of lenders to makeavailable a term loan facility that matures in June 2023 (the "2023 Term Loan Facility") in an aggregate amount of$100.0 million. On June 5, 2018, the Company's operating partnership and the Company entered into the SecondAmendment (the "Second Amendment") to the Credit Agreement, whereby the Company's operating partnership,among other things, partially exercised its existing $100.0 million expansion option in an aggregate amount equal to$75.0 million, increasing the aggregate amount outstanding under the 2023 Term Loan Facility to $175.0 million.The Company also increased the remaining expansion option by $200.0 million, for a total expansion option of$225.0 million. If the remaining expansion option is exercised in full, the total expansion option would provide for atotal borrowing capacity under the 2023 Term Loan Facility in an aggregate amount of $400.0 million.
The entire outstanding principal amount of, and all accrued but unpaid interest, is due on the maturity date.Interest rates applicable to loans under the 2023 Term Loan Facility are payable during such periods as such loansare LIBOR loans, at the applicable LIBOR based on a 1, 2, 3 or 6 month LIBOR period (as elected by the Companyat the beginning of any applicable interest period) plus an applicable margin, and during the period that such loansare base rate loans, at the base rate under the 2023 Term Loan Facility in effect from time to time plus an applicablemargin. The base rate under the 2023 Term Loan Facility is equal to the greatest of the Capital One prime rate, thefederal funds rate plus 0.50% or one month LIBOR plus 1.00%. The applicable margin for the 2023 Term LoanFacility is leverage-based and ranges from 1.30% to 1.70% for LIBOR loans and 0.30% to 0.70% for base rateloans; provided that after such time as the Company achieves an investment grade rating from at least two ratingagencies, the Company may elect (but is not required to elect) that the 2023 Term Loan Facility is subject to therating based on applicable margins ranging from 0.90% to 1.75% for LIBOR Loans and 0.00% to 0.75% for baserate loans.
Table of Contents
F-28

The Company is required to comply with the same financial covenants under the 2023 Term Loan Facility as itis with the credit facility. In addition, the terms of the 2023 Term Loan Facility contain customary affirmative andnegative covenants that, among other things, limit the Company's ability to make distributions or certaininvestments, incur debt, incur liens and enter into certain transactions.
2028 Term Loan Facility
On December 21, 2018, the Company entered into a credit agreement with Huntington National Bank to makeavailable a term loan facility that matures in December 2028 (the "2028 Term Loan Facility") in an aggregateamount of $75.0 million. The entire outstanding principal amount of, and all accrued but unpaid interest, is due onthe maturity date. The Company has an expansion option under the 2028 Term Loan Facility, which, if exercised infull, would provide for a total 2028 Term Loan Facility in an aggregate amount of $125.0 million.
Interest rates applicable to loans under the 2028 Term Loan Facility are payable during such periods as suchloans are LIBOR loans, at the applicable LIBOR based on a 1, 2, 3 or 6 month LIBOR period (as elected by theCompany at the beginning of any applicable interest period) plus an applicable margin, and during the period thatsuch loans are base rate loans, at the base rate under the 2028 Term Loan Facility in effect from time to time plus anapplicable margin. The base rate under the 2028 Term Loan Facility is equal to the greatest of the HuntingtonNational Bank prime rate, the federal funds rate plus 0.50% or one month LIBOR plus 1.00%. The applicablemargin for the 2028 Term Loan Facility is leverage-based and ranges from 1.80% to 2.35% for LIBOR loans and0.80% to 1.35% for base rate loans; provided that after such time as the Company achieves an investment graderating from at least two rating agencies, the Company may elect (but is not required to elect) that the 2028 TermLoan Facility is subject to the rating based on applicable margins ranging from 1.40% to 2.25% for LIBOR Loansand 0.40% to 1.25% for base rate loans.
The Company is required to comply with the same financial covenants under the 2028 Term Loan Facility as itis with the credit facility and the 2023 Term Loan Facility. In addition, the terms of the 2028 Term Loan Facilitycontain customary affirmative and negative covenants that, among other things, limit the Company's ability to makedistributions or certain investments, incur debt, incur liens and enter into certain transactions.
2029 Term Loan Facility
On April 24, 2019, the Company entered into a credit agreement with BMO Harris Bank N.A. to make availablean unsecured term loan facility that matures in April 2029 (the "2029 Term Loan Facility") in an aggregate amountof $100.0 million. The entire outstanding principal amount of, and all accrued but unpaid interest, is due on thematurity date.
Interest rates applicable to loans under the 2029 Term Loan Facility are payable during such periods as suchloans are LIBOR loans, at the applicable LIBOR based on a 1, 2, 3 or 6 month LIBOR period (as elected by theCompany at the beginning of any applicable interest period) plus an applicable margin, and during the period thatsuch loans are base rate loans, at the base rate under the 2029 Term Loan Facility in effect from time to time plus anapplicable margin. The base rate under the 2029 Term Loan Facility is equal to the greatest of the BMO Harris Bankprime rate, the federal funds rate plus 0.50% or one month LIBOR plus 1.00%. The applicable margin for the 2029Term Loan Facility is leverage-based and ranges from 1.85% to 2.30% for LIBOR loans and 0.85% to 1.30% forbase rate loans; provided that after such time as the Company achieves an investment grade rating from at least tworating agencies, the Company may elect (but is not required to elect) that the 2029 Term Loan Facility be subject torating-based margins ranging from 1.40% to 2.25% for LIBOR Loans and 0.40% to 1.25% for base rate loans.
On April 24, 2019, the Company also entered into an interest rate swap agreement with a notional amount of$100.0 million that matures in April 2029 fixing the interest rate of the 2029 Term Loan Facility at an effectiveinterest rate of 4.27%.
The Company is required to comply with the same financial covenants under the 2029 Term Loan Facility as itis with the credit facility, 2023 Term Loan Facility and the 2028 Term Loan Facility. In addition, the terms of the2029 Term Loan Facility contain customary affirmative and negative covenants that are consistent with thosecontained in the 2023 Term Loan Facility and 2028 Term Loan Facility, and, among other things, limit theCompany's ability to make distributions, make certain investments, incur debt, incur liens and enter into certaintransactions.
Table of Contents
F-29

2029 And 2031 Senior Unsecured Notes
On August 30, 2019, the operating partnership issued $100.0 million of 3.98% senior unsecured notes dueAugust 30, 2029 (the "2029 Senior Unsecured Notes") and $50.0 million of 4.08% senior unsecured notes dueAugust 30, 2031 (the "2031 Senior Unsecured Notes" and together with the 2029 Senior Unsecured Notes, the"Senior Unsecured Notes") in a private placement to certain institutional accredited investors. The Senior UnsecuredNotes are governed by a Note Purchase Agreement, dated July 30, 2019 (the "Note Purchase Agreement"), by andamong the operating partnership as issuer, the Company, and the purchasers of Senior Unsecured Notes.
Interest is payable semiannually, on August 30th and February 28th of each year, commencing on February 28,2020. The Senior Unsecured Notes are senior unsecured obligations of the Company and will be jointly andseverally guaranteed by certain of the Company's subsidiaries, as subsidiary guarantors, upon issuance. The SeniorUnsecured Notes rank pari passu with the credit facility, the 2023 Term Loan Facility, 2028 Term Loan Facility, andthe 2029 Term Loan Facility. The Note Purchase Agreement contains financial covenants that are substantiallysimilar to those described under the heading "Credit Facility" above. In addition, the terms of the Note PurchaseAgreement contain customary affirmative and negative covenants that, among other things, limit the Company'sability to make distributions or certain investments, incur debt, incur liens and enter into certain transactions.
Fixed Rate Mortgages Payable
Fixed rate mortgages have scheduled maturities at various dates through October 2031, and have effectiveinterest rates that range from 3.63% to 5.00%. Principal and interest are generally payable monthly or in monthlyinterest-only payments with balloon payments due at maturity.
The Company assumed fixed rate mortgages of $7.6 million in connection with four of the properties acquiredduring the year ended December 31, 2018.
Future Debt Maturities
Based on existing debt agreements in effect as of December 31, 2019, the scheduled principal and maturitypayments for the Company's outstanding borrowings are presented in the table below (in thousands):
Year Ending December 31,
Scheduled Principal and
Maturity Payments
Premium Amortization and Unamortized Debt
Issuance Costs Total2020 $ 40,647 $ (1,161) $ 39,4862021 7,603 (1,509) 6,0942022 4,205 (1,511) 2,6942023 377,049 (1,159) 375,8902024 271,964 (790) 271,174After 2025 837,792 917 838,709
$ 1,539,260 $ (5,213) $ 1,534,047
9. EQUITY-BASED AWARDS
The Company grants awards in the form of LTIP units and restricted common shares to provide equity basedincentive compensation to members of its senior management team, independent trustees, advisers, consultants,other personnel, and as consideration for self storage property acquisitions.
LTIP units were first granted under the 2013 Long-Term Incentive Plan (the "2013 Plan"), which authorized upto 2.5 million LTIP units for issuance. In connection with the Company's initial public offering, the Companyterminated the 2013 Plan but the awards granted thereunder remained outstanding after its termination. Restrictedcommon shares were first granted under the 2015 National Storage Affiliates Trust Equity Incentive Plan (the "2015Plan"), which authorizes the Company's compensation, nominating, and corporate governance committee to grantshare options, restricted common shares, phantom shares, dividend equivalent rights, LTIP units and other restrictedlimited partnership units issued by its operating partnership and other equity-based awards up to an aggregate of 5%of the common shares issued and outstanding from time to time on a fully diluted basis (assuming, if applicable, the
Table of Contents
F-30

exercise of all outstanding options and the conversion of all warrants and convertible securities, including OP unitsand LTIP units, into common shares).
As of December 31, 2019, the Company did not have outstanding under its equity compensation plan, anyoptions, warrants or rights to purchase the Company's common shares.
LTIP Units
Through December 31, 2019, an aggregate of 2,474,710 LTIP units have been issued under the 2013 Plan,776,997 LTIP units have been issued under the 2015 Plan, and 315,567 LTIP units have been issued under theLP Agreement. Some of the granted LTIP units vested immediately or upon completion of the Company's initialpublic offering. Others vest upon the contribution of self storage properties or along a schedule at certain timesthrough May 15, 2022.
Compensatory Grants
The Company grants two types of compensatory LTIP units, time-based LTIP unit awards that are subject totime-based vesting typically over a period of one to three years from the grant date, so long as such person remainsan employee or trustee, and performance-based LTIP unit awards, which are designed to align the interests of theCompany's executive officers with those of the Company's shareholders in a pay-for-performance structure. Theperformance-based LTIP unit awards vest contingent upon the achievement of performance criteria measured over aperiod of three years from the grant date, which is based on the Company's total shareholder return ("TSR") relativeto the TSR of the companies in the Morgan Stanley Capital International US REIT Index and the Company's TSRrelative to the TSR of its peers in the self storage industry. The value of the performance-based LTIP unit awardstake into consideration the probability that the awards will ultimately vest; therefore previously recordedcompensation expense is not adjusted in the event that the performance criteria is not achieved.
Compensation expense related to compensatory LTIP units granted to members of the Company's seniormanagement team, the Company's independent trustees, advisers, consultants and other personnel is included ingeneral and administrative expense in the accompanying statements of operations. Total compensation costrecognized for the compensatory LTIP unit awards was $4.2 million, $3.6 million and $3.5 million for the yearsended December 31, 2019, 2018 and 2017, respectively. At December 31, 2019, total unvested compensation costnot yet recognized was $3.7 million. The Company expects to recognize this compensation cost over a period ofapproximately 2.4 years.
Time-based LTIP unit awards are granted with a fair value equal to the closing market price of the Company's common shares on the date of grant. The following table summarizes activity for the time-based LTIP unit awards for the years ended December 31, 2019, 2018 and 2017:
Time-Based LTIP Unit Awards2019 2018 2017
Number of LTIP units
Weighted Average
Grant-Date Fair Value
Number of LTIP units
Weighted Average
Grant-Date Fair Value
Number of LTIP units
Weighted Average
Grant-Date Fair Value
Outstanding unvested at beginning of year 223,812 $ 23.54 227,766 $ 20.37 294,529 $ 14.74
Granted 101,167 27.80 100,176 27.08 128,051 22.89Vested (138,028) 22.59 (104,130) 20.18 (194,814) 13.43Forfeited (5,014) 26.25 — — — —Unvested at end of year 181,937 $ 26.55 223,812 $ 23.54 227,766 $ 20.37
The aggregate fair value of the time-based LTIP unit awards that vested during the years ended December 31,2019, 2018 and 2017 was $3.1 million, $2.1 million and $2.6 million, respectively.
The following table summarizes activity for the performance-based LTIP unit awards granted during the year ended December 31, 2019, 2018 and 2017, including the minimum, target and maximum number of LTIP units that may be earned upon the achievement of the performance criteria measured over the period of three years from the grant date.
Table of Contents
F-31

Performance-Based LTIP Unit Awards
Minimum Target Maximum
Weighted Average
Grant-Date Fair Value
Outstanding unvested at December 31, 2016 — — — $ —Granted — 40,390 90,874 27.63Outstanding unvested at December 31, 2017 — 40,390 90,874 $ 27.63Granted — 46,017 69,025 24.67Outstanding unvested at December 31, 2018 — 86,407 159,899 $ 26.35Granted — 53,128 106,252 29.76Outstanding unvested at December 31, 2019 — 139,535 266,151 $ 27.71
The fair value of the performance-based LTIP unit awards, which have a market condition, is estimated on the date of grant using a Monte Carlo simulation. The simulation requires assumptions for expected volatility, risk-free rate of return, and dividend yield. The following table summarizes the assumptions used to value the performance-based LTIP unit awards granted during the years ended December 31, 2019, 2018 and 2017:
2019 2018 2017Risk-free interest rate 2.51 % 2.04 % 1.58 %Dividend yield 4.54 % 4.11 % 4.35 %Expected volatility 25.40 % 24.44 % 29.96 %
Acquisition Consideration Grants
On December 31, 2013, the Company granted 1,683,560 LTIP units under the 2013 Plan to PROs as part of theconsideration for their respective self storage property acquisitions and contributions. The following table presentsthe number of units vested for acquisition grants during the years ended December 31, 2019, 2018 and 2017:
Total LTIP unitsTotal unvested units, December 31, 2016 260,400
Units vested in 2017 related to properties contributed or sourced by PROs (36,400)Total unvested units, December 31, 2017 224,000
Units vested in 2018 related to properties contributed or sourced by PROs —Total unvested units, December 31, 2018 224,000
Units vested in 2019 related to properties contributed or sourced by PROs —Total unvested units, December 31, 2019 224,000
The aggregate fair value of purchase consideration recognized during the years ended December 31,2017 was $0.9 million. As of December 31, 2019, the remaining unvested LTIP units will vest as additional selfstorage properties are contributed or sourced by the PROs. The fair value of such LTIP units will be recorded asadditional acquisition consideration based on the fair value in the period such acquisitions are completed.
Grants to Consultants
During the years ended December 31, 2019, 2018 and 2017, the Company issued 5,714, 174 and 776 LTIPunits, respectively, that were immediately vested to consultants that provided acquisition services. During the yearsended December 31, 2019, 2018 and 2017, the self storage properties acquired were accounted for as assetacquisitions and accordingly, the acquisition costs related to the LTIP units granted to consultants were capitalizedas part of the basis of the acquired properties. The aggregate fair value of the LTIP units was $0.2 million, less than$0.1 million and less than $0.1 million for the years ended December 31, 2019, 2018 and 2017, respectively.
Table of Contents
F-32

Restricted Common Shares
Through December 31, 2019, an aggregate of 72,354 restricted common shares have been issued under the 2015Plan. These restricted common shares vest over a weighted average period of approximately 3.0 years. Restrictedcommon shares are granted with a fair value equal to the closing market price of the Company's common shares onthe date of grant.
The following table summarizes activity for restricted common shares for the years ended December 31, 2019,2018 and 2017:
Year Ended December 31,2019 2018 2017
Number of Restricted Common
Shares
Weighted Average
Grant-Date Fair Value
Number of Restricted Common
Shares
Weighted Average
Grant-Date Fair Value
Number of Restricted Common
Shares
Weighted Average
Grant-Date Fair Value
Outstanding at beginning of year 22,589 $ 24.83 21,585 $ 22.43 13,590 $ 12.40
Granted 18,218 26.46 12,311 27.26 16,525 24.04Vested (10,734) 23.54 (8,041) 21.88 (8,530) 14.11Forfeited (4,294) 25.61 (3,266) 25.35 — —Unvested at end of year 25,779 $ 26.26 22,589 $ 24.83 21,585 $ 22.43
The aggregate fair value of restricted common shares that vested during the years ended December 31, 2019,2018 and 2017 was $0.3 million, $0.2 million and $0.1 million respectively. Total compensation cost recognized forrestricted common shares during the years ended December 31, 2019, 2018 and 2017 was $0.3 million, $0.3 millionand $0.2 million, respectively. At December 31, 2019, total unvested compensation cost not yet recognized was $0.4million. The Company expects to recognize this compensation cost over a period of approximately 2.0 years. If thegrantee has a termination of service for any reason during the vesting period, the unvested restricted common shareswill be forfeited. Compensation expense related to restricted common shares is included in general andadministrative expense in the accompanying statements of operations.
Table of Contents
F-33

10. EARNINGS PER SHARE
The following table sets forth the computation of basic and diluted earnings (loss) per common share for theyears ended December 31, 2019, 2018 and 2017 (in thousands, except per share amounts):
Year Ended December 31,2019 2018 2017
Earnings (loss) per common share - basic and dilutedNumeratorNet income $ 66,013 $ 56,326 $ 45,998Net income attributable to noncontrolling interests (62,030) (42,217) (43,037)
Net income attributable to National Storage Affiliates Trust 3,983 14,109 2,961Distributions to preferred shareholders (12,390) (10,350) (2,300)Distributed and undistributed earnings allocated to participating
securities (35) (27) (28)Net (loss) income attributable to common shareholders -
basic and diluted $ (8,442) $ 3,732 $ 633
DenominatorWeighted average shares outstanding - basic and diluted 58,208 53,293 44,423
Earnings (loss) per share - basic and diluted $ (0.15) $ 0.07 $ 0.01Dividends declared per common share $ 1.27 $ 1.16 $ 1.04
As discussed in Note 2, the Company allocates GAAP income (loss) utilizing the HLBV method, in which theCompany allocates income or loss based on the change in each unitholders' claim on the net assets of its operatingpartnership at period end after adjusting for any distributions or contributions made during such period. Due to thestated liquidation priorities and because the HLBV method incorporates non-cash items such as depreciationexpense, in any given period, income or loss may be allocated disproportionately to National Storage Affiliates Trustand noncontrolling interests, resulting in volatile fluctuations of basic and diluted earnings (loss) per share.
Outstanding equity interests of the Company's operating partnership and DownREIT partnerships areconsidered potential common shares for purposes of calculating diluted earnings (loss) per share as the unitholdersmay, through the exercise of redemption rights, obtain common shares, subject to various restrictions. Basicearnings per share is calculated based on the weighted average number of common shares outstanding during theperiod. Diluted earnings per share is calculated by further adjusting for the dilutive impact using the treasury stockmethod for unvested LTIP units subject to a service condition outstanding during the period and the if-convertedmethod for any convertible securities outstanding during the period.
Generally, following certain lock-out periods, OP units in the Company's operating partnership are redeemablefor cash or, at the Company's option, exchangeable for common shares on a one-for-one basis, subject to certainadjustments and DownREIT OP units are redeemable for cash or, at the Company's option, exchangeable for OPunits in its operating partnership on a one-for-one basis, subject to certain adjustments in each case.
LTIP units may also, under certain circumstances, be convertible into OP units on a one-for-one basis, whichare then exchangeable for common shares as described above. Vested LTIP units and unvested LTIP units that vestbased on a service condition are allocated income or loss in a similar manner as OP units. Unvested LTIP unitssubject to a service condition are evaluated for dilution using the treasury stock method. For the year endedDecember 31, 2019, 448,089 unvested LTIP units that vest based on a service condition are excluded from thecalculation of diluted earnings (loss) per share as they are not dilutive to earnings (loss) per share. For the yearended December 31, 2019, 224,000 unvested LTIP units that vest upon the future acquisition of properties areexcluded from the calculation of diluted earnings (loss) per share because the contingency for the units to vest hasnot been attained as of the end of the reported period.
Subordinated performance units may also, under certain circumstances, be convertible into OP units which areexchangeable for common shares as described above, and DownREIT subordinated performance units may, under
Table of Contents
F-34

certain circumstances, be exchangeable for subordinated performance units on a one-for-one basis. Subordinatedperformance units are only convertible into OP units, after a two year lock-out period and then generally (i) at theholder’s election only upon the achievement of certain performance thresholds relating to the properties to whichsuch subordinated performance units relate or (ii) at the Company's election upon a retirement event of a PRO thatholds such subordinated performance units or upon certain qualifying terminations. Although subordinatedperformance units may only be convertible after a two year lock-out period, the Company assumes a hypotheticalconversion of each subordinated performance unit (including each DownREIT subordinated performance unit) intoOP units (with subsequently assumed redemption into common shares) for the purposes of calculating dilutedweighted average common shares. This hypothetical conversion is calculated using historical financial information,and as a result, is not necessarily indicative of the results of operations, cash flows or financial position of theCompany upon expiration of the two-year lock out period on conversions.
For the years ended December 31, 2019, 2018 and 2017, potential common shares totaling 54.2 million, 50.6million and 50.6 million, respectively, related to OP units, DownREIT OP units, subordinated performance units,DownREIT subordinated performance units and vested LTIP units have been excluded from the calculation ofdiluted earnings (loss) per share as they are not dilutive to earnings (loss) per share.
Participating securities, which consist of unvested restricted common shares, receive dividends equal to thosereceived by common shares. The effect of participating securities for the periods presented above is calculated usingthe two-class method of allocating distributed and undistributed earnings.
11. RELATED PARTY TRANSACTIONS
Supervisory and Administrative Fees
For the self storage properties that are managed by the PROs, the Company has entered into asset managementagreements with the PROs to provide leasing, operating, supervisory and administrative services. The assetmanagement agreements generally provide for fees ranging from 5% to 6% of gross revenue for the managed selfstorage properties. During the years ended December 31, 2019, 2018 and 2017, the Company incurred $20.0 million,$16.9 million and $14.4 million, respectively, for supervisory and administrative fees to the PROs. Such fees areincluded in general and administrative expenses in the accompanying statements of operations.
Payroll Services
For the self storage properties that are managed by the PROs, the employees responsible for operation of theself storage properties are generally employees of the PROs who charge the Company for the costs associated withthe respective employees. For the years ended December 31, 2019, 2018 and 2017, the Company incurred $32.0million, $29.5 million and $24.6 million, respectively, for payroll and related costs reimbursable to these PROs.Such costs are included in property operating expenses in the accompanying statements of operations.
Due Diligence Costs
During the years ended December 31, 2019, 2018 and 2017, the Company incurred $0.7 million, $0.4 millionand $0.7 million, respectively, of expenses payable to certain PROs related to self storage property acquisitionssourced by the PROs. These expenses, which are based on the volume of transactions sourced by the PROs, areintended to reimburse the PROs for due diligence costs incurred in the sourcing and underwriting process. For theyears ended December 31, 2019, 2018 and 2017 these due diligence costs are capitalized as part of the basis of theacquired self storage properties.
Notes Receivable
In connection with the acquisition of 16 self storage properties from PROs during the year ended December 31,2014, the Company assumed certain mortgages that provided for interest at above-market rates. The sellers of theself storage properties agreed to reimburse the Company for the difference between the fair value and the contractualvalue of the assumed mortgages which amounted to $5.2 million. Due to the structure of the transaction, the amountowed to the Company was considered a receivable for the issuance of equity and was recorded as an offset againstequity. During the years ended December 31, 2019 and 2018, the Company received above-market interestreimbursements from the sellers totaling $1.3 million and $1.2 million, respectively.
In addition, in exchange for $1.3 million and $1.2 million of principal payment reimbursements received relatedto these assumed mortgages during the years ended December 31, 2019 and 2018, the Company issued 37,770common shares and 44,502 OP units to the sellers during the year ended December 31, 2019 and 2018, respectively.
Table of Contents
F-35

Self Storage Property Acquisitions
During the year ended December 31, 2019, the Company issued 11,100 subordinated performance units to anaffiliate of Personal Mini (the Company's executive chairman and former chief executive officer, Arlen D.Nordhagen, has a noncontrolling minority ownership interest in this affiliate of Personal Mini), for $0.4 million ofco-investment related to the acquisition of a self storage property from an unrelated third party.
During the year ended December 31, 2019, the Company acquired one self storage property from the 2016 JointVenture for $4.1 million.
Acquisition of Interest in Reinsurance Company and Related Cash Flows
On June 1, 2019, the Company, as acquiror, and Ground Up Development LLC ("Ground Up"), an affiliate ofSecurCare and of the Company's executive chairman and former chief executive officer, Arlen D. Nordhagen,entered into a Contribution and Purchase Agreement (the "Ground Up Contribution Agreement") whereby theCompany acquired Ground Up’s ownership interest (approximately 5.5%) in SBOA TI Reinsurance Ltd. (the"Reinsurance Company"), a Cayman Islands exempted company. The Reinsurance Company provides reinsurancefor a self storage tenant insurance program issued by a licensed insurance company, whereby tenants of theCompany's self storage facilities and tenants of other operators participating in the program can purchase insuranceto cover damage or destruction to their personal property while stored at such facilities. The Company will now beentitled to receive its share of distributions of any profits generated by the Reinsurance Company, depending onactual losses incurred by the program. As part of the transaction, the Company also acquired the rights to the accessfees previously earned by Ground Up associated with the tenant insurance-related arrangements. For the Company'sproperties managed by SecurCare, in addition to the tenant insurance revenues the Company received directly fromthe program insurer, the Company also receives these additional access fees.
The consideration paid for the interest in the Reinsurance Company was $15.1 million, which consisted of $6.6million of cash and 285,512 OP units totaling $8.5 million. Of the total consideration transferred, Arlen D.Nordhagen received $2.2 million of cash and 95,170 OP Units totaling approximately $2.8 million. The Ground UpContribution Agreement contains customary representations, warranties, covenants and agreements of the Companyand Ground Up.
The Company allocated the total purchase price to the estimated fair value of the assets acquired, consisting of$0.5 million of equity interest in the Reinsurance Company and $14.6 million as an intangible related to the acquiredaccess fees and rights to control the tenant insurance-related arrangements. These assets are reported in other assets,net in the Company's consolidated balance sheets. The intangible asset is amortized on a straight-line basis over 25years, which approximates the weighted average remaining useful life of the SecurCare-managed properties, and isrecorded in depreciation and amortization expense in the Company's consolidated statements of operations.
12. COMMITMENTS AND CONTINGENCIES
Legal Proceedings
The Company is subject to litigation, claims, and assessments that may arise in the ordinary course of itsbusiness activities. Such matters include contractual matters, employment related issues, and regulatory proceedings.Although occasional adverse decisions or settlements may occur, the Company believes that the final disposition ofsuch matters will not have a material adverse effect on the Company's financial position, results of operations, orliquidity.
13. LEASES
The Company determines if a contractual arrangement is a lease at inception. As a lessee, the Company hasnon-cancelable lease agreements for real estate and its corporate office space that are classified as operating leases.The Company's operating leases are included in operating lease right-of-use ("ROU") assets and operating leaseliabilities in its consolidated balance sheets. Operating lease ROU assets and liabilities are recognized atcommencement date based on the present value of lease payments over the lease term. As the Company's operatingleases do not provide an implicit rate, the Company used its incremental borrowing rate based on the informationavailable at commencement date in determining the discount rate for the present value of the lease payments. To theextent that the lease agreements provide for fixed increases throughout the term of the lease, the Companyrecognizes lease expense on a straight-line basis over the expected lease terms.
Table of Contents
F-36

Real Estate Leasehold Interests
The Company has eight properties that are subject to non-cancelable leasehold interest agreements withremaining lease terms ranging from 15 to 73 years, inclusive of extension options that the Company anticipatesexercising. Rent expense under these leasehold interest agreements is included in property operating expenses in theaccompanying consolidated statements of operations and amounted to $1.6 million, $1.6 million and $1.2 million forthe years ended December 31, 2019, 2018 and 2017, respectively.
Office Leases
The Company has entered into non-cancelable lease agreements for its corporate office space with remaininglease terms ranging from three to seven years. Rent expense related to these office leases is included in general andadministrative expenses in the accompanying consolidated statements of operations and amounted to $0.3 million,$0.2 million and $0.2 million for the years ended December 31, 2019, 2018 and 2017, respectively.
The weighted-average remaining lease term and the weighted-average discount rate for the Company'soperating leases as of December 31, 2019 are as follows:
December 31, 2019Weighted-average remaining lease term
Real estate leasehold interests 29 yearsOffice leases 7 years
Weighted-average remaining discount rateReal estate leasehold interests 4.9 %Office leases 4.1 %
As of December 31, 2019, the future minimum lease payments under the Company's operating leases, for whichthe Company is a lessee, are as follows (in thousands):
Year Ending December 31,Real Estate
Leasehold Interests Office Leases Total2020 $ 1,419 $ 286 $ 1,7052021 1,444 387 1,8312022 1,459 381 1,8402023 1,464 346 1,8102024 1,470 353 1,8232025 through 2092 36,728 691 37,419
Total lease payments $ 43,984 $ 2,444 $ 46,428Less imputed interest (21,440) (323) (21,763)
Total $ 22,544 $ 2,121 $ 24,665
As of December 31, 2018, the future minimum lease payments under the Company's operating leases, for whichthe Company is a lessee, are as follows (in thousands):
Year Ending December 31,Real Estate
Leasehold Interests Office Leases Total2019 $ 1,334 $ 345 $ 1,6792020 1,379 398 1,7772021 1,404 387 1,7912022 1,419 381 1,8002023 1,424 346 1,7702024 through 2092 36,074 1,073 37,147
Total lease payments $ 43,034 $ 2,930 $ 45,964
Table of Contents
F-37

14. FAIR VALUE MEASUREMENTS
Recurring Fair Value Measurements
The Company sometimes limits its exposure to interest rate fluctuations by entering into interest rate swapagreements. The interest rate swap agreements moderate the Company's exposure to interest rate risk by effectivelyconverting the interest on variable rate debt to a fixed rate. The Company measures its interest rate swap derivativesat fair value on a recurring basis. The effective portion of changes in the fair value of derivatives designated and thatqualify as cash flow hedges are recorded in accumulated other comprehensive income (loss) and are subsequentlyreclassified into earnings in the period that the hedged transaction affects earnings. The ineffective portion of thechange in fair value of the derivatives is recognized directly into earnings.
Information regarding the Company's interest rate swaps measured at fair value, which are classified withinLevel 2 of the GAAP fair value hierarchy, is presented below (dollars in thousands):
Interest Rate Swaps Designated as Cash
Flow HedgesFair value at December 31, 2017 $ 12,414Gains on interest rate swaps reclassified into interest expense from accumulated other
comprehensive income (1,817)Unrealized gains on interest rate swaps included in accumulated other comprehensive
income 3,598Fair value at December 31, 2018 $ 14,195Gains on interest rate swaps reclassified into interest expense from accumulated other
comprehensive income (3,337)Unrealized losses on interest rate swaps included in accumulated other comprehensive
income (29,941)Fair value at December 31, 2019 $ (19,083)
As of December 31, 2019 and 2018, the Company had outstanding interest rate swaps designated as cash flowhedges with aggregate notional amounts of $1,125.0 million and $795.0 million, respectively. As of December 31,2019, the Company's swaps had a weighted average remaining term of 4.3 years. The fair value of these swaps arepresented within other assets and accounts payable and accrued liabilities in the accompanying balance sheets, andthe Company recognizes any changes in the fair value as an adjustment of accumulated other comprehensive income(loss) within equity to the extent of their effectiveness. If the forward rates at December 31, 2019 remain constant,the Company estimates that during the next 12 months, the Company would reclassify into earnings approximately$3.2 million of the unrealized losses included in accumulated other comprehensive income (loss). If market interestrates increase above the 1.90% weighted average fixed rate under these interest rate swaps the Company will benefitfrom net cash payments due to it from its counterparty to the interest rate swaps.
There were no transfers between levels during the years ended December 31, 2019 and 2018. For financialassets and liabilities that utilize Level 2 inputs, the Company utilizes both direct and indirect observable pricequotes, including LIBOR yield curves. The Company uses valuation techniques for Level 2 financial assets andliabilities which include LIBOR yield curves at the reporting date as well as assessing counterparty credit risk.Counterparties to these contracts are highly rated financial institutions. Although the Company has determined thatthe majority of the inputs used to value its derivatives fall within Level 2 of the fair value hierarchy, the creditvaluation adjustments associated with the Company's derivatives utilize Level 3 inputs, such as estimates of currentcredit spreads, to evaluate the likelihood of default by the Company and the counterparties. As of December 31,2019 and 2018, the Company determined that the effect of credit valuation adjustments on the overall valuation ofits derivative positions are not significant to the overall valuation of its derivatives. Therefore, the Company hasdetermined that its derivative valuations are appropriately classified in Level 2 of the fair value hierarchy.
Table of Contents
F-38

Fair Value Disclosures
The carrying values of cash and cash equivalents, restricted cash, trade receivables, accounts payable andaccrued liabilities and equity securities reflected in the balance sheets at December 31, 2019 and 2018, approximatefair value due to the short term nature of these financial assets and liabilities. The carrying value of variable rate debtfinancing reflected in the balance sheets at December 31, 2019 and 2018 approximates fair value as the changes intheir associated interest rates reflect the current market and credit risk is similar to when the loans were originallyobtained.
The fair values of fixed rate mortgages were estimated using the discounted estimated future cash payments tobe made on such debt; the discount rates used approximated current market rates for loans, or groups of loans, withsimilar maturities and credit quality (categorized within Level 2 of the fair value hierarchy). The combined principalbalance of the Company's fixed rate mortgages payable was approximately $264.3 million as of December 31, 2019with a fair value of approximately $280.9 million. In determining the fair value, the Company estimated a weightedaverage market interest rate of approximately 3.28%, compared to the weighted average contractual interest rate of4.81%. The combined principal balance of the Company's fixed rate mortgages was approximately $268.1 million asof December 31, 2018 with a fair value of approximately $276.5 million. In determining the fair value as ofDecember 31, 2018, the Company estimated a weighted average market interest rate of approximately 4.17%,compared to the weighted average contractual interest rate of 4.85%.
15. UNAUDITED SELECTED QUARTERLY FINANCIAL DATA
The following is a summary of quarterly financial information for the years ended December 31, 2019 and 2018(in thousands, except per share data):
For the three months endedMarch 31, June 30, September 30, December 31,
2019 2019 2019 2019Total revenues $ 90,572 $ 95,419 $ 101,337 $ 100,568Total operating expenses 61,572 64,189 68,625 66,661Gain on sale of self storage properties — 2,814 — —Net income 12,940 17,733 16,514 18,826Net income (loss) attributable to
common shareholders $ 4,823 $ (10,913) $ (12,132) $ 9,815Earnings (loss) per share - basic $ 0.08 $ (0.19) $ (0.20) $ 0.17Earnings (loss) per share - diluted $ 0.08 $ (0.19) $ (0.20) $ 0.13
For the three months endedMarch 31, June 30, September 30, December 31,
2018 2018 2018 2018Total revenues $ 76,493 $ 79,723 $ 85,382 $ 89,298Total operating expenses 54,900 56,033 57,869 60,440Gain (loss) on sale of self storage
properties 474 (83) — —Net income 11,973 13,041 16,829 14,483Net income (loss) attributable to
common shareholders $ 7,872 $ 3,304 $ 1,806 $ (9,223)Earnings (loss) per share - basic $ 0.16 $ 0.07 $ 0.03 $ (0.16)Earnings (loss) per share - diluted $ 0.09 $ 0.07 $ 0.03 $ (0.16)
Table of Contents
F-39

16. SUBSEQUENT EVENTS
Internalization and Acquisition of PRO
On February 24, 2020, the Company entered into a definitive agreement with SecurCare, and, among others,Arlen Nordhagen, the Company's executive chairman and former chief executive officer, who owns approximately53% of SecurCare's outstanding shares, to merge SecurCare into a wholly owned subsidiary of the Company. On thesame day, the Company entered into a definitive agreement with DLAN Corporation ("DLAN") to merge DLANinto another wholly owned subsidiary of the Company. DLAN is an entity controlled by Mr. Nordhagen that wasformed solely to hold OP units and DownREIT OP units, and it is owned by Mr. Nordhagen's spouse, WendyNordhagen, and David Lamb, who is a key person of another existing PRO of the Company.
As a result of the SecurCare merger, SecurCare's property management platform and related intellectualproperty will be internalized by the Company, and the Company will no longer pay any supervisory andadministrative fees or reimbursements to SecurCare. In addition, distributions on the series of subordinatedperformance units related to SecurCare's managed portfolio (the "Series SC subordinated performance units") willbe discontinued.
As part of the internalization, most of SecurCare's employees and other key persons will be offered employmentby the Company and will continue managing SecurCare's portfolio of properties under the brand SecurCare asmembers of the Company's existing property management platform. Under the terms of the Company's facilitiesportfolio management agreement with SecurCare, in connection with a retirement event leading to the internalizationof SecurCare's property management platform, SecurCare is entitled to receive OP units in exchange for its propertymanagement platform and related intellectual property based on a contractual formula. The Company hasdetermined that SecurCare would be entitled to receive 384,020 OP units as part of the internalization transaction.The Company expects that the acquisition of SecurCare's property management platform and related intellectualproperty will be accounted for as a business combination, whereby the Company will allocate the total purchaseprice to the estimated fair value of tangible and intangible assets acquired, and liabilities assumed.
Immediately prior to the completion of the mergers, giving effect to the OP units that SecurCare owns or wouldbe entitled to receive as part of the internalization and the conversion of 2,015,808 of the Series SC subordinatedperformance units into 6,769,083 OP units in connection with a retirement event leading to the internalization ofSecurCare's property management platform, SecurCare and DLAN will own, or have the right to receive, anaggregate of 8,187,052 OP units. While OP units are economically equivalent to and exchangeable for commonshares on a one-to-one basis, in the SecurCare and DLAN mergers, the Company expects to issue 8,105,192common shares to the owners of SecurCare and DLAN, which represents a 1% discount to the number OP units thateach of SecurCare and DLAN will own or be entitled to receive as set forth above immediately prior to the mergers.Of the total number of common shares expected to be issued to the owners of SecurCare, approximately 4.1 millioncommon shares are expected to be issued to Mr. Nordhagen.
Although the Company currently expects to complete the transactions described above during the secondquarter of 2020, they are subject to customary closing conditions, and there is no assurance that the transactions willbe consummated at all or at the time or pursuant to the terms currently contemplated.
Self Storage Property Acquisitions
In January and February 2020, the Company acquired 34 self storage properties for approximately $205.8million. Consideration for these acquisitions included approximately $200.6 million of net cash, the assumption of$0.9 million of other working capital liabilities and OP equity of approximately $4.3 million (consisting of theissuance of 73,329 OP Units, 28,894 LTIP units and 13,105 subordinated performance units). In connection withthese acquisitions, the Company reimbursed the PROs for $0.2 million of due diligence costs related to the selfstorage properties sourced by the PROs.
In February 2020, the 2016 Joint Venture acquired two self storage properties for approximately $12.1 million.The 2016 Joint Venture financed the acquisitions with capital contributions from the 2016 Joint Venture members,of which the Company contributed $3.0 million.
Subordinated Performance Unit To OP Unit Conversions
Subordinated performance units are convertible into OP units after a two year lock-out period and thengenerally (i) at the holder’s election only upon the achievement of certain performance thresholds relating to the
Table of Contents
F-40

properties to which such subordinated performance units relate (a "voluntary conversion") or (ii) at the Company'selection upon a retirement event of a PRO that holds such subordinated performance units or upon certain qualifyingterminations.
Following such lock-out period, a holder of subordinated performance units in the Company's operatingpartnership may elect a voluntary conversion one time each year prior to December 1st to convert a pre-determinedportion of such subordinated performance units into OP units in the Company's operating partnership, with suchconversion effective January 1st of the following year with each subordinated performance unit being converted intothe number of OP units determined by dividing the average cash available for distribution, or CAD, per unit on theseries of specific subordinated performance units over the one-year period prior to conversion by 110% of the CADper unit on the OP units determined over the same period. CAD per unit on the series of specific subordinatedperformance units and OP units is determined by the Company based generally upon the application of theprovisions of the operating partnership agreement applicable to the distributions of operating cash flow and capitaltransactions proceeds.
During the year ended December 31, 2019, the Company received notices requesting the conversion of 332,738subordinated performance units. Effective January 1, 2020, the Company issued 445,701 OP units in satisfaction ofsuch conversion requests.
Table of Contents
F-41

Location Initial Cost to Company Gross Carrying Amount at Year-End
MSA(1)State/
Territory LandBuildings andImprovements
SubsequentAdditions Land
Buildings andImprovements Total(2)
AccumulatedDepreciation
DateAcquired
Mobile AL $ 991 $ 4,874 $ 753 $ 991 $ 5,627 $ 6,618 $ 1,196 4/12/2016Lake Havasu City-Kingman AZ 671 1,572 53 671 1,625 2,296 486 4/1/2014Lake Havasu City-Kingman AZ 722 2,546 66 722 2,612 3,334 845 7/1/2014Phoenix-Mesa-Scottsdale AZ 1,089 6,607 89 1,089 6,696 7,785 1,657 6/30/2014Phoenix-Mesa-Scottsdale AZ 3,813 7,831 91 3,813 7,922 11,735 1,493 9/30/2014Phoenix-Mesa-Scottsdale AZ 1,375 2,613 94 1,375 2,707 4,082 906 9/30/2014Phoenix-Mesa-Scottsdale AZ 1,653 7,531 47 1,653 7,578 9,231 1,240 10/1/2014Phoenix-Mesa-Scottsdale AZ 1,661 3,311 75 1,661 3,386 5,047 703 10/1/2014Phoenix-Mesa-Scottsdale AZ 1,050 5,359 49 1,050 5,408 6,458 697 1/1/2015Phoenix-Mesa-Scottsdale AZ 1,198 1,921 49 1,198 1,970 3,168 433 5/1/2015Phoenix-Mesa-Scottsdale AZ 1,324 3,626 64 1,324 3,690 5,014 668 5/1/2015Phoenix-Mesa-Scottsdale AZ 3,816 4,348 38 3,816 4,386 8,202 767 5/1/2015Phoenix-Mesa-Scottsdale AZ 5,576 6,746 283 5,576 7,029 12,605 1,343 5/19/2016Phoenix-Mesa-Scottsdale AZ 1,506 2,881 226 1,609 3,107 4,716 421 7/29/2016Phoenix-Mesa-Scottsdale AZ 2,120 5,442 26 2,120 5,468 7,588 534 2/13/2017Phoenix-Mesa-Scottsdale AZ 1,809 4,787 53 1,809 4,840 6,649 397 1/4/2018Phoenix-Mesa-Scottsdale AZ 840 5,274 18 840 5,292 6,132 422 1/4/2018Phoenix-Mesa-Scottsdale AZ 2,111 7,963 37 2,111 8,000 10,111 586 1/4/2018Phoenix-Mesa-Scottsdale AZ 748 4,027 204 748 4,231 4,979 367 1/11/2018Phoenix-Mesa-Scottsdale AZ 676 4,098 81 676 4,179 4,855 318 1/11/2018Phoenix-Mesa-Scottsdale AZ 1,011 3,453 65 1,011 3,518 4,529 263 1/11/2018Phoenix-Mesa-Scottsdale AZ 1,125 3,554 78 1,125 3,632 4,757 317 1/11/2018Phoenix-Mesa-Scottsdale AZ 949 7,351 59 949 7,410 8,359 472 1/11/2018Phoenix-Mesa-Scottsdale AZ 1,419 5,504 71 1,419 5,575 6,994 421 1/11/2018Phoenix-Mesa-Scottsdale AZ 1,117 5,918 224 1,117 6,142 7,259 383 2/1/2018Phoenix-Mesa-Scottsdale AZ 1,231 5,107 9 1,231 5,116 6,347 186 1/1/2019Phoenix-Mesa-Scottsdale AZ 806 4,041 179 806 4,220 5,026 79 6/19/2019Tucson AZ 421 3,855 116 421 3,971 4,392 709 8/29/2013Tucson AZ 716 1,365 26 716 1,391 2,107 460 8/29/2013Tucson AZ 358 2,047 499 358 2,546 2,904 223 1/4/2018Tucson AZ 439 2,501 54 439 2,555 2,994 216 1/4/2018Tucson AZ 606 2,580 419 606 2,999 3,605 274 1/4/2018Bakersfield CA 511 2,804 207 511 3,011 3,522 469 8/1/2016Bakersfield CA 1,409 3,907 203 1,228 4,110 5,338 572 8/1/2016
Table of ContentsNATIONAL STORAGE AFFILIATES TRUST
SCHEDULE III-REAL ESTATE AND ACCUMULATED DEPRECIATIONDecember 31, 2019
(dollars in thousands)
F-42

Location Initial Cost to Company Gross Carrying Amount at Year-End
MSA(1)State/
Territory LandBuildings andImprovements
SubsequentAdditions Land
Buildings andImprovements Total(2)
AccumulatedDepreciation
DateAcquired
Bakersfield CA 1,882 3,858 112 1,882 3,970 5,852 643 8/1/2016Bakersfield CA 1,355 4,678 314 1,355 4,992 6,347 740 8/1/2016Bakersfield CA 1,306 3,440 133 1,306 3,573 4,879 704 8/1/2016Bakersfield CA 1,016 3,638 127 1,016 3,765 4,781 495 8/1/2016Bakersfield CA 1,579 3,357 121 1,579 3,478 5,057 577 8/1/2016Bakersfield CA 750 5,802 128 750 5,930 6,680 820 8/1/2016Fresno CA 840 7,502 460 840 7,962 8,802 1,495 8/1/2016Los Angeles-Long Beach-Anaheim CA 1,530 5,799 313 1,530 6,112 7,642 619 8/1/2016Los Angeles-Long Beach-Anaheim CA 2,345 6,820 684 2,345 7,504 9,849 772 8/1/2016Los Angeles-Long Beach-Anaheim CA 1,350 11,266 169 1,350 11,435 12,785 1,321 8/1/2016Los Angeles-Long Beach-Anaheim CA 763 6,258 231 763 6,489 7,252 763 8/1/2016Los Angeles-Long Beach-Anaheim CA 6,641 8,239 79 6,641 8,318 14,959 1,503 4/1/2014Los Angeles-Long Beach-Anaheim CA 1,122 1,881 36 1,122 1,917 3,039 468 6/30/2014Los Angeles-Long Beach-Anaheim(3) CA 14,109 23,112 305 14,109 23,417 37,526 5,156 9/17/2014Los Angeles-Long Beach-Anaheim(3) CA 7,186 12,771 278 7,186 13,049 20,235 2,782 9/17/2014Los Angeles-Long Beach-Anaheim(3)(4) CA — 7,106 62 — 7,168 7,168 1,485 9/17/2014Los Angeles-Long Beach-Anaheim(3) CA 2,366 4,892 130 2,366 5,022 7,388 1,122 9/17/2014Los Angeles-Long Beach-Anaheim(3) CA 2,871 3,703 49 2,871 3,752 6,623 718 10/7/2014Los Angeles-Long Beach-Anaheim(3) CA 5,448 10,015 237 5,448 10,252 15,700 2,309 10/7/2014Los Angeles-Long Beach-Anaheim(4) CA — 13,150 55 — 13,205 13,205 2,219 1/1/2015Los Angeles-Long Beach-Anaheim(4) CA — 10,084 124 — 10,208 10,208 668 10/3/2017Modesto CA 1,526 12,032 67 1,526 12,099 13,625 1,509 11/10/2016Modesto CA 773 5,655 19 773 5,674 6,447 592 11/10/2016Nonmetropolitan Area CA 425 7,249 22 425 7,271 7,696 822 11/10/2016Riverside-San Bernardino-Ontario CA 1,842 3,420 55 1,842 3,475 5,317 603 1/1/2015Riverside-San Bernardino-Ontario CA 1,981 3,323 75 1,981 3,398 5,379 735 1/1/2015Riverside-San Bernardino-Ontario(3) CA 3,418 9,907 203 3,418 10,110 13,528 1,629 8/5/2015Riverside-San Bernardino-Ontario(3) CA 1,913 6,072 22 1,913 6,094 8,007 1,105 8/5/2015Riverside-San Bernardino-Ontario(3) CA 772 4,044 98 772 4,142 4,914 918 8/5/2015Riverside-San Bernardino-Ontario(3) CA 597 5,464 80 597 5,544 6,141 897 8/5/2015Riverside-San Bernardino-Ontario(3) CA 3,022 8,124 95 3,022 8,219 11,241 1,517 8/5/2015Riverside-San Bernardino-Ontario(3) CA 2,897 5,725 671 2,467 6,396 8,863 1,483 8/5/2015Riverside-San Bernardino-Ontario(3) CA 2,835 5,589 858 2,164 6,447 8,611 1,357 8/5/2015Riverside-San Bernardino-Ontario(3) CA 2,484 5,903 83 2,484 5,986 8,470 879 8/5/2015Riverside-San Bernardino-Ontario(3) CA 1,139 5,054 36 1,139 5,090 6,229 880 10/1/2015
Table of Contents
F-43

Location Initial Cost to Company Gross Carrying Amount at Year-End
MSA(1)State/
Territory LandBuildings andImprovements
SubsequentAdditions Land
Buildings andImprovements Total(2)
AccumulatedDepreciation
DateAcquired
Riverside-San Bernardino-Ontario(3) CA 1,401 4,577 30 1,401 4,607 6,008 619 10/1/2015Riverside-San Bernardino-Ontario(3) CA 925 3,459 52 925 3,511 4,436 627 10/1/2015Riverside-San Bernardino-Ontario(3) CA 1,174 2,556 107 1,174 2,663 3,837 559 10/1/2015Riverside-San Bernardino-Ontario(3) CA 1,506 2,913 47 1,506 2,960 4,466 495 10/1/2015Riverside-San Bernardino-Ontario(3) CA 631 2,307 63 631 2,370 3,001 537 10/1/2015Riverside-San Bernardino-Ontario(3) CA 1,318 2,394 56 1,318 2,450 3,768 528 10/1/2015Riverside-San Bernardino-Ontario(3) CA 1,942 2,647 37 1,942 2,684 4,626 681 10/1/2015Riverside-San Bernardino-Ontario(3) CA 1,339 2,830 55 1,339 2,885 4,224 564 10/1/2015Riverside-San Bernardino-Ontario(3) CA 1,105 2,672 59 1,105 2,731 3,836 640 10/1/2015Riverside-San Bernardino-Ontario(3) CA 1,542 2,127 44 1,542 2,171 3,713 506 10/1/2015Riverside-San Bernardino-Ontario(3) CA 1,478 4,534 45 1,478 4,579 6,057 632 10/1/2015Riverside-San Bernardino-Ontario CA 3,245 4,420 1,457 3,245 5,877 9,122 1,289 5/16/2016Riverside-San Bernardino-Ontario CA 670 8,613 450 670 9,063 9,733 1,063 8/1/2016Riverside-San Bernardino-Ontario CA 538 3,921 384 538 4,305 4,843 540 8/1/2016Riverside-San Bernardino-Ontario CA 382 3,442 338 382 3,780 4,162 475 8/1/2016Riverside-San Bernardino-Ontario CA 806 3,852 569 806 4,421 5,227 558 8/1/2016Riverside-San Bernardino-Ontario CA 570 4,238 360 570 4,598 5,168 548 8/1/2016Riverside-San Bernardino-Ontario CA 345 3,270 163 345 3,433 3,778 460 8/1/2016Riverside-San Bernardino-Ontario CA 252 4,419 339 252 4,758 5,010 584 9/1/2016Riverside-San Bernardino-Ontario CA 2,691 3,950 209 2,691 4,159 6,850 480 9/1/2016Riverside-San Bernardino-Ontario CA 302 4,169 115 302 4,284 4,586 489 5/8/2017Riverside-San Bernardino-Ontario CA 896 6,397 515 896 6,912 7,808 753 5/31/2017Riverside-San Bernardino-Ontario(3) CA 552 3,010 130 552 3,140 3,692 953 5/16/2008Riverside-San Bernardino-Ontario CA 1,342 4,446 266 1,342 4,712 6,054 1,648 4/1/2013Riverside-San Bernardino-Ontario CA 1,672 2,564 61 1,672 2,625 4,297 631 4/1/2014Riverside-San Bernardino-Ontario CA 978 1,854 307 978 2,161 3,139 710 5/30/2014Riverside-San Bernardino-Ontario CA 1,068 2,609 119 1,068 2,728 3,796 765 5/30/2014Riverside-San Bernardino-Ontario CA 1,202 2,032 94 1,202 2,126 3,328 528 6/30/2014Riverside-San Bernardino-Ontario CA 1,803 2,758 148 1,803 2,906 4,709 929 6/30/2014Riverside-San Bernardino-Ontario CA 1,337 4,489 70 1,337 4,559 5,896 1,011 6/30/2014Riverside-San Bernardino-Ontario CA 846 2,508 122 846 2,630 3,476 812 7/1/2014Riverside-San Bernardino-Ontario(3) CA 1,026 4,552 83 1,026 4,635 5,661 971 9/17/2014Riverside-San Bernardino-Ontario(3) CA 1,878 5,104 98 1,878 5,202 7,080 969 9/17/2014Riverside-San Bernardino-Ontario CA 3,974 6,962 150 3,974 7,112 11,086 1,882 10/1/2014Riverside-San Bernardino-Ontario CA 2,018 3,478 728 2,018 4,206 6,224 1,430 10/1/2014
Table of Contents
F-44

Location Initial Cost to Company Gross Carrying Amount at Year-End
MSA(1)State/
Territory LandBuildings andImprovements
SubsequentAdditions Land
Buildings andImprovements Total(2)
AccumulatedDepreciation
DateAcquired
Riverside-San Bernardino-Ontario CA 1,644 2,588 61 1,644 2,649 4,293 223 5/17/2018Sacramento-Roseville-Arden-Arcade CA 1,195 8,407 35 1,195 8,442 9,637 856 11/10/2016Sacramento-Roseville-Arden-Arcade CA 1,652 9,510 223 1,652 9,733 11,385 560 9/26/2018San Diego-Carlsbad CA 4,318 19,775 1,087 4,323 20,862 25,185 2,110 8/1/2016San Diego-Carlsbad(3) CA 3,703 5,582 89 3,703 5,671 9,374 1,079 9/17/2014San Diego-Carlsbad CA 3,544 4,915 265 3,544 5,180 8,724 1,063 10/1/2014San Diego-Carlsbad(4) CA — 5,568 127 — 5,695 5,695 795 1/1/2015San Diego-Carlsbad(4) CA — 4,041 72 — 4,113 4,113 1,050 1/31/2015Stockton-Lodi CA 559 5,514 15 559 5,529 6,088 584 11/10/2016Stockton-Lodi CA 1,710 8,995 50 1,710 9,045 10,755 1,089 11/10/2016Stockton-Lodi CA 1,637 11,901 55 1,637 11,956 13,593 915 7/31/2017Colorado Springs CO 455 1,351 65 455 1,416 1,871 461 8/29/2007Colorado Springs CO 588 2,162 1,139 588 3,301 3,889 978 3/26/2008Colorado Springs CO 632 3,118 419 632 3,537 4,169 1,152 3/26/2008Colorado Springs CO 414 1,535 351 414 1,886 2,300 616 5/1/2008Colorado Springs(3) CO 300 1,801 129 300 1,930 2,230 521 6/1/2009Colorado Springs CO 766 5,901 625 766 6,526 7,292 553 10/19/2017Denver-Aurora-Lakewood CO 868 128 2,306 868 2,434 3,302 593 6/22/2009Denver-Aurora-Lakewood CO 938 8,449 39 938 8,488 9,426 771 11/1/2016Fort Collins CO 3,213 3,087 226 3,213 3,313 6,526 1,046 8/29/2007Fort Collins CO 2,514 1,786 115 2,514 1,901 4,415 599 8/29/2007Pueblo CO 156 2,797 16 156 2,813 2,969 375 2/17/2016Cape Coral-Fort Myers(3) FL 4,122 8,453 55 4,122 8,508 12,630 1,128 4/1/2016Crestview-Fort Walton Beach-Destin FL 684 12,857 16 684 12,873 13,557 325 1/1/2019Crestview-Fort Walton Beach-Destin FL 2,001 12,948 3 2,001 12,951 14,952 218 6/21/2019Crestview-Fort Walton Beach-Destin FL 813 3,509 7 813 3,516 4,329 5 12/17/2019Crestview-Fort Walton Beach-Destin FL 1,285 5,292 7 1,285 5,299 6,584 9 12/17/2019Gainesville FL 1,072 4,698 72 1,072 4,770 5,842 387 1/10/2018Gainesville FL 264 2,369 94 264 2,463 2,727 117 12/18/2018Gainesville(3) FL 457 2,120 6 457 2,126 2,583 5 12/19/2019Jacksonville FL 2,087 19,473 157 2,087 19,630 21,717 1,808 11/10/2016Jacksonville FL 1,629 4,929 315 1,629 5,244 6,873 641 11/10/2016Jacksonville FL 527 2,434 927 527 3,361 3,888 377 12/20/2017Lakeland-Winter Haven(3) FL 972 2,159 157 972 2,316 3,288 438 5/4/2015Naples-Immokalee-Marco Island(3) FL 3,849 16,688 118 3,849 16,806 20,655 1,892 4/1/2016
Table of Contents
F-45

Location Initial Cost to Company Gross Carrying Amount at Year-End
MSA(1)State/
Territory LandBuildings andImprovements
SubsequentAdditions Land
Buildings andImprovements Total(2)
AccumulatedDepreciation
DateAcquired
North Port-Sarasota-Bradenton(3) FL 2,211 5,682 62 2,211 5,744 7,955 737 4/1/2016North Port-Sarasota-Bradenton(3) FL 2,488 7,282 152 2,488 7,434 9,922 906 4/1/2016North Port-Sarasota-Bradenton(3) FL 1,767 5,955 22 1,767 5,977 7,744 831 4/1/2016North Port-Sarasota-Bradenton FL 2,143 5,005 3,863 3,373 8,868 12,241 1,348 10/11/2016North Port-Sarasota-Bradenton(3) FL 1,924 4,514 278 1,924 4,792 6,716 708 4/1/2016North Port-Sarasota-Bradenton FL 1,176 3,421 7 1,176 3,428 4,604 443 4/1/2016North Port-Sarasota-Bradenton(3) FL 1,839 8,377 40 1,839 8,417 10,256 923 4/1/2016North Port-Sarasota-Bradenton(3) FL 2,507 7,766 56 2,507 7,822 10,329 941 4/1/2016North Port-Sarasota-Bradenton(3) FL 1,685 5,439 72 1,685 5,511 7,196 726 4/1/2016North Port-Sarasota-Bradenton(3) FL 437 5,128 206 437 5,334 5,771 728 4/1/2016North Port-Sarasota-Bradenton FL 1,015 3,031 23 1,015 3,054 4,069 376 4/1/2016North Port-Sarasota-Bradenton FL 1,985 4,299 892 1,985 5,191 7,176 573 1/31/2017North Port-Sarasota-Bradenton FL 1,336 4,085 2 1,336 4,087 5,423 354 4/6/2017North Port-Sarasota-Bradenton FL 2,105 8,217 16 2,105 8,233 10,338 320 1/1/2019Orlando-Kissimmee-Sanford FL 2,426 9,314 130 2,426 9,444 11,870 1,018 11/10/2016Orlando-Kissimmee-Sanford FL 2,166 4,672 103 2,166 4,775 6,941 579 11/10/2016Orlando-Kissimmee-Sanford FL 4,583 8,752 102 4,583 8,854 13,437 1,197 11/10/2016Orlando-Kissimmee-Sanford FL 4,181 4,268 177 4,181 4,445 8,626 496 6/30/2017Palm Bay-Melbourne-Titusville FL 1,125 4,362 8 1,125 4,370 5,495 143 1/1/2019Panama City FL 2,332 6,847 10 2,332 6,857 9,189 136 6/21/2019Panama City FL 810 3,105 24 810 3,129 3,939 39 8/22/2019Pensacola-Ferry Pass-Brent FL 1,025 8,157 120 1,025 8,277 9,302 601 10/3/2017Pensacola-Ferry Pass-Brent FL 841 5,075 233 841 5,308 6,149 411 2/20/2018Pensacola-Ferry Pass-Brent FL 644 4,785 156 644 4,941 5,585 212 12/12/2018Pensacola-Ferry Pass-Brent FL 1,182 5,008 4 1,182 5,012 6,194 98 6/21/2019Punta Gorda(3) FL 1,157 2,079 813 1,157 2,892 4,049 286 4/27/2017Tampa-St. Petersburg-Clearwater(3) FL 5,436 10,092 43 5,436 10,135 15,571 1,349 4/1/2016Tampa-St. Petersburg-Clearwater(3) FL 361 1,238 98 361 1,336 1,697 337 5/4/2015Tampa-St. Petersburg-Clearwater FL 3,581 2,612 57 3,581 2,669 6,250 407 5/1/2017Tampa-St. Petersburg-Clearwater FL 4,708 13,984 86 4,708 14,070 18,778 1,184 5/24/2017Tampa-St. Petersburg-Clearwater FL 2,063 5,351 188 2,063 5,539 7,602 248 8/28/2018Tampa-St. Petersburg-Clearwater FL 1,248 2,937 — 1,248 2,937 4,185 4 12/18/2019The Villages FL 897 6,132 36 897 6,168 7,065 291 1/1/2019Atlanta-Sandy Springs-Roswell GA 515 687 111 515 798 1,313 280 8/29/2007Atlanta-Sandy Springs-Roswell GA 272 1,357 503 272 1,860 2,132 559 8/29/2007
Table of Contents
F-46
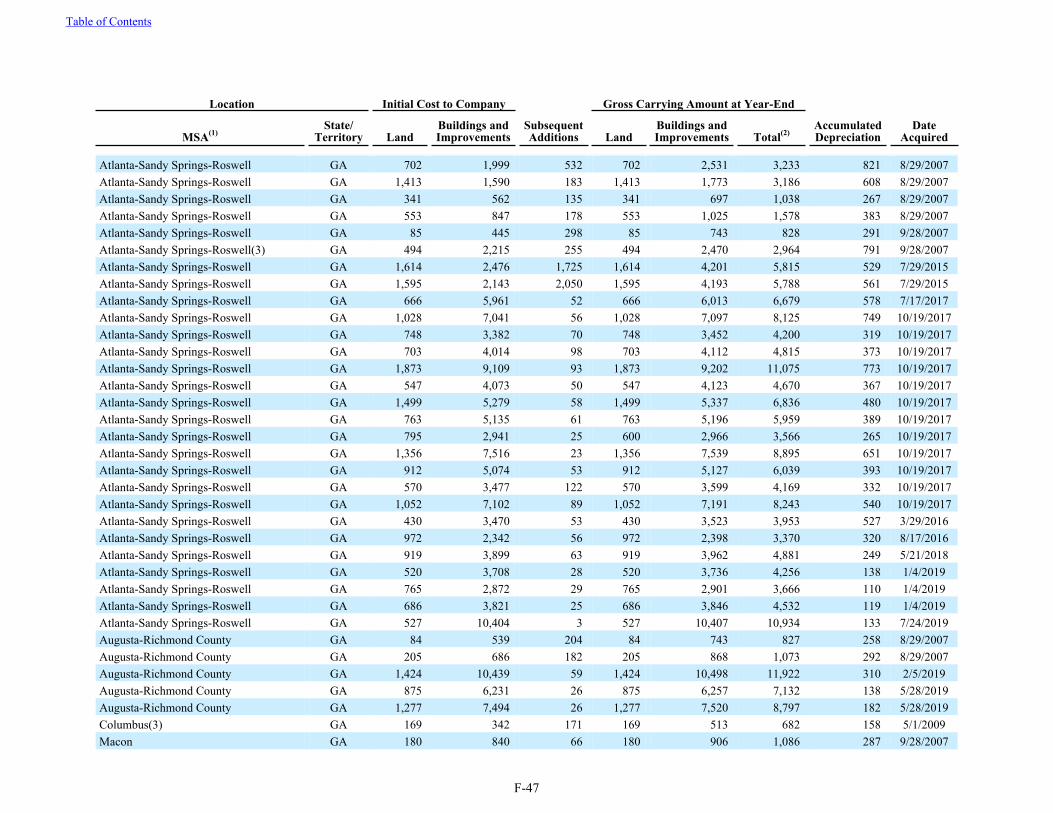
Location Initial Cost to Company Gross Carrying Amount at Year-End
MSA(1)State/
Territory LandBuildings andImprovements
SubsequentAdditions Land
Buildings andImprovements Total(2)
AccumulatedDepreciation
DateAcquired
Atlanta-Sandy Springs-Roswell GA 702 1,999 532 702 2,531 3,233 821 8/29/2007Atlanta-Sandy Springs-Roswell GA 1,413 1,590 183 1,413 1,773 3,186 608 8/29/2007Atlanta-Sandy Springs-Roswell GA 341 562 135 341 697 1,038 267 8/29/2007Atlanta-Sandy Springs-Roswell GA 553 847 178 553 1,025 1,578 383 8/29/2007Atlanta-Sandy Springs-Roswell GA 85 445 298 85 743 828 291 9/28/2007Atlanta-Sandy Springs-Roswell(3) GA 494 2,215 255 494 2,470 2,964 791 9/28/2007Atlanta-Sandy Springs-Roswell GA 1,614 2,476 1,725 1,614 4,201 5,815 529 7/29/2015Atlanta-Sandy Springs-Roswell GA 1,595 2,143 2,050 1,595 4,193 5,788 561 7/29/2015Atlanta-Sandy Springs-Roswell GA 666 5,961 52 666 6,013 6,679 578 7/17/2017Atlanta-Sandy Springs-Roswell GA 1,028 7,041 56 1,028 7,097 8,125 749 10/19/2017Atlanta-Sandy Springs-Roswell GA 748 3,382 70 748 3,452 4,200 319 10/19/2017Atlanta-Sandy Springs-Roswell GA 703 4,014 98 703 4,112 4,815 373 10/19/2017Atlanta-Sandy Springs-Roswell GA 1,873 9,109 93 1,873 9,202 11,075 773 10/19/2017Atlanta-Sandy Springs-Roswell GA 547 4,073 50 547 4,123 4,670 367 10/19/2017Atlanta-Sandy Springs-Roswell GA 1,499 5,279 58 1,499 5,337 6,836 480 10/19/2017Atlanta-Sandy Springs-Roswell GA 763 5,135 61 763 5,196 5,959 389 10/19/2017Atlanta-Sandy Springs-Roswell GA 795 2,941 25 600 2,966 3,566 265 10/19/2017Atlanta-Sandy Springs-Roswell GA 1,356 7,516 23 1,356 7,539 8,895 651 10/19/2017Atlanta-Sandy Springs-Roswell GA 912 5,074 53 912 5,127 6,039 393 10/19/2017Atlanta-Sandy Springs-Roswell GA 570 3,477 122 570 3,599 4,169 332 10/19/2017Atlanta-Sandy Springs-Roswell GA 1,052 7,102 89 1,052 7,191 8,243 540 10/19/2017Atlanta-Sandy Springs-Roswell GA 430 3,470 53 430 3,523 3,953 527 3/29/2016Atlanta-Sandy Springs-Roswell GA 972 2,342 56 972 2,398 3,370 320 8/17/2016Atlanta-Sandy Springs-Roswell GA 919 3,899 63 919 3,962 4,881 249 5/21/2018Atlanta-Sandy Springs-Roswell GA 520 3,708 28 520 3,736 4,256 138 1/4/2019Atlanta-Sandy Springs-Roswell GA 765 2,872 29 765 2,901 3,666 110 1/4/2019Atlanta-Sandy Springs-Roswell GA 686 3,821 25 686 3,846 4,532 119 1/4/2019Atlanta-Sandy Springs-Roswell GA 527 10,404 3 527 10,407 10,934 133 7/24/2019Augusta-Richmond County GA 84 539 204 84 743 827 258 8/29/2007Augusta-Richmond County GA 205 686 182 205 868 1,073 292 8/29/2007Augusta-Richmond County GA 1,424 10,439 59 1,424 10,498 11,922 310 2/5/2019Augusta-Richmond County GA 875 6,231 26 875 6,257 7,132 138 5/28/2019Augusta-Richmond County GA 1,277 7,494 26 1,277 7,520 8,797 182 5/28/2019Columbus(3) GA 169 342 171 169 513 682 158 5/1/2009Macon GA 180 840 66 180 906 1,086 287 9/28/2007
Table of Contents
F-47

Location Initial Cost to Company Gross Carrying Amount at Year-End
MSA(1)State/
Territory LandBuildings andImprovements
SubsequentAdditions Land
Buildings andImprovements Total(2)
AccumulatedDepreciation
DateAcquired
Savannah GA 1,741 1,160 437 1,741 1,597 3,338 456 8/29/2007Savannah(3) GA 597 762 168 597 930 1,527 323 9/28/2007Savannah GA 409 1,335 30 409 1,365 1,774 473 1/31/2014Savannah GA 811 1,181 157 811 1,338 2,149 482 6/25/2014Savannah GA 1,280 7,211 69 1,280 7,280 8,560 176 5/15/2019Valdosta GA 1,321 3,320 4 1,321 3,324 4,645 115 1/1/2019Nonmetropolitan Area GA 599 3,714 14 599 3,728 4,327 53 8/30/2019Nonmetropolitan Area ID 1,133 5,634 34 1,133 5,668 6,801 203 4/1/2019Nonmetropolitan Area ID 362 2,523 4 362 2,527 2,889 59 6/24/2019Nonmetropolitan Area ID 413 2,114 5 413 2,119 2,532 44 6/24/2019St. Louis IL 225 4,394 187 225 4,581 4,806 424 8/28/2017St. Louis IL 179 5,154 335 179 5,489 5,668 519 8/28/2017St. Louis IL 226 3,088 252 226 3,340 3,566 351 8/28/2017St. Louis IL 174 3,338 274 174 3,612 3,786 336 9/25/2017Indianapolis-Carmel-Anderson IN 855 7,273 24 855 7,297 8,152 999 2/16/2016Indianapolis-Carmel-Anderson IN 815 3,844 13 815 3,857 4,672 655 2/16/2016Indianapolis-Carmel-Anderson IN 688 3,845 30 688 3,875 4,563 663 2/16/2016Indianapolis-Carmel-Anderson IN 626 4,049 36 626 4,085 4,711 615 2/25/2016Indianapolis-Carmel-Anderson IN 1,118 4,444 281 1,118 4,725 5,843 921 2/25/2016Indianapolis-Carmel-Anderson IN 614 5,487 41 614 5,528 6,142 734 2/25/2016Indianapolis-Carmel-Anderson IN 619 2,140 20 619 2,160 2,779 391 11/10/2016Indianapolis-Carmel-Anderson IN 689 6,944 38 689 6,982 7,671 762 11/10/2016Indianapolis-Carmel-Anderson IN 609 3,172 39 609 3,211 3,820 483 11/10/2016Indianapolis-Carmel-Anderson IN 532 5,441 34 532 5,475 6,007 592 11/10/2016Indianapolis-Carmel-Anderson IN 433 5,817 20 433 5,837 6,270 603 11/10/2016Indianapolis-Carmel-Anderson IN 688 5,413 40 688 5,453 6,141 685 11/10/2016Indianapolis-Carmel-Anderson IN 575 5,168 65 575 5,233 5,808 615 11/10/2016Indianapolis-Carmel-Anderson IN 522 5,366 28 522 5,394 5,916 595 11/10/2016Indianapolis-Carmel-Anderson IN 528 2,877 13 528 2,890 3,418 315 10/19/2017Indianapolis-Carmel-Anderson IN 1,257 6,694 29 1,257 6,723 7,980 611 10/19/2017Kansas City KS 816 5,432 133 816 5,565 6,381 524 10/19/2017Kansas City KS 975 6,967 183 975 7,150 8,125 711 10/19/2017Kansas City KS 719 5,143 168 719 5,311 6,030 453 10/19/2017Kansas City(3) KS 521 5,168 176 521 5,344 5,865 360 3/1/2018Kansas City KS 640 3,367 127 640 3,494 4,134 242 5/31/2018
Table of Contents
F-48

Location Initial Cost to Company Gross Carrying Amount at Year-End
MSA(1)State/
Territory LandBuildings andImprovements
SubsequentAdditions Land
Buildings andImprovements Total(2)
AccumulatedDepreciation
DateAcquired
Kansas City KS 533 3,138 98 533 3,236 3,769 213 5/31/2018Kansas City KS 499 4,041 116 499 4,157 4,656 282 5/31/2018Kansas City KS 724 4,245 130 724 4,375 5,099 269 5/31/2018Wichita(3) KS 1,156 5,662 164 1,156 5,826 6,982 428 3/1/2018Wichita(3) KS 721 3,395 175 721 3,570 4,291 266 3/1/2018Wichita(3) KS 443 3,635 115 443 3,750 4,193 258 3/1/2018Wichita KS 630 7,264 123 630 7,387 8,017 418 3/1/2018Wichita KS 430 1,740 64 430 1,804 2,234 132 3/1/2018Wichita KS 655 1,831 132 655 1,963 2,618 144 5/31/2018Wichita KS 393 3,950 142 393 4,092 4,485 270 5/31/2018Wichita KS 1,353 2,241 130 1,353 2,371 3,724 193 8/28/2018Louisville/Jefferson County KY 2,174 3,667 42 2,174 3,709 5,883 655 5/1/2015Baton Rouge LA 386 1,744 114 386 1,858 2,244 270 4/12/2016Baton Rouge LA 1,098 5,208 530 1,098 5,738 6,836 895 4/12/2016Baton Rouge LA 1,203 3,156 252 1,203 3,408 4,611 534 7/21/2016Baton Rouge LA 755 2,702 275 755 2,977 3,732 460 7/21/2016New Orleans-Metairie LA 1,287 6,235 144 1,287 6,379 7,666 875 4/12/2016New Orleans-Metairie LA 1,076 6,677 69 1,076 6,746 7,822 520 1/10/2019New Orleans-Metairie LA 1,274 1,987 40 1,274 2,027 3,301 122 1/10/2019New Orleans-Metairie LA 994 8,548 21 994 8,569 9,563 232 1/10/2019New Orleans-Metairie LA 607 9,211 264 607 9,475 10,082 254 1/10/2019New Orleans-Metairie LA 819 4,291 287 819 4,578 5,397 164 1/10/2019New Orleans-Metairie LA 327 4,423 61 327 4,484 4,811 133 1/10/2019New Orleans-Metairie LA 852 4,138 40 852 4,178 5,030 140 1/10/2019New Orleans-Metairie LA 633 870 31 633 901 1,534 57 1/10/2019New Orleans-Metairie LA 682 4,790 437 682 5,227 5,909 165 1/10/2019New Orleans-Metairie LA 773 7,056 47 773 7,103 7,876 196 1/10/2019New Orleans-Metairie LA 742 3,278 19 742 3,297 4,039 136 1/10/2019New Orleans-Metairie(4) LA 96 3,615 6 96 3,621 3,717 45 9/18/2019Shreveport-Bossier City LA 971 3,474 152 1,549 5,036 6,585 737 5/5/2015Shreveport-Bossier City LA 964 3,573 104 964 3,677 4,641 772 5/5/2015Shreveport-Bossier City LA 772 2,906 131 772 3,037 3,809 626 5/5/2015Shreveport-Bossier City LA 479 1,439 71 479 1,510 1,989 331 5/5/2015Shreveport-Bossier City LA 475 854 85 475 939 1,414 248 5/5/2015Shreveport-Bossier City LA 645 2,004 70 645 2,074 2,719 307 10/19/2017
Table of Contents
F-49

Location Initial Cost to Company Gross Carrying Amount at Year-End
MSA(1)State/
Territory LandBuildings andImprovements
SubsequentAdditions Land
Buildings andImprovements Total(2)
AccumulatedDepreciation
DateAcquired
Shreveport-Bossier City LA 654 3,589 68 654 3,657 4,311 302 10/19/2017Shreveport-Bossier City LA 906 3,618 56 906 3,674 4,580 334 10/19/2017Shreveport-Bossier City(4) LA — 5,113 90 — 5,203 5,203 364 10/19/2017Springfield MA 1,036 5,131 43 1,036 5,174 6,210 66 9/17/2019Springfield MA 891 4,944 62 891 5,006 5,897 58 9/17/2019Worchester MA 414 4,122 96 414 4,218 4,632 394 6/30/2017California-Lexington Park MD 827 4,936 126 827 5,062 5,889 415 2/16/2018California-Lexington Park MD 965 6,738 144 965 6,882 7,847 745 7/31/2017California-Lexington Park MD 550 2,409 117 550 2,526 3,076 304 9/6/2017Washington-Arlington-Alexandria MD 717 3,303 66 717 3,369 4,086 162 1/3/2019Kansas City MO 541 4,874 203 541 5,077 5,618 356 5/31/2018Kansas City MO 461 5,341 110 461 5,451 5,912 344 5/31/2018Kansas City MO 341 3,748 177 341 3,925 4,266 259 5/31/2018St. Louis MO 1,675 10,606 188 1,675 10,794 12,469 626 9/26/2018St. Louis MO 352 7,100 274 352 7,374 7,726 732 8/28/2017St. Louis MO 163 1,025 53 163 1,078 1,241 115 8/28/2017St. Louis MO 354 4,034 135 354 4,169 4,523 411 8/28/2017St. Louis MO 634 3,886 3 634 3,889 4,523 6 12/18/2019St. Louis MO 1,012 3,328 3 1,012 3,331 4,343 6 12/18/2019Gulfport-Biloxi-Pascagoula MS 645 2,413 275 645 2,688 3,333 595 4/12/2016Nonmetropolitan Area(3) MS 224 1,052 146 224 1,198 1,422 333 5/1/2009Nonmetropolitan Area(3) MS 382 803 198 382 1,001 1,383 285 5/1/2009Charlotte-Concord-Gastonia NC 1,871 4,174 101 1,871 4,275 6,146 758 5/1/2015Charlotte-Concord-Gastonia(3) NC 1,108 3,935 91 1,108 4,026 5,134 727 5/4/2015Charlotte-Concord-Gastonia(3) NC 2,301 4,458 230 2,301 4,688 6,989 929 5/4/2015Charlotte-Concord-Gastonia(3) NC 1,862 3,297 96 1,862 3,393 5,255 701 9/2/2015Durham-Chapel Hill NC 1,711 4,180 65 1,711 4,245 5,956 679 5/1/2015Durham-Chapel Hill NC 390 1,025 251 390 1,276 1,666 435 8/29/2007Durham-Chapel Hill(3) NC 663 2,743 267 663 3,010 3,673 974 9/28/2007Durham-Chapel Hill NC 1,024 1,383 430 1,024 1,813 2,837 577 9/28/2007Fayetteville(3) NC 1,195 2,072 26 1,195 2,098 3,293 333 10/1/2015Fayetteville(3) NC 830 3,710 69 830 3,779 4,609 498 10/1/2015Fayetteville NC 636 2,169 1,678 636 3,847 4,483 1,199 8/29/2007Fayetteville(3) NC 151 5,392 479 151 5,871 6,022 1,786 9/28/2007Fayetteville NC 1,319 3,444 32 1,319 3,476 4,795 748 10/10/2013
Table of Contents
F-50

Location Initial Cost to Company Gross Carrying Amount at Year-End
MSA(1)State/
Territory LandBuildings andImprovements
SubsequentAdditions Land
Buildings andImprovements Total(2)
AccumulatedDepreciation
DateAcquired
Fayetteville NC 772 3,406 43 772 3,449 4,221 651 10/10/2013Fayetteville(3) NC 1,276 4,527 46 1,276 4,573 5,849 793 12/20/2013Greensboro-High Point NC 873 769 205 873 974 1,847 366 8/29/2007Jacksonville NC 1,265 2,123 299 1,265 2,422 3,687 593 5/1/2015Nonmetropolitan Area NC 530 2,394 13 530 2,407 2,937 465 12/11/2014Nonmetropolitan Area NC 667 2,066 22 667 2,088 2,755 427 12/11/2014Nonmetropolitan Area(3) NC 689 3,153 39 689 3,192 3,881 575 5/6/2015Nonmetropolitan Area NC 2,093 2,045 60 2,093 2,105 4,198 300 8/4/2017Nonmetropolitan Area NC 173 2,193 36 173 2,229 2,402 188 7/17/2018Raleigh NC 396 1,700 193 396 1,893 2,289 645 8/29/2007Raleigh NC 393 1,190 218 393 1,408 1,801 462 8/29/2007Raleigh NC 907 2,913 135 907 3,048 3,955 975 8/29/2007Raleigh(3) NC 1,578 4,678 99 1,578 4,777 6,355 756 5/4/2015Wilmington NC 1,881 4,618 62 1,881 4,680 6,561 781 5/1/2015Wilmington NC 1,283 1,747 338 1,141 2,085 3,226 629 8/29/2007Wilmington(3) NC 860 828 104 860 932 1,792 301 9/28/2007Wilmington NC 1,720 9,032 36 1,720 9,068 10,788 333 11/7/2018Wilmington NC 2,021 8,136 55 2,021 8,191 10,212 327 11/7/2018Wilmington NC 3,083 12,487 27 3,083 12,514 15,597 427 11/7/2018Winston-Salem NC 362 529 75 362 604 966 213 8/29/2007Boston-Cambridge-Newton NH 899 3,863 45 899 3,908 4,807 584 9/22/2015Boston-Cambridge-Newton NH 1,488 7,300 115 1,488 7,415 8,903 1,641 7/1/2014Boston-Cambridge-Newton NH 1,597 3,138 93 1,597 3,231 4,828 528 2/22/2016Boston-Cambridge-Newton NH 1,445 2,957 69 1,445 3,026 4,471 521 2/22/2016Manchester-Nashua NH 1,786 6,100 27 1,786 6,127 7,913 852 2/22/2016Manchester-Nashua NH 1,395 5,573 36 1,395 5,609 7,004 722 2/22/2016Nonmetropolitan Area NH 632 1,040 469 632 1,509 2,141 454 6/24/2013Nonmetropolitan Area NH 197 901 24 197 925 1,122 355 6/24/2013Nonmetropolitan Area NH 2,053 5,425 52 2,053 5,477 7,530 605 6/15/2017Nonmetropolitan Area NH 1,528 2,686 35 1,528 2,721 4,249 519 2/22/2016Nonmetropolitan Area NH 1,344 4,872 165 1,344 5,037 6,381 175 3/8/2019New York-Newark-Jersey City NJ 742 3,810 25 742 3,835 4,577 176 3/1/2019New York-Newark-Jersey City NJ 831 6,318 38 831 6,356 7,187 256 3/1/2019Vineland-Bridgeton NJ 180 5,831 300 180 6,131 6,311 183 4/15/2019Albuquerque NM 1,089 2,845 178 1,089 3,023 4,112 590 8/31/2016
Table of Contents
F-51

Location Initial Cost to Company Gross Carrying Amount at Year-End
MSA(1)State/
Territory LandBuildings andImprovements
SubsequentAdditions Land
Buildings andImprovements Total(2)
AccumulatedDepreciation
DateAcquired
Albuquerque NM 854 3,436 89 854 3,525 4,379 466 9/19/2016Albuquerque NM 1,247 2,753 111 1,247 2,864 4,111 90 3/21/2019Albuquerque NM 2,448 11,065 125 2,448 11,190 13,638 201 5/20/2019Albuquerque NM 2,386 7,658 77 2,386 7,735 10,121 175 5/20/2019Carson City NV 985 1,438 391 995 1,829 2,824 122 12/13/2018Las Vegas-Henderson-Paradise NV 1,757 4,223 77 1,757 4,300 6,057 627 9/20/2016Las Vegas-Henderson-Paradise NV 1,121 1,510 117 1,121 1,627 2,748 309 9/20/2016Las Vegas-Henderson-Paradise NV 2,160 4,544 272 2,160 4,816 6,976 521 11/17/2016Las Vegas-Henderson-Paradise NV 1,047 7,413 347 1,047 7,760 8,807 500 4/11/2018Las Vegas-Henderson-Paradise NV 1,169 3,616 227 1,169 3,843 5,012 1,391 12/23/2013Las Vegas-Henderson-Paradise NV 389 2,850 104 389 2,954 3,343 740 4/1/2014Las Vegas-Henderson-Paradise NV 794 1,406 119 794 1,525 2,319 506 7/1/2014Las Vegas-Henderson-Paradise NV 2,362 8,445 183 2,362 8,628 10,990 647 8/15/2017Las Vegas-Henderson-Paradise NV 2,157 2,753 118 2,157 2,871 5,028 308 8/15/2017Las Vegas-Henderson-Paradise NV 1,296 8,039 227 1,296 8,266 9,562 593 8/15/2017Las Vegas-Henderson-Paradise NV 828 2,030 275 828 2,305 3,133 274 8/29/2017Las Vegas-Henderson-Paradise NV 3,864 2,870 1,021 3,976 3,891 7,867 529 8/29/2017Canton-Massillon OH 83 2,911 48 83 2,959 3,042 375 11/10/2016Canton-Massillon OH 292 2,107 113 292 2,220 2,512 564 11/10/2016Cincinnati OH 2,059 11,660 52 2,059 11,712 13,771 636 9/6/2018Cleveland-Elyria OH 169 2,702 50 169 2,752 2,921 332 11/10/2016Cleveland-Elyria OH 193 3,323 42 193 3,365 3,558 364 11/10/2016Cleveland-Elyria OH 490 1,050 26 490 1,076 1,566 209 11/10/2016Cleveland-Elyria OH 845 4,916 33 845 4,949 5,794 626 11/10/2016Cleveland-Elyria OH 842 2,044 40 842 2,084 2,926 420 11/10/2016Oklahoma City OK 388 3,142 233 388 3,375 3,763 1,106 5/29/2007Oklahoma City OK 213 1,383 106 213 1,489 1,702 493 5/29/2007Oklahoma City OK 561 2,355 621 561 2,976 3,537 1,065 5/29/2007Oklahoma City OK 349 2,368 593 349 2,961 3,310 1,050 5/29/2007Oklahoma City OK 466 2,544 109 466 2,653 3,119 878 5/29/2007Oklahoma City OK 144 1,576 209 144 1,785 1,929 625 5/29/2007Oklahoma City OK 168 1,696 297 168 1,993 2,161 685 5/29/2007Oklahoma City OK 220 1,606 124 220 1,730 1,950 581 5/30/2007Oklahoma City OK 376 1,460 62 376 1,522 1,898 487 5/30/2007Oklahoma City OK 337 2,788 95 337 2,883 3,220 943 5/30/2007
Table of Contents
F-52

Location Initial Cost to Company Gross Carrying Amount at Year-End
MSA(1)State/
Territory LandBuildings andImprovements
SubsequentAdditions Land
Buildings andImprovements Total(2)
AccumulatedDepreciation
DateAcquired
Oklahoma City OK 814 3,161 1,195 814 4,356 5,170 1,128 5/30/2007Oklahoma City OK 590 1,502 1,814 590 3,316 3,906 985 8/29/2007Oklahoma City OK 205 1,772 603 205 2,375 2,580 800 5/1/2009Oklahoma City OK 701 4,926 3 701 4,929 5,630 536 9/1/2016Oklahoma City OK 1,082 4,218 20 1,082 4,238 5,320 594 1/1/2016Oklahoma City OK 736 2,925 6 736 2,931 3,667 500 1/1/2016Oklahoma City OK 1,135 3,759 18 1,135 3,777 4,912 559 1/1/2016Tulsa OK 548 1,892 112 548 2,004 2,552 641 8/29/2007Tulsa OK 764 1,386 441 764 1,827 2,591 624 8/29/2007Tulsa OK 1,305 2,533 172 1,305 2,705 4,010 881 8/29/2007Tulsa OK 940 2,196 353 940 2,549 3,489 834 8/29/2007Tulsa OK 59 466 378 59 844 903 284 8/29/2007Tulsa OK 426 1,424 299 426 1,723 2,149 626 8/29/2007Tulsa OK 250 667 257 250 924 1,174 302 8/29/2007Tulsa(3) OK 944 2,085 59 944 2,144 3,088 653 2/14/2008Tulsa(3) OK 892 2,421 30 892 2,451 3,343 743 2/14/2008Tulsa OK 492 1,343 198 492 1,541 2,033 443 4/1/2008Tulsa OK 505 1,346 731 505 2,077 2,582 815 4/1/2008Tulsa OK 466 1,270 157 466 1,427 1,893 447 4/1/2008Tulsa(3) OK 1,103 4,431 457 1,103 4,888 5,991 1,923 6/10/2013Bend-Redmond OR 295 1,369 65 295 1,434 1,729 471 4/1/2013Bend-Redmond OR 1,692 2,410 67 1,692 2,477 4,169 957 4/1/2013Bend-Redmond(3) OR 571 1,917 9 571 1,926 2,497 509 6/10/2013Bend-Redmond(3) OR 397 1,180 133 397 1,313 1,710 534 6/10/2013Bend-Redmond OR 690 1,983 853 690 2,836 3,526 622 5/1/2014Bend-Redmond OR 722 2,151 8 722 2,159 2,881 538 5/1/2014Bend-Redmond OR 800 2,836 8 800 2,844 3,644 708 5/1/2014Bend-Redmond OR 2,688 10,731 102 2,688 10,833 13,521 1,492 4/15/2016Corvallis OR 382 1,465 48 382 1,513 1,895 469 12/30/2013Eugene OR 710 1,539 102 710 1,641 2,351 531 4/1/2013Eugene OR 842 1,674 46 842 1,720 2,562 593 4/1/2013Eugene(3) OR 414 1,990 8 414 1,998 2,412 451 6/10/2013Eugene(3) OR 1,149 2,061 73 1,149 2,134 3,283 572 6/10/2013Eugene OR 728 3,230 151 728 3,381 4,109 693 12/30/2013Eugene OR 1,601 2,686 154 1,601 2,840 4,441 1,016 4/1/2014
Table of Contents
F-53

Location Initial Cost to Company Gross Carrying Amount at Year-End
MSA(1)State/
Territory LandBuildings andImprovements
SubsequentAdditions Land
Buildings andImprovements Total(2)
AccumulatedDepreciation
DateAcquired
Nonmetropolitan Area OR 997 1,874 16 997 1,890 2,887 402 12/1/2014Portland-Vancouver-Hillsboro OR 2,670 8,709 81 2,670 8,790 11,460 1,044 8/10/2015Portland-Vancouver-Hillsboro OR 771 4,121 5 771 4,126 4,897 287 11/15/2017Portland-Vancouver-Hillsboro OR 2,002 14,445 35 2,002 14,480 16,482 1,195 12/14/2017Portland-Vancouver-Hillsboro OR 851 2,063 21 851 2,084 2,935 504 4/1/2013Portland-Vancouver-Hillsboro OR 1,704 2,313 196 1,704 2,509 4,213 795 4/1/2013Portland-Vancouver-Hillsboro OR 1,254 2,787 64 1,254 2,851 4,105 687 4/1/2013Portland-Vancouver-Hillsboro OR 2,808 4,437 29 2,808 4,466 7,274 1,292 4/1/2013Portland-Vancouver-Hillsboro OR 1,015 2,184 8 1,015 2,192 3,207 560 4/1/2013Portland-Vancouver-Hillsboro(3) OR 1,077 3,008 180 1,077 3,188 4,265 709 6/10/2013Portland-Vancouver-Hillsboro(3) OR 1,072 2,629 87 1,072 2,716 3,788 731 6/10/2013Portland-Vancouver-Hillsboro(3) OR 2,217 3,766 25 2,217 3,791 6,008 883 6/10/2013Portland-Vancouver-Hillsboro(3) OR 1,334 2,324 138 1,334 2,462 3,796 674 6/10/2013Portland-Vancouver-Hillsboro(3) OR 996 2,525 178 996 2,703 3,699 712 6/10/2013Portland-Vancouver-Hillsboro OR 1,496 3,372 242 1,496 3,614 5,110 788 6/24/2013Portland-Vancouver-Hillsboro OR 954 3,026 141 954 3,167 4,121 640 6/24/2013Portland-Vancouver-Hillsboro OR 1,627 2,388 97 1,627 2,485 4,112 615 6/24/2013Portland-Vancouver-Hillsboro OR 2,509 4,200 135 2,509 4,335 6,844 1,062 12/30/2013Portland-Vancouver-Hillsboro OR 787 1,915 81 787 1,996 2,783 453 12/30/2013Portland-Vancouver-Hillsboro OR 1,703 4,729 44 1,703 4,773 6,476 980 4/1/2014Portland-Vancouver-Hillsboro OR 738 2,483 7 738 2,490 3,228 515 4/1/2014Portland-Vancouver-Hillsboro OR 1,690 2,995 180 1,690 3,175 4,865 513 4/1/2014Portland-Vancouver-Hillsboro OR 1,200 9,531 293 1,200 9,824 11,024 2,781 5/30/2014Portland-Vancouver-Hillsboro OR 401 3,718 94 401 3,812 4,213 879 5/30/2014Portland-Vancouver-Hillsboro OR 1,160 3,291 34 1,160 3,325 4,485 740 6/30/2014Portland-Vancouver-Hillsboro OR 1,435 4,342 21 1,435 4,363 5,798 974 6/30/2014Portland-Vancouver-Hillsboro OR 1,478 4,127 14 1,478 4,141 5,619 918 6/30/2014Portland-Vancouver-Hillsboro OR 1,402 3,196 41 1,402 3,237 4,639 683 6/30/2014Portland-Vancouver-Hillsboro OR 3,538 4,938 29 3,398 4,007 7,405 885 6/30/2014Portland-Vancouver-Hillsboro OR 1,501 3,136 27 1,501 3,163 4,664 698 6/30/2014Portland-Vancouver-Hillsboro OR 1,746 3,393 33 1,746 3,426 5,172 772 8/27/2014Portland-Vancouver-Hillsboro OR 1,014 3,017 28 1,014 3,045 4,059 711 8/27/2014Portland-Vancouver-Hillsboro OR 2,202 3,477 194 2,202 3,671 5,873 859 10/20/2014Portland-Vancouver-Hillsboro OR 1,764 7,360 30 1,764 7,390 9,154 1,375 12/16/2014Portland-Vancouver-Hillsboro OR 860 3,740 4 860 3,744 4,604 363 1/11/2017
Table of Contents
F-54

Location Initial Cost to Company Gross Carrying Amount at Year-End
MSA(1)State/
Territory LandBuildings andImprovements
SubsequentAdditions Land
Buildings andImprovements Total(2)
AccumulatedDepreciation
DateAcquired
Portland-Vancouver-Hillsboro OR 410 622 182 410 804 1,214 144 7/14/2016Portland-Vancouver-Hillsboro OR 1,258 6,298 12 1,258 6,310 7,568 578 11/21/2016Portland-Vancouver-Hillsboro OR 2,334 7,726 63 2,339 7,789 10,128 879 12/6/2016Portland-Vancouver-Hillsboro OR 1,048 3,549 30 1,048 3,579 4,627 237 8/16/2018Nonmetropolitan Area OR 427 1,648 8 427 1,656 2,083 363 8/27/2014Nonmetropolitan Area(3) OR 474 1,789 107 474 1,896 2,370 507 6/10/2013Salem OR 472 2,880 4 472 2,884 3,356 115 10/24/2018Salem OR 1,405 2,650 430 1,405 3,080 4,485 969 4/1/2014Salem OR 492 1,248 70 492 1,318 1,810 249 4/20/2016Salem OR 408 2,221 55 408 2,276 2,684 91 2/1/2019Nonmetropolitan Area OR 1,108 2,100 8 1,108 2,108 3,216 486 12/5/2014Lancaster PA 1,393 6,642 3 1,393 6,645 8,038 247 3/1/2019Lancaster PA 712 3,821 3 712 3,824 4,536 154 3/1/2019Lancaster PA 599 4,712 3 599 4,715 5,314 128 3/1/2019Lancaster PA 520 2,135 16 520 2,151 2,671 70 3/1/2019Philadelphia-Camden-Wilmington PA 625 7,377 235 625 7,612 8,237 207 4/15/2019York-Hanover PA 586 3,266 14 586 3,280 3,866 154 3/1/2019Ponce PR 745 4,813 8 745 4,821 5,566 292 9/6/2018San Juan-Carolina-Caguas PR 1,095 8,073 21 1,095 8,094 9,189 375 9/6/2018San Juan-Carolina-Caguas PR 1,205 9,967 80 1,205 10,047 11,252 402 9/6/2018San Juan-Carolina-Caguas PR 1,266 15,805 40 1,266 15,845 17,111 544 9/6/2018San Juan-Carolina-Caguas PR 356 1,892 32 356 1,924 2,280 117 9/6/2018San Juan-Carolina-Caguas PR 573 2,373 268 573 2,641 3,214 165 9/6/2018Charlotte-Concord-Gastonia SC 924 3,086 71 924 3,157 4,081 543 5/4/2015Greenville-Anderson-Mauldin SC 82 838 179 82 1,017 1,099 317 8/29/2007Greenville-Anderson-Mauldin SC 92 976 140 92 1,116 1,208 387 8/29/2007Spartanburg SC 535 1,934 35 535 1,969 2,504 363 11/12/2015Amarillo(3) TX 80 877 113 80 990 1,070 287 5/1/2009Amarillo(3) TX 78 697 166 78 863 941 261 5/1/2009Amarillo(3) TX 147 810 154 147 964 1,111 280 5/1/2009Austin-Round Rock TX 936 6,446 199 692 6,645 7,337 442 10/19/2017Austin-Round Rock TX 937 5,319 104 937 5,423 6,360 1,100 6/24/2013Austin-Round Rock TX 1,395 2,790 35 1,395 2,825 4,220 892 6/24/2013Austin-Round Rock TX 768 1,923 296 768 2,219 2,987 515 10/29/2014Austin-Round Rock TX 1,783 17,579 37 1,783 17,616 19,399 395 6/7/2019
Table of Contents
F-55

Location Initial Cost to Company Gross Carrying Amount at Year-End
MSA(1)State/
Territory LandBuildings andImprovements
SubsequentAdditions Land
Buildings andImprovements Total(2)
AccumulatedDepreciation
DateAcquired
Austin-Round Rock TX 605 8,703 20 605 8,723 9,328 160 6/7/2019Brownsville-Harlingen TX 845 2,364 76 845 2,440 3,285 464 9/4/2014Brownsville-Harlingen TX 639 1,674 115 639 1,789 2,428 415 9/4/2014Brownsville-Harlingen TX 386 2,798 212 386 3,010 3,396 460 5/2/2016College Station-Bryan TX 618 2,512 141 618 2,653 3,271 823 8/29/2007College Station-Bryan TX 551 349 282 551 631 1,182 209 8/29/2007College Station-Bryan TX 295 988 185 295 1,173 1,468 340 4/1/2008College Station-Bryan TX 51 123 80 51 203 254 73 4/1/2008College Station-Bryan TX 110 372 194 110 566 676 154 4/1/2008College Station-Bryan TX 62 208 26 62 234 296 70 4/1/2008Dallas-Fort Worth-Arlington TX 164 865 53 164 918 1,082 299 8/29/2007Dallas-Fort Worth-Arlington TX 155 105 55 155 160 315 64 9/28/2007Dallas-Fort Worth-Arlington TX 98 282 199 98 481 579 166 9/28/2007Dallas-Fort Worth-Arlington TX 264 106 167 264 273 537 123 9/28/2007Dallas-Fort Worth-Arlington(3) TX 376 803 132 376 935 1,311 326 9/28/2007Dallas-Fort Worth-Arlington(3) TX 338 681 106 338 787 1,125 259 9/28/2007Dallas-Fort Worth-Arlington TX 1,388 4,195 60 1,388 4,255 5,643 985 6/24/2013Dallas-Fort Worth-Arlington TX 1,859 5,293 146 1,859 5,439 7,298 1,212 7/25/2013Dallas-Fort Worth-Arlington TX 379 2,212 143 379 2,355 2,734 744 7/25/2013Dallas-Fort Worth-Arlington TX 1,397 5,250 98 1,397 5,348 6,745 1,126 7/25/2013Dallas-Fort Worth-Arlington TX 2,102 5,755 110 2,102 5,865 7,967 1,421 7/25/2013Dallas-Fort Worth-Arlington TX 649 1,637 63 649 1,700 2,349 690 7/25/2013Dallas-Fort Worth-Arlington TX 396 1,411 482 396 1,893 2,289 554 4/29/2015Dallas-Fort Worth-Arlington TX 1,263 3,346 54 1,263 3,400 4,663 765 10/19/2015Dallas-Fort Worth-Arlington TX 1,421 2,349 529 1,421 2,878 4,299 547 6/1/2016Dallas-Fort Worth-Arlington TX 710 3,578 142 710 3,720 4,430 395 10/19/2017Dallas-Fort Worth-Arlington TX 421 2,668 178 421 2,846 3,267 269 10/19/2017El Paso TX 338 1,275 45 338 1,320 1,658 424 8/29/2007El Paso TX 94 400 170 94 570 664 194 8/29/2007Houston-The Woodlands-Sugar Land TX 698 2,648 282 698 2,930 3,628 541 7/20/2015Houston-The Woodlands-Sugar Land TX 1,042 3,061 482 1,042 3,543 4,585 637 1/22/2016Houston-The Woodlands-Sugar Land TX 1,426 2,910 132 1,426 3,042 4,468 385 6/13/2017Houston-The Woodlands-Sugar Land TX 826 3,683 239 826 3,922 4,748 385 1/4/2018Houston-The Woodlands-Sugar Land TX 649 4,077 73 649 4,150 4,799 385 1/4/2018Houston-The Woodlands-Sugar Land TX 291 4,980 12 291 4,992 5,283 102 5/7/2019
Table of Contents
F-56

Location Initial Cost to Company Gross Carrying Amount at Year-End
MSA(1)State/
Territory LandBuildings andImprovements
SubsequentAdditions Land
Buildings andImprovements Total(2)
AccumulatedDepreciation
DateAcquired
Houston-The Woodlands-Sugar Land TX 539 2,664 14 539 2,678 3,217 57 6/7/2019Houston-The Woodlands-Sugar Land TX 4,004 4,991 51 4,004 5,042 9,046 174 6/7/2019Houston-The Woodlands-Sugar Land TX 2,959 5,875 65 2,959 5,940 8,899 145 6/7/2019Houston-The Woodlands-Sugar Land TX 799 4,769 51 799 4,820 5,619 98 6/7/2019Houston-The Woodlands-Sugar Land TX 687 3,668 36 687 3,704 4,391 85 6/7/2019Houston-The Woodlands-Sugar Land TX 295 2,403 65 295 2,468 2,763 48 6/7/2019Killeen-Temple TX 203 4,065 254 203 4,319 4,522 427 2/2/2017Killeen-Temple TX 1,128 6,149 229 1,128 6,378 7,506 606 8/8/2017Killeen-Temple TX 721 4,166 1 721 4,167 4,888 7 12/13/2019Longview(3) TX 651 671 109 651 780 1,431 228 5/1/2009Longview(3) TX 104 489 167 104 656 760 184 5/1/2009Longview(3) TX 310 966 207 310 1,173 1,483 332 5/1/2009Longview TX 2,466 3,559 214 2,466 3,773 6,239 764 6/19/2014McAllen–Edinburg–Mission TX 1,217 2,738 295 1,243 3,033 4,276 888 7/31/2014McAllen–Edinburg–Mission TX 1,973 4,517 91 1,973 4,608 6,581 1,070 9/4/2014McAllen–Edinburg–Mission TX 1,295 3,929 98 1,295 4,027 5,322 918 9/4/2014McAllen–Edinburg–Mission TX 3,079 7,574 116 3,079 7,690 10,769 1,885 9/4/2014McAllen–Edinburg–Mission TX 1,017 3,261 85 1,017 3,346 4,363 750 9/4/2014McAllen–Edinburg–Mission TX 803 2,914 96 803 3,010 3,813 550 9/4/2014McAllen–Edinburg–Mission TX 2,249 4,966 74 2,249 5,040 7,289 1,202 9/4/2014McAllen–Edinburg–Mission TX 1,118 3,568 97 1,118 3,665 4,783 704 9/4/2014Midland(3) TX 691 1,588 171 691 1,759 2,450 493 5/1/2009Nonmetropolitan Area TX 959 1,640 59 959 1,699 2,658 377 6/25/2014Odessa(3) TX 168 561 121 168 682 850 200 5/1/2009San Angelo(3) TX 381 986 106 381 1,092 1,473 302 5/1/2009San Antonio-New Braunfels TX 614 2,640 81 614 2,721 3,335 710 4/1/2014San Antonio-New Braunfels TX 715 4,566 87 715 4,653 5,368 418 10/19/2017San Antonio-New Braunfels TX 275 4,893 141 275 5,034 5,309 88 6/7/2019Washington-Arlington-Alexandria VA 1,516 12,633 71 1,516 12,704 14,220 945 7/21/2017Nonmetropolitan Area(3) WA 810 1,530 16 810 1,546 2,356 663 6/10/2013Nonmetropolitan Area(3) WA 998 1,862 115 998 1,977 2,975 823 6/10/2013Longview WA 448 2,356 17 448 2,373 2,821 408 9/3/2015Portland-Vancouver-Hillsboro WA 421 2,313 12 421 2,325 2,746 544 4/1/2013Portland-Vancouver-Hillsboro WA 1,903 2,239 8 1,903 2,247 4,150 660 4/1/2013Portland-Vancouver-Hillsboro(3) WA 923 2,821 15 923 2,836 3,759 656 6/10/2013
Table of Contents
F-57

Location Initial Cost to Company Gross Carrying Amount at Year-End
MSA(1)State/
Territory LandBuildings andImprovements
SubsequentAdditions Land
Buildings andImprovements Total(2)
AccumulatedDepreciation
DateAcquired
Portland-Vancouver-Hillsboro WA 935 2,045 12 935 2,057 2,992 448 4/1/2014Portland-Vancouver-Hillsboro WA 478 2,158 173 478 2,331 2,809 558 4/1/2014Portland-Vancouver-Hillsboro WA 2,023 3,484 48 2,023 3,532 5,555 889 8/27/2014Portland-Vancouver-Hillsboro WA 1,870 4,632 7 1,870 4,639 6,509 557 1/11/2017Portland-Vancouver-Hillsboro WA 422 2,271 8 422 2,279 2,701 156 3/29/2018Portland-Vancouver-Hillsboro WA 1,105 2,121 19 1,105 2,140 3,245 461 10/3/2014Seattle-Tacoma-Bellevue WA 770 3,203 35 770 3,238 4,008 817 4/1/2014Seattle-Tacoma-Bellevue WA 1,438 3,280 65 1,438 3,345 4,783 798 9/18/2014Total $649,872 $ 2,347,378 $ 93,953 $649,938 $ 2,441,781 $ 3,091,719 $ 337,822
(1) Refers to metropolitan statistical area (MSA) as defined by the U.S. Census Bureau.
(2) The aggregate cost of land and depreciable property for Federal income tax purposes was approximately $2.7 billion (unaudited) at December 31, 2019.
(3) As of December 31, 2019, 94 of our self storage properties were encumbered by an aggregate of $264.3 million of debt financing.
(4) Property subject to a long-term lease agreement.
Note: The Company only owns one class of real estate, which is self storage properties. The estimated useful lives of the individual assets that comprise buildings and improvements range from 3 years to 40 years. The category for buildings and improvements in the table above includes furniture and equipment.
Table of Contents
F-58

2019 2018 2017Self Storage properties:Balance at beginning of year $ 2,637,723 $ 2,275,233 $ 1,844,336Acquisitions and improvements 458,132 366,522 431,542Reclassification from assets held for sale — — 8,607Write-off of fully depreciated assets and other — (323) (50)Dispositions (4,136) (3,709) (7,336)Reclassification to assets held for sale — — (1,866)Balance at end of year $ 3,091,719 $ 2,637,723 $ 2,275,233
Accumulated depreciation:Balance at beginning of year $ 246,261 $ 170,358 $ 110,803Depreciation expense 92,177 76,299 60,522Write-off of fully depreciated assets and other — — (10)Dispositions (616) (396) (646)Assets held for sale — — (311)Balance at end of year $ 337,822 $ 246,261 $ 170,358
Table of ContentsNATIONAL STORAGE AFFILIATES TRUST
SCHEDULE III-REAL ESTATE AND ACCUMULATED DEPRECIATIONFor the Years Ended December 31, 2019, 2018 and 2017
(in thousands)
F-59

CORPORATE INFORMATION
ARLEN D. NORDHAGEN Executive Chairman of the Board of TrusteesTAMARA D. FISCHER President and Chief Executive Officer
PAUL W. HYLBERT Lead Independent Trustee
BOARD OF TRUSTEES
GEORGE L. CHAPMAN
CHAD L. MEISINGER
STEVE G. OSGOOD
DOMINIC M. PALAZZO
REBECCA L. STEINFORT
MARK VAN MOURICK
J. TIMOTHY WARREN
DAVID G. CRAMER Executive Vice President and Chief Operating Officer
BRANDON S. TOGASHI Executive Vice President and Chief Financial Officer
EXECUTIVE OFFICERS
NATIONAL STORAGE AFFILIATES TRUST 8400 East Prentice Avenue, 9th Floor Greenwood Village, Colorado 80111720.630.2600
KPMG LLP Denver, Colorado
BROADRIDGE CORPORATE ISSUER SOLUTIONS, INC. P.O. Box 1342 Brentwood, New York 11717Toll-free: 855.449.0975 International: 720.378.5970Email: [email protected]
CORPORATE HEADQUARTERS
STOCK EXCHANGE LISTING
SHAREHOLDER/OP UNITHOLDER SERVICES
INDEPENDENT AUDITORS
www.nationalstorageaffiliates.com
NYSE: NSA
ADDITIONAL COPIES OF THE NATIONAL STORAGE AFFILIATES TRUST (THE “COMPANY”) ANNUAL REPORT
on Form 10-K for the year ended December 31, 2019, as filed with the U.S. Securities and Exchange Commission, may
be obtained by writing to the Company’s corporate headquarters, Attention: Investor Relations Department.
Electronic copies are also available on the Company’s website at www.nationalstorageaffiliates.com.
THE CODE OF BUSINESS CONDUCT AND ETHICS OF NATIONAL STORAGE AFFILIATES TRUST
is available on its website at www.nationalstorageaffiliates.com.
A printed copy may be obtained by writing to the Company’s corporate headquarters, Attention: Investor Relations Department.
Certain statements contained in this 2019 Annual Report constitute forward-looking statements as such term is defined in Section 27A of the Securities Act of 1933, as amended, and Section 21E of the Securities Exchange Act of 1934, as amended, and such statements are intended to be covered by the safe harbor provided by the same. Forward-looking statements are subject to substantial risks and uncertainties, many of which are difficult to predict and are generally beyond the Company’s control. These forward-looking statements include information about possible or assumed future results of the Company’s business, financial condition, liquidity, results of operations, plans and objectives. Changes in any circumstances may cause the Company’s actual results to differ significantly from those expressed in any forward-looking statement. When used in this release, the words “believe,” “expect,” “anticipate,” “estimate,” “plan,” “continue,”
“intend,” “should,” “may” or similar expressions are intended to identify forward-looking statements. Statements regarding the following subjects, among others, may be forward-looking: market trends in the Company’s industry, interest rates, the debt and lending markets or the general economy; the Company’s business and investment strategy; and the acquisition of properties, including the timing of acquisitions. For a further list and description of such risks and uncertainties, see the Company’s Annual Report on Form 10-K filed with the Securities and Exchange Commission on February 26, 2020 and the other reports filed by the Company with the Securities and Exchange Commission. The forward-looking statements, and other risks, uncertainties and factors are based on the Company’s beliefs, assumptions and expectations of its future performance, taking into account all information currently available to the Company. Forward-looking statements are not predictions of future events. The Company disclaims any intention or obligation to update or revise any forward-looking statements, whether as a result of new information, future events or otherwise, except as required by law.
THE ANNUAL MEETING OF SHAREHOLDERS will be held May 19, 2020 Mountain Time (MT),
beginning at12:00 p.m. local time. The meeting will be held via a virtual meeting live webcast at:
www.virtualshareholdermeeting.com/NSA2020
FORWARD LOOKING STATEMENTS
DES
IGN
: Wat
erm
ark
(ww
w.w
mka
genc
y.com
); PR
INTI
NG
: Visi
on G
raph
ics, In
c. (w
ww.
visio
ngra
phics
-inc.c
om)

(1) As of December 31, 2019, NSA’s portfolio consisted of 567 wholly-owned properties and 175 JV-owned properties.
NSA DELIVERS ROBUST PORTFOLIO GROWTH
2013
100137
219
448
515
742(1)
Nu
mb
er o
f Pro
pe
rtie
s
2014 20172015 20182016 2019
(1) Principal debt outstanding as of December 31, 2019.
Captive Pipeline
At Formation
3rd Party Acquisitions New PROs Strategic Joint Ventures
675
277
500
600
700
800
300
400
200
100
OVER 640% GROWTH S INCE FORMATION
(1)
TOTAL RETURN PERFORMANCE†
12/31/154/23/15
$300
$350
$250
$200
$150
$100
$50
Ind
ex
Va
lue
12/31/16 12/31/17 12/31/18 12/31/19
† Assumes $100.00 invested on April 23, 2015, with dividends reinvested. The Performance Graph will not be deemed to be incorporated by reference into any filing by NSA under the Securities Act of 1933, as amended, or the Securities Exchange Act of 1934, as amended, except to the extent that NSA specifically incorporates the same by reference.
National Storage Affiliates Trust S&P 500
NAREIT All Equity REIT Index Russell 2000
NSA’S GROWTH PROFORMANCE
OVER 215% TOTAL RETURN
5.9 YEARS
3.5%
4.5X
5.7X
WEIGHTED AVERAGE MATURITY
EFFECTIVE INTEREST RATE
INTEREST COVERAGE
NET DEBT/ADJUSTED EBITDA
$0
$100
2020 2021 2022 2023 2024 2025
$200
$300
$400
$500
$600
$700
$800
DEBT MATURITY SCHEDULE(1)
($ IN MILLIONS)
Term Loans Mortgage Private Placement
Thereafter
Available RLOC
$500

NATIONALSTORAGEAFFIL IATES.COM