Embed Size (px)
Citation preview

Upjohn Institute Working Papers Upjohn Research home page
4-1-2002
Privatization Methods and Productivity Effects in Romanian Privatization Methods and Productivity Effects in Romanian
Industrial Enterprises Industrial Enterprises
John S. Earle W.E. Upjohn Institute for Employment Research
Álmos Telegdy Budapest University of Economic Sciences
Upjohn Institute Working Paper No. 02-81
**Published Version**
In Journal of Comparative Economics 30: 657-682 (2002).
Follow this and additional works at: https://research.upjohn.org/up_workingpapers
Part of the Eastern European Studies Commons
Citation Citation Earle, John S. and Álmos Telegdy. 2002. "Privatization Methods and Productivity Effects in Romanian Industrial Enterprises." Upjohn Institute Working Paper No. 02-81. Kalamazoo, MI: W.E. Upjohn Institute for Employment Research. https://doi.org/10.17848/wp02-81
This title is brought to you by the Upjohn Institute. For more information, please contact [email protected].

Privatization Methods and Productivity Effects
in Romanian Industrial Enterprises
Upjohn Institute Staff Working Paper No. 02-81
John S. Earle W.E. Upjohn Institute for Employment Research
300 S. Westnedge Avenue Kalamazoo, Michigan 49007
Email: [email protected] and
Central European University
and
Álmos Telegdy Budapest University of Economic Sciences
Central European University Email: [email protected]
Revised: April 2002
JEL Classification Codes: G32, G34, L32, L33, P20, P31
Early research and data gathering related to this paper was partially supported by the World Bank. The more recent work and data collection was undertaken with support from the European Commission’s Phare ACE Programme 1998. The content of this paper is the sole responsibility of the authors and in no way represents the views of the Commission or its services.

ABSTRACT
Comprehensive panel data on privatization transactions and labor productivity in
Romanian industrial corporations are used to describe the post-privatization ownership structure,
and to estimate the effect of Romania’s diverse privatization policies on firm performance. The
econometric results show consistently positive, highly significant effects of private ownership on
labor productivity growth, the point estimates imply ing an increased 1.0 to 1.7 percentage
growth for a 10 percent rise in private shareholding. The strongest estimated impacts are
associated with sales to outside blockholders; insider transfers and mass privatization are
estimated to have significantly smaller—although still positive—effects on firm performance.

1
1. INTRODUCTION
The impact of privatization on enterprise performance has been a key analytic and policy
issue in the transformation of formerly socialist economies, and a sizable body of empirical
literature is accumulating on the topic.1 In this paper, we extend the privatization-performance
research agenda to Romania, a large country in Eastern Europe that has been the subject of
relatively little systematic analysis. Previous studies of Romanian privatization have focused on
describing the policies themselves, and they have not provided information concerning either the
resulting ownership structure or the effects on firm performance. 2 Previous research on firm
behavior in Romania has generally relied on small samples of firms and emphasized issues other
than privatization. 3
Our study is motivated not only by the usefulness of adding another country to the list of
those for which an analysis of post-privatization ownership and enterprise performance has been
conducted, but also by the broader lessons that Romania’s experience may offer on the effects of
alternative privatization policies and ownership structures on firm behavior. The privatization
process in Romania has been quite heterogeneous, involving all the major methods employed in
transition economies: employee buyouts, mass privatization, and sales to outside investors. The
1 Djankov and Murrell (2000) and Megginson and Netter (2001) provide surveys of research on enterprise restructuring in transition economies and on privatization and firm performance, respectively. 2 Earle and Sapatoru (1993) describe the initial framework for Romanian privatization policies; Earle and Sapatoru (1994) analyze the role of the Private Ownership Funds; Munteanu (1997) discusses the legal framework for Management and Employee Buyouts; Earle and Telegdy (1998) study the Mass Privatization Program; Negrescu (2000) provides a policy overview and some case studies; and Telegdy et al. (forthcoming) provide information on privatization through the Bucharest Stock Exchange. 3 The sole exception is a study of the impact of privatization on total factor productivity growth in seven countries, including Romania, by Claessens, Djankov, and Pohl (1997). The usefulness of the Romanian results in this study is constrained by the data, however: the time series ends in 1995, by which time very little privatization had taken place, and the only available ownership measure is a dummy variable for privatization, with no information on different methods of privatization or on types of private owners and their shareholdings. Other firm-level studies of Romania include Konings (1997) on the impact of competition, Konings and Repkin (1998) on the relationship of technical efficiency and profitability, Carlin, Estrin, and Schaffer (2000) on European Union accession, and Djankov (1999a) on the isolation program for loss-making firms.

2
employee buyout and mass privatization methods resulted in dispersed inside and outside
ownership, respectively, while sales nearly always involved large blocks of shares. At the same
time, the process has been incomplete, leaving many companies fully or partially in state hands
despite repeated governmental proclamations of intentions to “accelerate” the process. Thus, the
post-privatization ownership structure contains significant components of insiders, outsiders, and
the state, and examples of both concentrated and dispersed ownership among firms with private
outside shareholders.
Our database, which we have constructed from several sources, is unusual in enabling us
to measure virtually all privatization transactions and different types of acquiring owners in the
corporatized enterprises from 1992 to 1998 in Romania. To estimate the impact of owner-types
on firm performance, we have linked the ownership information with panel data containing basic
information on industrial firms for each year from 1992 to 1999. Unlike previous studies of the
impact of privatization in most countries, we are thus able to provide estimates based on a large
sample, including nearly the entire surviving population of industrial joint-stock companies
eligible for privatization in Romania, which amounts to about 90 percent of such companies in
1999, and containing longitudinal data spanning the pre- and post-privatization periods.
Our empirical strategy follows the broader literature on firm performance in the choice of
the dependent variable and controlling covariates, and we employ a variety of alternative
econometric techniques to control for potential selection bias and measurement error. Subject to
the constraints of the data, which—despite their richness concerning the post-privatization
ownership structure—are rather limited in financial and operating information, we investigate
possible problems of endogeneity in the determination of the ownership variables. We also
consider alternative specifications of the functional form through which ownership affects firm

3
performance; in particular, we estimate both linear equations based on proportionate
shareholdings and threshold models of majority privatization and of the largest owner type, a
specification commonly adopted in the literature. In the latter specification, we use time-
invariant group effects to control for pre-privatization differences in performance and to permit
an assessment of the magnitude of such differences.
Section 2 describes the construction of the data, the Romanian privatization process, and
the post-privatization ownership structure. Section 3 presents econometric specifications,
Section 4 reports estimation results, and Section 5 concludes with a summary of our findings.
2. DATA, PRIVATIZATION POLICIES, AND OWNERSHIP OUTCOMES
2.1 Database Construction
Our analysis of the post-privatization ownership structure is based on unpublished data
from multiple sources that we have linked together.4 The information on the ownership of the
initially state-owned joint-stock companies is compiled from seven databases: the State
Ownership Fund (SOF) Transactions Database, the SOF Portfolio Database, and one database for
each of the five Private Ownership Funds (POFs).5 From these sources, we construct a nearly
complete evolution of the post-privatization ownership structure through the end of 1998 for all
initially state-owned enterprises in the SOF portfolio. Thus, the sample includes all the surviving
joint-stock (“commercial”) companies, but it excludes spin-offs of shops and other assets from
the parent companies as well as the regii autonome, which are discussed later in this section. We
construct our final sample for the ownership structure by selecting all industrial firms, resulting
4 The appendix of Earle and Telegdy (2002) contains a detailed description of the construction of the database. 5 The establishment and functions of these organizations are discussed in detail in the second part of this section.
4
in 2,354 cases representing about 95 percent of the total number of surviving industrial firms
from the SOF portfolio.6
To study firm performance, we draw information on employment and sales for each year
from 1992 to 1999 from the corresponding Romanian Enterprise Registries.7 The Registries
have nearly complete information on all registered firms with at least five employees, but in each
year from 1993 to 1999, between 8 and 11 percent of the firms have missing values; the
percentage missing is 18 percent in 1992. Table 1 presents the number of observations in the
final sample, by year. In summary, the data enable us to measure the post-privatization
ownership structure of almost all industrial joint-stock companies from the surviving population
of the SOF, and to estimate the relationship between privatization methods and performance for
about 90 percent of these companies.
2.2 Corporatization and Residual State Ownership
Similar to most other transition economies, the process of large and medium-sized
enterprise reform in Romania began with corporatization of the SOEs, in order to make possible
their transfer to multiple owners. In Romania, the legal conversion took place relatively quickly
and was completed by 1991, when the SOEs were divided into two groups: regii autonome
(remaining SOES) and societati comerciale (commerical companies). The so-called “strategic”
companies were included in the former group, and although relatively small in number (about
400 companies), they tended to be large in size, accounting for about 47 percent of total SOE
6 Incomplete information in the files resulted in the loss of about five percent of all observations. 7 Sales are deflated by producer price indices, usually at the 4-digit industry level. See the appendix of Earle and Telegdy (2002) for more detail.

5
assets (Romanian Development Agency, 1997).8 The second group of firms, nearly all of which
were reorganized as open joint-stock companies, is the focus of attention in this paper.
The shares in these corporatized entities were placed in a newly established State
Ownership Fund (SOF) and one of five Private Ownership Funds (POFs), in a ratio of 70:30
percent. The SOF’s organization and governance resembled those of Ministries of Privatization
and State Property Funds in other transition economies. The POFs, however, were more
unusual. Despite their name, they remained state-governed, their boards of directors appointed
by the government and approved by the Parliament, and their nominal owners, who were the
approximately 18 million Romanian citizens, without any effective means of control. Thus, we
treat the POFs as a separate category, neither private nor state, in the empirical analysis. 9
As presented in Table 2, our database contains 2,354 industrial firms in SOF ownership in
1992, when the privatization process began. Most of these (1,822 firms or 77 percent of the
total) still had some state ownership at the end of 1998. Indeed, the SOF holding, conditional on
being present in these firms, was 46.9 percent at the mean and 50.9 at the median. The
unconditional mean, the evolution of which we have calculated in Table 3, fell from 70 percent
at the end of 1991 to 36.3 percent at the end of 1998. As a percentage of firms by largest owner-
type, the SOF share fell from 100 to 47.6 percent, as reported in Table 4. Concerning POF
ownership, 941 firms were partially POF-owned at the end of 1998, with a conditional mean of
20.1 percent. The POF has almost always been a minority owner, and only 32 of these firms
were majority POF-owned. Starting from the 30 percent handed over to them in 1991, the POF
8 The average number of employees in the 357 regii included in the Romania n Enterprise Registry was 2,988 in 1992. 9 Earle and Sapatoru (1993, 1994) describe the legal basis and incentives of the SOF and POFs during their first few years of operation. From 1996 to 1997, the POFs were converted into investment funds, known in Ro manian as SIFs, but their governance remained nontransparent, each having several million small shareholders and explicit rules preventing ownership concentration. We refer to them as POFs for simplicity. See Negrescu (2000) for more discussion of the POF/SIFs.

6
share declined to 8.0 by the end of 1998 (Table 3); they were never the largest owner in any but a
very small number of firms (able 4).10
The Romanian Privatization Law of 1991 and associated regulations charged the SOF
with the privatization of all the shares in its portfolio within seven years. But the law provided
little guidance on how this goal was to be accomplished, specifying only a very general list of
possible methods. In practice, three fairly specific techniques have dominated Romanian
privatization: management-employee buyout (MEBO), the mass privatization program (MPP),
and block sales of shares to outside investors. Sales were intended to be the primary method of
privatization from the beginning, although the MEBO method had already received some
encouragement in the Privatization Law’s provision for preferential terms for managers and
employees. These included the right of first refusal and installment payments at very low
interest rates, and these preferences were expanded and extended in later legislation. 11 The MPP
was adopted later, in 1995, as an announced attempt to “accelerate” the rate of property transfer.
2.3 The Management-Employee Buyout (MEBO) Method
Transfer of shares to employees, through giveaways or sales at low prices, has been a
common privatization method in transition economies due to the relative ease of administrative
and political implementation. The method is controversial, however, and frequently alleged to
be ill-suited to the restructuring demands of the transition. 12 On the one hand, insider
10 The tables also present the shares owned by a group labelled as “others,” which are not identifiable on the basis of the SOF sources. Of the 18 firms in which others were the majority owners, we were able to obtain further ownership data on the 7 firms listed on the Stock Exchange or RASDAQ, the over-the-counter market. In these firms, outside blockholders had majority stakes in 4 and the employees’ organizations had majority ownership in 3. 11 MEBOs began in earnest in 1993, although a law formalizing the practices was adopted only in 1994; see Munteanu (1997) for a detailed discussion. After 1996, sales to employees were no longer formally referred to as MEBOs, but the institutional arrangements remained the same. 12 Frydman and Rapaczynski (1994), and Lipton and Sachs (1990) argue against privatization to employees, while Ellerman (1993), Stiglitz (1999) and Weitzman (1993) argue in favor of this policy. Estrin, Jones, and Svejnar (1987) analyze the performance effects of producer cooperatives in Western economies, and Earle and Estrin (1996) discuss the advantages and disadvantages of worker and manager ownership in transition economies.

7
privatization may improve work incentives, company loyalty, and support for restructuring. If
ownership is widely dispersed among employees, it may also facilitate takeovers by outsiders.13
On the other hand, employees may lack the necessary skills, capital, access to markets, and
technologies necessary to turn their firms around. Corporate governance by employees may
function particularly poorly when the firm requires difficult restructuring choices that have
disparate distributional impacts within the firm. 14
While standard arguments such as these might have some relevance for every form of
employee ownership in the transition economies, the Romanian MEBOs also have some
significant institutional peculiarities. These stem largely from the legal requirement that the
employees establish an employees’ association to hold the shares and exercise most ownership
rights during the repayment period of 3 to 5 years, in order to obtain the payment preferences.15
During the repayment period, the unpaid shares may not be resold; this constraint limits the
possibility for concentration or takeovers that might improve governance. Moreover, the
Romanian privatization contracts often included restrictions on changes in the firm’s
employment level and main product that also applied during the repayment period. The
complicated governance and limitations on restructuring that resulted from these arrangements
may have further attenuated any potentially positive effects of privatization on these firms’
performance.
In addition to these institutional peculiarities, insider privatization in Romania is also
somewhat unusual in the magnitude of the insider share in the affected firms. Table 2 shows that
13 For a review of evidence on the productivity effects of worker ownership in the West, see Bonin, Jones, and Putterman (1993). 14 Hansmann (1990) contains a similar argument with respect to the patterns of worker ownership in Western economies. 15 Anecdotal evidence suggests that voting within the employee association is sometimes according to one-member one-vote rather than by shareholding. This suggests that MEBO firms are hybrid organizations, part public corporation and part producer cooperative.

8
a total of 858 industria l firms—over a third of all industrial firms in the SOF portfolio—had
undergone MEBO transactions by the end of 1998, with the mean employee stake reaching 64.9
percent and the median 70.6 percent. Unlike most share transfers to employees in Hungary and
Poland, and to an even greater degree than in Russia, the Romanian MEBOs tended to yield
overwhelming employee ownership. Usually the entire SOF stake of 70 percent was transferred
to employees, although there were also some cases of minority participation, sometimes
combined with other privatization methods.16
Table 3 displays the evolution of ownership from 1992 to 1998. MEBOs were most
common in the years 1994 and 1995, although employees continued to buy out their companies
through 1998 (the last year in our ownership data). Second only to the SOF, MEBO participants
were the largest owner-type in 24.5 percent of the firms at the end of 1998, as shown in Table 4.
Measured either as the average percentage of shares privatized or the largest private owner-type,
MEBO has been the single most important privatization method in Romania. Therefore,
Romanian MEBOs provide an interesting opportunity to test the effect of dominant employee
ownership in a large number of privatized firms.
2.4 The Mass Privatization Program (MPP)
The second major method used in Romania was mass (or “voucher”) privatization. As
elsewhere in Eastern Europe, the rationale for this method was that the speed of privatization
could be increased by overcoming the problems of insufficient demand due to low domestic
savings and reluctance of foreign investors (Earle, Frydman, and Rapaczynski, 1993; Boycko,
Shleifer, and Vishny, 1994). These programs were intended to jump-start domestic equity
markets with a rapid release of shares, but they run the risk of highly dispersed ownership
16 See Earle and Estrin (1996) for a comparative discussion. The fraction obtained by insiders in Romanian MEBOs was frequently 100 percent, as the POFs often sold their shares simultaneously with the SOF.

9
structures. This problem was normally addressed through the creation of intermediaries, either
by the state as part of the program (e.g., in Poland) , or by private parties competing for
individuals’ vouchers (e.g., in Czechoslovakia). Although there has been little empirical
evidence on the effects of these programs, a number of authors have been highly critical of them
(Stiglitz, 1999; Black, Kraakman, and Tarrassova, 2000; Kornai, 2000; and Roland, 2001).
The Romanian mass privatization program (MPP), carried out in 1995-96, provides an
opportunity to analyze a rather extreme form of voucher privatization; one that ensured maximal
dispersion of ownership by prohibiting the trading of vouchers and the formation of
intermediaries. The potential benefits of the program may also have been reduced by the large
stake kept by the state: in most companies included in the program, only 60 percent of the shares
were offered. In those deemed strategic, which tended to be relatively large firms, the figure was
only 49 percent. Even these percentages were reached in very few companies, due to the
peculiar asymmetry in the treatment of excess demand and excess supply in the allocation
procedure. Oversubscription resulted in pro rata allocation, while undersubscription resulted in
untransferred shares.17 As Table 2 shows, a total of 1,727 industrial firms were included in the
program, with a mean of 24.5 percent and a median of 18.4 percent privatized; only about one-
sixth of the firms in the program were majority privatized.
The consequence of the MPP was inevitably an ownership structure heavily dominated
by the state, which usually retained a majority stake, with a highly dispersed group of private
owners. The possibility for a positive impact of this program on firm performance would rest on
some indirect mechanism: either through secondary sales leading to increased private ownership
17 Earle and Telegdy (1998) analyze details of the MPP procedures. The relevant law, No. 55/1995, refers to the acceleration of the privatization process in both its title and text. The full law can be found in Romanian Development Agency (1996).

10
concentration, through share trading increasing information about firm performance and
therefore improving managerial incentives,18 or through some complementarity with other
owners, particularly blockholders that purchased shares through a direct sale. In such cases, the
MPP may still have had a positive effect, despite its design.
Shares allocated in the MPP were taken from the portfolios of both the SOF and the five
POFs, but the POFs could regain some shares if citizen-participants in the MPP exercised their
option to place their vouchers with them. On average, the POFs were net losers from this
procedure by the program’s design. As shown in Table 3, their mean share dropped from 23.8
percent at the end of 1995 to 9.2 percent a year later. Both before and after the MPP, the POFs
also sold shares from their portfolios, resulting in a reduction of their stake to only 8.1 percent by
the end of 1998. Frequently, such sales were organized in conjunction with SOF privatization
sales.
2.5 Privatization through Sales to Outsiders
The third major privatization method employed in Romania involved case-by-case sales
of large blocks of shares to outside investors. The most important method was closed-bid tender,
in which not only the price offer but also the business plan, investment and employment
promises, and other considerations were taken into account by the SOF in selecting the buyer.
These considerations are frequently reflected in provisions of the privatization contract that
restrict post-privatization behavior, as in the MEBO privatizations (Negrescu, 2000). Although
Romanian policymake rs may have considered themselves constrained politically to ensure
continued employment and operation of the firms, such restrictions could have reduced
18 After the MPP, most of the companies were listed on either the Bucharest Stock Exchange or RASDAQ, the over-the-counter market in Romania.

11
restructuring in the companies privatized through block sales , and thus decreased the potential
benefits of privatization.19
Moreover, the sales method has intrinsic problems that tend to make it slow and
uncertain. Multi-criteria tenders naturally involve a lack of transparency in the process, because
there are no announced or pre-determined weights for the various aspects of the bid and potential
participants are left guessing about the trade-offs among them. The bids are not publicly
revealed after the tender, making it difficult to monitor the SOF’s decisions. Because of the lack
of an objective criterion and the nontransparency of the process, the selection decision can be
easily manipulated, creating the appearance—if not always the reality—of corruption. Indeed,
even a perfectly clean process organized by honest, well-intentioned bureaucrats is subject to
corruption charges, because there is little defense against allegations of favoritism. Opposition
parties are quick to exploit the possibility, and government bureaucrats, fearing charges of
corruption and with few incentives to privatize aggress ively, tend to act very cautiously. Of
course, the problems are magnified to the extent that some of the bureaucrats are less than honest
and act as rent-seekers both by taking bribes in the privatization process and by colluding with
the enterprise managers to strip assets before privatization. Political battles may also erupt over
the fulfillment of the contractual restrictions, resulting in cancellation of privatization contracts
and renationalization of firms.20 The cumulative effect is to further reduce demand and make
sales more difficult as potential investors become more reluctant to participate in an uncertain
environment.
19 Unfortunately, our database does not permit us to measure these restrictions for each company separately. 20 Our database shows that annulments of transactions are much more common for sales than for MEBOs, and that they are non-existent for MPP transfers.

12
These difficulties are reflected in the slow pace of privatization through sales in Romania,
which has been similar to the experience of most other transition economies. 21 Nonetheless, the
data contain a sufficient number of observations on sales to permit an evaluation of their impact
on firm performance. As shown in Table 2, 473 firms underwent large-block sales by the end of
1998. Most of these blocks were quite large, with an average of 53.8 percent and a median of
50.9. Out of these firms, 246 had majority outside ownership. In 12.6 percent of the firms,
blockholders were the largest—although not necessarily majority—type of owner (Table 4).22
2.6 Summary of Post-Privatization Ownership and Corporate Governance
This analysis of ownership results shows that the state’s share in the corporatized
industrial companies had fallen to 36.3 percent on average by the end of 1998. Most of the
companies with private ownership became majority private. The most prevalent types of owners
were employees, with 23.6 percent on average, and participants of the Mass Privatization
Program, with 18.2 percent on average. Concentrated outsiders were present in 473 companies,
or 20 percent of the sample, and the average stake in this group of firms was a majority. In more
than three-quarters of all firms, the SOF retained some ownership stake; within this group, the
average state share was quite high, at 46.9 percent. The heterogeneity of the Romanian
privatization methods thus produced an interesting testing ground for examining the impact of
alternative ownership structures on firm performance.
Our discussion has also presented reasons why privat ization in Romania may have had
little or no effect, or at least fewer benefits than if it had been optimally designed. Each of the
21 Eastern Germany, Hungary, and Estonia, each of which had clear advantages in selling to outsiders, are partial exceptions to the generally slow rate of privatization through sales in transition economies. The pace was criticized even in these three countries, however. 22 The buyers were both domestic and foreign. Domestic investors bought shares in 378 companies and foreigners in 98, with an average holding of 52.7 and 56.6 percent, respectively. Earle and Telegdy (2001) contains more discussion of domestic and foreign ownership.

13
privatization methods created possible corporate governance problems (e.g., insider control,
dispersion of shareholdings, and contractual restrictions) that might have blocked or reduced the
new owners’ incentives to restructure and raise productivity. An additional factor that could
have weakened the impact of any form of privatization is the general business environment. If
property rights are not respected and enforcement of contracts and corporate governance rules is
poor, the new owners may expect little return from their investments and restructuring efforts.23
The business environment in Romania has been frequently criticized; for instance, in its regular
grading of “institutional performance” in the transition economies, the EBRD (2000, p. 21)
awarded Romania a score only slightly ahead of Russia and well behind Hungary, Poland, and
the Czech Republic. None of these economies were considered to have reached “a standard that
would not look out of place in an industrialized market economy” (p. 16). Privatization under
such conditions, even sales of large blocks to outsiders, may not yield substantial benefits. The
question can only be decided through empirical analysis.
3. ESTIMATION FRAMEWORK
Our empirical strategy follows the broader literature in estimating reduced form equations
for firm performance as a function of ownership, while taking into account potential problems of
heterogeneity, both observed and unobserved, and simultaneity bias. Using a model for panel
data in which i indexes firms and t indexes years, we estimate equations of the following form:
Pit = β0 + β1OWNit + β2Xit + uit, (1)
23 See Anderson, Lee, and Murrell (1999) for this argument with respect to Mongolia. Black, Kraakman, and Tarrassova (2000) claim that privatization in a poor institutional environment actually increased asset-stripping and worsened firm performance in Ru ssia.

14
where Pit is a measure of firm performance, OWNit captures the ownership structure, sometimes
as a vector of variables, Xit is a vector of covariates, and uit is a residual.
Our measure of firm performance in this paper is the annual growth of labor productivity;
the ratio of real sales to average employment.24 While it might seem desirable to use other
performance indicators, such as profitability, Tobin’s Q, or total factor productivity, the available
data do not permit us to measure these variables. Without a measure of the capital stock or other
inputs, we cannot estimate total factor productivity, nor do we have profits, return to assets, or
stock market value. These indicators suffer from severe measurement problems in the transition
context , however due to the arbitrary valuation of the capital stock acquired during the socialist
period, the ubiquitous hiding of profits, and underdevelopment of stock markets. Moreover,
labor productivity growth has the advantage of reflecting changes in the capital stock due to
investment, which may itself demonstrate superior performance in the poorly functioning capital
market environment of Eastern Europe. Specifying the dependent variable as a growth rate
serves to difference away any fixed firm-specific characteristics, such as superior technology or
larger initial capital stock, that affect the level of labor productivity. We also control for
industry, size, and the lagged level of labor productivity to account for other differences across
firms, such as in capital-labor ratios. In some specifications we also include firm fixed-effects or
group-effects for ownership types.
Table 5 presents summary statistics for the levels of average employment, real value of
sales in thousands of 1992 lei, and labor productivity. According to these data, average
24 The level or growth of labor productivity is commonly used in studies of firm performance; see, e.g., Anderson, Lee, and Murrell (2000), Boubakri and Cosset (1998), Carlin et al. (2001), Claessens and Djankov (1999a,b), Djankov (1999b,c), D’Souza and Megginson (1999), Earle (1998), Earle and Estrin (1997), Frydman et al. (1999), Megginson, Nash, and van Randenborgh (1994), Pohl et al. (1997), and Weiss and Nikitin (1998). Total factor productivity equations that include book values of the capital stock are estimated by Anderson, Lee, and Murrell (2000), Claessens, Djankov, and Pohl (1997), Piesse and Thirtle (2000), and Smith, Cin, and Vodopivec (1997).

15
employment in industrial enterprises dropped every year by 8 to 17 percent, except for 1996,
when the fall was around 4 percent. Over the whole period, the cumulative drop was 55.7
percent on average. The real value of sales and labor productivity displayed much more volatile
patterns, rising in some years and falling in others.
Next we turn to the specification of the ownership structure, OWNit. Our analysis of the
Romanian privatization programs in the previous section suggests several alternative ways of
specifying the ownership variables. A first approach is based on the proportion of shares in
private ownership.25 In this linear specification, an estimate of β1 refers to the average impact of
an increase in private shareholding on firm performance. An alternative specification involves a
threshold or critical level of private ownership, below and above which an increase in private
shareholding has zero marginal impact. A natural candidate for the threshold is majority private
ownership. In these definitions, we do not treat the shareholdings of the POFs as private , but
rather combine them with SOF ownership, for the reasons discussed in the previous section.26
In other specifications of the ownership structure, we distinguish different types of new
private owners: employees, mass privatization participants, and investors who purchase blocks of
shares. We treat POF ownership as a separate group, while another category represents
unidentifiable owners in the database who have very small shareholdings on average. We
specify these ownership types by their percentage shareholdings in some specifications, and with
respect to a shareholding threshold, here defined as the largest type of owner, in others. 27
25 All the firms in the SOF portfolio, and therefore in our database, are share companies. 26 The ownership variables take into account any privatization transactions that occurred during the preceding year; thus, OWN it refers to the ownership structure on January 1 of year t. This date falls at the exact midpoint of the period of growth measured by th e dependent variable, labor productivity growth, since the latter is calculated using total sales and average employment for year t relative to year t-1. 27 This specification is similar to that estimated by Frydman et al. (1999), and it differs from the dominant ownership approach of Earle and Estrin (1997) and others, which requires that the dominant shareholding exceed some minimum stake, e.g., 40 percent.

16
Turning to the control variables, Xit, we are interested in accounting for heterogeneity in
performance, Pit, that may also be correlated with our variables of interest, OWNit. The first
problem involves mismeasurement in labor productivity due to firms differing systematically
with respect to their production functions, levels of investment, and capital-labor ratios. This
suggests that industry effects and firm size should be included, and we specify 14 industrial
categories and measure size by employment, lagged to avoid endogeneity problems. Firms may
also differ in their set-up costs, quality of equipment, and technology. These characteristics are
likely to be correlated with industry and size, and we also include the lagged level of labor
productivity in Xit and, in some specifications, firm-specific fixed effects.28
A second problem involves initial conditions and the magnitude of the demand shock
faced by the firm, as the state cut its orders drastically and customer and supply chains broke
down (Blanchard and Kremer, 1997). Firms with better initial conditions may have been
cushioned from the impact of competition, while those facing greater shocks may have had
proportionately greater difficulty adjusting and maintaining productivity due to the costs of
laying off workers and unbundling equipment. These shocks may be correlated with industry
and region, and they are likely to vary across years. We include year, industry, and region
effects, under the assumption that these may be correlated with unobserved shocks to a firm’s
productivity. It is frequently argued that larger firms face more difficult adjustments, thus lagged
employment is useful here as well. The region effects may also reflect market conditions in the
firm’s environment. For declining firms, particularly, maintaining productivity may be easier
28 The lagged level of productivity is frequently included in productivity and productivity growth equations, e.g., Anderson, Lee, and Murrell (2000); Earle (1998); Frydman et al. (1999). Another argument for including it is the possibility that it is more difficult, other things being equal, to increase productivity if it is already high.
17
when the industry and region is growing because this facilitates the release of workers and
capital to other firms. Finally, the region effects may account for differences in relative input
prices that could lead to different allocation of factors of production within firms.29
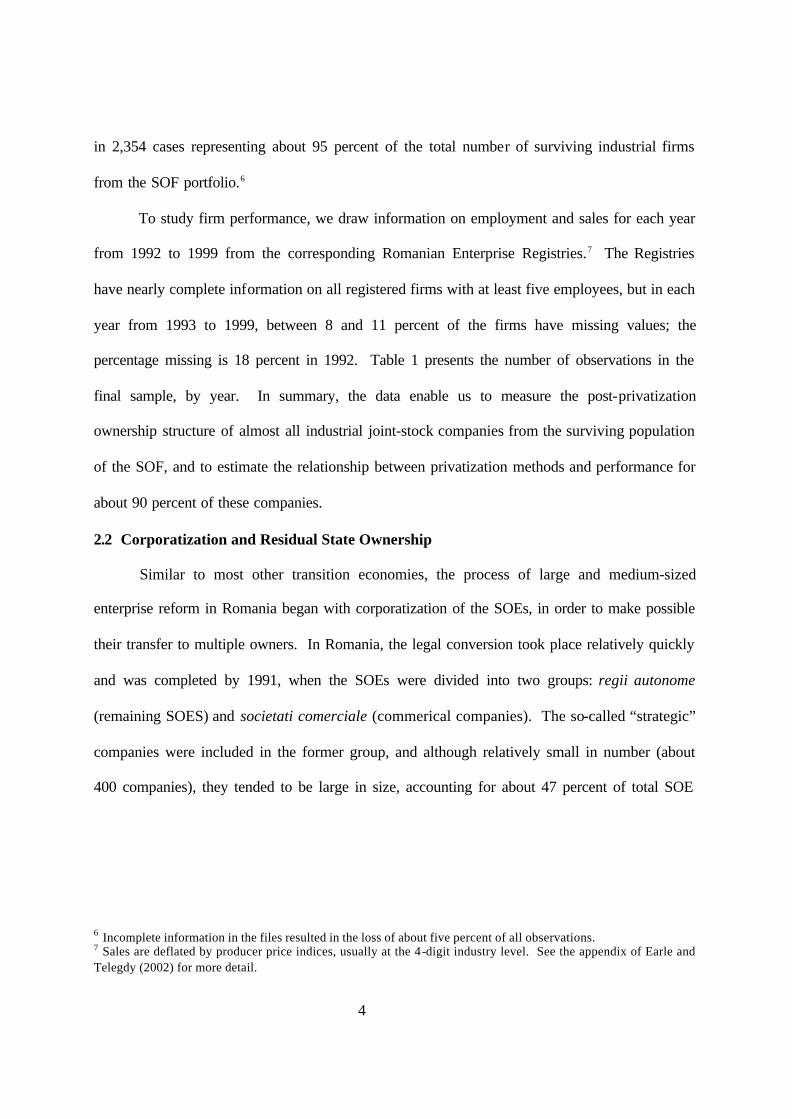
With these specifications of the dependent variable, of the post -privatization ownership
structure, and of the set of controls, the basic estimating equation focusing on private
shareholdings is the following:
Log(Sit/Eit)–Log(Sit-1/Eit-1) = β0 + β1PrivateShareit + β2Log(Sit-1/Eit-1) + β3LogEit-1
+ ΣtβtYEARt + ΣjβjINDij + ΣkβkREGik + uit, (2)
where Sit is sales of firm i in year t, Eit is the corresponding employment, YEARt represent year
effects (t = 1993,...,1999), INDij are industry effects (j = 1,..,14), REGik are region effects (k =
1,...6), β is a vector of parameters to be estimated, and uit reflects unmeasured factors.
When ownership shares are disaggregated by type, the estimating equation becomes:
Log (Sit/Eit)–Log (Sit-1/Eit-1) = β0
+ β11OutsideShareit + β12InsideShareit + β13MassShareit + β14OtherShareit + β15POFShareit
+ β2Log(Sit-1/Eit-1) + β3LogEit-1 + ΣtβtYEARt + ΣjβjINDij + ΣkβkREGik + uit, (3)
where the sum of the share variables plus the omitted state shareholding equals one.
Even with such controls, it is possible that there is still some unmeasured heterogeneity
correlated both with ownership and performance. To take this into account, we also estimate
equations 2 and 3 including firm fixed-effects. In these models, the estimates of β1 and β11 to β15
reflect the effects of the within-firm variation of ownership by permitting each firm to have a
29 To assess the necessity of including these firm characteristics in the performance equation, we regress the share ownership variables on groups of industry, region, size-category, and year dummies. Each group of dummies was jointly significant in every equation, nearly always at the 1 percent significance level, suggesting the importance of including them as controls. Concerning industrial affiliation, the data show higher rates of privatization in the food, printing and publishing, furniture, footwear, textile, and other sectors of light industry. Lower rates of privatization are found in heavy industrial sectors such as mining, wood, chemicals, metallurgy, and machine building.
18
separate intercept. Thus, any systematic variation across firms in the rate of its labor
productivity growth will not contaminate the parameter estimates. The firm fixed-effects also
help to control for possible endogeneity of ownership, which may be due to a tendency for firms
with higher productivity growth to be privatized. As long as the unobserved component of
productivity growth associated with the privatization propensity is fixed over time, the inclusion
of firm effects controls for selection bias.
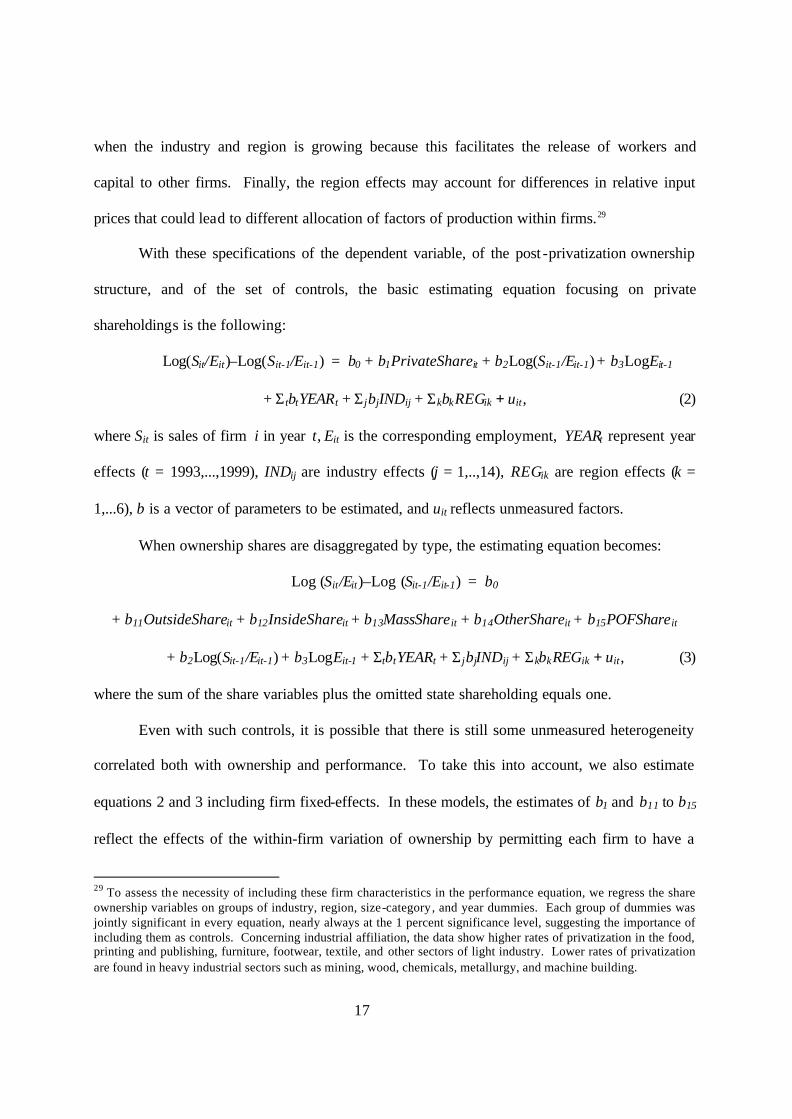
We also estimate analogous equations with dummies representing majority privatized
(PrivateDummy, defined as = 1 if PrivateShare > .5) or largest non-state owner (OutsideDummy,
InsideDummy , MassDummy , OtherDummy , and POFDummy ). In these models, we include
group effects in the equations. For example, the variable PrivateEver indicates whether the firm
ever became majority private during the entire sample period. Thus, the estimating equation is:
Log (Sit/Eit)–Log (Sit-1/Eit-1) = γ0 + γ00PrivateEveri + γ10PrivateDummy it
+ γ2Log(Sit-1/Eit-1) + γ3LogEit-1 + ΣtγtYEARt + ΣjγjINDij + ΣkγkREGik +vit, (4)
where γ is a vector of parameters to be estimated, and vit represent the residuals associated with
this specification of ownership. Note that PrivateDummyit is nested in PrivateEveri, so that the
estimated coefficient on PrivateDummyit reflects the impact of becoming majority privately
owned relative to pre-privatization performance.
The analogous equation for the disaggregated case with largest owner dummies is:
Log (Sit/Eit)–Log (Sit-1/Eit-1) = γ0 + γ01OusideEveri + γ02InsideEveri
+ γ03MassEveri + γ04OtherEveri + γ05POFEveri+ γ11OusideDummyit + γ12InsideDummyit
+ γ13MassDummyit + γ14OtherDummyit + γ15POFDummyit
+ γ2Log(Sit-1/Eit-1) + γ3LogEit-1 + ΣtγtYEARt + ΣjγjINDij + ΣkγkREGik + vit, (5)

19
where the group effects (OusideEveri, etc.) are constant over time, analogously to PrivateEveri.
This method imposes a stronger restriction than the firm fixed-effects specification, but it also
has the advantage of permitting some inferences to be drawn concerning the pre-privatization
performance of firms that are privatized subsequently. For example, in equation (4), γ00
represents the difference between the productivity growth of firms that have not yet been
privatized but will be in the future, and the productivity growth of firms that are never privatized
within our sample period. If better performing firms tend to be privatized, γ00 should be positive.
On the other hand, γ10 represents the post-privatization change in labor productivity growth
relative to the pre-privatization growth rate of firms that are eventually observed to be privatized.
If privatization is pure selection, γ10 should be zero. In equation (5), the parameters (γ01,...,γ05)
represent the labor productivity performance of the firm prior to its acquisition by the given
owner-type, relative to firms remaining in state ownership. The group effects may be interpreted
as estimates of the selection bias into each ownership category, while the coefficients on the
largest owner dummies (γ11,...,γ15) reflect the change in performance associated with ownership
change.
Our efforts to control for selection bias notwithstanding, the possibility remains that some
dynamic selection mechanism exists, whereby firms with greater possibilities for raising
productivity growth have greater or smaller probabilities of being privatized and of being
acquired by different types of private owners. Such a selection mechanism could result in biased
estimates if there is some characteristic of firms, for example their quality, that is observable to
buyers or to the SOF but not to the researcher. This characteristic cannot relate to either the level
or growth of labor productivity, because such an effect would be eliminated by the firm fixed-
effects in a growth equation. Rather, the characteristic must accelerate productivity, and it must

20
be independent of all of our control variables, if it is to create selection bias. Such a selection
mechanism may seem implausible, but it would be desirable to check for it if data were available
to instrument changes in the ownership structure. Instruments would need to be correlated with
ownership change but not with labor productivity growth, which is difficult to satisfy.
Unfortunately, our analysis uses all the variables in our database and we have no appropriate
instruments for such an investigation. All studies of privatization and firm performance,
including studies that treat selection bias through fixed effects, face this problem. The possibility
of such a dynamic selection mechanism should be considered in interpreting results.30
A final issue concerns measurement error. Although we have carefully constructed and
cleaned our data, some significant outliers remain. We cannot be sure whether these represent
true differences across firms or simply noise associated with most large firm-level databases.
Moreover, the fixed-effects procedure that we employ in some specifications is especially
sensitive to measurement error, because within-firm estimates may exacerbate the noise-to-
signal ratio. For these reasons and to establish the robustness of our results, we estimate all
equations using both ordinary least squares (OLS) and least absolute deviations (LAD) or
median regressions. This latter procedure puts equal weight on all observations regardless of
how far they lie from the regression line; hence, large outliers do not influence the estimates as
much as in OLS.
30 Smith, Cin, and Vodopivec (1997) use contemporaneous financial indicators, namely exports, sales, profits, wage bonus, and debts, to instrument employee and foreign ownership in total factor productivity regressions. Anderson, Lee, and Murrell (2000) exploit details of the privatization process to instrument ownership in Mongolia, and Earle (1998) instruments ownership with privatization method and other variables in Russia. None of these studies use group- or fixed-effects.

21
4. EMPIRICAL RESULTS
We first examine the association between ownership and productivity growth, starting
with simple descriptive statistics and tests of differences of means across ownership categories.
Table 6 pools the data across years, treating each firm-year as an independent observation, and
reports the mean productivity growth by dominant owner. State and Private refer to majority
ownership, while the disaggregated private groups (i.e., Outside, Inside, and Mass) are classified
according to their largest private owner type. Firm-year observations in which the state was
majority owner tend to have a productivity decline of –0.024 at the mean. Privatized firms tend
to have a productivity increase of 0.012 on average. This difference is statistically significant at
the 1 percent level. Concerning disaggregated private categories, both inside - and mass-owned
firms experience average productivity declines of –0.007 and –0.014, respectively, but the
differences from state-owned firms are not statistically significant. Firm-year observations in
which the dominant owner was an outside blockholder, however exhibit increased labor
productivity by an annual average of about 13 percent, and the difference with state ownership is
highly significant.
These descriptive statistics take no account of possible omitted variables and selection
biases in estimating the performance-ownership relationship. Before turning to the regression
estimates in which other factors are included as controls, we look for evidence of selection bias.
For example, this may arise if more efficient firms are privatized more easily and have a higher
probability of obtaining active owners (e.g., concentrated external investors). A first test of
possible selection bias is reported in Table 7, where we report the pre-privatization productivity
growth rates for firms that are subsequently privatized and compare these with the growth rate
for firms never privatized within our observation period. The first column of the table contains

22
the average annual productivity growth for firms that never became majority private, while the
other columns refer to firm-year observations previous to becoming majority private, or previous
to becoming dominated by a particular type of owner, using the same categories and definitions
as in Table 6. The mean growth rates lie in a narrow range, from –0.032 to 0.008, and the t-test
of the difference in the means relative to the category of “never majority private” is never
significant. The small differences in the means for firms that subsequently became outside
investor-owned are particularly striking compared with the differences in their post-privatization
performance reported in Table 6. This basic test reveals no evidence of selection bias in the
privatization process.
In the regression results, we control for third factors that may influence both firm
performance and ownership. Table 8 examines the effect of the private share on productivity
growth, based on equation (2) estimated using OLS, LAD, and fixed-effects. Private
shareholding is estimated to have a positive and statistically significant effect on productivity
growth in every equation. The point estimate varies between 0.102 and 0.167, depending on the
estimation method employed. 31
These results refer to the average effect of privatizing an additional one percent of the
firm’s shares, without distinguishing the type of new private owner. Table 9 contains estimates
of equation (3), which disaggregates private ownership shareholdings into several subcategories.
Each type of private shareholding is estimated to have positive effects that are statistically
signif icant at the 1 percent level. The inside and mass privatization coefficients range from
31 We focus on results concerning our variables of interest, because the others are only control variables and not the focus of this paper. However, we should emphasize that the results are robust to changes in the specification. To check whether the results are sensitive to measurement error that creates spurious correlation between the dependent variable and either lagged productivity or lagged employment, we experimented with including two-period rather than one-period lags and dropping one or both variables from the regression. None of these alternative specifications produced qualitatively different results for the ownership effects from those reported.

23
0.108 to 0.190 across specifications, but the difference between the estimated effects of these
two types is not large or statistically significant. Moreover, their relative ranking varies across
specifications: in the OLS and fixed-effects models the coefficient of MassShare is larger, while
in the LAD regression InsideShare has a larger coefficient. However, outside blockholder shares
have by far the largest coeffic ients in every equation, ranging from 0.274 to 0.392. The
differences between the estimated effects of OutsideShare and the other types of private
ownership are large in every equation, and they are always statistically significant at the 1
percent level.
Tables 10 and 11 report the results of the models in which ownership is specified as a
categorical variable and in which we also include group effects. The estimates of equation (4) in
Table 10, which contain a dummy variable for majority private ownership (PrivateDummy) and
the group effect (PrivateEver), demonstrate a positive, statistically significant effect of majority
privatization. The point estimates imply 8.4 percent higher productivity growth for the OLS and
6.6 percent higher in the LAD regression for majority privatized firms relative to their pre-
privatization performance. The estimated coefficient of PrivateEver is also positive and
significant in both specifications, indicating a higher pre-privatization growth rate of firms
subsequently majority privatized relative to those never majority privatized. The estimated
coefficients are only one-third to one -half the size of those on PrivateDummy, however
suggesting that selection effects have a much smaller impact than privatization. 32
Estimates of equation (5), including dummies and group effects for disaggregated largest
owner-types, are reported in Table 11. In both the OLS and LAD models, the group effects for
insider privatization suggest that firms with higher pre-privatization productivity growth rates are
32 We also estimated equation (6) replacing the group effect with firm fixed-effects, resulting in an estimate coefficient (standard error) of 0.121 (0.012) on PrivateDummy.

24
more likely to be privatized by the MEBO method: InsideEver has positive, significant estimated
coefficients in both regression models. Only the OLS model provides evidence of higher pre-
privatization productivity growth in OutsideEver, however. Notwithstanding the presence of
these group effects, the results are fully consistent with those for share ownership. Outside
blockholders are estimated to have the largest impact on productivity growth relative to their pre-
privatization performance, while the effects of insider and mass participants are smaller but still
positive.33 Among the identified owner-types, OutsideDummy has the largest coefficients, and
InsideDummy and MassDummy coefficients are smaller, while all are highly statistically
significant.34 All forms of privatization appear to dominate continued state ownership. As we
have indicated, these results are highly robust to changes in the model specification.
5. CONCLUSION
The debates over the effects of privatization on firm performance, which privatization
method works best, and which type of owner is most likely to carry out restructuring have been
lengthy and impassioned. Yet there are remarkably few studies analyzing the privatization-
performance relationship using panel data from a large sample of firms containing information
for periods both before and after privatization. Given that privatization policies are typically so
prominent and controversial, we know remarkably little about their outcomes in the transition
economies. Among these economies, Romania offers an interesting testing ground for two
reasons. First, we have been able to construct a data set containing high quality and nearly
33 We also re-estimated equations (4) and (5) with a sample excluding firms privatized in 1998, so that only firms with at least two years of post-privatization observations were included. This exercise produced very similar results to those reported in Tables 10 and 11. 34 Estimating equation (5) with firm fixed-effects resulted in a somewhat higher outside and inside dummy coefficient, 0.191 and 0.101 respectively, and only trivial differences for the mass and POF dummy coefficients relative to Table 11. OtherDummy has the largest estimated impact in the OLS estimates, although not in LAD estimates, possibly because of the outside investor ownership discussed in Section 2.

25
complete information on the privatization process for corporatized industrial enterprises.
Second, variants of all of the major types of privatization policies are represented, resulting in an
ownership structure with significant stakes held by employees, dispersed and concentrated
outsiders, and the state.
Our analysis of the effects of Romania’s privatization policies on industrial enterprises
had three elements: the ownership structure resulting from privatization, the corporate
governance characteristics of privatized firms, and the association of ownership structure with
enterprise productivity performance. The description of the ownership structure represents the
first comprehensive picture of the impact of privatization in the Romanian industrial sector. We
find that the state retained a dominant role in many Romanian firms through the end of 1998; in
more than three-quarters, the SOF kept a positive ownership stake, and the average stake was
46.9 percent within this group. Only a slight majority (53.8 percent ) of the firms originally
slated for privatization in 1992 had become majority private by 1998. The most prevalent types
of new private owners were insiders/employees, holding 23.6 percent on average, and
participants of the Mass Privatization Program, with 18.2 percent on average. Concentrated
outsiders were present in only 473—or 20 percent—of the companies, but the average ownership
stake in this group of firms was a majority.
The discussion of the privatization methods and their ownership outcomes indicated
possible corporate governance problems that might have reduced the potential benefits of
privatization in Romania. The analysis led us to hypothesize that sales to outside blockholders
were most likely to have raised firm efficiency, but even these investors may be handicapped in
restructuring efforts by contractual restrictions and other impediments posed by Romanian
policies and business environment. We also hypothesized that firms bought by their employees

26
may exhibit lower productivity performance due to the pursuit of non-value-maximizing
objectives, difficulties in raising capital, and the continued role of the state through the
institutional design of the MEBO privatization process. Finally, the highly dispersed ownership
structure resulting from the mass privatization suggests that MPP participants may be unlikely to
contribute much to corporate governance, although secondary transactions might have created
some concentration. The weakness of these latter two programs raises the question of whether or
not they led to any improvements in firm performance, relative to continued ownership by the
state. Given that most Romanian privatization was either MEBO or MPP, a corollary question is
whether privatization in Romania has made any difference on average.
Our empirical findings provide strong evidence that, despite the corporate governance
problems resulting from peculiarities in its design, privatization has had a positive and
substantial effect on the growth of labor productivity in Romania. The statistical significance of
these effects remains highly robust across alternative equation specifications and estimation
methods. Our work strongly supports the proposition that outside blockholders are the most
effective owners of privatized companies. More surprisingly, the estimated regression
coefficients on disaggregated outsider owners (MPP participants) and on insiders (MEBO
participants) are also positive and statistically significant. Thus, the data provide evidence that
even insiders and dispersed outside owners have a positive impact relative to continued state
ownership, although these point estimates are distinctly and statistically significantly smaller
than those of the outside blockholders.35
35 Our ownership measures pertain only to the results from privatization transactions, and we do not observe subsequent secondary sales of shares. Perhaps the employees and other individuals acquiring small quantities of shares through these programs sold them quickly so that some concentrated owners emerged subsequently.

27
This evidence implies that privatization has been surprisingly successful in Romania—for
the firms that have been privatized. For the others, the results suggest that waiting has been
deleterious. Given the large remaining state shareholdings, our analysis would recommend a
further stage of what the Romanian government has been wont to call “acceleration.”

28
REFERENCES
Anderson, James H., Lee, Young, and Murell, Peter, “Competition and Privatization Amidst
Weak Institutions: Evidence from Mongolia.” Economic Inquiry 38, 4:527–549, October
2000.
Black, Bernard, Kraakman, Reiner, and Tarrasova, Anna, “Russian Privatization and Corporate
Governance: What Went Wrong?” Stanford Law Review 52 , 6:1731–1808, July 2000.
Blanchard, Olivier, and Kremer, Michael, “Disorganization.” Quarterly Journal of Economics
112, 4:1091–1126, November 1997.
Bonin, John P., Jones, Derek C., and Putterman, Luis, “Theoretical and Empirical Studies of
Producer Cooperatives: Will Ever the Twain Meet?” Journal of Economic Literature 31,
3:1290–1320, September 1993.
Boubakri, Narjess, and Cosset, Jean-Claude, “The Financial and Operating Performance of
Newly Privatized Firms: Evidence from Developing Countries.” Journal of Finance 53,
3:1081–110, June 1998.
Boycko, Maxim, Shleifer, Andrei, and Vishny, Robert W., “Voucher Privatization.” Journal of
Financial Economics 35, 2:249–266, April 1994.
Carlin, Wendy, Estrin, Saul, and Schaffer, Mark E., “Measuring Progress in Transition and
Towards EU Accession. A Comparison of Manufacturing Firms in Poland, Romania and
Spain.” Journal of Common Market Studies 38 , 5:699-728, December 2000.
Carlin, Wendy, Fries, Steven, Schaffer, Mark E., and Seabright, Paul, “Competition and
Enterprise Performance in Transition Economies: Evidence from a Cross -Country
Survey.” Discussion Paper No. 2840. London: CEPR, June 2001.
29
Claessens, Stijn, and Djankov, Simeon, “Enterprise Performance and Management Turnover in
the Czech Republic.” European Economic Review 43, 4-6:1115–1124, April 1999a.
Claessens, Stijn, and Djankov, Simeon, “Ownership Concentration and Corporate Performance
in the Czech Republic.” Journal of Comparative Economics 27 , 3:498–513, September
1999b.
Claessens, Stijn, Djankov, Simeon, and Pohl, Gerhard, “Determinants of Performance of
Manufacturing Firms in Seven European Transition Economies.” Working Paper No. 74.
Ann Arbor: Davidson Institute, February 1997.
Djankov, Simeon, “The Enterprise Isolation Program in Romania.” Journal of Comparative
Economics 27, 2:281–293 June 1999a.
Djankov, Simeon, “Restructuring of Insider-Dominated Firms.” Economics of Transition 7,
2:467–479, June 1999b.
Djankov, Simeon, “Ownership Structure and Enterprise Restructuring in Six Newly Independent
States.” Comparative Economic Studies 41 , 1:75–95 Spring 1999c.
Djankov, Simeon, and Murrell, Peter, “Enterprise Restructuring in Transition: A Quantitative
Survey.” Working paper, http://papers.ssrn.com/sol3/papers.cfm?abstract_id=238716.
November 2000.
D’Souza, Juliet, and Megginson, William L., “The Financial and Operating Performance of
Newly Privatized Firms in the 1990s.” Journal of Finance 54 , 4:1397–1438, August
1999.
Earle, John S., “Post-Privatization Ownership Structure and Productivity in Russian Industrial
Enterprises.” Working Paper No. 127. Stockholm: SITE, 1998.

30
Earle, John S., and Estrin, Saul, “Employee Ownership in Transition.” In Roman Frydman,
Cheryl W. Gray, and Andrzej Rapaczynski, Eds., Corporate Governance in Central
Europe and Russia. Insiders and the State, pp. 1-61. Budapest: World Bank and CEU
Press, 1996.
Earle, John S., and Estrin, Saul, “After Voucher Privatization: The Structure of Corporate
Ownership in Russian Manufacturing Industry.” Discussion Paper No. 1736. London:
Centre for Economic Policy Research, December 1997.
Earle, John S., Frydman, Roman, and Rapaczynski, Andrzej, “Notes on Voucher Privatization
Programs in Eastern Europe.” In Donald E. Fair and Robert J. Raymond, Eds., The New
Europe: Evolving Economic and Financial Systems in East and West, pp. 15-40.
London: Kluwer Academic Press, 1993.
Earle John S., and Sapatoru, Dana, “Privatization in a Hypercentralized Economy: The Case of
Romania.” In John S. Earle, Roman Frydman and Andrzej Rapaczynski, Eds.,
Privatization in the Transition to a Market Economy: Studies of Preconditions and
Policies in Eastern Europe, pp. 147-170. London: Pinter Publishers, and New York: St.
Martin’s Press, 1993.
Earle John S., and Sapatoru, Dana, “Incentive Contracts, Corporate Governance, and
Privatization Funds in Romania.” Atlantic Economic Journal 22, 2:61–79, June 1994.
Earle, John S., and Telegdy, Álmos, “The Results of ‘Mass Privatization’ in Romania: A First
Empirical Study.” Economics of Transition 6 , 2:313–332, November 1998.
Earle, John S., and Telegdy, Álmos, “Privatization Methods and Productivity Effects in
Romanian Industrial Enterprises.” Working Paper. Budapest: CEU Labor Project, 2002.

31
Earle, John S., and Telegdy, Álmos, “Privatization and Productivity in Romanian Industry:
Evidence from a Comprehensive Enterprise Panel.” IZA Discussion Paper No. 326.
Bonn: Institute for the Study of Labor, July 2001.
Ellerman, David, “Management and Employee Buy-Outs in Central and Eastern Europe:
Introduction.” In David Ellerman, Ed., Management and Employee Buy-Outs as a
Technique of Privatization, pp. 13-30. Ljubljana: Central and Eastern European
Privatization Network, 1993.
Estrin, Saul, Jones, Derek C., and Svejnar, Jan, “The Productivity Effects of Worker
Participation: Producer Cooperatives in Western Economies.” Journal of Comparative
Economics 11, 1:40–61, March 1987.
European Bank for Reconstruction and Development, Transition Report 2000: Employment,
Skills and Transition. London: European Bank for Reconstruction and Development,
2000.
Frydman, Roman, Gray, Cheryl W., Hessel, Marek, and Rapaczynski, Andrzej, “When Does
Privatization Work? The Impact of Private Ownership on Corporate Performance in the
Transition Economies.” Quarterly Journal of Economics 114 , 4:1153–1192, November
1999.
Frydman, Roman, and Rapaczynski, Andrzej, Privatization in Eastern Europe: Is the State
Withering Away? Budapest: Central European University Press, 1994.
Hansmann, Henry, “When Does Worker Ownership Work? ESOPs, Law Firms,
Codetermination, and Economic Democracy.” Yale Law Journal 99, 8:1749–1816, June
1990.

32
Konings, Jozef, “Competition and Firm Performance in Transition Economies: Evidence from
Firm Level Surveys in Slovenia, Hungary and Romania.” Discussion Paper No. 1770.
London: Centre for Economic Policy Research, December 1997.
Konings, Jozef, and Repkin, Alexander, “How Efficient are Firms in Transition Countries?
Firm-Level Evidence from Bulgaria and Romania.” Discussion Paper No. 1839.
London: Centre for Economic Policy Research, March 1998.
Kornai, Janos, “Ten Years after ‘The Road to a Free Economy:’ The Author’s Self-Evaluation.”
Economic Systems 24 , 4: 353–359, December 2000.
Lipton, David, and Sachs, Jeffrey D., “Privatization in Eastern Europe: The Case of Poland.”
Brookings Papers on Economic Activity 0, 2:293–333, 1990.
Megginson, William L., Nash, Robert, and van Randenborgh, Matthias, “The Financial and
Operating Performance of Newly Privatized Firms: An International Empirical Analysis.”
Journal of Finance 49 , 2:403–452, June 1994.
Megginson, William L., and Netter, Jeffry M., “From State to Market: a Survey of Empirical
Studies on Privatization.” Journal of Economic Literature 39 , 2:321–389, June 2001.
Munteanu, Costea, “Employee Share-Ownership in Romania: The Main Path to Privatization.”
In Milica Uvalic and Daniel Vaughan-Whitehead, Eds., Privatization Surprises in
Transition Economies: Employee-Ownership in Central and Eastern Europe, pp. 182-
203. Cheltenham, U.K./Lyme, N.H.: Elgar, 1997.
Negrescu, Dragos, “A Decade of Privatization in Romania.” In Christof Ruhl and Daniel
Daianu, Eds., The Economic Transition in Romania: Past, Present, and Future, pp. 375-
442. Bucharest : World Bank and Romanian Center for Economic Policies, 2000.

33
Piesse, Jenifer, and Thirtle, Colin, “A Stochastic Frontier Approach to Firm Level Efficiency,
Technological Change and Productivity during the Early Transition in Hungary.”
Journal of Comparative Economics 28 , 3:473–501, September 2000.
Pohl, Gerhard, Anderson, Robert E., Claessens, Stijn, and Djankov, Simeon, “Privatization and
Restructuring in Central and Eastern Europe: Evidence and Policy Options.” Technical
Paper No. 368. Washington, D.C.: World Bank, May 1997.
Roland, Gerard, “Corporate Governance and Transition Economies: Lessons from Transition.”
In Boris Pleskovic and Nicholas Stern, Eds., Annual World Bank Conference on
Development Economics 2000 , 331-352. Washington, D.C.: World Bank, 2001.
Romanian Development Agency, Law Digest for Foreign Investors. Bucharest: Romanian
Development Agency, 1996.
Romanian Development Agency, Romania, Yes! An Investment Guide 1997. Bucharest:
Roma nian Development Agency, 1997.
Smith, Stephen C., Cin, Beom-Cheol, and Vodopivec, Milan, “Privatization Incidence,
Ownership Forms, and Firm Performance: Evidence from Slovenia.” Journal of
Comparative Economics 25 , 2:158–179, October 1997.
Stiglitz, Joseph, “Whither Reform? Ten Years of the Transition.” Paper presented at the Annual
World Bank Conference on Development Economics,
http://www.worldbank.org/research/abcde/washington_11/stiglitz.html. Washington,
D.C.: World Bank, 1999.
Telegdy, Almos, Earle, John S., Kaznovsky, Victor, and Kucsera, Csaba, "Corporate Control of
Listed Firms: The Bucharest Stock Exchange." Eastern European Economics,
forthcoming.

34
Weiss, Andrew, and Nikitin, Georgiy, “Effects of Ownership by Investment Funds on the
Performance of Czech Firms.” Working paper. Boston: Boston University, July 1998.
Weitzman, Martin, “How Not to Privatize.” In Mario Baldassarri, Luigi Paganetto and Edmund
Phelps, Eds., Privatization Processes in Eastern Europe, pp. 249-269. New York: St.
Martin’s Press, 1993.

35
Table 1: Number of Firms with Complete Ownership, Employment and Sales Data
Year 1992 1993 1994 1995 1996 1997 1998 1999
Number of firms 1,931 2,074 2,115 2,134 2,179 2,183 2,202 2,168
Percent of firms 82.0 88.1 89.8 90.7 92.6 92.7 93.5 92.1
Total number of firms: 2,354.

36
Table 2: Post-Privatization Ownership Structure, End–1998 (percentage ownership conditional on a non-zero share in the firm)
Privatization method (owner-type)
Mean ownership (percent)
Median ownership (percent)
Number of firms with owner-type
Number of firms with majority ownership-
type
Sales (outside) 53.8 50.9 473 246
MEBO (inside) 64.9 70.6 858 519
Mass 24.5 18.4 1,747 296
Other 10.4 1.2 693 18
POF 20.1 18.6 941 32
State 46.9 50.9 1,822 935
Total number of firms: 2,354. Notes: “Sales (outside)” refers to outside investors who obtained their holdings through block sales, “MEBO (inside)” refers to employees who obtained shares through management -employee buyouts, “Mass” refers to individuals who obtained shares within the Mass Privatization Program, “Other” refers to owners not classifiable with available information, “POF” refers to Private Ownership Funds, and “State” refers to State Ownership Fund (SOF).

37
Table 3: Evolution of the Ownership Structure (average percentage at year-end)
Privatization Method / Owner-Type
1992 1993 1994 1995 1996 1997 1998
Sales (outside) 0.2 0.2 0.6 0.9 2.6 4.9 10.8
MEBO (inside) 0.2 3.0 9.6 17.5 21.3 22.1 23.6
Mass 0.0 0.0 0.0 0.0 18.2 18.2 18.2
Other 0.0 0.4 0.8 1.2 1.3 2.1 3.1
Total private 0.4 3.6 11.0 19.6 43.4 47.3 55.7
POF 29.8 28.7 26.4 23.9 9.1 8.7 8.0
State 69.7 67.7 62.6 56.5 47.5 44.0 36.3
N.B. Percentage of firms majority privatea
0.4 3.3 10.3 18.4 38.7 43.8 53.8
Number of firms: 2,354. Notes: “Sales (outside)” refers to outside investors who obtained their holdings through block sales, “MEBO (inside)” refers to employees who obtained shares through management-employee buyouts, “Mass” refers to individuals who obtained shares within the Mass Privatization Program, “Other” refers to owners not classifiable with available information, “POF” refers to Private Ownership Funds, and “State” refers to State Ownership Fund (SOF). The calculation of total private excludes POF as well as state. a Percentage of firms with more than 50 percent of shares privately owned.

38
Table 4: Distribution of Firms by Largest Owner-Type (percent of firms at year-end)
Privatization Method 1992 1993 1994 1995 1996 1997 1998
Sales (outside) 0.3 0.3 0.6 1.1 2.4 5.0 12.6
MEBO (inside) 0.2 3.0 9.7 17.4 21.5 22.3 24.5
Mass 0.0 0.0 0.0 0.0 13.5 14.0 14.2
Other 0.0 0.0 0.0 0.0 0.2 0.5 1.0
POF 0.0 0.0 0.0 0.0 0.1 0.2 0.2
State 99.6 96.7 89.7 81.6 62.3 58.0 47.6
Total 100.0 100.0 100.0 100.0 100.0 100.0 100.0
Number of firms: 2,354. Notes: “Sales (outside)” refers to outside investors who obtained their holdings through block sales, “MEBO (inside)” refers to employees who obtained shares through management-employee buyouts, “Mass” refers to individuals who obtained shares within the Mass Privatization Program, “Other” refers to owners not classifiable with available information, “POF” refers to Private Ownership Funds, and “State” refers to State Ownership Fund (SOF).

39
Table 5: Summary Statistics for Employment, Real Sales and Labor Productivity
1992 1993 1994 1995 1996 1997 1998 1999
Mean 1,154.3 1,045.5 898.9 836.1 788.9 733.8 622.2 514.4 Employment
Std. Dev. 1,778.0 1,707.1 1,587.2 1,558.8 1,908.7 1,451.6 1,266.8 1,083.8
Mean 2,072.1 2,328.0 1,864.1 1,962.2 1,908.7 1,750.6 1,477.2 1,256.8 Real sales Std. Dev. 5,188.2 7,931.6 7,980.2 9,096.5 8,481.6 9,132.1 8,413.3 6,310.0
Mean 2.07 2.01 1.69 1.87 1.89 1.73 1.71 1.86 Labor productivity Std. Dev. 2.87 2.75 2.38 2.47 2.39 2.32 2.69 2.49
Mean NA 0.43 -0.90 0.28 0.39 -0.03 0.06 0.24 Productivity growth Std. Dev. NA 4.22 0.62 2.30 12.75 0.48 0.99 1.16
Number of firms 1,931 1,924 2,048 2,050 2,108 2,129 2,134 2,139
Notes: Real value of sales is measured in thousands of 1992 lei. Productivity growth is expressed as proportion. NA = not available.

40
Table 6: Productivity Growth by Largest Owner-Type
State Private Outside Inside Mass
Mean –0.024 0.012 0.133 –0.007 –0.014 (t-stat) (4.03)** (5.43)** (1.75) (0.64)
N 10,857 3,670 466 13,028 11,752
Notes: N refers to the number of firm-year observations. Productivity growth is measured as the log of the ratio of labor productivity for year t to that for year t-1. “State” and “Private” refer to majority ownership, while the disaggregated private ownership categories refer to largest shareholding; “outside” is all blockholder shares, “inside” refers to all shares obtained by employees through MEBO privatization, and “mass” consists of all shares distributed through the MPP. Ownership is measured at end of year t-1. The absolute value of the t-statistic in parentheses tests the difference of means for each type of private owner relative to majority state ownership. ** indicates significance at the 1 percent level.

41
Table 7: Pre-Privatization Productivity Growth by Future Owner-Type
Never majority private
Private after year t
Outside after year t
Inside after year t
Mass after year t
Mean –0.032 –0.012 –0.007 0.000 –0.033 (t-stat) (1.75) (1.53) (1.91) (0.06)
N 4526 3207 1132 966 929
Notes: Firm-year observations are included only if the state is the largest owner in the given year. Productivity growth is measured as the log of the ratio of labor productivity for year t to that for year t-1. The absolute value of the t-statistic in parentheses test s the difference of means for each future largest owner-type relative to “never majority private.”
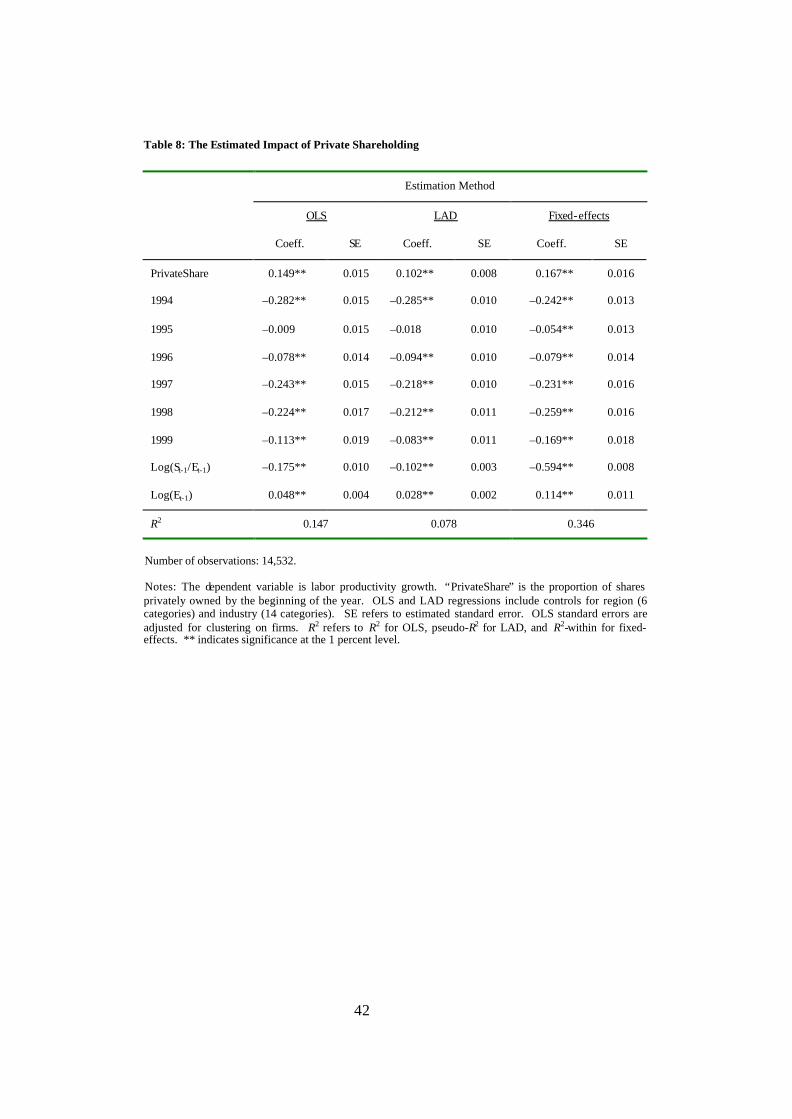
42
Table 8: The Estimated Impact of Private Shareholding
Estimation Method
OLS LAD Fixed-effects
Coeff. SE Coeff. SE Coeff. SE
PrivateShare 0.149** 0.015 0.102** 0.008 0.167** 0.016
1994 –0.282** 0.015 –0.285** 0.010 –0.242** 0.013
1995 –0.009 0.015 –0.018 0.010 –0.054** 0.013
1996 –0.078** 0.014 –0.094** 0.010 –0.079** 0.014
1997 –0.243** 0.015 –0.218** 0.010 –0.231** 0.016
1998 –0.224** 0.017 –0.212** 0.011 –0.259** 0.016
1999 –0.113** 0.019 –0.083** 0.011 –0.169** 0.018
Log(St-1/Et-1) –0.175** 0.010 –0.102** 0.003 –0.594** 0.008
Log(Et-1) 0.048** 0.004 0.028** 0.002 0.114** 0.011
R2 0.147 0.078 0.346
Number of observations: 14,532. Notes: The dependent variable is labor productivity growth. “PrivateShare” is the proportion of shares privately owned by the beginning of the year. OLS and LAD regressions include controls for region (6 categories) and industry (14 categories). SE refers to estimated standard error. OLS standard errors are adjusted for clustering on firms. R2 refers to R2 for OLS, pseudo-R2 for LAD, and R2-within for fixed-effects. ** indicates significance at the 1 percent level.

43
Table 9: The Estimated Impact of Private Shareholding Types
Estimation method
OLS LAD Fixed-effects
Coeff. SE Coeff. SE Coeff. SE
OutsideShare 0.344** 0.050 0.274** 0.024 0.392** 0.036
InsideShare 0.161** 0.018 0.114** 0.012 0.178** 0.021
MassShare 0.172** 0.035 0.108** 0.023 0.190** 0.036
OtherShare 0.264** 0.074 0.179** 0.054 0.299** 0.106
POFShare 0.166** 0.042 0.113** 0.031 0.264** 0.047
R2 0.150 0.079 0.350
Number of observations: 14,532. Notes: The dependent variable is labor productivity growth. Shareholding variables are expressed as proportions. All regressions include year effects, lagged level of labor productivity, and lagged employment size as controls. OLS and LAD regressions also include controls for region (6 categories) and industry (14 categories). SE refers to estimated standard error. OLS standard errors are adjusted for clustering on firms. R2 refers to R2 for OLS, pseudo-R2 for LAD, and R2-within for fixed-effects. ** indicates significance at the 1 percent level.

44
Table 10: The Estimated Impact of Majority Privatization, Controlling for the PrivateEver Group Effect
Estimation method
OLS LAD
Coeff. SE Coeff. SE
PrivateEver 0.042** 0.010 0.022** 0.007
PrivateDummy 0.084** 0.012 0.066** 0.090
R2 0.146 0.077
Number of observations: 14,532.
Notes: The dependent variable is labor productivity growth. “PrivateEver” is a dummy variable equal to one if the firm became majority privatized in any year during the sample period (1992 to 1999), and “PrivateDummy” is equal to one if the firm became majority privatized before the current year of the firm-year observation. All regressions include lagged level of labor productivity, lagged employment, year effects (1994 to 1999), region effects (6 categories) and industry effects (14 categories) as controls. SE refers to estimated standard error. OLS standard errors are adjusted for clustering on firms. R2 refers to R2 for OLS, pseudo-R2 for LAD, and R2-within for fixed-effects. ** indicates significance at the 1 percent level.

45
Table 11: The Estimated Impact of Largest Private Owner-Type, Controlling for Ownership Group Effects
Estimation method
OLS LAD
Coeff. SE Coeff. SE
Ownership Group Effects
OutsideEver 0.046** 0.014 0.013 0.011
InsideEver 0.062** 0.014 0.035** 0.011
MassEver 0.000 0.014 0.002 0.012
OtherEver 0.033 0.052 0.074* 0.035
POFEver 0.011 0.059 0.056 0.065
Current Ownership Effects
OutsideDummy 0.165** 0.032 0.150** 0.020
InsideDummy 0.055** 0.016 0.044** 0.013
MassDummy 0.083** 0.019 0.056** 0.017
OtherDummy 0.266** 0.104 0.104 0.069
POFDummy 0.262 0.146 0.056 0.091
R2 0.148 0.078
Number of observations: 14,532.
Notes: The dependent variable is labor productivity growth. Group effects are dummies equal to one if the indicated private owner-type is ever the largest during the sample period. All regressions include lagged level of labor productivity, lagged employment, year effects (1994 to 1999), region effects (6 categories), and industry effects (14 categories) as controls. SE refers to estimated standard error. OLS standard errors are adjusted for clustering on firms. R2 refers to R2 for OLS, pseudo-R2 for LAD, and R2-within for fixed-effects. ** indicates significance at the 1 percent level.