Embed Size (px)
Citation preview

1
January 2016
Private Sector Investment Survey 2015
Report

i
Table of Contents
Acronyms .................................................................................................................................... iii
Foreword ..................................................................................................................................... iv
Executive Summary ..................................................................................................................v
CHAPTER ONE: INTRODUCTION ............................................................... 1
1.1. Background .........................................................................................................................1
1.2. The Global Macroeconomic Environment .................................................................2
1.2.1. Overview ...................................................................... .........................................2
1.2.2. International Private Capital Flows ..............................................................3
1.3. Organization of the Report .......................................................................................7
CHAPTER TWO: GENERAL FINDINGS ....................................................... 8
2.1. Survey Sample and Response Rate .............................................................................8
2.2. Contribution to Economic Activity ............................................................................10
2.3. Employment ......................................................................................................................13
2.4. Compensation of Employees........................................................................................13
2.5. Net-Profits, Dividends and Retained Earnings ......................................................14
CHAPTER THREE: FOREIGN DIRECT INVESTMENT AND FOREIGN
BORROWING ................................................................. 16
3.1. Foreign Direct Investment ............................................................................................16
3.2. Foreign borrowing ...........................................................................................................19
3.3. Incorporating the Results in the Balance of Payments ......................................21
3.4. Conclusion .........................................................................................................................23
APPENDIX – A: Sampling and Grossing-up Methodology............................ a
APPENDIX – B: Statistical Appendix ......................................................... b

ii
List of Tables
Table 1.1: Global FDI flows, by region, 2009-2011 (US$ billions) ..................... 6
Table 2.1: Returned questionnaires by Sector (number of entities) ................... 9
Table 2.3: Distribution of Employment by Residency ..................................... 13
Table 2.4: Compensation of Employees by Residency..................................... 14
Table 2.5: Net profits, Dividends and Retained Earnings ............................... 15
Table 3.1: Composition of Foreign Direct Investment (Shs. billions) ............... 17
Table 3.2: Sector Distribution of Foreign Direct Investment (Shs. billions) ..... 18
Table 3.3: Top 10 Foreign Direct Investment Source Countries (Shs. billions) 19
Table 3.4: Composition of Foreign Borrowing (Shs. billions) ........................... 20
Table 3.5: Survey Estimates and Respective Grossed-Up Estimates of Foreign Direct Investment and Foreign Borrowing ..................................... 22
List of Figures
Figure 1.1: FDI Inflows, Global and by Regional Groups, 1995-2014 (US$ ....... 4
billions) ........................................................................................................... 4
Figure 1.2: FDI Inflows to Uganda, 2000 - 2014 (US$ million) ......................... 7
Figure 2.1: Entity Turnover by Economic Activity in 2013 and 2014 .............. 11
(Shs. Billion) ................................................................................................. 11
List of Appendices
Table B.1: Total Employment by Economic Sectors in 2013 and 2014 ............. b
Table B.2: Compensation of Employees by Economic Sectors in 2013 and 2014-(US$ millions) ........................................................................................ c Table B.3: Grossed-up Foreign Direct Investment and Foreign Borrowing
during 2013 and 2014-(US$ millions) .............................................................. d Table B.5: Grossed-up FDI Flows by Source Countries 2008 – 2014-(US$
millions) .......................................................................................................... e

iii
Acronyms
BOP Balance of Payments
BOU Bank of Uganda
EPRC Economic Policy Research Centre (Makerere University)
FDI Foreign Direct Investment
GDP Gross Domestic Product
IIP International Investment Position
IMF International Monetary Fund
PSFU Private Sector Foundation Uganda
PSIS Private Sector Investment Survey
Shs. Uganda Shillings (Currency)
UBOS Uganda Bureau of Statistics
UBA Uganda Bankers Association
UIA Uganda Investment Authority
UMA Uganda Manufacturers’ Association
UNCTAD United Nations Conference on Trade and Development
US$ United States Dollars
UWG Uganda Working Group on Private Sector Investment Monitoring

iv
Foreword
This report presents the findings of the annual Private Sector Investment
Survey of 2015 covering information on private investment in 2014. The survey
was the fourteenth in a series of annual surveys jointly conducted by the Bank
of Uganda, the Uganda Bureau of Statistics and the Uganda Investment
Authority. The survey collected information on foreign direct investment and
borrowing in resident enterprises and on other variables pertaining to private
sector investment. The information generated was used in the compilation of
the Uganda’s balance of payments, international investment position and
macroeconomic analysis to inform policy decisions.
The survey revealed that foreign direct investment inflows amounted to
US$1,058.6 million in 2014, a decrease of 3.5 percent compared to the
estimate of US$ 1,097.1 million in 2013. The decrease in foreign direct
investment in 2014 was mainly on account of lower inflows of new equity.
Foreign borrowing by resident enterprises from non-affiliated enterprises
amounted to a net repayment of US$9.4 million in 2014.
The annual private sector investment survey would not have been successful
without the cooperation of key stakeholders; the enterprises, government
agencies, the media and field staff. The Bank of Uganda acknowledges and
appreciates the valuable contribution of all stakeholders and the enterprises
that participated in the survey.
Management,
Bank of Uganda

v
Executive Summary
The Private Sector Investment Survey (PSIS) 2015 was the fourteenth in a
series of joint annual surveys conducted by the Bank of Uganda in
collaboration with Uganda Bureau of Statistics and Uganda Investment
Authority. The objective of the survey was to collect information required for
the compilation of Uganda’s balance of payments, international investment
position and other key macroeconomic statistics for 2014 that are required for
policy formulation.
A total of 751 questionnaires were administered during the survey from which
663 enterprises responded, representing a response rate of 88.3 percent.
Overall, the 663 enterprises had an estimated contribution to value added in
current prices during 2014 of Shs.3,708 billion equivalent to about 5.2 percent
of GDP. In addition, the samples’ contribution to fixed capital formation during
2014 was estimated at about Shs.1,894 billion representing 10.3 percent of
total fixed capital formation and 13.6 percent of private fixed capital formation.
The findings on employment indicated that total employment by the enterprises
that responded increased by 2.0 percent from 105,450 employees during 2013
to 107,559 employees during 2014. Similarly, there was an increase in
compensation of employees of 7.3 percent from Shs.1,847.7 billion in 2013 to
Shs.1,982.0 billion during 2014. Profitability of enterprises surveyed increased
by 5.5 percent to Shs.1,031.9 billion during 2014 from Shs.978.1 billion
recorded in 2013.
The grossed-up findings on Foreign Direct Investment (FDI) transactions
during 2014 decreased by US$38.5 million to US$1,058.6 million from
US$1,097.1 million in 2013. The decrease in FDI inflows in 2014 was mainly
on account of lower inflows of new equity. Net inflows of other capital which is
comprised of borrowings from foreign affiliates increased to US$317.1 million

vi
during 2014 compared to US$250.2 million recorded in 2013. However, foreign
borrowing by resident enterprises from non-affiliated enterprises was a net
repayment of US$9.4 million during 2014 compared to a net repayment of
US$18.3 million recorded in 2013. Transactions involving other equity
investment (equity investment of less than 10% of total equity) during 2014
were estimated at US$ 7.6 million.
The major recipient sectors of FDI during the year were mining and quarrying
including oil (49.9 percent), I.C.T. (23.3 percent), finance and insurance (18.2
percent) and electricity and gas (4.5 percent). The largest
inflows/disbursements of foreign debt from foreign affiliates went to ICT,
wholesale & trade, and manufacturing sectors. The three sectors jointly
accounted for 79.3 percent of the total disbursements from foreign affiliated
entities received during 2014. In terms of source of FDI, Netherlands,
Australia, UK, Kenya and Mauritius were the largest sources accounting for
86.8 percent of total FDI inflows received by Uganda during 2014.
The survey findings also showed that entities in the electricity & gas sector had
the largest exposure to foreign debt from unrelated entities, accounting for 76.5
percent of the outstanding stock of debt in this category at the end of 2014.
Entities in wholesale & retail trade, electricity and gas and real estate sectors
received 89.4 percent of the total disbursements and remitted 72.7 percent of
the repayments to non-affiliated entities during 2014.

1
CHAPTER ONE
INTRODUCTION
This introductory chapter provides a brief background to the survey; methodology
used and highlights global macroeconomic developments and trends in
international private capital flows, during 2014. The basis for analysis of the
findings and evaluation of the trends in foreign private sector investment is also
discussed in this chapter.
1.1. Background
The Private Sector Investment Survey (PSIS) 2015 was the fourteenth in a series
of annual surveys conducted by the Uganda Working Group (UWG) on private
sector investment monitoring. These regular PSI surveys are intended to provide
reliable information for the compilation of Uganda’s Balance of Payments (BOP),
International Investment Position (IIP), Coordinated Direct Investment Survey
(CDIS) and other macroeconomic statistics to guide policy decisions. The PSIS
2015 collected and analysed information on the value of investment, composition,
source and destination countries and sector distribution of investment stocks as
at end 2013 and 2014 and flows during 2014.
Foreign Private Capital, particularly in the form of foreign direct investment (FDI)
is an important source of finance for most developing economies. In these
economies, FDI entities have continued to provide the financial, human and
technological resources required to complement domestic private investments,
and to support growth and development. In essence, FDI enterprises are
associated with increased capital formation, export growth and technological
transfer within the host economy. Further, the activities of the FDI enterprises
contribute to employment creation, boost demand and improved public revenue.
The PSIS 2015 targeted 860 enterprises known to have large foreign liabilities
and assets from previous surveys and newly licensed enterprises from the UIA’s
investor register. The sample size was selected purposively to achieve full
coverage of all enterprises with foreign direct investment and foreign borrowing

2
identified from the PSIS 2014 survey. In addition, all enterprises that were
licensed by UIA during 2014 were incorporated into the sample to determine
whether they had foreign direct investment and foreign borrowings from non-
affiliates. The sampling method generated a total of 752 enterprises, which had
reported foreign direct investment and foreign borrowing in the previous surveys.
These were supplemented with 108 entities that included 3 newly licensed
enterprises obtained from UIA’s investor register, 33 enterprises that did not
provide information during the PSIS of 2014, 39 enterprises from URA’s top
1,000 tax payers that had never been surveyed and 33 enterprises reported in
print media.
The data collection activities involved direct administration of the questionnaires
to the respondents by a team of trained enumerators. The exercise was
conducted from 11th June to 21st August 2015 by a team of thirty four (34)
interviewers supported by four (4) members of staff from the Statistics
Department of Bank of Uganda, one staff from UBOS, and one staff from UIA.
After the first phase, a team of 15 enumerators were assigned to follow-up on
enterprises that did not respond in the first round of data collection and to gather
additional information to improve the data quality for some enterprises.
1.2. The Global Macroeconomic Environment
An overview of the global economy and trends in international private capital
flows during 2014 and forecasts for 2015 is presented in this section.
1.2.1. Overview of Global Growth in 2015
According to the IMF’s WEO-January 20161, global economic activity remained
subdued throughout 2015 with global growth estimated at 3.1 percent. The
bigger contribution to global growth came from advanced countries where the
modest recovery seen in recent periods remained steady. In emerging market and
1 IMF World Economic Outlook Update – January 2016: Subdued Demand, Diminished Prospects.
3
developing countries, growth declined for the fifth consecutive year, majorly
influenced by faster slow down in China and falling commodity prices.
Over the next two years, global growth is projected at 3.4 percent in 2016 and 3.6
percent in 2017 supported by resilience of economic activity in the United States
of America, stronger private consumption in the euro area, and better growth
prospects in Japan on the back of fiscal support, among other factors. However,
growth prospects in emerging market and developing economies are projected to
be weaker than earlier envisaged mainly due to the slowdown and rebalancing of
the Chinese economy, lower commodity prices, and strains in some large
emerging market economies such as Brazil.
The WEO-January 2016 report outlines the downside risks to the global growth
as: generalized slowdown in emerging market economies, China’s rebalancing,
lower commodity prices, and the gradual exit from extraordinarily accommodative
monetary conditions in the United States, which could tighten global financing
conditions.
1.2.2. International Private Capital Flows Development
According to the UNCTAD World Investment Report 2015 (WIR-2015)2, global
foreign direct investment (FDI) inflows fell by 16 per cent in 2014 to US$1.23
trillion, down from US$1.47 trillion in 2013, mainly as a result of the fragility of
the global economy, policy uncertainty and elevated geopolitical risks. In
addition, in some countries new investments were offset by large divestments.
For 2015, UNCTAD forecasts an upturn in FDI flows to US$1.47 trillion. This is
expected to rise further to US$1.5 trillion in 2016 and US$1.7 trillion in 2017,
driven largely by growth prospects in the advanced economies such as the United
States of America and continued investment liberalization and promotion
2 UNCTAD World Investment Report 2015: Reforming International Investment Governance.
4
measures. However, the WIR-2015 points to a number of risks to the forecasts
including ongoing uncertainties in the Eurozone, potential spill-overs from
geopolitical tensions, and persistent vulnerabilities in emerging economies, all of
which may disrupt the projected recovery.
Oil prices have declined markedly since September 2015, reflecting expectations
of sustained increases in production by Organization of the Petroleum Exporting
Countries (OPEC) members amid continued global oil production in excess of oil
consumption. Prices of other commodities, especially metals, have fallen as well.
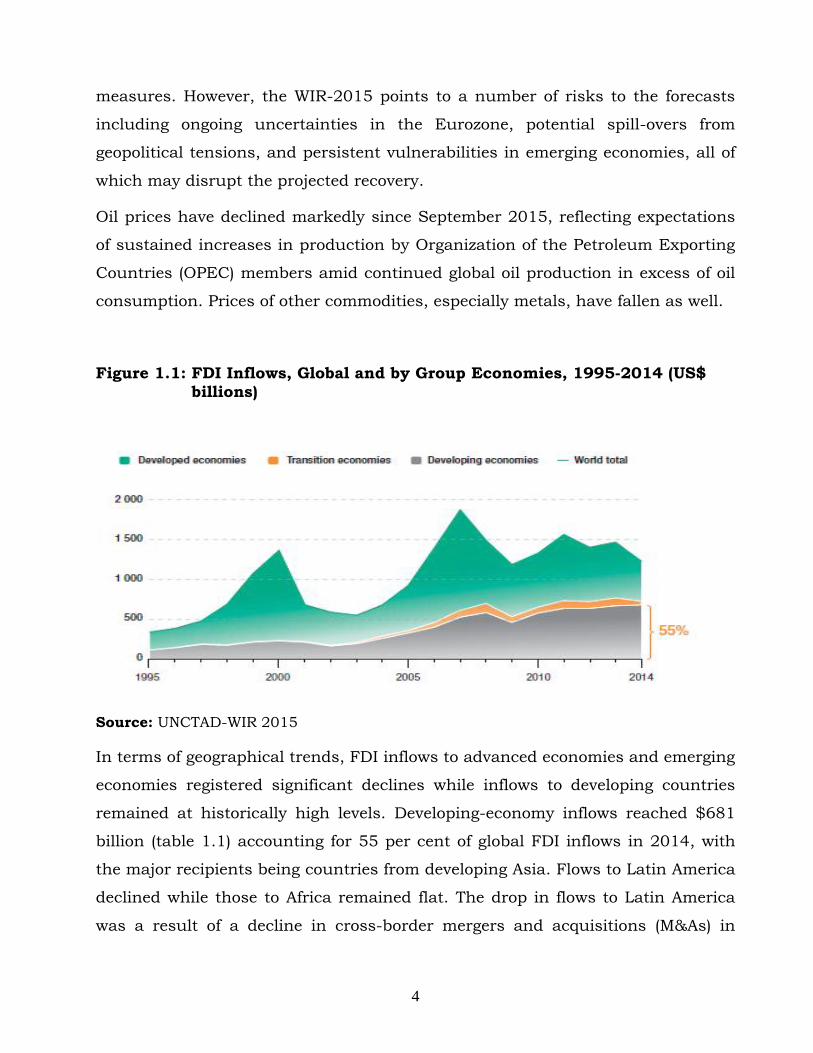
Figure 1.1: FDI Inflows, Global and by Group Economies, 1995-2014 (US$ billions)
Source: UNCTAD-WIR 2015
In terms of geographical trends, FDI inflows to advanced economies and emerging
economies registered significant declines while inflows to developing countries
remained at historically high levels. Developing-economy inflows reached $681
billion (table 1.1) accounting for 55 per cent of global FDI inflows in 2014, with
the major recipients being countries from developing Asia. Flows to Latin America
declined while those to Africa remained flat. The drop in flows to Latin America
was a result of a decline in cross-border mergers and acquisitions (M&As) in

5
Central America and the Caribbean, and lower commodity prices, which reduced
investment in the extractive industries in South America.
Inflows to Africa remained stable at $54 billion, with declines registered in North
Africa and West Africa, offset by higher inflows in other regions. Central Africa
and East Africa saw their FDI flows increase by 33 per cent and 11 per cent, to
$12 billion and $7 billion, respectively. FDI flows to West Africa were negatively
affected by the Ebola outbreak, regional conflicts and falling commodity prices.
FDI flows to developed countries dropped by 28 per cent to $499 billion, largely
driven by a significant decline in inflows to the United States and countries in the
euro area. Inflows to the United States fell to US$92 billion, mainly due to
significant divestment, while flows to Europe also fell by 11 per cent to $289
billion, with declines reported in Ireland, Belgium, France and Spain.
Inflows to transition economies declined by 52 percent to $48 billion, as regional
conflict and sanctions deterred new foreign investors, particularly in Russia and
Ukraine.

6
Table 1.1: Global FDI Flows, by Region, 2012-2014 (US$ billions)
Region FDI Inflows FDI Outflows
2012 2013 2014 2012 2013 2014
World 1,402.9 1,467.2 1,228.3 1,283.7 1,305.9 1,354.0
a). Developed economies 678.7 696.9 498.8 872.9 833.6 822.8
b). Transition economies 85.1 99.6 48.1 53.6 91.5 63.1
c). Developing economies 639.0 670.8 681.4 357.2 380.8 468.1
Latin America 178.0 186.2 159.4 43.8 28.5 23.3
Asia 400.8 427.9 465.3 299.1 335.3 431.6
Oceania 3.7 2.8 2.8 1.6 1.1 0.2
Africa 56.4 54.0 53.9 12.4 16.0 13.1
Eastern Africa 5.5 6.1 6.8 0.3 0.1 0.1
Central Africa 9.5 9.0 12.1 0.2 0.1 0.3
Northern Africa 17.2 13.6 11.5 3.3 1.0 1.7
Southern Africa 8.0 11.0 10.8 5.1 12.6 8.8
Western Africa 16.3 14.2 12.8 3.5 2.2 2.3
Source: UNCTAD, Foreign Direct Investment Statistics 2015.
Outward FDI from Africa declined by 18.8 percent to US$13.1 billion in 2014
from US$16.0 billion in 2013. Southern Africa remained the major source of
outward FDI despite a decline of 30.2 percent to US$8.8 billion in 2014 from
US$12.6 billion in 2013.
In Uganda, FDI3 inflows decreased in 2014 to US$1,058.6 million from
US$1,097.1 million in 2013 mainly on account of a reduction in equity capital.
The largest contribution to total FDI inflows was however in mining (mainly
driven by investments in oil exploration activities), finance and insurance
services, manufacturing, ICT and electricity & gas sectors. Despite a slight
decline in equity investment, new equity continued to be the main component of
FDI inflows to Uganda as illustrated in Figure 1.2.
3 FDI includes Equity (Equity shares, Retained earnings and Revaluations) and Other Capital i.e.
Debt (Loans and Trade Credits) from affiliated entities.

7
Figure 1.2: FDI Inflows to Uganda, 2000 - 2014 (US$ million)
Source: Computation based on BoU, BOP Statistics
1.3. Organization of the Report
The rest of the report is structured as follows: Chapter 2 provides the general
survey findings, while Chapter 3 presents findings on FDI and foreign borrowing
and concludes.

8
CHAPTER TWO
GENERAL FINDINGS
This chapter presents a description of the sample and the survey results relating
to the general characteristics of the enterprises surveyed. Also included is an
assessment of the sample’s contribution to the economy’s value added and gross
fixed capital formation. The reporting currency used for presenting the survey
findings is the Uganda shilling except for the up-rated estimates which are in US
dollars (US$). Additional tables in US dollars are provided in Appendix B.
2.1. Survey Sample and Response Rate
The survey sample was selected with the objective of covering all enterprises in
Uganda with foreign direct investment, unrelated foreign borrowing and new
enterprises licensed during 2014. Subsequently, the sample was comprised of
some enterprises with only foreign direct investment or foreign borrowing and
some with both.
A total of 751 questionnaires were administered to enterprises during the field
activities out of the 860 enterprises sampled. Of the 109 enterprise not
administered, 45 (or 41.3%) were not located, 15 (or 13.8%) were closed, 2 (or
1.8%) were not operational, 1 (or 0.9%) had not yet started operations and 46
(42.2%) did not receive the questionnaire. Of the 751 questionnaires delivered,
663 enterprises responded resulting in a response rate of 88.3 percent of the
enterprises targeted. Financial statements for 393 of the respondents were
collected and used to validate some of the information submitted. In addition,
comparisons were made with the information provided in the previous surveys at
enterprise level to check for consistency of the information provided.
The regional distribution of the targeted enterprises and response to the PSIS
2015 is shown in Table 2.1. The Table reveals that 625 enterprises or 94.3

9
percent of the enterprises that responded were located in the central region
followed by 25 or 3.8 percent enterprises located in the Eastern and Northern
region and 13 or 2.0 percent in Western region.
Table 2.1: Returned Questionnaires by Region (number of entities)
Region Administered1/ Returned Regional distribution
of returned questionnaires (%)
Central2/ 703 625 94.3
East and North 28 25 3.8
West 20 13 2.0
Grand Total 751 663 100.0 Note
1. The difference between targeted and administered questionnaires arose from the fact that during field activities some business enterprises were not found either because they had not commenced business or had relocated or merged/acquired with/by another entity or had closed.
2. The large number of enterprises targeted from the Central region is explained by the fact that most companies have their head-offices located in Kampala from where the information is collected.
Source: PSIS 2015 findings
At sector level, the highest share of respondent enterprises (22.0 percent) was in
manufacturing, followed by wholesale and retail activities (21.9 percent), finance
and insurance (10.4 percent), I.C.T (6.8 percent), construction (6.5 percent) and
transportation and storage (5.6 percent). The distribution by sector reflected a
high number of enterprises with foreign direct investment and borrowing in
manufacturing and service sectors. The details are presented in Table 2.2.

10
Table 2.2: Returned Questionnaires by Economic Sector (number of entities)
Major Sector Administered Returned Sector distribution of
returned questionnaires (%)
Agriculture, forestry and fishing 47 40 6.0
Industry 255 216 32.6
Mining and quarrying 12 8 1.2
Manufacturing 170 147 22.2
Electricity & gas 21 15 2.3
Water supply & sewerage 3 3 0.5
Construction 49 43 6.5
Services 449 407 61.4
Wholesale & retail trade 158 145 21.9
Transportation and Storage 42 37 5.6
Accommodation and food service 30 27 4.1
Information and communication 50 45 6.8
Finance and Insurance activities 69 69 10.4
Real estate activities 22 22 3.3
Professional, scientific & technical 29 28 4.2
Administrative services 23 22 3.3
Education 8 4 0.6
Health and Social work activities 7 6 0.9
Arts, entertainment and recreation 2 2 0.3 Others (include enterprises which had
not started operations) 9 0 0.0
Total 751 663 100
Source: PSIS 2015 findings
2.2. Entity turnover
There was an increase in total turnover (sales revenue) of 9.5 percent to
Shs.24,105.5 billion in 2014 from Shs.22,014.0 billion recorded in 2013. The
increase was largely on account of growth in construction, manufacturing,
finance and insurance, I.C.T and wholesale and retail trade. There was however,
a decline in sales revenue in arts, entertainment and recreation of 59.0 percent
from Shs. 37.6 billion in 2013 to Shs. 15.4 billion in 2014; health and social
work activities of 17.6 percent from Shs. 166.6 billion in 2013 to Shs. 137.3
billion in 2014; electricity & gas of 14.3 percent from Shs. 1,427.1 billion in 2013
to Shs. 1,223.0 billion in 2014; mining and quarrying of 5.5 percent from Shs.
189.7 billion in 2013 to Shs. 179.2 billion in 2014 and transport and storage of

11
3.1 percent from Shs. 672.0 billion in 2013 to Shs. 651.4 billion in 2014. The
details are illustrated in Figure 2.1.
In terms of sector contribution to total turnover, manufacturing had the highest
share estimated at 29.6 percent of the total reported by the enterprises that
responded. This was followed by finance and insurance with a share of 21.5
percent, wholesale and retail (18.1%), I.C.T. (8.2%) and construction (7.1%). The
five sectors combined accounted for about 84.5 percent of the total turnover over
the two years.
Figure 2.1: Entity Turnover by Economic Activity in 2013 and 2014
(Shs. Billion)
Source: PSIS 2015 findings
-
1,000
2,000
3,000
4,000
5,000
6,000
7,000
8,000
Acc
om
mo
dat
ion
an
d f
oo
d s
erv
ice
…
Ad
min
istr
ativ
e a
nd
su
pp
ort
se
rvic
e a
ctiv
itie
s
Agr
icu
ltu
re, f
ore
stry
an
d f
ish
ing
Art
s, e
nte
rtai
nm
en
t an
d r
ecr
eat
ion
Co
nst
ruct
ion
Edu
cati
on
Ele
ctri
city
, gas
an
d a
ir c
on
dit
ion
ing
sup
ply
Fin
ance
an
d In
sura
nce
act
ivit
ies
cove
red
…
Hu
man
He
alth
an
d S
oci
al w
ork
act
ivit
ies
Info
rmat
ion
an
d c
om
mu
nic
atio
n
Man
ufa
ctu
rin
g
Min
ing
and
qu
arry
ing
Pro
fess
ion
al, s
cie
nti
fic
and
te
chn
ical
…
Re
al e
stat
e a
ctiv
itie
s
Tran
spo
rtat
ion
an
d S
tora
ge
Wat
er
sup
ply
; se
we
rage
, was
te …
Wh
ole
sale
& r
eta
il tr
ade
; re
pai
r o
f m
oto
r …
Turn
ove
r (S
hs.
Bill
ion
)
Major sector
2013
2014

12
2.3. Contribution to Economic Activity
The results of the PSIS 2014 on compensation of employees (wages and salaries),
taxes on production and imports less subsidies, net operating surplus (profit) and
consumption of fixed capital were used to estimate the samples’ contribution to
output. Value added at current prices during 2014 for the 663 enterprises that
responded was estimated at Shs.3,708 billion equivalent to about 5.2 percent of
GDP. The sampled entities in finance and insurance services and electricity and
gas sectors accounted for most of the value added in their respective sectors with
estimated contributions to GDP of 65.4 percent and 57.6 percent of GDP,
respectively (see details in Table 2.3).
Table 2.3: Value added and Fixed Capital Formation of Sampled Enterprises
During 2014 (Shs. Billion).
The results on the stock of capital reported by the enterprises during 2014 were
used together with the survey results for the period 2013 to estimate the
proportion of the survey’s contribution to fixed capital formation. An estimate of
fixed capital formation of Shs.1,894 billion was derived. The estimate represented
about 10.3 percent of total fixed capital formation and 13.6 percent of private
gross fixed capital formation estimates for 2014.
GDP
(Current prices)1/
Value added 3,708 71,402 5.2
o/w Manufacturing 860 6,573 13.1
Financial and Insurance services 1,362 2,081 65.4
Electricity 352 611 57.6
Construction 185 5,500 3.4
Others 948 56,637 1.7
Fixed capital formation 1,894 18,360 10.3
o/w Private fixed capital formation 1,894 13,886 13.6
Source: PSIS 2015 findings and UBOS Statistical Abstract 2015
ItemSample Value
Added
Sample /Total
(in %)
Note: 1/ . The GDP at current prices is from: Uganda Bureau of Statistics; Rebased GDP estimates 2009/10
13
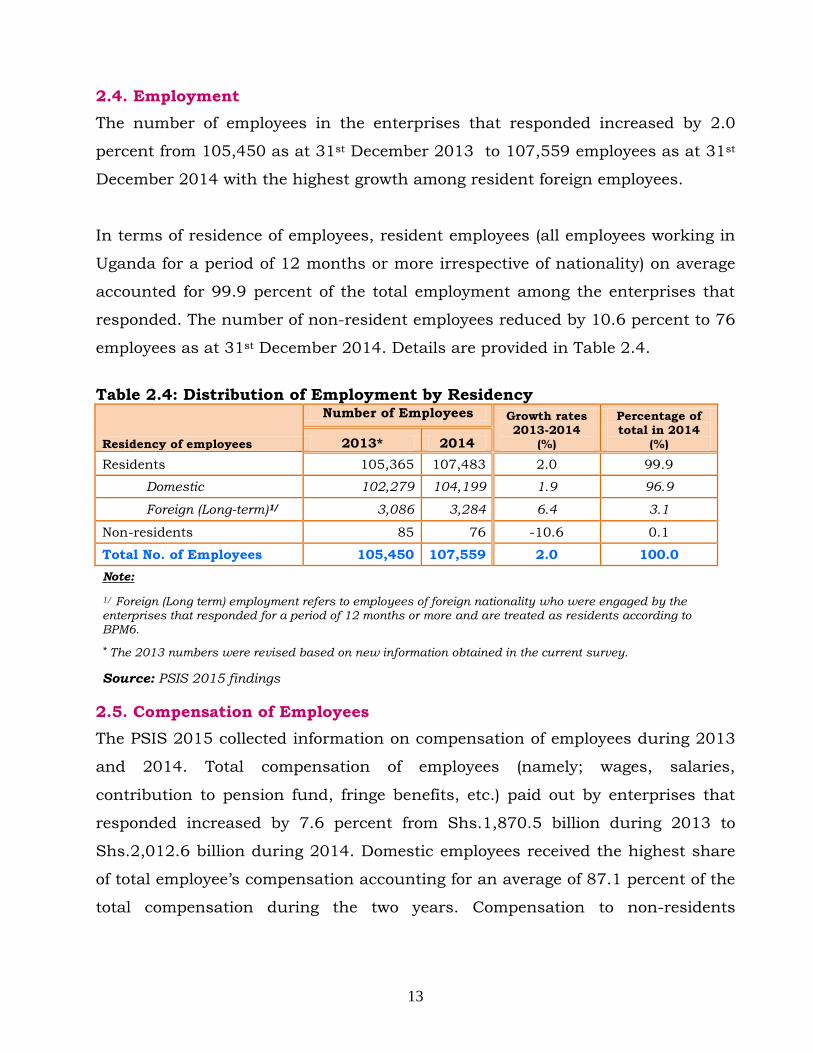
2.4. Employment
The number of employees in the enterprises that responded increased by 2.0
percent from 105,450 as at 31st December 2013 to 107,559 employees as at 31st
December 2014 with the highest growth among resident foreign employees.
In terms of residence of employees, resident employees (all employees working in
Uganda for a period of 12 months or more irrespective of nationality) on average
accounted for 99.9 percent of the total employment among the enterprises that
responded. The number of non-resident employees reduced by 10.6 percent to 76
employees as at 31st December 2014. Details are provided in Table 2.4.
Table 2.4: Distribution of Employment by Residency
Residency of employees
Number of Employees Growth rates 2013-2014
(%)
Percentage of total in 2014
(%) 2013* 2014
Residents 105,365 107,483 2.0 99.9
Domestic 102,279 104,199 1.9 96.9
Foreign (Long-term)1/ 3,086 3,284 6.4 3.1
Non-residents 85 76 -10.6 0.1
Total No. of Employees 105,450 107,559 2.0 100.0
Note:
1/ Foreign (Long term) employment refers to employees of foreign nationality who were engaged by the enterprises that responded for a period of 12 months or more and are treated as residents according to BPM6.
* The 2013 numbers were revised based on new information obtained in the current survey.
Source: PSIS 2015 findings
2.5. Compensation of Employees
The PSIS 2015 collected information on compensation of employees during 2013
and 2014. Total compensation of employees (namely; wages, salaries,
contribution to pension fund, fringe benefits, etc.) paid out by enterprises that
responded increased by 7.6 percent from Shs.1,870.5 billion during 2013 to
Shs.2,012.6 billion during 2014. Domestic employees received the highest share
of total employee’s compensation accounting for an average of 87.1 percent of the
total compensation during the two years. Compensation to non-residents

14
increased by 26.8 percent to Shs.14.3 billion in 2014 from Shs.11.3 billion in
2013. Details are shown in Table 2.5.
Table 2.5: Compensation of Employees by Residency and Up-rated Flows
Residency of Employees
Survey Findings
% Change 2013 - 2014
Up-rated Compensation of Employees
(Shs. Billions) (US$ Millions)
2013 2014 2013 2014
Residents 1,836.5 1,967.8 7.1 892.2 857.4
Domestic 1,611.8 1,728.3 7.2 783.0 753.0
Foreign (Long-term) 224.7 239.4 6.6 109.1 104.3
Non-residents 11.3 14.3 26.8 5.5 6.2
Total compensation 1,847.7 1,982.0 7.3 897.6 863.6
Source: PSIS 2015 findings
To incorporate the findings from compensation of short-term employees into BOP,
the results from the survey were up-rated using a grossing-up factor of 1.13 to
obtain total estimates for 2014. The grossed-up compensation during 2013 and
2014 was converted to US dollars using average exchange rates of Shs. 2,586.89
and Shs. 2,599.79 per US dollar, respectively. The total estimates of
compensation of employees decreased by 3.8 percent to US$863.6 million in
2014 from US$897.6 million estimated for 2013. Compensation of non-resident
employees (BOP item) increased from US$5.5 million during 2013 to US$ 6.2
million during 2014.
2.5. Net-Profits, Dividends and Retained Earnings
The findings from entities that responded indicate that net profits reported for
2014 increased by 5.5 percent to Shs. 1,031.9 billion from Shs. 978.1 billion
earned during 2013, as summarized in Table 2.6. In contrast, retained earnings
decreased by 15.8 percent to Shs. 612.0 billion during 2014 from Shs. 726.8
billion in 2013.

15
Table 2.6: Net profits, Dividends and Retained Earnings
Item Amounts (Shs. Billions) % Change
2013-2014 2013 2014
Net profit/loss 978.1 1,031.9 5.5
Dividends declared 251.36 419.86 67.0
Dividends paid/remitted 552.88 427.68 -22.6
Retained earnings4 726.79 612.03 -15.8
Source: PSIS 2015 findings
In terms of profitability by sector, finance and insurance had the largest share of
total profits estimated at 61.3 percent of total profits for all entities that
responded. The total profits for this sector rose to Shs. 632.9 billion in 2014 from
Shs. 518.7 billion registered in 2013. Enterprises in manufacturing and
electricity and gas, sectors followed with profitability of Shs. 192.1 billion and
Shs. 183.7 billion, respectively during 2014.
However, some entities registered losses in 2014. Large losses amounting to
Shs.72.6 billion were recorded in the I.C.T. sector followed by agriculture, forestry
and fishing of Shs.44.2 billion, transportation and storage of Shs.15.7 billion and
education of Shs.11.8 billion.
4 Retained earnings = Net profit/loss – Dividends declared

16
CHAPTER THREE
FOREIGN DIRECT INVESTMENT AND FOREIGN BORROWING
A discussion of the survey findings on foreign direct investment and foreign
borrowing during 2014 and the respective outstanding stocks as at end 2013 and
2014 is presented in this chapter. Section 3.1 presents the detailed findings on
foreign direct investment, Section 3.2 presents the findings on foreign borrowing
and Section 3.3 presents the grossed-up estimates of foreign liabilities
transactions used in the BOP.
3.1. Foreign Direct Investment in Resident Enterprises
Foreign direct investment5 is comprised of equity (shareholder’s funds) and other
capital which constitutes debt from foreign affiliates. Equity is the sum of share
capital, retained earnings, share premium and reserves. The findings from the
survey revealed that the stock of foreign direct investment in enterprises that
responded increased by 6.9 percent from Shs.26,198.5 billion as at end 2013 to
Shs.28,015.6 billion as at end 2014. The increase in the FDI stock was mainly on
account of new equity investment (share capital) amounting to Shs.1,343.0
billion during 2014 in the mining, finance and wholesale sectors. In addition,
Shs.727.9 billion was received during 2014 in the form of other capital,
comprised of net disbursements of loans and trade credits from foreign affiliates.
Reinvested earnings during the year amounted to Shs.358.7 billion.
Other changes which constitutes financial liabilities on account of revaluation
amounted to a net revaluation loss of Shs.142.1 billion while valuation changes
attributed to debt from affiliated enterprises resulted in a net loss of Shs.470.2
billion. The detailed findings of FDI composition in terms of flows and stocks of
the enterprises that responded are shown in Table 3.1.
5 According to the IMF BPM6 manual, Direct Investment (DI) relationships arise when an investor resident in one
economy makes an investment that gives control or a significant degree of influence on the management of an enterprise
that is resident in another economy; usually defined as ownership of equity that entitles the investor to 10 percent or
more of the voting power in that enterprise. Fellow Enterprises (FE) relationships arise when non-resident investors who have
less than 10% of the entity’s equity but are also owned by another non-resident entity that has interest in an entity.

17
Table 3.1: Composition of Foreign Direct Investment (Shs. billions)
Source: PSIS 2015 findings
Stock Transactions Other Changes Stock
Foreign Direct Investment (FDI) 26,198.5 2,429.6 612.3- 28,015.6
Direct Investor (DI) 25,209.8 2,477.3 648.0- 27,039.0
Fellow Enterprise (FE) 988.7 47.7- 35.7 976.7
Total Equity (OFBV) 22,337.7 1,701.7 142.1- 23,897.3
Direct Investor (DI) 22,336.9 1,701.6 142.0- 23,896.5
Equity Shares 6,350.8 1,343.0 94.2- 7,599.6
Retained Earnings 1,690.1 358.7 282.0- 1,766.8
Revaluation 14,296.0 234.1 14,530.1
Fellow Enterprise (FE) 0.8 0.1 0.1- 0.8
Equity Shares 0.4 0.1 0.0- 0.4
Retained Earnings 0.0 0.0 0.1- 0.1-
Revaluation 0.4 0.0- 0.4
Other Capital (Affiliated Debt) 3,860.7 727.9 470.2- 4,118.4
Direct Investor (DI) 2,872.9 775.6 506.0- 3,142.5
Loans 2,349.1 801.5 495.0- 2,655.6
Short-term 476.7 119.8 4.0 600.5
Disbursements - 130.1 - -
Repayments - 10.3- - -
Other Changes - 4.0 -
Long-term 1,872.4 681.7 499.0- 2,055.1
Disbursements - 770.0 - -
Repayments - 88.3- - -
Other Changes - - 499.0- -
Trade credits 523.8 25.9- 11.0- 486.9
Short-term 361.1 25.3- 11.0- 324.8
Disbursements - 55.0 - -
Repayments - 80.4- - -
Other Changes - 11.0- -
Long-term 162.6 0.5- 0.0 162.1
Disbursements - 12.1 - -
Repayments - 12.6- - -
Other Changes - 0.0
Fellow Enterprise (FE) 987.9 47.8- 35.8 975.9
Loans 496.2 167.2- 35.8 364.8
Short-term 47.5 2.8 - 50.3
Disbursements - 8.5 - -
Repayments - 5.7- - -
Other Changes - - - -
Long-term 448.7 170.0- 35.8 314.4
Disbursements - 69.4 - -
Repayments - 239.5- - -
Other Changes - 35.8
Trade credits 491.7 119.4 0.0 611.1
Short-term 408.8 68.9 0.2 477.9
Disbursements - 151.7 - -
Repayments - 82.7- - -
Other Changes - - 0.2 -
Long-term 82.9 50.5 0.1- 133.2
Disbursements - 84.5 - -
Repayments - 34.0- - -
Other Changes - 0.1- -
Component of FDI2013 2014

18
The major recipient sectors of foreign direct investment during the year were
mining and quarrying accounting for 49.9 percent (or Shs.1,212.1 billion) of the
total FDI. This was followed by information and communication technology (23.3
percent or Shs.565.0 billion), finance and insurance (18.2 percent or Shs.441.2
billion), and electricity & gas (4.5 percent or Shs.110.2 billion). The details are
shown in Table 3.2. There were however net reductions recorded by enterprises
involved in manufacturing (Shs.42.8 billion), education (Shs.12.1 billion),
accommodation and food (Shs.6.9 billion) and arts, entertainment and recreation
services (Shs.5.5 billion). The reductions were mainly as a result of retained
losses and net repayments of affiliated debt during the period.
Table 3.2: Sector Distribution of Foreign Direct Investment (Shs. billions)
Major Sector 2013 2014
Stock Transactions Other
Changes6 Stock
Agriculture 569.5 21.4 0.1 591.0
Mining & quarrying 15,820.4 1,212.1 4.6 17,037.1
Manufacturing 2,401.5 -42.8 133.1 2,491.8
Electricity & gas 968.3 110.2 -169.5 909.0
Water supply 79.0 1.9 3.4 84.3
Construction 347.4 63.7 7.5 418.6
Wholesale & retail 855.0 38.6 0.2 893.9
Transportation & storage 179.4 21.7 3.7 204.8
Accommodation & food 277.2 -6.9 -41.3 229.0
I.C.T. 1,124.4 565.0 -552.0 1,137.5
Finance & Insurance 2,708.8 441.2 -1.6 3,148.4
Real estate 100.1 12.3 2.5 114.9
Professional services 14.9 6.5 1.0 22.3
Administrative services 652.1 3.2 -0.4 654.9
Education 19.7 -12.1 0.0 7.5
Health 75.8 -1.0 -10.3 64.6
Arts & entertainment 4.9 -5.5 6.6 6.0
Others 0.0 0.0 0.0 0.0
Total 26,198.4 2,429.6 -612.3 28,015.7
6 Other changes include changes other than transactions i.e. inward/outward, Revaluations,
exchange rate gains/losses, debt equity swaps, debt forgiveness etc.
19
Source: PSIS 2015 findings
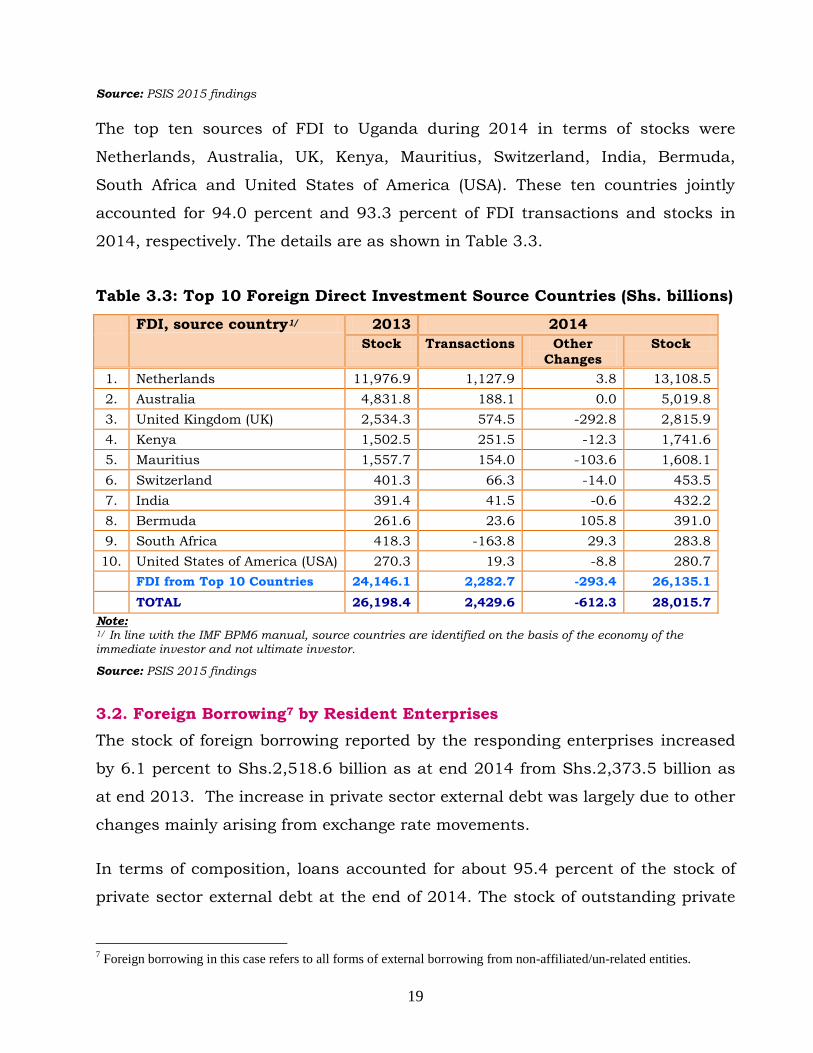
The top ten sources of FDI to Uganda during 2014 in terms of stocks were
Netherlands, Australia, UK, Kenya, Mauritius, Switzerland, India, Bermuda,
South Africa and United States of America (USA). These ten countries jointly
accounted for 94.0 percent and 93.3 percent of FDI transactions and stocks in
2014, respectively. The details are as shown in Table 3.3.
Table 3.3: Top 10 Foreign Direct Investment Source Countries (Shs. billions)
FDI, source country1/ 2013 2014
Stock Transactions Other
Changes
Stock
1. Netherlands 11,976.9 1,127.9 3.8 13,108.5
2. Australia 4,831.8 188.1 0.0 5,019.8
3. United Kingdom (UK) 2,534.3 574.5 -292.8 2,815.9
4. Kenya 1,502.5 251.5 -12.3 1,741.6
5. Mauritius 1,557.7 154.0 -103.6 1,608.1
6. Switzerland 401.3 66.3 -14.0 453.5
7. India 391.4 41.5 -0.6 432.2
8. Bermuda 261.6 23.6 105.8 391.0
9. South Africa 418.3 -163.8 29.3 283.8
10. United States of America (USA) 270.3 19.3 -8.8 280.7
FDI from Top 10 Countries 24,146.1 2,282.7 -293.4 26,135.1
TOTAL 26,198.4 2,429.6 -612.3 28,015.7
Note: 1/ In line with the IMF BPM6 manual, source countries are identified on the basis of the economy of the immediate investor and not ultimate investor.
Source: PSIS 2015 findings
3.2. Foreign Borrowing7 by Resident Enterprises
The stock of foreign borrowing reported by the responding enterprises increased
by 6.1 percent to Shs.2,518.6 billion as at end 2014 from Shs.2,373.5 billion as
at end 2013. The increase in private sector external debt was largely due to other
changes mainly arising from exchange rate movements.
In terms of composition, loans accounted for about 95.4 percent of the stock of
private sector external debt at the end of 2014. The stock of outstanding private
7 Foreign borrowing in this case refers to all forms of external borrowing from non-affiliated/un-related entities.

20
sector foreign loans increased by 6.9 percent to Shs.2,402.8 billion as at end
2014 from Shs.2,247.0 billion as at end 2013, largely on account of other
changes. However, the stock of trade credit owed to non-residents decreased from
Shs.126.5 billion to Shs.115.8 billion as at end 2013 and 2014, respectively. The
decrease in trade credit was mainly due to higher repayments of short-term trade
credit during the period, estimated at Shs.114.0 billion compared to
disbursements estimated at Shs. 104.4 billion as shown in Table 3.4.
Table 3.4: Composition of Foreign Borrowing by Resident Enterprises (Shs. billions)
Component 2013 2014
Stocks Disbursements Repayments Other
Changes Stocks
Total Foreign borrowing
2,373.5 243.8 -265.3 166.7 2,518.6
Loans 2,247.0 139.4 -151.3 167.8 2,402.8
Short-Term Loan 7.9 1.0 -2.7 0.0 6.2
Long-Term Loan 2,239.1 138.4 -148.6 167.7 2,396.6
Trade credits 126.5 104.4 -114.0 -1.1 115.8
Short-Term Loan 126.3 104.4 -114.0 -1.1 115.6
Long-Term Loan 0.2 0.0 0.0 0.0 0.2
Source: PSIS 2015 findings
The survey findings also showed that in terms of sector distribution, the largest
exposure to foreign debt from unrelated entities in 2014 was in electricity & gas
(76.5%) followed by I.C.T (4.1%), real estate (3.8%) and manufacturing (3.7%).
The sectors that received the highest disbursements were wholesale & retail trade
which received Shs.102.2 billion, electricity and gas Shs.94.8 billion and real
estate sector received Shs.21.1billion. Similarly, the largest debt repayments were
reported by entities in electricity and gas, wholesale & retail trade and
manufacturing sectors as shown in Table 3.5.
The main lenders were international organisations (namely, International Finance
Corporation (IFC), African Development Bank (ADB) and European Investment
Bank (EIB)), United Kingdom, Kenya and USA. These organisations and countries
accounted for 92.8 percent of the outstanding debt stock as at end 2014.

21
Table 3.5: Foreign Borrowing by Economic Sector of Resident Enterprises
(Shs. billions)
Major Sector
2013 2014
Stocks Disbursements Repayments Other
Changes Stocks
Agriculture
28.1
4.4 - 0.8
6.3
38.0
Manufacturing
123.3
5.2 - 34.4
-
94.1
Electricity & gas
1,785.4
94.8 - 108.8
156.0
1,927.4
Wholesale & retail trade
55.3 102.2 - 80.4
-
0.0
77.0
Transportation & Storage
20.4
0.6 - 4.9
0.2
16.3
Accommodation & food
54.0 - -
-
54.0
I.C.T.
118.4
7.0 - 20.6
- 0.4
104.3
Finance & Insurance
33.0
2.8 - 10.4
-
25.4
Real estate activities
76.9
21.1 - 3.8
1.9
96.1
Administrative services
53.0 - - 0.1
-
52.8
Water Supply
25.7
5.9 - 1.2
2.6
33.0
Grand Total
2,373.5
243.8
-
265.3
166.7
2,518.6
Source: PSIS 2015 findings
3.3. Incorporating the Results in the Balance of Payments
Incorporation of the survey results for transactions in the BOP involved
converting the transactions into US dollars from Uganda Shillings using the
annual average exchange rate of Shs. 2,599.79 per US$ for 2014. Transactions
relating to foreign direct investment, foreign borrowing and related income in
form of dividends and distributed branch profits were grossed-up using a factor
of 1.13 determined from the proportion of responding enterprises relative to the
sampling frame (see, details on the derivation of the grossing-up in Appendix A).
Table 3.6 shows a comparison of the survey results with the corresponding
grossed-up BOP estimates, the details are in Appendix B, Table B.4.).

22
Table 3.6: Survey Estimates and Respective Grossed-Up Estimates of
Foreign Direct Investment and Foreign Borrowing
Component of FDI
2013 2014 2014-US$
Stocks Transactions Other
Changes Stocks Derived
Transactions Up-rated
Transactions
Foreign Direct Investment (FDI) 26,198.4 2,429.6 -612.3 28,015.7 934.5 1,058.6
Direct Investor (DI) 25,209.7 2,477.3 -648.0 27,039.0 952.9 1,079.4
Fellow Enterprise (FE) 988.7 -47.7 35.7 976.7 -18.4 -20.8
Total Equity (OFBV) 22,337.7 1,701.7 -142.1 23,897.3 654.6 741.4
Direct Investor (DI) 22,336.9 1,701.6 -142.0 23,896.5 654.5 741.4
Equity Shares 6,350.8 1,343.0 -94.2 7,599.6 516.6 585.1
Retained Earnings 1,690.1 358.7 -282.0 1,766.8 138.0 156.3
Revaluation 14,296.0 0.0 234.1 14,530.1 0.0 0.0
Fellow Enterprise (FE) 0.8 0.1 -0.1 0.8 0.0 0.0
Equity Shares 0.4 0.1 0.0 0.4 0.0 0.0
Retained Earnings 0.0 0.0 -0.1 -0.1 0.0 0.0
Revaluation 0.4 0.0 0.0 0.4 0.0 0.0
Other Capital (Affiliated Debt) 3,860.7 727.9 -470.2 4,118.4 280.0 317.1
Direct Investor (DI) 2,872.8 775.6 -506.0 3,142.5 298.3 337.9
Loans 2,349.1 801.5 -495.0 2,655.6 308.3 349.2
Short-term 476.7 119.8 4.0 600.5 46.1 52.2
Long-term 1,872.4 681.7 -499.0 2,055.1 262.2 297.0
Trade credits 523.8 -25.9 -11.0 486.9 -10.0 -11.3
Short-term 361.1 -25.3 -11.0 324.8 -9.7 -11.0
Long-term 162.6 -0.5 0.0 162.1 -0.2 -0.2
Fellow Enterprise (FE) 987.9 -47.8 35.8 975.9 -18.4 -20.8
Loans 496.2 -167.2 35.8 364.8 -64.3 -72.8
Short-term 47.5 2.8 0.0 50.3 1.1 1.2
Long-term 448.7 -170.0 35.8 314.4 -65.4 -74.1
Trade credits 491.7 119.4 0.0 611.1 45.9 52.0
Short-term 408.8 68.9 0.2 477.9 26.5 30.0
Long-term 82.9 50.5 -0.1 133.2 19.4 22.0
Other Investments 2,529.1 -4.1 191.2 2,716.3 -1.6 -1.8
Other Equity (<10%) 155.6 17.5 24.5 197.7 6.7 7.6
Portfolio Investment (PI) 36.5 16.1 17.3 69.8 6.2 7.0
Other Equity (OE) 119.2 1.4 7.2 127.8 0.5 0.6
Foreign Borrowings (non- affiliated) 2,373.5 -21.6 166.7 2,518.6 -8.3 -9.4
Loans 2,247.0 -12.0 167.8 2,402.8 -4.6 -5.2
Short-term 7.9 -1.7 0.0 6.3 -0.7 -0.7
Long-term 2,239.0 -10.3 167.7 2,396.5 -4.0 -4.5
Trade credits 126.5 -9.6 -1.1 115.8 -3.7 -4.2
Short-term 126.3 -9.6 -1.1 115.6 -3.7 -4.2
Long-term 0.2 0.0 0.0 0.2 0.0 0.0
Dividends paid/remitted N/A 419.9 N/A N/A 161.5 182.9
Source: PSIS 2015 findings

23
The up-rated results revealed that foreign direct investment transactions during
2014 decreased slightly to US$1,058.6 million from the estimated inflow of
US$1,097.1 million during 2013 (details are provided in Appendix Table: B.3).
The main inflows were in the form of equity recorded at US$741.4 million,
representing a 12.5 percent decline from US$846.9 million received during 2013.
Other capital (debt from foreign affiliates) increased to a net disbursement of
US$317.1 million during 2014 compared to US$250.2 million estimated for 2013.
The grossed-up net flows (disbursement less principal repayments) of foreign
non-affiliated borrowings by resident enterprises was an estimated net outflow of
US$9.4 million during 2014 compared to a net outflow of US$18.3 million during
2013. The results further showed that the grossed-up distributed return on
investment (dividends) paid to foreign direct investors during 2014 decreased to
US$ 139.1 million from US$229.0million reported in 2013. The grossed-up flows
and stocks from 2008 – 2014 by source country are presented in Appendix Table
B.4 and B.5, respectively.
3.4. Conclusions
Uganda’s private sector investment inflows declined slightly during 2014
compared with 2013. The decline in FDI was on account of mainly lower inflows
of new equity compared to 2013. The prospects for 2015 are for higher flows
especially in the electricity and gas and construction sectors following the
planned public investments in infrastructure.

a
APPENDIX – A: Sampling and Grossing-up Methodology
Based on the information available, all enterprises with known foreign assets
and liabilities from previous surveys were covered in the survey. Newly licensed
enterprises by the UIA during 2014, enterprises from URA top 1,000 tax payers
not covered in previous private sector investment surveys and the list of new
investments received during 2014 reported in from the print and electronic.
This sampling approach was followed to ensure comprehensive coverage of
enterprises with foreign direct investment and borrowing as well as to ensure
consistency with previous survey estimates. The approach was also to enable
comparison of estimates obtained from previous surveys and the development
of the data time series of FDI at enterprise level.
The grossing-up methodology was done in two stages with the first stage based
on office estimates for non-responding enterprises that had responded to
previous surveys but did not respond during PSIS 2015. The office estimates
were based on previous survey responses to derive the beginning of period
stocks and sector growth factors derived from responding enterprises within
the same sector to derive transactions during the year. Financial statements
covering 2013 and 2014 were used to augment the estimation for enterprises
that provided their statements.
The next stage involved grossing-up for non-response of newly licensed
enterprises. Since there were no previous estimates for newly licensed
enterprises, it was not possible to make office estimates. The grossing-up was
based on their overall share in the sample frame. Subsequently, a grossing-up
factor of 1.13, derived as the reciprocal of the response rate of the survey, was
applied to all estimates to cater for the non-response by the newly licensed
enterprises.

b
APPENDIX – B: Statistical Appendix
Table B.1: Total Employment by Economic Sectors in 2013 and 2014
Major Sector
2013 2014
Local
Foreign
Total Local
Foreign
Total Long-Term
Short-Term
Long-Term
Short-Term
Agriculture 15,392 83 0 15,475 16,087 83 0 16,170
Mining & quarrying 432 32 70 534 434 41 62 537
Manufacturing 32,262 1,615 0 33,877 31,800 1,723 0 33,523
Electricity & gas 1,586 154 0 1,740 1,633 156 0 1,789
Water supply 89 3 0 92 96 7 0 103
Construction 2,460 317 11 2,788 3,342 420 9 3,771
Wholesale & retail trade 6,696 457 0 7,153 6,946 428 0 7,374
Transportation & storage 2,524 47 0 2,571 3,100 45 0 3,145
Accommodation & food 2,970 68 2 3,040 2,952 72 0 3,024
I.C.T. 3,752 55 0 3,807 3,464 51 0 3,515
Finance & insurance 12,838 106 1 12,945 13,182 96 1 13,279
Real estate 238 6 1 245 442 14 4 460
Professional 865 12 0 877 718 14 0 732
Administrative services 19,212 67 0 19,279 18,909 63 0 18,972
Education 166 13 0 179 280 20 0 300
Health 506 44 0 550 519 44 0 563
Arts & entertainment 291 7 0 298 295 7 0 302
Total 102,279 3,086 85 105,450 104,199 3,284 76 107,559
Source: PSIS 2015 findings

c
Table B.2: Compensation of Employees by Economic Sectors in 2013
and 2014-(US$ millions)
Major Sector
2013 2014
Foreign
Local
Foreign
Local Long-Term
Short-
Term
Long-
Term
Short-
Term
Agriculture 1.5 0.0 24.7 4.2 0.5 25.0
Mining & quarrying 12.3 2.4 40.7 10.7 2.2 38.3
Manufacturing 21.5 2.1 183.7 23.3 2.4 188.3
Electricity & gas 6.0 0.0 36.0 5.7 0.0 33.5
Water supply 0.1 0.0 1.3 0.1 0.0 1.5
Construction 5.3 0.8 20.1 4.2 0.5 15.1
Wholesale & retail trade 18.9 0.0 44.5 17.8 0.1 47.8
Transportation & storage 2.0 0.0 31.0 0.9 0.0 29.6
Accommodation & food 2.2 0.0 10.3 1.4 0.0 9.2
I.C.T. 12.5 0.0 80.5 12.5 0.0 61.9
Finance & Insurance 17.8 0.0 260.7 14.6 0.0 259.9
Real estate 0.2 0.0 1.6 0.2 0.0 1.6
Professional 2.1 0.0 14.5 2.6 0.6 11.0
Administrative services 4.0 0.0 26.8 1.8 0.0 23.6
Education 0.6 0.0 2.4 1.0 0.0 2.7
Health 2.3 0.0 3.6 3.4 0.0 3.5
Arts & entertainment 0.0 0.0 0.5 0.0 0.0 0.6
Total 109.1 5.5 783.0 104.3 6.2 753.1
Source: PSIS 2015 findings

d
Table B.3: Grossed-up Foreign Direct Investment and Foreign Borrowing
during 2013 and 2014-(US$ millions)
Components
2013 2014
Derived transactions
Up-rated figures Derived
transactions Up-rated BOP
figures
Foreign Direct Investment
873.0
1,097.1 934.5 1,058.6
Total Equity 673.9 846.9 654.6 741.4
Share capital 574.0 721.4 516.6 585.2
Retained Earnings 99.8 125.5 138.0 156.3
Revaluation 0.0 0.0 0.0 0.0
Other Capital 199.1 250.2 280.0 317.1
Foreign Borrowing (Loans and Trade credit)
-14.5
-18.3 -8.3 -9.4
Short-term -9.8 -12.3 -4.3 -4.9
Long-term -4.8 -6.0 -4.5 -4.5
Dividends paid/remitted
182.2
229.0 122.8 139.1
Source: PSIS 2015 findings

e
Table B.4: Integrated Foreign liabilities, Grossed-up Transactions and
their Components during 2014
Component of FDI
2013-Shs. billions
2014-Shs. billions 2014-US$ millions
Stocks Transactions Other
Changes Stocks
Derived Transactions
Up-rated Transactions
Foreign Direct Investment (FDI) 26,198.4 2,429.6 -612.3 28,015.7 934.5 1,058.6
Direct Investor (DI) 25,209.7 2,477.3 -648.0 27,039.0 952.9 1,079.4
Fellow Enterprise (FE) 988.7 -47.7 35.7 976.7 -18.4 -20.8
Direct Equity (OFBV) 22,337.7 1,701.7 -142.1 23,897.3 654.6 741.4
Direct Investor (DI) 22,336.9 1,701.6 -142.0 23,896.5 654.5 741.4
Equity Shares 6,350.8 1,343.0 -94.2 7,599.6 516.6 585.1
Retained Earnings 1,690.1 358.7 -282.0 1,766.8 138.0 156.3
Revaluation 14,296.0 0.0 234.1 14,530.1 0.0 0.0
Fellow Enterprise (FE) 0.8 0.1 -0.1 0.8 0.0 0.0
Equity Shares 0.4 0.1 0.0 0.4 0.0 0.0
Retained Earnings 0.0 0.0 -0.1 -0.1 0.0 0.0
Revaluation 0.4 0.0 0.0 0.4 0.0 0.0
Other Capital (Affiliated Debt) 3,860.7 727.9 -470.2 4,118.4 280.0 317.1
Direct Investor (DI) 2,872.8 775.6 -506.0 3,142.5 298.3 337.9
Loans 2,681.8 801.5 -495.0 2,988.4 308.3 349.2
Short-term 476.7 119.8 4.0 600.5 46.1 52.2
Disbursements 0.0 130.1 0.0 0.0 50.0 56.7
Repayments 0.0 -10.3 0.0 0.0 -4.0 -4.5
Other Changes 0.0 0.0 4.0 0.0 0.0 0.0
Long-term 1,872.4 681.7 -499.0 2,055.1 262.2 297.0
Disbursements 0.0 770.0 0.0 0.0 296.2 335.5
Repayments 0.0 -88.3 0.0 0.0 -34.0 -38.5
Other Changes 0.0 0.0 -499.0 0.0 0.0 0.0
Trade credits 523.8 -25.9 -11.0 486.9 -10.0 -11.3
Short-term 361.1 -25.3 -11.0 324.8 -9.7 -11.0
Disbursements 0.0 55.0 0.0 0.0 21.2 24.0
Repayments 0.0 -80.4 0.0 0.0 -30.9 -35.0
Other Changes 0.0 0.0 -11.0 0.0 0.0 0.0
Long-term 162.6 -0.5 0.0 162.1 -0.2 -0.2
Disbursements 0.0 12.1 0.0 0.0 4.7 5.3
Repayments 0.0 -12.6 0.0 0.0 -4.9 -5.5
Other Changes 0.0 0.0 0.0 0.0 0.0 0.0
Fellow Enterprise (FE) 987.9 -47.8 35.8 975.9 -18.4 -20.8
Loans 496.2 -167.2 35.8 364.8 -64.3 -72.8
Short-term 47.5 2.8 0.0 50.3 1.1 1.2
Disbursements 0.0 8.5 0.0 0.0 3.3 3.7
Repayments 0.0 -5.7 0.0 0.0 -2.2 -2.5
Other Changes 0.0 0.0 0.0 0.0 0.0 0.0
Long-term 448.7 -170.0 35.8 314.4 -65.4 -74.1
Disbursements 0.0 69.4 0.0 0.0 26.7 30.3
Repayments 0.0 -239.5 0.0 0.0 -92.1 -104.3
Other Changes 0.0 0.0 35.8 0.0 0.0 0.0
Trade credits 491.7 119.4 0.0 611.1 45.9 52.0
Short-term 408.8 68.9 0.2 477.9 26.5 30.0
Disbursements 0.0 151.7 0.0 0.0 58.3 66.1
Repayments 0.0 -82.7 0.0 0.0 -31.8 -36.1
Other Changes 0.0 0.0 0.2 0.0 0.0 0.0
Long-term 82.9 50.5 -0.1 133.2 19.4 22.0
Disbursements 0.0 84.5 0.0 0.0 32.5 36.8
Repayments 0.0 -34.0 0.0 0.0 -13.1 -14.8
Other Changes 0.0 0.0 -0.1 0.0 0.0 0.0
Other Investments 2,529.1 -4.1 191.2 2,716.3 -1.6 -1.8
Other Equity (<10%) 155.6 17.5 24.5 197.7 6.7 7.6
Portfolio Investment (PI) 36.5 16.1 17.3 69.8 6.2 7.0
Other Equity (OE) 119.2 1.4 7.2 127.8 0.5 0.6
Foreign Borrowings (non-affiliated) 2,373.5 -21.6 166.7 2,518.6 -8.3 -9.4
Loans 2,247.0 -12.0 167.8 2,402.8 -4.6 -5.2
Short-term 7.9 -1.7 0.0 6.2 -0.7 -0.7
Disbursements 0.0 1.0 0.0 0.0 0.4 0.4
Repayments 0.0 -2.7 0.0 0.0 -1.0 -1.2
Other Changes 0.0 0.0 0.0 0.0 0.0 0.0
Long-term 2,239.1 -10.3 167.7 2,396.6 -4.0 -4.5
Disbursements 0.0 138.4 0.0 0.0 53.2 60.3
Repayments 0.0 -148.6 0.0 0.0 -57.2 -64.8
Other Changes 0.0 0.0 167.7 0.0 0.0 0.0
Trade credits 126.5 -9.6 -1.1 115.8 -3.7 -4.2
Short-term 126.3 -9.6 -1.1 115.6 -3.7 -4.2
Disbursements 0.0 104.4 0.0 0.0 40.2 45.5
Repayments 0.0 -114.0 0.0 0.0 -43.8 -49.7
Other Changes 0.0 0.0 -1.1 0.0 0.0 0.0
Long-term 0.2 0.0 0.0 0.2 0.0 0.0
Disbursements 0.0 0.0 0.0 0.0 0.0 0.0
Repayments 0.0 0.0 0.0 0.0 0.0 0.0
Other Changes 0.0 0.0 0.0 0.0 0.0 0.0
Source: PSIS 2015 findings

f
Table B.5: Grossed-up FDI Flows by Source Countries 2008 – 2014-(US$
millions)
Country 2008 2009 2010 2011 2012 2013 2014
1 Australia 163.92 189.27 120.12 201.13 203.09 81.8 81.9
2 Kenya 94.21 55.49 86.12 172.55 99.37 44.5 109.6
3 Netherlands 16.76 16.24 121.52 164.41 611.19 493.5 491.4
4 UK 249.72 227.78 126.74 115.81 116.81 78.9 250.3
5 UAE 89.03 102.80 65.24 109.24 64.37 1.8 16.3
6 Mauritius 30.91 54.01 90.56 104.54 6.27 71.3 67.1
7 Switzerland 35.67 41.18 26.14 43.76 -12.92 2.6 28.9
8 Bermuda 50.36 87.41 11.62 38.00 -13.36 0.5 10.3
9 Denmark 17.15 19.80 12.57 21.04 -2.19 -3.5 -4.2
10 India 27.41 18.77 38.13 19.15 39.32 18.7 18.1
11 Nigeria 15.49 17.88 11.35 19.00 5.24 -3.7 9.2
12 South Africa 51.14 89.53 16.85 14.40 24.95 11.4 -71.4
13 Singapore 1.01 0.10 -1.72 9.49 9.63 2.1 -17.2
14 IO 6.95 8.02 5.09 8.52 5.78 8.7 0.1
15 Egypt 5.78 6.68 4.24 7.10 -2.60 9.4 1.8
16 Norway 4.35 5.02 3.18 5.33 2.88 5.6 -4.1
17 Togo 2.91 3.36 2.13 3.57 1.09 17.9 13.0
18 USA 69.27 18.83 10.31 3.44 20.36 8.5 8.4
19 Canada 2.74 3.16 2.01 3.36 -6.73 6.3 -0.2
20 Others -198.99 -115.74 -213.00 -169.56 32.83 241.0 49.4
Total 728.86 841.57 534.11 894.29 1,205.39 1,097.1 1,058.6
Source: PSIS 2015 findings