Embed Size (px)
Citation preview
0 | P a g e
Foreign Direct Investment in the Banking Sector: Empirical
Evidence from Turkey
A thesis submitted for the degree of
Doctor of Philosophy
Division of Economics
Stirling Management School
By
Dervis Kirikkaleli
January 2013

1 | P a g e
Declaration
In accordance with the Regulations for Higher Degrees by Research, I hereby declare that the
whole thesis now submitted for the candidature of Doctor of Philosophy is a result of my own
research and independent work except where reference is made to published literature. I also
hereby certify that the work embodied in this thesis has not already been submitted in any
substance for any degree and is not being concurrently submitted in candidature for any
degree from any other institute of higher learning. I am responsible for any errors and
omission present in the thesis.
Candidate:
Dervis Kirikkaleli

2 | P a g e
Abstract
Multinational bank activities have gradually risen in developing countries since the beginning
of the globalisation process. Rising foreign bank activities in developing countries have
motivated researchers to investigate foreign banks, comprehensively. Turkey is a typical
example of a developing country that achieved a tremendous growth rate in foreign bank
asset, especially throughout the last decade. The aim of this thesis is to examine two-way
linkage; (1) between foreign bank penetration (FBP) and banking variables; (2) between FBP
and country risk and (3) between FBP, foreign direct investment (FDI) and foreign portfolio
investment (FPI) in Turkey. Therefore, this thesis is constructed by three empirical sections.
Moreover the pattern of FDI inflow and outflow in the world and in Turkey has been
analysed, chronologically. In addition, the theory of FDI is taken into account and existing
FDI theories has been criticised.
In the first empirical work – Chapter 3 - the short run and long run relationship, if it exits,
between FBP and determinants of bank performance (namely, domestic bank assets, domestic
credit and banking profitability) in Turkey was investigated after controlling DGDP1 and
2001 financial crisis (DUM2001). The outcome of the Granger causality test indicates that
there was unilateral causality which runs from DDB2 to DFBP
3. Moreover, I also found
feedback causality between DFBP and DCREDIT4. By employing impulse response
functions, I found that there is positive relationship between DFBP and DCREDIT as I
expected. Moreover, the response of DFBP to one standard deviation shock in domestic bank
1 DGDP denotes the first difference of GDP.
2 DDB denotes the first difference of domestic bank assets (DB).
3 DFBP denotes the first difference of FBP.
4 DCREDIT denotes the first difference of domestic credit (CREDIT).

3 | P a g e
assets is initially statistically significant and positive. The reverse effect is statistically
significant and positive. In the final model, the response of DFBP to one standard deviation
shock in profitability (PRO) is significant and positive at 3rd
quarter. The reverse effect is
surprisingly positive but not statistically significant.
Specifically, what has not been also investigated deeply in the empirical literature is the two-
way linkage between foreign bank penetration and risk such as political, financial and
economic. Thus, in chapter 4, linkage between FBP and country risk (namely, political risk,
economic risk and financial risk) was examined in Turkey using quarterly data from 1994Q1
to 2009Q4. My finding indicated that I found one error correction term significant and
positive in bivariate vector error correction in model 1 and 2, implying that in the long run,
foreign bank penetration has contributed to economic and political risk. Moreover, short run
causality based on VAR approach between DFBP and financial risk is investigated but I
failed to find any significant causality in the VAR model after controlling DGDP and 2001
financial crisis, even at the 10% level. By analysing impulse response functions, I could not
detect any significant relationship between DFBP and host country risk variables in the short
run. This is because adding control variables (DGDP and DUM2001) make the relationship
between host country risk variables and DFBP statistically insignificant.
Finally, I investigated two-way linkage between FBP, FPI and FDI in Turkey after
controlling DGDP and 2001 financial crisis. The finding from the VAR based block
exogeneity wald test indicated that changes in DFBP significantly lead to changes in DFDI5
and there is also unilateral causality which runs from FPI to DFBP. Moreover, using the
variance decomposition technique I found that DFDI and FPI have little explanatory power
5 DFDI denotes the first difference of FDI.

4 | P a g e
for the evolution of DFBP in Turkey. The contribution of DFBP to the variability of DFDI is
more than that of FPI. The contribution of DFDI to FPI variability ranges between 0.000%
and 9.122% throughout 12 quarter periods whilst the contribution of DFBP to FPI variability
ranges between 0.000% and 7.611%.

5 | P a g e
Acknowledgements
This study would not have been possible without the supports of organisations and many
people. Therefore, firstly I would like to thanks my current supervisor, Prof. David Bell for
his comments and helps to my research during my PhD study. The author would like to thank
the Ministry of Education in T.R.N.C and As bank for funding this research, without which I
could not deal with the expenses of conducting a PhD at the University of Stirling.
Special thanks also to my initial supervisors R.I.P. Dr Dipak Ghosh - who was also
supervisor for my MSc thesis - and Dr. Paul Alagidede for opening my eyes to discover and
understand my best skills. In addition, the author wishes to express appreciation to the
Department of Economics in the University of Stirling for providing good facilities and friendly
academic environment to complete my research. Finally, I am thankful to my parents for their
persistent moral and financial supports since the beginning of my education.

6 | P a g e
Table of Contents
Index of Tables ….……….….……………………………………………..………..……… 12
Index of Figures …………….…………………………………………….…..………….… 14
Chapter 1: Introduction ……………………………………………………..….…….…… 16
Chapter 2: FDI and its Pattern in Turkey...………………………………..….…….…… 20
2.1 Definition of FDI ……………………………………………….…..…. 20
2.2 Benefits and Costs of FDI to Host Country …..………...……………….. 25
2.2.1 Economic Growth ………………...………………………….. 25
2.2.2 Employment ………………….……………………………… 26
2.2.3 Technology and Managerial Skills ……….…….……………. 28
2.2.4 Competition ………………………………….….…………… 30
2.2.5 Environment ……………………………….…….……….….. 31
2.2.6 Balance of Payment …………………………..……………… 32
2.3 Historical Trend of FDI in the World and in Turkey …………………… 34
2.3.1 Historical Pattern of FDI in the World …………………….. 34

7 | P a g e
2.3.1.1 Inter-war Period (1914-1948)…………….…………. 34
2.3.1.2 World War II to 1979 ………...…………………….. 36
2.3.1.3 1980 to Present …………..…...…………..………… 40
2.3.2 The Pattern of FDI in Turkey …………………………...……. 46
2.3.2.1 The Period of Ottoman Empire ………………..….….. 46
2.3.2.2 1923 to 1980 …………………………….……………. 47
2.3.2.3 1950 to the Beginning of Globalisation…………………….. 48
2.3.2.4 The Beginning of Globalisation to Present ………… 51
2.3.3 FDI Legal Framework………………………………………… 60
2.3.4 Foreign-owned Companies and its Sectoral and Regional
Distribution……………………………………………………………..…… 64
2.3.5 Sectoral and Regional Distribution of FDI …………….…….. 68
2.3.5.1 Sectoral Composition of FDI in the World ….….….. 68
2.3.5.2 Sectoral Composition of FDI in Turkey …….……… 71
2.4 Foreign Banking in Turkey……………………..…………………...….. 75
2.5 References ……………………………………………………………… 82

8 | P a g e
Chapter 3: Theory of Multinational Corporation ……………………………………….. 95
3.1 Abstract …………………………………………………………………. 95
3.2 Introduction …………………………………………….……………….. 96
3.3 Monopolistic Advantage Theory ………………………...………….…. 100
3.4 Product Cycle Theory ………………………………..…….….………. 104
3.5 Oligopolistic Reaction Theory ……………………………...…..……… 106
3.6 Currency Areas and Exchange Rate Theory ……………..…………….. 107
3.7 Transaction Cost Theory (Internalisation Approach) ……......………… 109
3.8 Eclectic Theory ……………………………………...…………………. 112
3.9 References ……………………………………………..……………… 120
Chapter 4: Foreign Bank Penetration and Domestic Banking System: Empirical
Evidence from Turkey Based on VAR Approach …………………………….………. 129
4.1 Abstract …………………………………….…………………………. 129
4.2 Introduction ………………………………..………………………….. 130
4.3 Literature Review ………………………………………….………….. 132
4.3.1 Foreign Bank Penetration and Profitability ……….………… 133
4.3.2 Foreign Bank Penetration and Domestic Credit …………….. 134

9 | P a g e
4.3.3 Foreign Bank Penetration and Domestic Banks ….…………. 137
4.4 Data …………………………………………………………………… 140
4.5 Methodology ……………………………………………….…………. 146
4.6 Empirical Findings ……………………………………………………. 151
4.7 Conclusion …………………………………………………………….. 163
4.8 References ……………………………………………….……………. 165
4.9 Appendix ..……………………………………………………….……. 176
4.9.1 Data Appendix……………………………………………….. 178
4.9.1.1 FBP ……………………………..………………..... 178
4.9.1.2 PRO……………………………..………………..... 179
4.9.1.3 CREDIT……….………………..………………..... 179
4.9.1.4 DS……………………………..………………........ 179
4.9.1.5 GDP……………………………..………………..... 180
4.9.1.6 DUM2001……………………………..……..…..... 180
Chapter 5: The Linkage between Foreign Bank Penetration and Host Country Risks:
The Case of Turkey ……………………………………………………………………… 182
5.1 Abstract ……………………………………………………….………. 182
5.2 Introduction …………………………………………………………… 183

10 | P a g e
5.3 Literature Review …………………………….……………………….. 185
5.3.1 Political Risk and Foreign Bank …………….………………. 186
5.3.2 Economic Risk and Foreign Bank …………….…………….. 188
5.3.3 Financial Risk and Foreign Bank …………………………… 189
5.4 Data and Methodology …………………………………….………….. 190
5.5 Empirical Findings ……………………………………………………. 200
5.6 Conclusion …………………………………………………………….. 210
5.7 References …..………………………………………………………… 212
5.8 Appendix …………………………………………………..…..……… 220
5.8.1 Data Appendix……………………………………………….. 222
5.8.1.1 FBP ………...……………………………………… 222
5.8.1.2 PRR………...……………………………………… 223
5.8.1.3 ERR………...……………………………………… 223
5.8.1.4 FRR………...……………………………………… 224
5.8.1.5 GDP………...……………………………………… 224
5.8.1.6 DUM2001………...……………...………………… 225

11 | P a g e
Chapter 6: Capital Flows to Turkey: Multivariate VAR Approach …………………. 226
6.1 Abstract ……………………………………………………………….. 226
6.2 Introduction …………………………………………………………… 227
6.3 Literature Review ………………………………………….………….. 230
6.4 Data …………………………………………………………………… 235
6.5 Empirical Modelling and Findings …………………………………… 239
6.5.1 Unit Root Test ………………….…………………………… 239
6.5.2 Block Exogenous Wald Test …………………..……………. 242
6.5.3 Variance Decomposition …………………….……………… 246
6.6 Conclusion …………………………………………………..………… 248
6.7 References………………………………………..…………..………… 250
6.8 Appendix ……………………………………………………………… 257
6.8.1 Data Appendix ………………………………………………. 258
6.8.1.1 FBP ………………………………………………... 258
6.8.1.2 FDI…………………………………….…………... 259
6.8.1.3 FPI……………………………………..…………... 259
6.8.1.4 GDP………………………………………………... 260
6.8.1.5 DUM2001……………………………….…………. 260

12 | P a g e
Index of Tables
Table 1: Estimated Stock of Accumulated FDI by Recipient Area (Million US $) …..……. 36
Table 2: FDI Inflow and Outflow in the World (Million US $) (1970 - 1979) ………..…… 38
Table 3: The Growth of FDI Inflow and Outflow in the World ………………………...….. 38
Table 4: FDI Outflow in the World (Million US $) (1980-2007) ………………………..… 42
Table 5: The Growth of FDI Inflow and Outflow in the World ……………………………. 43
Table 6: Permitted FDI Inflow and FDI Stock in Turkey (1954-1969) (Million US $) .…... 50
Table 7: FDI Inflow in Turkey (Million US $) (1980-1990) …………………………...….. 54
Table 8: FDI Inflow in Turkey (Million US $) (1990-1999) …………………………...….. 56
Table 9: Turkey‟s Inward FDI Potential and Performance FDI Scores and Ranking ……… 57
Table 10: Top Ten FDI Recipient Country and Turkey (2003-2006) (Billion US $) …….... 58
Table 11: Regional Distribution of Foreign-owned Companies in Turkey in 2007 ……..… 65
Table 12: Sectoral Distribution of the Foreign-owned Companies by Province in Turkey
(1954-2007) ………………………………………………………………………………… 66
Table 13: Sectoral Distribution of FDI Inflow Stock in the World (Billion US $) ………… 69
Table 14: Sectoral Distribution of Authorised FDI in Turkey …………………………...… 71
Table 15: Sectoral Distribution of FDI inflow in Turkey (Million US $) …………..….….. 73
Table 16: Financial Intermediaries FDI inflow in Turkey (Million US $) ……..………….. 74

13 | P a g e
Table 17: Determinant and Impact of Foreign Bank Penetration …………………..…….. 139
Table 18: Descriptive Statistics for the Variables of FBP, PRO, CREDIT and DB..…..…. 142
Table 19: Unit Root Test for the Variables of FBP, PRO, CREDIT and DB …………..… 153
Table 20: Johansen Cointegration Test ……………………………………………….…... 155
Table 21: VAR Based Granger Casualty (Block Exogeneity Wald Test) ………………... 157
Table 22: Variance Decomposition ……………………………………………………..… 160
Table 23: Autocorrelations LM Tests ………………………...……………...…………… 176
Table 24: VAR Residual Heteroskedasticity Tests ……………………………………….. 176
Table 25: Descriptive Statistics for the Variables of FBP, PRR, ERR and FRR ……….… 195
Table 26: Unit Root Test for the Variables of FBP, PRR, ERR and FRR ………………... 201
Table 27: Johansen Cointegration Test …………………………………………………… 203
Table 28: VECM and VAR Tests ………………………………………………………… 205
Table 29: Autocorrelations LM Tests ………………………...……………...…………… 220
Table 30: VAR Residual Heteroskedasticity Tests ...……………………………..………. 220
Table 31: Capital Flows in Turkey (Million US $) ………………………………..……… 230
Table 32: Unit Root Test for the Variables of FBP, FDI and FPI ………………...………. 241
Table 33: Block Exogeneity Wald Test for the Variables of FBP, FDI and FPI ….……… 245
Table 34: Variance Decomposition ……………………………………………………….. 247

14 | P a g e
Table 35: Autocorrelations LM Tests ………………………...……………...…………… 257
Table 36: VAR Residual Heteroskedasticity Tests ……………………………………….. 257
Index of Figures
Figure 1: Foreign Direct Investment, Net Inflows (% of GDP) in the World ..………….… 45
Figure 2: Growth of Permitted FDI Inflow in Turkey ……………………………………... 51
Figure 3: Total Assets of Foreign Banks (US Billion $)……………….……….….……... 144
Figure 4: Total Credit in the Banking Sector (US Billion $)………………….....………... 144
Figure 5: Total Assets in the Banking Sector (US Billion $)……………..….….………... 145
Figure 6: Return on Assets in the Banking Sector ………………………………………... 145
Figure 7: Response of DFBP to DDB ………………..………………………………........ 158
Figure 8: Response of DDB to DFBP ……………..…………………………...…………. 158
Figure 9: Response of DFBP to DCREDIT ………………………………...…….………. 158
Figure 10: Response of DCREDIT to DFBP ……………………………………..………. 159
Figure 11: Response of DFBP to PRO ………………………………………..…...……… 159
Figure 12: Response of PRO to DFBP ……………………………………………….…… 159
Figure 13: Inverse Roots of AR Characteristic Polynomial ……………………...………. 176
Figure 14: Total Assets of Foreign Banks (US Billion $) ………………………………… 195

15 | P a g e
Figure 15: Economic Risk Index (ERR)…………………………………………………... 195
Figure 16: Financial Risk Index (FRR)……………………………………………………. 196
Figure 17: Political Risk Index (PRR)…………………………………………………….. 196
Figure 18: Response of DPRR to DFBP ………………………..………………………… 207
Figure 19: Response of DFBP to DPRR ………………………………………...…….….. 207
Figure 20: Response of DERR to DFBP …………………………….……………………. 208
Figure 21: Response of DFBP to DERR ……………………………….………………..... 208
Figure 22: Response of DFRR to DFBP ……………………………….………...……….. 209
Figure 23: Response of DFBP to DFRR ………………………………………………..… 209
Figure 24: Inverse Roots of AR Characteristic Polynomial ………………………………. 220
Figure 25: Total Assets of Foreign Banks (US Billion $)…………………………….…… 238
Figure 26: Foreign Direct Investment (US Million $)…………………………….………. 238
Figure 27: Foreign Portfolio Investment (US Million $)………………..………………… 239
Figure 28: Inverse Roots of AR Characteristic Polynomial …………………………….… 257

16 | P a g e
Chapter 1: Introduction
The rising magnitude of investments of multinational enterprises (MNEs) has encouraged
researchers to grow their interest in the consequences and causes of foreign direct investment
(FDI). In the same direction with the globalisation process6, multinational bank activities
have gradually risen in developing countries. Rising foreign bank activities in developing
countries have motivated researchers to investigate foreign banks, comprehensively. Turkey
is a typical example of a developing country that achieved a tremendous growth rate in
foreign bank asset, especially throughout the last decade. The share of bank assets held by the
foreign banks in Turkey has jumped from US$ 8.15 billion (3.50% of the total banking
assets) in 2005Q1 to US$ 84.24 billion (13.72% of the total banking assets) in 2010Q3. These
numbers clearly show that Turkey attracted foreign bank interest despite the current global
crisis. There is, however, little empirical literature for the foreign banks in Turkey despite this
current pattern. The aim of this thesis is to examine two-way linkage; (1) between FBP and
banking variables; (2) between FBP and country risk and (3) between FBP, FDI and FPI in
Turkey.
In the 2nd
Chapter, initially I define FDI and explain how the definition of FDI changed over
time. Then, the costs and benefits of FDI are explored based on empirical and theoretical
literature. More specifically, the impact of FDI on economic growth, employment,
technology and managerial skills, competition, environment and balance of payment is
explored. As a next step, the chronologic pattern of FDI from the beginning of the 1800s to
present in the world and Turkey is explored. Finally, the evolution of the Turkish banking
6 Globalisation is a process of the integration of economies, cultures and societies around the world. In common,
the word of “globalisation” was used in the concepts of FDI, capital flow, trade and so on. The globalisation
period was started at the beginning of the 1980s when the integration of economies, cultures and societies
around the world accelerated.
17 | P a g e
sector and foreign banking in Turkey from the end of the Ottoman Empire period to present
are investigated.
The main aim of the 3rd Chapter is to evaluate the existing theories of MNEs and reveal their
lack of power to explain the direct investments of MNEs, including the theory of
multinational banking. The nature of FDI is one to one related with MNEs and the theory of
FDI is part of the theories of MNE because most direct investments are realised by MNEs.
These theories are monopolistic advantage theory, product cyclic theory, currency areas and
exchange rate theories, oligopolistic advantage theory, transaction cost theory and Dunning‟s
eclectic paradigm.
Although the performance of foreign and domestic banks in Turkey was heavily investigated,
the short run and long run relationship, if it exists, between banking performance and foreign
bank penetration has not been explored. Therefore, the linkage between FBP and
determinants of bank performance (namely, domestic bank assets, domestic credit and
banking profitability) in Turkey was investigated using quarterly data from 1994Q1 to
2009Q4 after controlling DGDP and 2001 financial crisis. Using Granger causality, impulse
response function, and variance decomposition, I examined the short run dynamics. The
outcome of the Granger causality test indicates that there is feedback causality which runs
from domestic banking to DFBP at 10 % level. I found that in the short run, there is a positive
relationship between DFBP and domestic bank assets by analysing the impulse response
functions. My findings also indicate that there is feedback causality between DFBP and
DCREDIT at 5% level. In line with the literature, the sign of the relationship between DFBP
and domestic credit is positive in the second model as I expected. Finally, my study reveals

18 | P a g e
that no Granger causality between profitability and DFBP is found. The response of DFBP to
one standard deviation shock in PRO is significant and positive at 3rd
quarter. The reverse
effect is surprisingly positive but not statistically significant.
In chapter 4, linkage between DFBP and country risk (namely, political risk, economic risk
and financial risk) was examined in Turkey using quarterly data from 1994Q1 to 2009Q4.
My finding indicated that one cointegrating vector is detected between DFBP and political
risk in model 1 and between DFBP and economic risk in model 2 whereas I failed to find any
long run relationship between DFBP and financial risk using the Johansen co-integration test.
I found one error correction term significant and positive in bivariate vector error correction
in model 1 and 2, implying that in the long run, foreign bank penetration has contributed to
economic and political risk. Moreover, short run causality based on VAR approach between
DFBP and financial risk is investigated but I failed to find any significant causality in the
VAR model, even at the 10% level. In the short run, there is no significant relationship
between foreign bank penetration and host country risk variables in Turkey. This is because
adding control variables (DGDP and DUM2001) make relationship between host country risk
variables and DFBP statistically insignificant.
Finally, I investigated two-way linkage between FBP, FPI and FDI in Turkey while
controlling DGDP and 2001 financial crisis. In order to obtain information about a causal
relationship among the time series variables a VAR based block exogeneity wald test was
performed. The finding from this test indicated that; changes in DFBP significantly lead to
changes in DFDI; there is also unilateral causality which runs from FPI to DFBP at 5% level.
Moreover, using the variance decomposition technique I found that DFDI and FPI have little
explanatory power for the evolution of DFBP in Turkey. The contribution of DFBP to the

19 | P a g e
variability of DFDI is more than that of FPI. The contribution of DFDI to FPI variability
ranges between 0.000% and 9.122% throughout 12 quarter periods whilst the contribution of
DFBP to FPI variability ranges between 0.000% and 7.611%.

20 | P a g e
Chapter 2: FDI and its Pattern in Turkey
Dervis Kirikkaleli
Stirling Management School, Division of Economics, University of Stirling, FK9 4LA
Email: [email protected]
Telephone: +44 (0) 759 100 5766
2.1 Definition of FDI
In the literature, there are various concepts of FDI. Generally, FDI is called “private capital
investment, international direct investment, direct investment and direct foreign capital
investment” even though each concept has a different meaning. Before World War II
(WWII), foreign portfolio investment (FPI)7 depicted the largest share of international
investment and such investment was mostly directed to higher interest rate destinations from
low interest rate destinations (Grazia, 2005). The ratio of FDI to capital flows has gradually
changed since the WW II. With a changing world, the definition of FDI has changed few
times since the 1930s. Razin et al. (1996) stated that the most important characteristic of FDI
is the “control” issue which gives direct investors additional advantages such as local
information and power over the host country enterprises. Foreign investors in the world
generally realised their direct investments to foreign countries when they were able to acquire
whole shares of host country‟s enterprises in the beginning. However, at the present time, the
7 Foreign portfolio investment arises when a foreign investor does not have any managerial control on domestic
company in a host country.

21 | P a g e
importance of the control is minimised and even foreign investors are willing to own host
country‟ enterprises jointly with other investors.
The definition of FDI has shifted from “control” to “lasting interest” (OECD, 1999; Lipsey,
1999; IMF, 1993 and Kehal, 2004). The lasting interest concept involves long-term
relationship between home country‟s investors and host country‟ enterprises with a
considerable degree of influence over the management of the host country „enterprise.
According to the OECD and IMF, FDI takes place when a foreign investor has significant
influence or at least 10 % of the ordinary shares of an incorporated firm in a home country8.
However, some countries ignored this definition of FDI. Therefore, the definition of FDI
varies among countries. Acquiring 10% shares of US‟ enterprise by a foreign investor is
recorded as FDI in the US whereas a foreign investor needs to acquire at least a 20% share of
the host country enterprise in order to be recorded as a direct investment in the UK. This
leads to small gap between total FDI inflows and total FDI outflows. Therefore, the
measurement and definition of FDI varies among countries. In other words, there is no
globally acceptable or unique definition of FDI in the world. In addition, sometimes it is
difficult to identify whether foreign investment is a direct or portfolio investment because
information about the role of foreign investors may not be clear.
Foreign affiliates can be a branch, associate or subsidiary.
8Despite the 10 % share acquisition by a foreign investor in a host market does not give an enough power over
the associated company, but the 10 % used to identify difference between foreign portfolio investment and FDI
in the form of shareholding.

22 | P a g e
Subsidiary: “ An incorporated enterprise in the host country in which another entity directly
owns more than half of the shareholders´ voting power, or is a shareholder in the enterprise,
and has the right to appoint or remove a majority of the members of the administrative,
management or supervisory body” (Moosa, 2002, page 8).
Associates: “An incorporated enterprise in the host country in which an investor, together
with its subsidiaries and associates, owns a total of at least 10%, but not more than half, of
the shareholders´ voting power” (Moosa, 2002, page 8).
Branches: “is a wholly or jointly-owned unincorporated enterprise in the host country, which
may take the form of a permanent office of the foreign investor or an unincorporated
partnership or a joint venture” (Moosa, 2002, page 8).
In Turkey, opening a new operation (Greenfield investment), opening a branch or possessing
at least 10 % share or voting right of a Turkish enterprise by a foreign investor is recorded as
FDI inflow but obtaining a share of a Turkish enterprise by a foreign investor cannot exist in
the IMKB 50 or IMKB 100 which are the stock exchanges in Turkey. According to the FDI
law (No. 4875), portfolio investors are defined as those who purchase foreign stock and other
types of financial assets and own a share of a host enterprise. These investors do not require
possessing managerial and controlling roles of owned shares of the host enterprises.

23 | P a g e
Since the beginning of the globalisation period, higher growth rates in FDI flows relative to
that in FPI and trade in the world have made FDI a more interesting area to research. At the
same direction of the growth, theory of FDI has been developed. Especially, the determinants
and impact of FDI has been a popular research area. What is an interesting point here is that
although there have been a large number of empirical researches, a globally acceptable model
of FDI has not existed (Kehal, 2004). Gradually, an increase in the volume of FDI in the
world led to an improvement in the theory of FDI by answering these questions:
How were foreign companies competitive against host country companies?
Why did companies prefer to invest abroad?
Why did companies prefer direct investment instead of licensing or exporting their
advantages?
Why did firms prefer one country instead of others?
Some researchers focused only on FDI inflows in order to describe the theory of FDI by
answering the question of how host country factors attract FDI. While others concentrated on
FDI outflows to explain the pattern of FDI by answering the question of why firms invest in a
foreign market?
First of all, in order to understand the theory of FDI, it is necessary to answer the question of
“why does company invest abroad?” There is a variety of reasons; (1) to maximise profit; (2)
to increase international competitiveness; (3) to reach raw materials; (4) to get benefit from
monopolistic market in a host market; (5) to internalise company‟s production process; (6) to

24 | P a g e
diversify its risk; (7) to improve technology and managerial skill of the company and so on.
In other words, the theory of multination enterprises must be taken into consideration.
Multinational corporations (MNCs) are crucial for the pattern of FDI flows in the world
because the majority of FDI flows have been realised by MNCs. Since the end of WWII, the
importance of MNCs has gradually grown in both developed and developing countries.
Therefore, the concept of MNCs should be described in order to understand the theory of FDI
clearly. Toyota, McDonalds, Coca-Cola and Sony are some examples of MNCs. More
interestingly, MNCs do not have a globally acceptable and unique definition (UNCTAD,
1998). According to the United Nation (1973), there are 21 different known definitions of
MNCs. The definition of MNCs divides into their features such as size, production capacity,
and value of MNCs‟ assets in a foreign market. In general, a company is classified as a
multinational if the company provides a service or controls production in more than one
country. However, MNCs do not need to be a direct investor because MNCs may hire all
resources that they need for overseas production instead of obtaining them (Rugman, 1982).
At present, FDI is a more stable form of international investment in comparison to FPI
(Lipsey, 1999 and 2001). This approach is proven by the Asian crisis at the second period of
the 1990s. Although the volume of FPI was dramatically reduced and such investment
blamed for the Asian crisis, the reduction of FDI to these countries was much less than that in
FPI because the direct investors are less sensitive to the fragility in the finance markets
relative to the portfolio investors (Albuquerque, 2003 and Wei, 2001).

25 | P a g e
2.2 Costs and Benefits of FDI to Host and Home Countries
Both developed and developing countries in the world aim to attract foreign capital because
they have identified its importance for the economic development of host markets. In line
with this perspective, FDI is likely to improve technology, managerial skills and know-how
in host countries while creating job opportunities for domestic workers and affecting the
balance of payment, positively. However, some academics underline the destabilisation effect
of FDI on economic development of host markets and the environment.
2.2.1 Economic Growth
Although the majority of academics and policy makers have a consensus about the positive
effect of FDI on a host country's economic growth (Caves, 1996 and Lensink and Morrissey,
2001), the view that productivity and efficiency of local firms is positively related to the
rising FDI is not clear, especially in developing countries. It is well-known that, FDI is an
important source of foreign capital in both developed and developing country. Moreover,
such investment tends to facilitate technology and know-how transfers in host markets. Thus,
this situation accelerates the economic growth of host markets. Consistent with this view,
both developed and developing countries have improved their investment environment via
providing incentives to foreign investors in order to attract more foreign projects. Caves
(1996) has a supportive finding for this argument because he concludes that a host country
tries to attract FDI in order to gain from know-how, advanced technology, managerial skills
and production standards of MNCs. Similar to the finding of Caves (1996), De Gregorio
(2003) puts forward that FDI is much more effective than domestic investment in case of

26 | P a g e
accelerating economic growth in Latin American countries. This is because he finds that FDI
has three times more effect on GDP than domestic investment. Glass and Saggi (1998),
Lensink and Morrissey (2001) and Alfaro et al. (2003) also conclude that economic
development is accelerated as a result of rising foreign presence in a host country.
On the other hand, Haddad and Harrison (1993) fail to find positive spillovers from MNCs to
Morocco‟s economic growth using panel data. Aitken et al. (1997) put forward that foreign
company penetration does not always lead more productive sector due to rising competition.
Durham (2004) fails to accept the hypothesis that there is a positive linkage between foreign
presence and economic development. Smarzynska (2002) also supports the negative
spillovers on the host countries economy.
2.2.2 Employment
FDI inflows to a host market is seen a key element of an outward-oriented development
strategy and this kind of international investment involves significant factor that creates
additional job opportunities in the host markets, either directly or indirectly. Therefore, such
investment is likely to reduce unemployment in the host country. The reduction of the
unemployment rate in developing countries because of entries of MNCs - which are the main
sources of FDI - ranges between 1% and 6%. It is well-known that unemployment is one of
the problems of developed and especially developing countries (Fu and Balasubramanyam,
2005). While the number of workers in MNCs were almost US$ 45 million in 1970, the
number increased to US$ 70 million in 1990 (UNCTAD, 1994). One of the main differences

27 | P a g e
between developing and developed countries in terms of MNCs is investment decision. While
MNCs concentrated on technology intensive sectors in developed countries, they
concentrated on labour intensive sectors in developing countries. Therefore, the impact of
FDI inflows on employment is more effective in developing countries than in developed
countries. Although the contribution of MNCs to job creations in service and manufacturing
sectors are prominent, the effect of foreign entry on employment in mining and agriculture
sectors is very limited. The employment contribution of FDI in manufacturing in some Latin
American countries, Colombia, Argentina, Bolivia and Brazil, is between 10% and 25%. In
line with this perspective, Enderwick (1996) underlines the importance of MNCs on the
employment generation and the structure of Central European countries. In addition, Fu and
Balasubramanyam (2005) try to examine the relationship between FDI, export and
employment in China. The estimate of them indicates that employment in China has grown
by around 3% as a result of increasing FDI by 1%. Moreover, rising 1% of FDI is associated
with 9% rising employment. However, Ernst (2005) points out that MNCs penetration to the
markets of Argentina and Brazil does not affect the structure of employment because of the
entry mode of MNCs. Most of the direct investment was realised as a result of mergers and
acquisitions, privatisation, and deregulation. Therefore, new job opportunities for the citizens
in these countries could not be created as expected. However, in Mexico, rising MNCs is
associated with increasing employment. As a result, the majority of theoretical and empirical
papers underscore employment creation effect of MNCs in host countries, but changing the
entry mode of MNCs is likely to affect this situation. Therefore, the impact of MNCs on
employment generation is still a subject of debate.
28 | P a g e
2.2.3 Technology and Managerial Skills
The majority of technology and research and development (R&D) of MNCs are sourced by
some of the developed countries which are the US, the UK, Japan, Germany, Switzerland and
the Netherlands. “… MNCs produce and own the bulk of the world‟s modern technology; it
is not obvious exactly how MNC technology spreads across international borders and what
role MNCs play in the process” (Blomström and Kokko, 1996; page 3).
MNCs provide a chance to develop host countries production technology and management
skill, especially in developing countries where in general production technology and
managerial skills are low relative to the home countries of MNCs (UNCTAD, 1999). This is
because the main productions of developing countries concentrate on the agriculture and non-
technological industrial products. Therefore, most of the developing countries have gotten
into a position as the buyer of technology. Insufficient technology transfer is one of the
important factors that slows down the development of developing countries.
In an early paper - Caves (1974) - puts forward that domestic companies in the Australian
manufacturing sector benefit from a positive spillover generated by MNCs. In line with
Caves (1974), the finding of Rhee and Belot (1989) reveals that in Mauritius and Bangladesh,
the efficiency and development of local textile firms are positively affected by the foreign
presence. Borensztein et al. (1998) look at this situation from a different perspective and
they conclude that productivity can be affected if MNCs expand the variety of technological
equipment in a host country. Liu (2002) claims that there is a significant impact of foreign
29 | P a g e
presence on the productivity of domestic manufacture firms in China. Moreover, Kathuria
(2002) points out that foreign company entries and technology transfers have a positive effect
on the local firms' efficiency. Javorcik (2004) and Bhattacharya et al. (2008)9 also find that
MNCs have positive spillovers on the technology of the domestic companies in the same
industry.
On the other hand, the findings of Germidis (1977), Haddad and Harrison (1993) and Aitken
and Harrison (1999) indicate totally different results for the case of the effect of MNCs on the
productivity or technological development of local firms. While Haddad and Harrison (1993)
and Aitken and Harrison (1999) conclude that MNCs have negative spillovers on the
productivity of domestic firms, Germidis (1977) finds that FDI does not provide any
technology transfer to domestic firms.
As a result, the majority of empirical and theoretical findings support the perspective of
positive impact of MNCs on the productivity and technological development of local firms
rather than negative ones. Improving technological infrastructure is crucially important for
developing countries in order to approach the production standards of industrialised and
developed countries. That is why developing countries try to encourage advanced technology
possessive MNCs. They even offer some incentives to MNCs such as tariff reduction, high
profit transfer rates, subsidies for infrastructure and so on10
.
9 Moreover, Bhattacharya et al. (2008) also find that R&D activities of local firms in India could not been
affected by foreign company penetration. 10 Apart from the positive effect of FDI to the technological development of host country companies, in order to
increase the national technology sources, governments in developing countries need to provide enough budgets
to R&D and encourage domestic investors to invest in R&D.

30 | P a g e
2.2.4 Competition
In the world, foreign company entries to host markets increase the number of companies,
directly. Therefore, these entries increase the competition in the host market and break the
domestic monopoly - if it exists - . This situation is likely to increase the number of products,
the type of products and the quality of products. The levels of contribution of MNCs on the
competition and productivity in the host country depend on their attitudes and mode of entry.
Rising competition as a result of foreign entries forces domestic companies to improve their
production technology in order to be competitive in the host market. This technological
development of domestic companies can be achieved by either merging with foreign
companies or buying new technology abroad. Moreover, the host country saves its foreign
exchange reserves if the products of MNCs concentrate on a host market.
The study of Blomstrom and Wolff (1994) investigates the spillover from foreign company
entries on the competition and productivity of Mexican domestic manufacturing firms over
the period of 1965-1984. Their finding reveals that rising foreign entries is associated with
higher competition and productivity in the manufacturing sector as a result of the attempt of
local firms to improve their technology and managerial skills. Because, local firms without
investing their technological development and managerial skills, they cannot be competitive
against foreign ones. This competition in the host market is likely to force domestic firms to
use resources more productive and efficiently (Glass and Saggi, 2002). This situation is
clearly mentioned in the oligopolistic reaction theory (Caves, 1971). Nunnenkamp (2004)

31 | P a g e
puts forward that FDI does not only lead to capital flows to a host country but also brings
MNCs' existing technology and know-how. Therefore, productivity increase in the host
market and even other sectors might be affected positively. Wang and Blomström (1992),
Nickell (1996), Sjoholm (1999) also underscore the importance of foreign presence to
competition and firm performance in host countries.
2.2.5 Environment
Prior to WWII, a disproportionate amount of FDI was directed to agriculture and mining
sectors in order to reach the natural resources of developing countries. Although this pattern
changed in developed countries after WWII, some developing countries still attract a high
amount of FDI to their natural resource sectors. Therefore, FDI is likely to affect host
countries' environment, directly.
Since the beginning of the 1980s, environmental degradation in developed and developing
countries has accelerated (Xing and Kolstad, 2002). This pattern is mainly explained by two
factors: economic growth and population. Developing countries, especially where foreign
capital is necessary, make their environment regulation less strict in order to attract foreign
capital. This leads to some adverse environmental results such as environmental degradation
and high pollution levels. Therefore, attracting FDI to natural resource sectors in developing
countries needs a control on MNCs about their impacts on the environment as well as strong
regulation system in order to achieve sustainable growth in the economy and the natural
resource sector.

32 | P a g e
Xing and Kolstad (2002) aim to answer the question - “what impact has US FDI on the host
countries' environment quality?” – They clearly point out that developing countries are
willing to utilise their environmental regulations to gain the interest of MNCs. He (2006)
concludes that rising multinational company activities is associated with less environmental
quality in the host market.
2.2.6 Balance of Payment
The most important effect of capital inflows arises on the host market' balance of payment.
As well known, one of the most important problems in developing countries is the deficit in
the balance of payment (Head and Ries, 2001 and Fu and Balasubramanyam, 2005). The
effect of FDI on the host market' balance of payment can be investigated under two
categories; the financial effect and the trade effect. In case of the financial effect, FDI directly
increases the foreign reserves of the host country if there is a fixed exchange rate and
therefore has a positive impact on the balance of payment but profit transfers of foreign
companies in the host market lead to capital outflows and thus balance of payment is affected
negatively. However, most of the countries limit the profit transfers of foreign companies. In
cases of the trade effect, FDI initially may lead to a negative effect on the trade of the host
market because in some cases, foreign companies prefer to use their home country raw
material and intermediate goods to produce final products abroad. However, over time their
cumulative export excesses their cumulative imports and profit transfers. As well known,
export is widely accepted as an engine of growth. Thus, it is important to know whether FDI

33 | P a g e
leads to a significant change in the performance of host country's export level. Most of the
empirical studies in this field conclude that the impact of FDI in host country‟ export is
unquestionable but the degree of the impact depends on the tendency of export of foreign
investors (Head and Ries, 2001 and Zhang and Song, 2000). For example, FDI concentrates
on the export intensive Asian countries such as China, India, Indonesia and Malaysia.
Therefore, FDI contributes the competitiveness of host countries‟ export in the global market.
Markusen (1983) aims to investigate the effect of factor movements11
on trade and he
concludes that factor movements contribute positively to trade. Using 900 Japanese
companies as a data set, Head and Ries (2001) investigate how the firm exports is affected as
a result of increasing FDI and they conclude that there is positive linkage between outward
FDI and export. In line with this finding, Zhang and Song (2000) point out that in China one
of the main positive effects of FDI inflows is on the China's export performance.
11
The movements of capital, labour and other factors of production among economies are the factor
movements. Markusen (1983) purposes to investigate a number of conditions in which commodity trade and
factor movements are positively related in case of the volume of trade, while relaxing some assumptions; (1)
countries have identical technologies; (2) production is characterised by constant returns to scale; (3) production
is characterised by perfect competition and (4) there are no domestic distortions in either country” (Markusen,
1983, page. 343).

34 | P a g e
2.3 Historical Pattern of FDI in the World and in Turkey
2.3.1 Historical Pattern of FDI in the World
Foreign investment started with industries revolution in the second half of the 19th
century in
West European countries - especially in Great Britain (Yavan, 2006). The main reason behind
foreign investment was the necessity for industrial raw materials in the first half of the 1880s.
As explained by Moosa (2002) , foreign investment “… took the form of lending by Britain
to finance economic development in other countries as well as the ownership of financial
assets” (Moosa, 2002; page 16). At the same time period, the direct investments of industrial
countries were directing to the colonies of West European countries. Foreign investment of
British enterprises largely concentrated on the consumer goods sector (Moosa, 2002).
Although, the history of portfolio investment - bond and debt investments - is very old, FDI
had begun to become an important part of the international investment instrument in the
1920s. That is why initially direct investment is also explained by early portfolio theories.
2.3.1.1 Inter-war Period (1914-1948)
Throughout the interwar period, Great Britain was the dominant country in the world‟s FDI
stock, and mostly FDI inflows directed to developing countries - especially Great Britain‟s
colonies and Latin American countries. FDI inflows to these countries were realised by
British MNCs. The followers of Great Britain in terms of direct investment abroad were the

35 | P a g e
US, France, Germany, Belgium, Switzerland and the Netherlands prior to WWI. In 1914,
more than 45% of the world‟s total FDI stock was made by Great Britain (Feis, 1965).
The downward trend of foreign capital investments (FCI) throughout WWI reversed at the
beginning of the 1920s, but the global economic crisis in 1929, once again, led to a dramatic
reduction in FCI flows in the world. Even, the majority share of the home countries‟ FCI
drew back during this period (Bulutoglu, 1970 and Tuncer, 1968). Although the downward
trend of FCI flows had been continued during the interwar period in the world, FDI flows had
continued to increase (Hanink, 1997). In line with this process, the activities of MNCs had
also increased. For example, new MNCs arose during the inter war period in the oil sector
especially in Mexico.
The most distinct features of FDI prior to WW II are explained below;
The main source of FDI was companies of Great Britain and the US.
Secondly, FDI inflows in developing countries concentrated on the primary sector
such as agriculture and mining whilst manufacturing was the dominant sector in FDI
inflows in developed countries (Yavan, 2006).
Another important feature in this time period is that the volume of FDI stock directed
to developing countries was more than that to developed countries.

36 | P a g e
As shown in Table 1, while only one-third of the world‟s FDI stock (only US$ 5.2 million)
had been directed to developed countries12
, developing countries were attracting almost two-
thirds of the world‟s FDI stock, which was equivalent to nearly US$ 9 million. In 1938, 66%
and 34% of the world‟s FDI stock had been directed to developing and developed countries,
respectively but the ratios are totally different today.
Table 1. Estimated Stock of Accumulated FDI by Recipient Area (Million US $)
1914 % 1938 % 1960 % 1971 %
Developed
Countries 5.2 37% 8.3 34% 36.7 68% 108.4 68%
Developing
Countries 8.9 63% 16 66% 17.6 32% 51.4 32%
Total 14.1 24.3 54.3 159.8
Source: J. H. Dunning, J. H. “Changes in the Level and Structure of International
Production: The Last One Hundred Years” in International Investment, ed. Peter J.
Buckley, Aldershot, Hants, (England; Brookfield, Vt., USA: E. Elgar, 1990) p.7
(International and unallocated for the years 1971 and 1979 3.9 and 2.6). % indicates
the percentage of the accumulated FDI of developed or developed countries to the
accumulated FDI in the world.
2.3.1.2 World War II to 1979
The upward trend of FDI flows had continued in the post-WW II period because of the
technological improvement in transportation and communication and the necessity of US
capital in order to reconstruct the destroyed infrastructure of Europe due to the WW II
(Moosa, 2002). Foreign capital investment was mostly in the form of portfolio investment
before WW II, the share of FDI into foreign capital investment, however, has increased since
WW II. The changing sectoral distribution of FDI was another distinct change after WW II.
12
The amount of cumulative FDI stock in the developed country was nearly 5 million dollar in 1914.

37 | P a g e
While the share of primary sector FDI, especially infrastructure and natural resources, was
declining, the share of industry FDI was increasing (Dunning, 1988).
As explained in the previous section, developing countries attracted two-thirds of the world‟s
FDI stock but the situation changed after WW II. In other words, the direction of FDI inflows
changed from developing countries to developed countries. As shown in Table 1, the
developed countries attracted 68% of the world‟s FDI stock in 1960. Thus, developing
countries only attracted less than one-third of the world‟s FDI stock. Until the 1970s, the
volume of MNCs activities declined in developing countries at the same direction with the
volume of FDI inflows. Thirdly, the US became the dominant country in both inward and
outward FDI in the world. The ratio of the US‟s inward FDI stock to the ratio of world‟s
inward FDI stock reached to 48% in 1960. However, the share of both US and Great Britain‟s
FDI flows into the world‟s FDI stock has been reduced since the 1970s while the number and
volume of MNCs in the Netherlands, Japan, Germany and Switzerland has increased. Thus,
these countries had started to take an important role in the FDI flows (Dunning, 1988).
Finally, the activities of MNCs have expanded and the largest share of FDI has been realised
by these MNCs (Alpar, 1978; Uras, 1981). The number of MNCs had increased and
international production had increasingly grown throughout the 1960s.
By the 1970s, the three main developments in terms of FDI are the dominance of Great
Britain in FDI inflows, high growth rate achievement by developing countries in FDI inflows
and the Oil Crisis in 1973-74. The main reasons behind Great Britain taking first position in
terms of FDI flows are the removal of foreign exchange controls and the surpluses of
Northern Sea oil (Moosa, 2002). The erupting oil crisis in 1973-74 had led to increases in the

38 | P a g e
oil price in the world. Thus, oil spending of developed countries, which are mainly oil import
countries, increased. This led to a reduction in FDI outflow in developed markets. Table 2
shows this situation clearly. FDI outflow in developed countries dropped from nearly US$ 26
billion in 1973 to US$ 24 billion in 1974, as shown in Table 2. In other words, the growth of
FDI outflow in developed countries was – 6 % in 1974. This is because in a case of crisis,
MNCs generally are not willingly to invest abroad because an erupting crisis likely leads to
extra costs to the direct investments of MNCs and this will force them to delay or even cancel
their investment projects.
Table 2: FDI Inflow and Outflow in the World (Million US $) (1970 - 1979)
FDI Outflow FDI Inflow
Year World Δ DC Δ LDC Δ Year World Δ DC Δ LDC Δ
1970 14151 14100 51 1970 13345 9491 3854
1971 14440 2% 14395 2% 45 -12% 1971 14282 7% 10650 12% 3631 -6%
1972 15770 9% 15657 9% 113 152% 1972 14932 4% 11509 8% 3423 -6%
1973 25938 64% 25808 65% 130 14% 1973 20645 38% 15470 34% 5175 51%
1974 24474 -6% 24185 -6% 289 123% 1974 24126 17% 21661 40% 2465 -52%
1975 28594 17% 28057 16% 536 86% 1975 26567 10% 16857 -22% 9709 294%
1976 28414 -1% 27920 0% 494 -8% 1976 22002 -17% 15535 -8% 6467 -33%
1977 28741 1% 28124 1% 616 25% 1977 27139 23% 20147 30% 6991 8%
1978 39352 37% 38578 37% 774 26% 1978 34358 27% 25367 26% 8990 29%
1979 62884 60% 62454 62% 431 -44% 1979 42292 23% 33786 33% 8505 -5%
Source: UNCTAD (Columns in italic letters were calculated by the author). Δ indicates the growth of FDI
inflow and outflow in the world. DC and LDC denote developed and less developed countries, respectively.
Table 3: The Growth of FDI Inflow and Outflow in the World
FDI outflow (Δ) FDI outflow in the DC Δ FDI outflow in the LDC Δ
1970-1975 17% 17% 73%
1976-1980 16% 15% 126%
Year FDI inflow (Δ) FDI inflow in the DC Δ FDI inflow in LDC Δ
1970-1975 15% 15% 56%
1976-1980 17% 24% -3%
Source: UNCTAD (Columns in italic letters were calculated by the author). Δ indicates
the growth of FDI inflow and outflow in the world. DC and LDC denote developed and
less developed countries, respectively.

39 | P a g e
As shown in Table 2, FDI inflows to developing countries jumped from US$ 3854 million in
1970 to US$ 9709.45 million in 1975. In 1970, US$ 9491 million FDI inflows were directed
to developed countries. Although the volume of FDI inflows in developed countries was three
times greater than that in developing countries, developing countries were achieving
tremendous growth in terms of FDI inflow by 56% on average from 1970 to 1975. The
reasons behind the high growth rate in FDI inflows in developing countries despite the petrol
crisis are the reduction in profitability in developed countries as a result of rising raw material
prices and the declining of productivity of labours in developed countries. Another
interesting episode during the 1970s is the contribution of developing countries to the FDI
outflow. As seen in Table 3, even though, developing countries had achieved 73% annual
growth of FDI outflow on average from 1970 to 1975, the contribution of developing
countries to the world‟s FDI outflow (US$ 536 million) was less than 1%. Especially, at the
end of the 1970s, FDI inflows and FDI outflows in developed countries increased
substantially. FDI inflows to developed countries jumped from US$ 16857 million in 1975 to
US$ 33786 million in 1979. Thus, around 30% growth on average was achieved in FDI
inflows by developed countries during 1975-1979. This pattern clearly mirrored the
forthcoming strong integration process especially among developed countries. At the same
period, the average growth of FDI inflows, however, was -3% in the developing countries.
The average growth FDI outflow in developing countries, which is 126% annually, was much
more than that in the developed countries (73%). However, the contribution of developing
countries to the world‟s FDI outflows was less than 2% throughout the second half of the
1970s. In other words, 98% of the world‟s FDI outflow was realised by developed countries.

40 | P a g e
2.3.1.3 1980 to Present
The 1980s are called the “turning point” in terms of the FDI flows. An increase in the
implementation of liberal economic policies and positive improvement in communication and
transportation have contributed to achieve a tremendous growth in FDI flows in the world
since the 1980s (Moosa, 2002). Moreover, the integration of countries has been accelerated
by globalisation since the 1980s. The other important reasons behind the increase in FDI
flows in the world are as follows:
The opening markets of Central and Eastern Europe to foreign investors (UNCTAD,
1991).
The significant increase in the participation of Japanese MNCs to the world‟s FDI
flows as a result of declining labour cost (Dunning, 1993).
The rising FDI inflow in the US due to the depreciation of US $ (Dunning, 1993).
The ratio of the developing countries‟ FDI stock to the world‟s FDI stock has
increased since the 1980s (UNCTAD, 2003).
The raise in the share of FDI inflows in the service sector (especially in insurance,
financial intermediaries, tourism and advertisement sectors) (UNCTAD, 2003).
The increase in the bilateral and multilateral agreements between countries and the
mergers and acquisitions agreements among companies (UNCTAD, 2003).
The perception of the importance of FDI flows in the world. Thus, governments have
increased their number of incentives and promotion and have accelerated the sales of

41 | P a g e
public companies in order to attract more foreign investors (UNCTAD, 1991;
Dunning, 1993 and UNCTAD, 2003).
Average FDI inflows reached US$ 57 billion in the world during 1980-85. At the same time,
almost US$ 40 billion FDI inflows, which were more than two-thirds of the world‟s FDI
inflows, were directed to developed countries. Thus developing countries only attracted less
than one-third of the world‟s FDI inflow which was equivalent to nearly US$ 18 billion. In
the case of growth of FDI inflow, once again, the picture is completely different than the
volume of FDI inflows. Developing countries achieved tremendous growth in FDI inflows by
28% on average during 1980-85 whereas developed countries achieved only 5 % growth in
FDI inflows. Thus, developed countries had achieved 35% growth in the FDI inflow on
average from 1986 to 1990 but the growth dropped to 21% in developing countries.
In the second half of the 1980s, the growth of world-wide inflows of FDI was two times more
than that of total export. The unprecedented growth in FDI inflows in the world can be
described by three factors. These are positive expectations about economic growth rates for
most of the countries, strong recovery from the 1980s recession at the second stage of the
1980s and an acceleration of the implementation of liberal economic policies.

42 | P a g e
Table 4: FDI Outflow in the World (Million US $) ( 1980-2007)
Year World World Δ DC DC Δ LDC LDC Δ
1980 51550 - 48397 - 3153 -
1981 51503 0% 49932 3% 1572 -50%
1982 27310 -47% 24802 -50% 2508 60%
1983 37381 37% 35373 43% 2009 -20%
1984 50120 34% 47746 35% 2374 18%
1985 61975 24% 58063 22% 3912 65%
1986 96879 56% 91751 58% 5128 31%
1987 141413 46% 134712 47% 6701 31%
1988 180296 27% 168273 25% 12023 79%
1989 231755 29% 212011 26% 19743 64%
1990 239111 3% 227183 7% 11909 -40%
1991 200464 -16% 186964 -18% 13486 13%
1992 204054 2% 179250 -4% 23238 72%
1993 241964 19% 201578 12% 39342 69%
1994 287887 19% 240034 19% 47533 21%
1995 361562 26% 305930 27% 55007 16%
1996 398358 10% 333388 9% 64021 16%
1997 476146 20% 398999 20% 73724 15%
1998 688629 45% 636647 60% 50584 -31%
1999 1088065 58% 1017198 60% 68579 36%
2000 1231639 13% 1093665 8% 134784 97%
2001 751297 -39% 665694 -39% 82869 -39%
2002 537424 -28% 483157 -27% 49640 -40%
2003 562760 5% 507040 5% 45039 -9%
2004 920151 64% 786004 55% 120008 166%
2005 880808 -4% 748885 -5% 117579 -2%
2006 1323150 50% 1087186 45% 212258 81%
2007 1996514 51% 1692141 56% 253145 19%
Source: UNCTAD (Columns in italic letters were calculated by the
author). Δ indicates the growth of FDI inflow and outflow in the
world. DC and LDC denote developed and less developed
countries, respectively.
Apart from the FDI inflows, by the 1980s, the growth of FDI outflow and FDI outflow stock
was positive in the world. During 1980-1985, the average growth of outward FDI was around
5% annually in the world. The average growth of FDI inflow was higher than that of FDI
outflow in developing countries. Thus, the average growth of FDI outflow in developing
countries was 14.6%, annually. In the period of 1986-1990, the average growth of outward
FDI reached to a peak point by achieving 32%, annually. Therefore, by the 1980s, the

43 | P a g e
contribution of developing countries started to be clear relative to previous periods on a
global level. However, the share of FDI outward stock was still not sufficient and was less
than one-tenth of the world‟s FDI outward stock in 1990. Moreover, the increasing number of
developed and industrialised countries as source country, especially Japan, Hong Kong and
Singapore is another factor behind this growth. The reason behind the unparalleled growth of
FDI outflow from these countries was an appreciation of their domestic currencies against
foreign exchanges associated with the current account surpluses (UNCTAD, 1991). As a
result, the main source of the increasing FDI outflows in the world was still developed
countries13
.
Despite the distinct increases in the FDI inflows and outflows in the world in the 1980s, the
FDI inflows reduced and also the average growth rate of FDI outflow was around -4 % in the
world annually throughout the period of 1990-1992. A slowdown in the biggest economies
and falls in outflows from Western Europe and Japan explain the reduction of FDI flows in
this period (UNCTAD, 1993). Thus, the average growth of FDI inflows in the world was
annually 13 % during the period of 1991-1995 while the average growth was 32 % from 1986
13
Even, in 1990, 91% of the world‟s FDI outflow stock was realised by the developed countries.
Table 5: The Growth of FDI Inflow and Outflow in the World
FDI Outflow FDI Inflow
Year World Δ DC Δ LDC Δ World Δ DC Δ LDC Δ
1981-1985 0.10 0.10 0.14 0.02 -0.01 0.36
1986-1990 0.32 0.33 0.33 0.32 0.35 0.21
1991-1995 0.10 0.07 0.38 0.13 0.09 0.28
1996-2000 0.29 0.31 0.26 0.33 0.41 0.18
2001-2005 -0.01 -0.02 0.15 -0.03 -0.06 0.08
Source: UNCTAD (Columns in italic letters were calculated by the author). Δ
indicates the growth of FDI inflow and outflow in the world. DC and LDC
denote developed and less developed countries, respectively.

44 | P a g e
to 1990 as seen in Table 5. In the following years, from 1996 to 2000, the upward trend of the
FDI inflows in the world continued. Therefore, 33 % of the average growth of FDI inflows in
the world was achieved. 23% growth in FDI inflow and 20% growth in FDI outflow in the
world on average throughout the 1990s can be explained by following reasons: (1) a better
investment climate as a result of the investment promotion and protections for foreign
investors, (2) the acceleration of the implementation of privatisation and deregulation around
the world, (3), the increase in the number and volume of mergers and acquisitions in the
world and (4) the implementations of new policies such as promotion and protection of FDI,
especially at the end of 1990s (UNCTAD, 1993).
After the nine years upward trend, from 1993 to 2000, FDI flows in the world dramatically
reversed at the beginning of the 2000s (UNCTAD, 2004) Thus, the net growth rates of the
FDI flows dramatically decreased to -41 %, -24 % and -20 % in 2001, 2002, and 2003
respectively as shown in Table 4. Because of the negative growth in this period, the average
growth of FDI inflows in the world was -3 % annually throughout the period of 2001-05. The
situation was not different in terms of the world‟s FDI outflow. During 2001-03, the average
growth of world‟s FDI outflow was more than – 10 %. Slowing economic growth in most of
the countries and negative expectations about the recovery of economies are the reasons
behind the dramatic declining of FDI inflows and outflows in the world. Moreover, the
number and volume of mergers and acquisitions reduced dramatically between 2001 and
2003. As known, most of the FDI flows have been sourced by MNCs. Therefore, declining
the number of mergers and acquisitions among the MNCs directly affected FDI flows,
negatively. Finally, low profitability in most of the industries in the world also forced MNCs
to delay or cancel their direct investments abroad (UNCTAD, 2004). Between 2004 and
2007, higher economic growth in the home and host countries, high profitability sectors, high

45 | P a g e
stock valuations are the other reasons (UNCTAD, 2008 and UNCTAD, 2009). However, the
global crisis in 2008 and its negative impacts in 2009 led to a drastic fall in FDI inflows and
outflows world-wide. Interestingly, while FDI inflows to developed countries fell from US$
1358 billion in 2007 to US$ 962 billion in 2008, FDI inflows to developing countries reached
US$ 620 billion in 2009 from US$ 529 billion in 2008. Despite the sharp decline in both FDI
inflows to developing and developed countries in 2008, the ratio of FDI inflows to
developing countries to world-wide FDI inflow reached to highest point, almost 43 %, since
1982.
Figure 1: Foreign Direct Investment, Net Inflows (% of GDP) in the World
Source: World Bank Database
0
0.5
1
1.5
2
2.5
3
3.5
4
4.5
5
1980 1982 1984 1986 1988 1990 1992 1994 1996 1998 2000 2002 2004 2006 2008
Fore
ign
Dir
ect
Inve
stm
en
t,N
et
Infl
ow
s (%
of
GD
P)
World
Lower middle income
Low & middle income
High income

46 | P a g e
Figure 1 shows net FDI inflows as a percentage of GDP in the world for different income
groups from 1980 to 2009. From 1980 to 1985, in all income groups, the growth of the net
FDI inflows in the world was very small. However, at the second stage of the 1980s, the FDI
inflows were in upward trend because of the positive expectations about high economic
growth for most of the countries, even the net FDI inflow in the high income countries
increased over 1%. This upward trend continued until 2000, except in the period of 1990-
1991 and the net FDI inflows in the high income countries reached 4.4%. From 2000 to 2003,
there was dramatic reduction in the net FDI inflows as a percentage of GDP in all income
groups due to slowing economic growth in the world and negative expectations about the
recovery of economies. Until the current global crisis, the net FDI inflows in all income
groups continued to increase as seen in Figure 1.
2.3.3 The Pattern of FDI in Turkey
2.3.3.1 The Period of Ottoman Empire
FDI is of crucial importance for Turkey as a developing country (Yavan, 2006). The first
foreign capital entered the Ottoman Empire with a bilateral trade agreement - which is called
"Balta Limani Treat" - with Great Britain in 1838 (Kasaba, 1993). In the following years,
1840-1914, the Ottoman Empire signed similar trade agreements with other European
countries. Due to the trade agreements, the Ottoman Empire started to impose 5 % tax for
import products and 12 % tax for export products. The trade agreements also allowed foreign
capital entry to the Ottoman Empire freely. Generally, the realised FDI inflow in the Ottoman

47 | P a g e
Empire was concentrated in the transportation, electricity and gas sectors. However, the
volume of capital flows that the Ottoman Empire attracted was small. Foreign capital stock in
the Ottoman Empire is only £ 118 million at the beginning of 1888 (Pamuk, 1987).
2.3.2.2 1923 to 1950
The approach of the Grand Assembly of Turkey to foreign investors was positive. In Turkey,
the constituent assembly tried to encourage foreign investors by taking some liberal economic
decisions in the 1st Izmir Economy Congress in 1923. Although the leader of the Republic of
Turkey - Mustafa Kemal Ataturk - was very conservative about foreign capital, he said that
“Foreign investment would be a necessary instrument for reconstructing the infrastructure of
Turkey”. However, there were two limitations for foreign investors to deal with. According to
the decisions of the 1st Izmir Economy Congress, foreign investors should esteem Turkey‟s
law and should not build a self-monopolistic position in order to get investment permission.
Therefore, these limitations did not allow foreign investors to get permission to invest in
electricity, gas, transportation, communication sectors.
Throughout the period of 1923-29, 66 new foreign companies invested in Turkey. Thus, the
number of foreign companies jumped from 94 to 160 within 6 years (Yavan, 2006). Newly
opened foreign companies were mostly of French and English origin and the main activity of
such companies were to import raw materials to the domestic market. Therefore, foreign
companies invested in Turkey in order to avoid the cost of tariff over its export products.
Therefore, the most important determinant of FDI inflows in the 1920s was the

48 | P a g e
implementation of a tariff on import in Turkey. However, the liberal decisions did not satisfy
foreign investors to invest in Turkey throughout the 1920s. Thus, the volume of foreign
capital could not be attracted as expected (Turkyilmaz, 2009). Subsequent governments (from
1930 to 1950), however, were more conservative towards foreign investors because they did
not perceive the importance of foreign capital and even worried about foreign investors.
Moreover, they described the foreign investors as imperialist until the 1950s. The other
reasons behind the low FDI inflow attraction are the global economic crisis in 1929 and its
negative impact on the Turkish economy during the 1930s; the interruption of foreign capital
due to WW II; the nationalisation of some foreign companies during the period of 1929-45
due to the nationalist movement (Tezel, 1994)14
.
2.3.2.3 1950 to the Beginning of Globalisation
In the 1950 general election, the Democrat Party came to power in Turkey after taking more
than 53% of total votes. Thus, at the leadership of the Party, the perspective of the Turkish
government to foreign capital, once again, changed15
. According to the new government, the
foreign investment was the best option for Turkey to achieve sustainable economic growth.
Consistent with these expectations, the private sector was supported. Therefore, some
incentives were provided for the foreign investors by the Grand National Assembly of Turkey
in 1950. The most important incentive is that the law extended the right of transfer of the
profits of foreign investors. This law is called "Law No. 5583." Moreover, foreign companies
were guaranteed by the Turkish government in accordance with the law. However, the
14
From 1928 to 1945, 24 foreign companies were nationalised. 15
At that year, Turkey became the member of World Bank (WB) and International Monetary Fund (IMF).
Turkey tried to open up the economy in order to achieve sustainable economic growth with the Democrat Party
leadership and the encouragement of the IMF and the WB.

49 | P a g e
desired level of foreign capital could not be attracted, especially some specific sectors. Then,
the promotion of foreign capital act No. 5821 was enacted and the law allowed foreign capital
in energy, mining, transportation and tourism sectors, but because of the limitations on profit
transfer of foreign companies in other sectors of the Turkish economy, once again Turkey
could not attracted foreign capital as expected. In other words, the incentives did not
encourage foreign investors to invest in Turkey. As a result of these incentives, the law on the
encouragement of foreign capital (No.6224) was acknowledged by the Grand National
Assembly of Turkey on 18.01.1954. The law was one of the most liberal foreign investment
acts in the world until 1954. The main aims of the law were to encourage foreign investors to
invest in Turkey and to minimize the shortage of foreign exchange. Even if the 1980s and
1996 term governments made some changes to the law, the law remained in force in Turkey
until 200316
. The contribution of the law for attracting FDI inflows cannot be underestimated
because although the FDI stock was only US$ 2.8 million in 1953, permitted FDI inflows in
1954 was US$ 2.2 million. Thus, FDI stock reached up to US$ 5 million in 1954 as shown in
Table 6. Even though, the law repealed the limitations of profit and dividend transfers, the
law was used as an instrument to reject or delay the investment permissions of foreign
investors by the term governments because , according to the law, foreign investments could
get permission if such investments were conducive to Turkey‟s economic development.
Therefore, sustainable growth in FDI inflows could not be achieved. Even, the growth of
permitted FDI inflow in Turkey was negative in 1955, 1957, 1958, 1960 and 1961. The main
reasons behind the unsustainable growth in the FDI inflows were the lack of democratic
culture, ethnic problems, bureaucratic barriers, political instability (especially the second half
16
More details about the FDI laws in Turkey were taken to account in the section of Foreign Direct Investment
Law Framework.

50 | P a g e
of 1950s), economic instability, lack of skilled workers, lack of infrastructure and a coup
d‟état in 1960.
Table 6: Permitted FDI Inflow and FDI Stock in Turkey (1954-1969) (Million US $)
Year Permitted FDI Inflow Growth of Permitted FDI Inflow FDI Stock
Cumulative
until 1954 2.8 2.8
1954 2.2 5
1955 1.2 -45% 6.2
1956 3.4 183% 9.6
1957 1.3 -62% 10.9
1958 1.1 -15% 12
1959 3.4 209% 15.4
1960 1.9 -44% 17.3
1961 1.2 -37% 18.5
1962 4.2 250% 22.7
1963 4.5 7% 27.2
1964 11.9 164% 39.1
1965 11.6 -3% 50.7
1966 9.7 -16% 60.4
1967 9 -7% 69.4
1968 13.9 54% 83.3
1969 13.2 -5% 96.5
Source: The Central Bank of the Republic of Turkey
The situation got worse in terms of FDI attraction for Turkey in the 1970s. The ratio of FDI
inflows in Turkey to total FDI inflows in developing countries had dropped dramatically
throughout the 1970s. FDI inflows in Turkey accounted for only 1.5% of LDC‟s FDI inflows
in 1970 but, the ratio dropped to 1.2% in 1975 and 0.2% in 1980. A rapid increase in the
socialist movement in Turkey during the period of 1968-7117
, the general election in 1973,
the intervention of Cyprus in 1974 and bureaucratic barriers for foreign investors were the
factors that discouraged foreign investors to invest in Turkey. Thus, sustainable FDI inflows,
once again, could not be achieved by Turkey during the 1970s as shown the Figure 2.
17
Socialist movement in Turkey started at the same time with Europe in 1968. The movement had changed the
point of view of Turkish community to the foreign investors.

51 | P a g e
Besides, the growth of permitted FDI inflows was negative in 1974, 1975, 1976 and 1979 in
Turkey. Until the beginning of the 1990s, Turkish governments did not perceive that the
existence of regulation about the FDI flows alone is not enough to accelerate the growth of
FDI inflows in Turkey.
Figure 2: Growth of Permitted FDI Inflow in Turkey
Source: The Central Bank of the Republic of Turkey
2.3.2.4 The Beginning of Globalisation to Present
Turkey did not face any difficulty to adapt itself to the liberalisation process in the world
especially in the second half of the 1980s. The liberalisation process in Turkey started with
the implementation of the Economic Stabilisation program, which was supported by the IMF
Figure 1: Grow th of Permitted FDI Inflow in Turkey
-4.00
-3.00
-2.00
-1.00
0.00
1.00
2.00
3.00
4.00
5.00
1970 1971 1972 1973 1974 1975 1976 1977 1978 1979
Year
Gro
wth
Rate

52 | P a g e
and World Bank on 24 January 1980. According to the Economic Stabilisation program, the
intervention of Turkish governments in monetary policy and the finance system would be
minimised. Foreign investors are willingly to invest where government intervention is
minimal compared to a country where the government regularly intervenes to finance system
and economy. Therefore, such an attempt in Turkey also aimed to encourage foreign
investors to invest in Turkey.
Moreover, Turkey also aimed to restructure its economy by using two basic instruments
based on the Economic Stabilisation program. The first one was the removal of limitations
over trade and foreign exchange while the other one was the preparation of a new law to
facilitate the entry of foreign capital and technology to Turkey. Furthermore, as a part of
liberalisation process during the 1980s, (1) capital account was liberalised; (2) lending and
borrowing among Turkish banks were permitted when an interbank market was established;
(3) the Istanbul Stock Exchange was reopened; (4) the sales of government securities began
(Denizer, 1997 and Erdilek, 2003). In addition, another improvement during the 1980s was
the acknowledgment of the foreign capital decree by the parliament. The decree came into
force on 25.10.198018
. At the same day, the Foreign Capital Office came under the
supervision of prime minister. The main aim of the office was to accelerate the process of
foreign investments in Turkey19
.
18
More information about the Foreign Capital Decree was explained in the next section. 19
However, the name of the office has changed to the General Directorship of Foreign Capital and has come
under the supervision of the Treasury Undersecretary since 1994.
53 | P a g e
In the 1980s, as a part of liberalisation process, the existing FDI law (No. 6224)20
was revised
to facilitate foreign investments in Turkey. The act mainly consisted of the restructuring of
foreign capital policies, the reduction of bureaucracy barriers, tariff and quotas, the
acceleration of privatisation, international agreements which related to the incentives and
security of investment (Karluk, 2000). Despite some positive changes in the FDI law (No.
6224) for foreign investors, Turkey failed to attract FDI inflow as expected21
. Therefore, the
volume of FDI inflows that Turkey attracted remained very small compared to similar size
developing countries. Although the liberalisation of the finance sector at the end of the 1980s
contributed to net FDI inflows, the growth of FDI inflows had been flexible at the following
years until 2004 (Erdilek,1988).
Moreover, the enactment of the Build-Operate-Transfer law in 1984 allowed both domestic
and foreign capital to enter the infrastructure and energy sectors in Turkey (Ongun, 2001).
The Turkish government in 1989 approved a new foreign investment act related to the
stabilisation of Turkish Lira which led to an increase in international investment but
especially in portfolio investment.
20 More information about the revised FDI law was provided in the Foreign Direct Investment Legal Framework
section. 21
However, acknowledging the liberal laws and attempting to accelerate privatisation do not make sense if there
is difficulty in the implementation of these. This accomplished with macroeconomic instability, unwillingness of
the term government about the participation of foreign investors to the domestic market, inadequate
infrastructure; the gradually increase in uncertainty; the lack of accounting standards, lack of property rights,
especially in copyright, trademark and patents, undesirable privatisation implementation and lack of legal
standards (Karluk, 2000 and Erdilek, 2003).

54 | P a g e
Table 7: FDI Inflow in Turkey (Million US $) (1980-1990)
Permitted
FDI Actual FDI
Actual FDI /
Permitted FDI
1980 97 35 36%
1981 337 141 42%
1982 167 103 62%
1983 102 87 85%
1984 271 113 42%
1985 234 99 42%
1986 364 125 34%
1987 655 115 18%
1988 820 354 43%
1989 1511 663 44%
1990 1861 684 37%
Source: The Undersecretariat of Treasury (Columns in italic
letters were calculated by the author)
Apart from FDI inflows in Turkey, throughout the 1980s and 1990s, there was huge gap
between the actual FDI inflows and permitted FDI inflows in Turkey. During 1980-84, only
an average 53% of permitted FDI inflows were realised. While the total permitted FDI
inflows was nearly US$ 1 billion during the 1980-85, the total FDI inflows that Turkey
attracted was almost half of the permitted one. As seen in Table 7, the ratio got worse during
the 1985-90 and the ratio, thus, dropped to 36%. Even if the permitted FDI inflows in Turkey
jumped from US$ 364 million in 1986 to US$ 655 million in 1987, the realised FDI inflows
were only 18% of the permitted FDI inflows. The gap in 1987 was the biggest in Turkey‟s
FDI history.
In general, there are mainly two reasons behind the arising gap between the actual and
permitted FDI inflows in the literature. Firstly, the situation arises when a foreign investor
takes permission to make an investment and the investor could not complete his investment
within a year. Secondly, the situation arises if the permission is taken by the investor and the

55 | P a g e
investor backs down from making investment due to any reason (HMYSGM, 2002). During
the 1990s, the gap between permitted and actual FDI inflows was wider than that in the 1980s
on average. As shown in Table 8, the ratio of the realised FDI inflows to permitted FDI
inflows dropped to 32% in 1995 and 24% in 1996 due to the negative impact of 1994 banking
crisis and macroeconomic and political instability in Turkey. On the other hand, the permitted
FDI inflows jumped from US$ 1.47 billion in 1994 to US$ 2.93 billion in 1995 because the
term government was struggling to attract foreign capital such as FDI and foreign portfolio
investment. Hence this forced the government to accelerate the permission of foreign projects
in Turkey.
As a result, dramatic external Gulf Crisis in 1991, East Asian Crisis in 1997, Latin America
in 1998, and Russian Crisis in 1999) and internal crisis (banking crisis in Turkey in 1994),
ethnic problems, political and macroeconomic instability, the lack of provision of motivation
and guarantees during the 1990s were the main reasons behind the delaying or cancelling of
investments by foreign investors in Turkey22
.
22
The main reason of the lack of provision of motivation and guarantees was the unwillingness of Turkish
governments.

56 | P a g e
Table 8: FDI Inflow in Turkey ( Million US $) (1990-1999)
Years
Permitted
FDI
inflow
Actual
FDI
inflow
Actual FDI /
Permitted FDI
FDI inflow in
Developing
country
The ratio of Turkey's
actual FDI to LDC
FDI Inflow
1990 1861 684 37% 35087 1.95%
1991 1967 907 46% 39778 2.28%
1992 1819 911 50% 53128 1.71%
1993 2063 746 36% 76883 0.97%
1994 1477 636 43% 103687 0.61%
1995 2938 934 32% 115973 0.81%
1996 3836 914 24% 147077 0.62%
1997 1678 852 51% 190723 0.45%
1998 1646 953 58% 190751 0.50%
1999 1699 813 48% 228180 0.36%
Source: The Treasury Undersecretary (Columns in italic letters were calculated by
the author)
The inward FDI potential index and inward FDI performance index in Table 9 show clearly
the position of Turkey in the world in case of the foreign capital attractions throughout the
1990s. Throughout the period of 1988-1999, Turkey was ranked between 58th
and 89th
according to the Inward FDI Potential Index of UNCDAT as shown in Table 9. At the same
period, Turkey found a position between 70th
and 126th
in the inward FDI performance index.
These rankings clearly demonstrate that Turkey could not use its potential to attract an
adequate amount of MNCs to invest in Turkey. Another interesting episode is the position of
Turkey in the outward performance index. After the allowance of FDI outflows from Turkey,
in other words since 1987, Turkey was ranked between 87th
and 76th
during the 1988-1994.
Total net FDI outflow was around US$ 9 million which equal to 0.4% of the total net FDI
inflows. Especially the 1994 banking crisis in Turkey triggered Turkish investors to invest
abroad. While the net FDI outflows as a percentage of the net FDI inflow was 8% in 1994,
the ratio reached to 90% in 2000. This became one of the reasons of the 2000 banking and
2001 economic crises in Turkey.

57 | P a g e
Table 9: Turkey’s Inward FDI Potential and Performance FDI Scores and Ranking
Inward FDI Potential
Index Ranking
Inward Performance
Index Ranking
Outward Performance
Index Ranking
1988-1990 62 70 87
1989-1991 59 71 81
1990-1992 65 79 76
1991-1993 58 89 80
1992-1994 68 101 81
1993-1995 75 104 79
1994-1996 74 109 83
1995-1997 80 115 70
1996-1998 82 126 72
1997-1999 81 122 68
1998-2000 78 123 56
1999-2001 89 112 57
Source: UNCTAD
Apart from the gap between the actual and permitted FDI inflow in Turkey, the ratio of FDI
inflows in Turkey to FDI inflows in developing countries was also on the downward trend
during 1990s as seen in Table 6. While the developing countries were achieving high growth
rates in FDI inflows in the 1990s, very limited FDI inflows had been directed to Turkey. In
1991, FDI inflows in Turkey accounted for 2% of total FDI inflows in developing countries.
The ratio dropped to 0.97% in 1993, 0.81% in 1995, 0.45% in 1997 and 0.36 % in 1999. The
main reasons behind the continuous downward trend in the ratio were both external and
internal crises during the 1990s as explained before. Until the beginning of the 2000s, Turkey
was not a member of the World Association of Investment Promotion Agencies (WAIPA)
(Erdilek, 2003) so no official promotion has been available for foreign investors even though
there was plenty empirical works which proved the importance of FDI inflows in developing
countries. It is not astonishing that the Investment Support and Promotion Agency of Turkey
was found only few years ago in 2007 (Erdilek, 2003).

58 | P a g e
The same situation had seen in the ratio of FDI inflow to GDP (current US$). Not
surprisingly, the ratio had never been more than 1% from 1970 to 2000. However, there has
been impressive growth in FDI inflows since 2001 despite the 2001 financial crisis. The ratio
jumped to 2% in 2001 and then 4% in 2006 due to the sustainable growth in macroeconomic
indicators, increases in the investment incentives and promotions, new FDI law and
efficiently implemented privatisation policies. The ratio of Turkey‟s average FDI inflows to
GDP was only 0.1%, 0.2% and 0.3% in the 1970s, in the 1980s and in the 1990s on average,
respectively. However, the ratio increased 1.4 % during a 6 years period (from 2000 to 2006).
Table 10 : Top Ten FDI Recipient Country and Turkey ( 2003-2006) (Billion US $)
2003 2004
Rank Country FDI Rank Country FDI
1 China 53.5 1 USA 135.8
2 USA 53.1 2 China 60.6
3 France 42.5 3 UK 56
4 Belgium 33.5 4 Belgium 43.6
5 Germany 32.4 5 Australia 36
6 Spain 25.8 6 Hong Kong 34
7 Ireland 22.8 7 France 32.6
8 Netherlands 21 8 Bermuda 25.5
9 UK 16.8 9 Spain 24.8
10 Switzerland 16.5 10 Mexico 22.4
53 Turkey 1.8 38 Turkey 2.9
2005 2006
Rank Country FDI Rank Country FDI
1 UK 193.7 1 USA 175.4
2 USA 101 2 UK 139.5
3 France 81.1 3 France 81.1
4 China 72.4 4 Belgium 72
5 Netherlands 41.6 5 China 69.5
6 Germany 35.9 6 Canada 69
7 Belgium 33.9 7 Hong Kong 42.9
8 Hong Kong 33.6 8 Germany 42.9
9 Canada 28.9 9 Italy 39.2
10 Spain 25 10 Luxembourg 29.3
23 Turkey 9.8 18 Turkey 20.1
Source: Foreign Direct Investment in Turkey (2007) and The Undersecretariat of Treasury

59 | P a g e
The main difference between the AKP government and old ones is the perception of the
importance of FDI and positive impacts of FDI to a host country. One of the most important
regulations that the AKP government prepared is the preparation of a new and comprehensive
FDI law because the FDI law (No.6224) did not satisfy the expectation of neither Turkey nor
foreign investors. Therefore, a comprehensive and internationally acceptable FDI law was
prepared and then came into force in June 200323
. Especially after 2002, the acceptance of
new policies, related with structural reform in the finance sector, was accelerated by the AKP
government (such as the No. 4875 FDI law in 2003, restructuring the banking system, the
acceleration of privatisation and so on) with the leadership of Kemal Dervis. Furthermore, the
government has regularly organised meetings with big company managers to get a better
business environment in Turkey. These led to an increase in the ratio of Turkey's FDI inflows
as a percentage of LDC's FDI inflows up to 4.5 % in 2007. Therefore, Turkey has started to
be competitive for attracting FDI inflows in the global arena. The improvement of Turkey in
terms of FDI inflow attraction is seen well in Table 10. Moreover, while Turkey was in 53rd
position in the ranking in 2003, the volume of FDI inflows was only US$ 1.8 billion. In the
following years, the position of Turkey in top FDI recipient countries reached 38th
in 2004
(with attracting US$ 2.9 billion), 23rd
in 2005 (with attracting US$ 9.8 billion) and 18th
in
2006 (with attracting US$ 20.1 billion). In addition, according to the records of the World
Investment Report 2008, four of the largest six mergers and acquisitions agreements in the
finance sector in Balkans were appeared by the merger or acquisition of the banks in Turkey
during 2006-2007. On the other hand, while Turkey was breaking its historical record level of
FDI inflows by attracting US$ 22 billion in 2007, the position of Turkey in the global arena
dropped to 25th
. The FDI inflows to Turkey dropped from the historic record level in 2007 to
US$ 18 billion in 2008 (the ranking of Turkey in the global arena was 20th
in terms of FDI
23
The more details of the new FDI law (No. 4875) were taken into account in the next section.

60 | P a g e
inflow, surprisingly), representing a 20 % decline. The growth of FDI inflow got worse in
2009 with attracting only US$ 7.6 billion in Turkey. Global economic crisis and external and
internal tensions in Turkey are the reasons behind the dramatic fall in FDI inflows to Turkey.
2.3.3 FDI Legal Framework
Although the history of regulations about FDI goes back to the Ottoman Empire, a
comprehensive FDI law firstly came into force in 1951. As explained in the previous section,
first foreign capital entered to the Ottoman Empire with the bilateral trade agreement with
Great Britain in 1838. After the establishment of the Republic of Turkey, the protection of
value of Turkish currency law (No. 1667) in 1930 and the No.14 decree in 1947 came into
force in Turkey. Some substance of the law and decree were related to FDI. According to the
No.14 decree, foreign capital could enter the industry, agriculture and transportation sectors if
a foreign investor gets permission from the Ministry of Finance in Turkey. The permission
would be provided if the investor contributed to the economic development of Turkey. When
democrat party came to power in 1950, the perspective of government totally changed,
especially for foreign investors. This political change - from a nationalist perspective to a
liberal one - led to significant changes in the investment environment in Turkey. As
explained in the previous section, during the 1930s and the 1940s, the governments
nationalised plenty foreign companies, instead of trying to attract foreign investors to invest
in Turkey. The first law about the FDI was acknowledged on 08.09.1951 by the parliament
and the law was called “foreign capital investment incentive law (No. 5821)”. The law (No.
5821) allowed foreign investors to invest in industry, energy, mining, transportation and

61 | P a g e
tourism sectors in Turkey (Tuncer, 1986). In addition, the law allowed foreign companies or
investors to transfer their 10% profit (Alpar, 1977).
On 18.01.1954, the foreign investment incentive law (No. 6224) came into force because
pervious law - the foreign investment incentive law (No. 5821) - did not attract foreign
investors to Turkey as expected. The improvements in the investment environment with the
foreign investment incentive law (No. 6224) are as follows:
Foreign investors would get same rights as domestic investors.
There would be no limitation to transferring the profits of foreign investors.
The permissions and controls would be provided by the committee of Foreign
Investment Incentive.
Foreign Investment must contribute the development of Turkey and must be
made where the activity is possible because some sectors were not possible to
make foreign investment. Industry, mining, energy, transportation and tourism
were the sectors that foreign investors could make an investment
The FDI law (No. 6224) was more liberal relative to other developed and developing
countries in 1954. However, there was still a long procedures list to complete in order to get
permission to invest in Turkey. A foreign investor firstly had to apply to the Ministry of
Trade (Tuncer, 1986). The decision would not take more than 15 days. If it was positive, the
Execution Deputy Commission had the authority to cancel the decision within 30 days.
Therefore, the permission of the Execution Deputy Commission was another difficulty for

62 | P a g e
making an investment by foreign investors to Turkey (Tuncer, 1986). Another limitation is a
sectoral restriction for foreign investors. If the public or private company had a monopolistic
position in its sector (such as telecommunication, water supply, electricity and gas supply
sectors), the foreign investors cannot own more than 50% share of Turkish companies.
Therefore, to get permission in these areas as a foreign investor was very difficult24
. Apart
from this limitation, the FDI law (No. 6224) did not allow the foreign investors to enter an
existing partnership, to establish a company and to open a branch without getting the
permission of the Undersecretariat of the Treasury. In other words, a getting permission and
visa from the Undersecretariat of the Treasury would be compulsory to make an investment if
an investor was foreign. Even, the existing foreign company had to apply for the permission
of the Undersecretariat of the Treasury in the case of an increase in the capacity or share of a
company, making a new investment, or buying new machines and acquisitions25
.
The decisions of 24.01.1980 demonstrated that foreign capital is vitally important for the
development of Turkey. At the same direction of the decision, the provision of incentives for
foreign investors increased and also the foreign capital decree was acknowledged on
25.01.1980. Moreover, the office of foreign capital was found at the same time. During 1980-
85, there were distinctive increases in the permission of FDI inflows, especially in the service
sector. For instance, while there were 4 foreign banks in Turkey in 1980, the number of the
foreign banks in Turkey reached to 23 at the end of 1980s (Denizer, 1997). Some changes
were done in the Foreign Capital Decree (No.8/168) in 1986 and 1992. Finally, the Foreign
Capital Decree (No.95/6990) came into force on 07.06.1995.
24
This limitation does not include in the new of FDI law (No. 4785). 25
However, the new law (No. 4785) has abolished all the complicated bureaucracy barriers.

63 | P a g e
At the end of 2000 and the beginning of 2001, the erupting banking and economic crises
forced the AKP government to make reforms in the economy. Thus, the Economic Policies
report was issued by the government in 2001. According to the report, private sector and
foreign investors would be encouraged. Moreover, the necessity of the stability of
macroeconomic indicators, implementation of privatisation, FDI law and transparency in
order to attraction foreign investment was underscored in this report. Thus, the new FDI law
(No. 4785) came into force in 2003. The aims of the FDI law (No. 4785) are to encourage
FDI investors and to achieve international standards in term of the legal structure of FDI.
The other improvements with implementation of the new FDI law (No. 4785) are as follows:
The definition of FDI was changed. The new FDI definition refers to
“establishing a new company or branch of a foreign company by foreign
investor” (The Undersecretariat of Treasury, 2003, page 1) and “share
acquisitions of a company established in Turkey (any percentage of shares
acquired outside the stock exchange or 10% or more of the shares or voting
power of a company acquired through the stock exchange)”
The
Undersecretariat of Treasury, 2003, page 1). Therefore Turkey had an
internationally acceptable FDI definition.
The achievement of equality between domestic and foreign investors.
The minimization of nationalisation of foreign investor‟s investment.
The allowance of the foreign investors to have their own property without any
restriction like Turkish citizens.

64 | P a g e
The abolishment of the limitation of importable products - which exists in
Turkey - .
The permission to foreign investors to employ foreign workers with a
requirement of a work permit.
The elimination of the minimum capital limit.
The removal of the limitation of transferring foreign investors' profits,
The removal of the sectoral restriction to make an investment by the foreign
investors (IGEME, 2005).
2.3.4 Foreign-owned Companies and its Sectoral and Regional
Distribution
The scope of the cumulative number of foreign owned companies in Turkey was upward
during the 1980s. By 1980, as seen in Table 7, the cumulative number of foreign owned
companies was only 78. Between 1980 and 1984, the number of new foreign-owned
companies did not excess 70, annually. However, tremendous growth in the cumulative
foreign owned companies, which was 42 % annually, was achieved from 1985 to 1990. The
number of new foreign-owned companies was between 173 and 336 during the period. The
trend of the cumulative number of foreign owned companies was upward from 1990 to 2003
even though the growth of number of foreign companies had reduced. From 1980 to 2003,
the upward trend in the cumulative number of foreign owned company could be misleading
because the number and growth of foreign affiliate companies in the Centre and East
European countries had been more than that in Turkey. In 2009, the number of foreign owned
companies reached to 23,620.
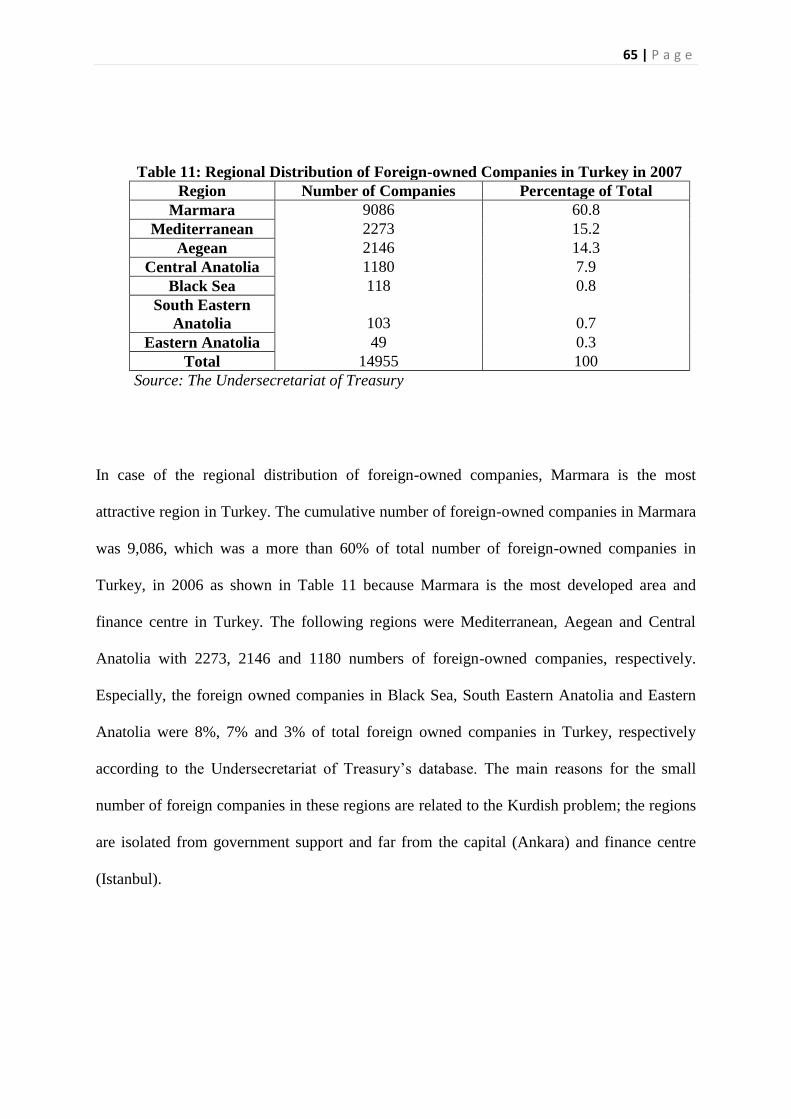
65 | P a g e
Table 11: Regional Distribution of Foreign-owned Companies in Turkey in 2007
Region Number of Companies Percentage of Total
Marmara 9086 60.8
Mediterranean 2273 15.2
Aegean 2146 14.3
Central Anatolia 1180 7.9
Black Sea 118 0.8
South Eastern
Anatolia 103 0.7
Eastern Anatolia 49 0.3
Total 14955 100
Source: The Undersecretariat of Treasury
In case of the regional distribution of foreign-owned companies, Marmara is the most
attractive region in Turkey. The cumulative number of foreign-owned companies in Marmara
was 9,086, which was a more than 60% of total number of foreign-owned companies in
Turkey, in 2006 as shown in Table 11 because Marmara is the most developed area and
finance centre in Turkey. The following regions were Mediterranean, Aegean and Central
Anatolia with 2273, 2146 and 1180 numbers of foreign-owned companies, respectively.
Especially, the foreign owned companies in Black Sea, South Eastern Anatolia and Eastern
Anatolia were 8%, 7% and 3% of total foreign owned companies in Turkey, respectively
according to the Undersecretariat of Treasury‟s database. The main reasons for the small
number of foreign companies in these regions are related to the Kurdish problem; the regions
are isolated from government support and far from the capital (Ankara) and finance centre
(Istanbul).

66 | P a g e
Table 12: Sectoral Distribution of the Foreign-owned Companies by Province in Turkey
(1954-2007)
Sectors Istanbul Antalya Ankara Mugla Izmir
Agriculture, hunting, fishing and forestry 69 58 17 13 33
Mining and quarrying 116 14 61 3 37
Manufacturing 2026 131 185 26 288
Electricity, gas and water supply 105 12 57 1 22
Construction 506 481 137 186 80
Wholesale and retail trade 3698 317 357 87 368
Hotels and restaurants 421 413 64 241 65
Transportation, storage and communications 959 225 61 124 68
Real estate, renting and business activities 1401 526 181 398 102
Other community, social and personal service
activities 752 105 104 44 57
Total 10053 2283 1224 1123 1120
Service sector as a percentage of total 78% 91% 79% 96% 68%
Manufacturing as a percentage of total 20% 6% 15% 2% 26%
Agriculture, hunting, fishing and forestry as
a percentage of total 1% 3% 1% 1% 3%
Mining and quarrying as a percentage of
total 1% 1% 5% 0% 3%
Source: The Undersecretariat of Treasury
According to the Undersecretariat of Treasury database, Istanbul has been the most attractive
province in case of FDI inflows. In 2007, the cumulative number of foreign affiliate
companies was more than 10000. The following provinces were Antalya, Ankara, Mugla and
Izmir with attracting 2283, 1224, 1123 and 1120 numbers of foreign companies, respectively.
In Istanbul, there are more than 7842 foreign companies in the service sector. The followers,
Antalya, Ankara, Mugla and Izmir, were far from Istanbul‟s performance with attracting
2079, 961, 1081, 762 numbers of foreign companies to its service sector respectively as
shown in Table 12. The situation is not different in other sectors such as manufacturing,
agriculture and mining. The foreign companies in the service sector were more than 90% of
the total number of foreign companies in Antalya and Mugla in 2007. This means that almost
all foreign companies are found in the service sector in these provinces. The ratio was 78% in

67 | P a g e
Istanbul. Surprisingly, the ratio of number of foreign companies in service sector in Mugla to
the total is, is 96% much more than that in Istanbul, which is 78%. In all 5 provinces, less
than 5% of the total number of foreign owned companies is directed to the agriculture and
mining sectors in Turkey.
The large share of the FDI inflows to the Eastern and Central European countries have been
realised by the European Union countries. This situation is not different in Turkey either. The
majority of FDI inflows in Turkey have been directed from the European Union countries
since the 1980s. The main reasons behind this are: (1) politic and economic integration, (2)
distance between the EU and Turkey is not far to EU and (3) also information advantages of
EU' MNCs about the sectors of Turkey. Hence, more than 75% of the Turkey‟s authorised
FDI has been made by the European countries since the 1980s. The Netherlands, France,
Germany, Belgium, the United Kingdom and Greece were conspicuous among the European
countries. However, the contribution of the European Union countries in the total FDI inflow
dropped to 68% while the share of FDI inflow, which was invested by American MNCs,
increased up to 25% of the total FDI inflow in 2007 in Turkey. The FDI inflow to Turkey,
which was realised by American and Asian countries, has not exceeded 30% since the 1980s
because of the distance, the lack of relation and so on.

68 | P a g e
2.3.5 Sectoral and Regional Composition of FDI
2.3.5.1 Sectoral Composition of FDI in the World
Sectoral distribution of the world‟s FDI has evolved since WWII. The primary sector,
traditionally including agricultural products, energy and mining, was a dominant sector in
the FDI flows until end of WWII, especially in the developing countries. After WWII, the
direction of the FDI flows shifted from the primary sector to the manufacturing sector in the
world, especially developed countries. Even if the ratio of primary sector FDI to total FDI has
reduced in the world, the amount of primary FDI (especially, petroleum, mining and
quarrying sectors) has increased since the 1950s. The manufacturing sector had taken the
biggest share of the world‟s FDI stock up to the middle of the 1980s. As shown in Table 13,
while the share of the manufacturing sector in the world‟s FDI stock was almost 60% in 1970
in the developed countries, the share in the primary and the service sectors were around 16%
and 24%, respectively. However, at the end of the 1980s, there was a tremendous alteration in
the sectoral composition of the world‟s FDI stock as explained above. The structure of FDI
flows, once again, started to change at the beginning of the 1980s in the world. The share of
the service sector in the total FDI stock in the developed countries jumped from 23% in 1970
to 38% in 1980 and 48% in 1990. In developing countries, this situation is little different. The
ratio of service FDI stock to total FDI stock increased from 23% in 1975 to 29% in 1990 in
the developing countries (UNCTAD, 1993; UNCTAD, 2004).

69 | P a g e
Table 13: Sectoral Distribution of FDI Inflow Stock in the World (Billion US $)
% % % % %
Developed
countries 1970 1975 1980 1985 1990 1970 1975 1980 1985 1990
Primary 12 17 18 39 94 16.44% 12.14% 6.72% 9.24% 9.11%
Secondary 44 79 148 195 439 60.27% 56.43% 55.22% 46.21% 42.54%
Tertiary 17 44 102 188 499 23.29% 31.43% 38.06% 44.55% 48.35%
Total 73 140 268 422 1032
Developing
countries 1970 1975 1980 1985 1990 1975 1980 1985 1990
Primary 7 17 31 46 20.59% 22.67% 24.03% 21.90%
Secondary 19 41 64 102 55.88% 54.67% 49.61% 48.57%
Tertiary 8 17 34 62 23.53% 22.67% 26.36% 29.52%
Total 34 75 129 210
Source: UNCTAD
What is interesting in developing countries in term of the sectoral distribution of FDI is the
share of the primary sector. While the share of the primary sector in the FDI stock was less
than 10% in the developed countries, the share of primary sector in developing countries was
more than 20%. Therefore, the structural change in the sectoral distribution of FDI flows in
the developed countries was more distinctive than that in the developing countries during the
1980s. The reason behind the lately changing sectoral distribution of FDI flows in the
developing countries were the late implementation of liberal policies, the lack of legal
structure, the lack of infrastructure and so on.
The share of the service FDI in the world‟s inward FDI, which was around 65%, reached to a
peak point, at the beginning of 2000 while the shares of primary and manufacturing sectors
reduced to 5% and 30% respectively. Although there was a reduction in the share of the
primary and the manufacturing sectors in the worlds FDI flows since the end of 1970s, the
volume of the FDI flows in these sectors has increased in most of the countries (Dunning,
1993; UNCTAD, 1993 and 2004; Dicken, 1998).

70 | P a g e
The main reason behind the increase in the service FDI is the abolishment of restriction and
bureaucratic barriers for foreign investors in the service sector because cultural, political or
strategic reasons until the 1980s minimised the share of service sector in the world‟s FDI
stock in both the developing and developed countries. The other reasons are: (1) the increases
in demand in the sector; (2) the increase in the global privatisation process in the sector such
as financial intermediaries, wholesale and retail trade, communication, telecommunication,
electricity, water supply and construction (Daniels, 1993; UNCTAD, 2004) and (3) the
increase in the number of multinational, relational and bilateral agreements covering FDI in
the service sector (UNCTAD, 2004). Moreover, the increase in the number of outsourcing,
franchising, licence agreement among firms and turnkey arrangement has led to an increase
in the share of service FDI in the world‟s FDI stock (UNCTAD, 2004).
In the middle of the 1980s, especially the financial intermediaries (insurance and banking)
and wholesale and retail trade were the dominant areas of service FDI taking 40% and 25%
of the share, respectively. However, particularly construction, telecommunication,
communication and transportation, electricity, water supply and business services sectors
have increased their shares of service FDI since 1990s. Financial intermediaries and
wholesale and the retail trade sectors FDI accounted for 29% and 18% of total service FDI in
2002, respectively (Daniels, 1993; Dunning, 1993; UNCTAD, 2004).

71 | P a g e
2.3.5.2 Sectoral Composition of FDI in Turkey
During the last 3 decades, more than 95% of the authorised FDI inflows in Turkey have been
distributed into two sectors which are manufacturing and service. Thus, the authorised FDI
inflows in the agriculture and the mining sectors had not exceeded 5% of the authorised FDI
from 1980 to 2002 as shown in Table 14. While the manufacturing FDI accounted for 66%
and 61% of total average authorised FDI in the 1980s and the 1990s respectively, the share of
the service FDI within the authorised FDI inflows was 32% and 37% in Turkey. However,
the share of service FDI jumped from 22% to 73% within 4 years (from 2003 to 2007) when
the share of manufacturing FDI in dropped from 77% in 2003 to 27% in 2007. Throughout
this period, financial intermediation was a leader sub-sector within the service FDI in Turkey.
Followings were transportation, storage and communication and wholesale and retail trade
sectors. However, what kind of changes happened in Turkey that FDI inflows in Turkey has
changed its direction from the manufacturing to the service sectors and why the structural
change started at the end of the 1990s instead of in the middle or at the end of the 1980s like
other developing countries.
Table 14: Sectoral Distribution of Authorised FDI in Turkey
Sectors 1980-1989 1990-1999 2000-2002
Manufacturing 66% 61% 39%
Agriculture 2% 1% 3%
Mining 1% 1% 1%
Service 32% 37% 58%
Source: The Undersecretariat of Treasury

72 | P a g e
The reasons behind the increase in the share of the service FDI within the realised FDI inflow
in Turkey since the end of the 1990s are similar to the reasons of changing the sectoral
distribution of the world‟ FDI stock. The reasons are as follows:
The reduction in the political and the bureaucratic barriers for foreign investors due to
liberalisation. However, the liberalisation process started late in Turkey and therefore,
the restriction for the foreign investors to enter the service sector was minimised
(Yavan, 2006).
The acknowledgement of the FDI law (No. 4785) in 2003 (Yavan, 2006).
The reduction of entry cost in the service sector due to devaluation of TL as a result of
the 2001 financial crisis.
Especially after 2001, increases in demand in the service sector such as financial
intermediaries, telecommunication, energy and communication.
The privatisation of some public banks and companies (Denizer, 1997).
The facilitation of the investment climate and macroeconomic stability.
The reduction in the number of unhealthy financial intermediaries in Turkey (Denizer,
1997).

73 | P a g e
Table 15: Sectoral Distribution of FDI inflow in Turkey (Million US $)
2003 2004 2005 2006 2007
Manufacturing Sector 539 329 829 2,100 5,113
Manufacturing as percentage of total 77% 28% 10% 12% 27%
Average of percentages 30%
Service Sector 156 855 7,699 15,533 14,015
Service sector as percentage of total 22% 72% 90% 88% 73%
Average of percentages 69%
Total 696 1,190 8,535 17,639 19,136
Source: The Central Bank of the Republic of Turkey
Service FDI in Turkey has been a leading sector since the beginning of the 2000s while
Turkey‟s rivals - East European and West Asian countries - achieved this evolution at the end
of 1980s and at the beginning of the 1990s. Therefore, manufacturing remained as a dominant
sector in the FDI inflows until the beginning of the 2000s in Turkey. The main reason behind
the late change in the sectoral distribution of FDI inflows in Turkey are as follows;
bureaucratic and political barriers until end of the 1990s and the popularity of state
companies until the 2001 financial crisis. Therefore, the implementation of privatisation was
very difficult due to bureaucratic and political barriers and a nationalist perspective. From
1923 to 2001, public banks had been used by each Turkish government as an election
investment so the sales of any state-owned companies to foreign enterprises were supported
by neither the governments nor the community. Therefore the demand of goods and services
of the foreign owned companies was very low. Moreover, the lack of a comprehensive FDI
law until 2003 is another reason of why Turkey did not increase service FDI inflows during
the 1980s and the 1990s. Finally, the failure of some financial intermediaries because of
taking open position discouraged the foreign investors to make long-term investments in the
service sector in Turkey. This is because FDI inflows to the service sector are more sensitive
to risk or uncertainty in the finance sector than that to manufacturing or primary sectors.

74 | P a g e
Table 16: Financial Intermediaries FDI inflow in Turkey (Million US $)
Year Fin. Int. FDI % of Fin.int FDI in service FDI
2002 246 0.43
2003 51 0.07
2004 69 0.06
2005 4018 0.47
2006 6957 0.39
2007 11662 0.61
2008 6069 0.41
2009 666 0.11
2010 1584 0.25
Source: The Central Bank of the Republic of Turkey.
Note: Fin. Int. represents financial intermediaries.
Table 16 shows financial intermediaries FDI in Turkey. Neither the Central Bank of the
Republic of Turkey nor the Ministry of Economics in Turkey has distinguished banking FDI
from financial intermediaries FDI. That is why there is no banking FDI data available,
specifically. In 2002, financial intermediaries FDI took 43% share of the service FDI in
Turkey with US$ 246 million FDI inflows. However, in following years – 2003 and 2004-
the share of financial intermediaries FDI in the service FDI reduced 7% and 6%, respectively.
Because of positive macroeconomic indicators and high profitability in the Turkish banking
sector, Turkey attracted US$ 4018 million (47% share of the service FDI), US$ 6957 million
(39% share of the service FDI) and US$ 11662 million (61% share of the service FDI) in
2005, 2006 and 2007, respectively. However, current global crisis lead to reduction in
financial intermediaries FDI in Turkey, as seen in Table 16.

75 | P a g e
2.4 Foreign Banking in Turkey
The banking history of Turkey goes back to the regression period of the Ottoman Empire.
The first bank in Turkey, Istanbul Bank, was established in 1847. Ottoman Bank (Bank-I
Ismanii Sahane) was established in 1863 and was the first foreign bank in Turkey (Ozdemir,
2003). The bank was French-British origin bank and run business in Turkey until 2007. The
merger of Memleket Sandiklari and Eminyet Sandigi in 1888 formed the Ziraat Bank which
has been one of the biggest public banks in the Turkish banking sector (Ozdemir, 2003).
Until the establishment of the Republic of Turkey (1923), foreign owned banks were
dominant in the Turkish banking sector in terms of assets. 13 foreign banks were running
business in Turkey in 1924 and the ratio of the total deposits of these banks to the deposits in
the Turkish banking sector was 78% although 18 domestic banks – including private and
public banks - were holding 22 % of total deposit shares in the banking sector (Akguc, 2007).
The main feature of these banks was to provide credits to the foreign owned companies in
Turkey. During the 1920s, new local banks also were established in Turkey. In 1929, the total
number of banks reached to 58 (15 of them were foreign origin banks) as a result of the
contribution of the foundation government between 1924 and 1926. However, most of them
faced bankruptcy at the end of the 1920s due to the global economic crisis in 1929. A part
from that, the lack of capital to fund private sector projects could not change the lookalike of
Turkey from agriculture-oriented country. Moreover, the reduction in profitability in the
agriculture and trade sectors also contributed to the failure of these banks during the global
crisis period. The total deposits in the foreign banks decline to 22% of total deposits in the
banking sector in 1935 from 78% in 1924 as a result of global crisis and nationalisation
movement in Turkey (Akguc, 2007). In this time period – 1924-1935 -, the main function of
foreign banks was to finance internal and external trade activities. Until the establishment of

76 | P a g e
central bank of Turkey in 1931, ottoman bank took the responsibility of issuing bank notes to
the domestic market from 1863.
Especially at the beginning of the post-WW II period, an increase in production led to an
important jump in the spending in Turkey and thus the necessity of new banks had emerged.
Therefore, there had been a distinctive increase in the number of new banks during the 1950s
(Akguc, 1989). Other main reasons behind the increase in the number of new banks in
Turkey were an increase in the returns from export and foreign credit, implementation of the
FDI encouragement law and an increase in the savings due to the economic growth in Turkey
(Akguc, 1989).
However, the number of foreign banks and the ratio of foreign banks assets to the total assets
in the banking sector reduced systematically from 1929 to 1979. In 1960, there were 51 banks
in Turkey, only 5 of which were foreign banks and the total share of foreign banks in the
Turkish banking sector was 4.4%. The total assets that were held by foreign banks in the
banking sector declined to 2.5 % in 1979 (Aydin, 2006). After the collapse of the Ottoman
Empire, the first foreign capital to the banking sector penetrated in 1964 as a result of the
investments of Bank of America and Banca D‟America (Akguc, 1989). Then, In 1977 Arab-
Turk bank was established in Turkey. The bank was a first foreign bank of Turkey in the
republic period because 60% of the shares of the bank were holding by Libya and Kuwait
investors.
The acknowledgment of new banking law (No. 7129) by the TBMM and the establishment of
the Banks Association of Turkey in 1958 were important banking developments in the

77 | P a g e
banking history of Turkey. However, economic recession at the end of the 1950s and
problems in the banking sector led to bankruptcy of some Turkish banks even if positive
developments in the banking sector (Akguc, 1989 and Ocal, 1992). Throughout the 1970s,
difficulties to open a commercial bank in Turkey made the banking sector more oligopolistic.
Therefore, local banks closed down and a multi branch banking system emerged in Turkey
(Aslan, 1982 and Parasiz, 2000). Moreover, for the first time, Turkey had faced hyper-
inflation at the same time with the exchange rate crisis at the end of the 1970s. The existing
shortage of foreign exchange in Turkey was worsened by the oil crisis in the world. In line
with other developing countries, credit availability in Turkey was, therefore, dramatically
reduced.
Prior to 1980, the financial sector in Turkey had suffered from tight finance and banking
restrictions such as high tax burden - especially for financial earnings - , high reserve
requirement, negative interest rate and high liquidity requirement. Moreover, the increase in
the fiscal deficit had been tried to be financed by an increase in money supply and thus an
inflation problem had emerged (Yeldan, 1997). As a result of these limitations over the
finance system, some of the economic indicators turned its direction to negative and an
inefficient banking sector emerged in Turkey.
The 1980‟s in Turkey mirror the reconstruction of the finance sector and the beginning of the
integration of the Turkish economy with the global financial system. As a part of the
liberalisation process in Turkey; interest rate control was removed; entry barriers into the
banking sector especially for the foreign banks were minimised; opening foreign currency

78 | P a g e
account was allowed; the Istanbul stock exchange was reopened; and government controls on
the finance sector were minimised.
Turkey‟s economic policies were inward looking and there was a comprehensive protection
of the domestic market from 1960 to 1980. Therefore, the share of state-owned banks in the
banking sector was more than 50% at the same time period (Denizer, 1998) and the banking
sector was oligopolistic in Turkey due to the entry restrictions. Thus, competition among the
Turkish banks was very limited. This condition was associated with the closure of
considerable number of Turkish banks from 1960 to 1980. Since the end of the 1970s, banks
in the developed countries have accelerated their investment to the developing countries
where there is high economic growth in general and foreign capital is crucial element to
achieve high economic growth. Thus, the share of foreign banks into the market has increased
in the world, especially in the developing countries like Turkey. The acceleration of
globalisation has contributed the development of sectors – especially banking sector- in the
world since 1980. There were some changes happened in the banking sectors as a result of
financial developments and technologic improvements. The rising importance of the banking
sector in the Turkish economy and the liberalisation of the financial system were associated
with rising incentives to foreigners in the finance sector in order to attract foreign banks to
invest in Turkey throughout the 1980‟s. Thus, the number of foreign banks substantially
increased. There were 42 banks in Turkey in 1980, only 4 of which were foreign banks. In
1990, the number of foreign banks in Turkey reached 23. Therefore, 19 new foreign banks
entered the banking sector. Most of these banks entered Turkey throughout the period 1980-
1985 and they were mostly of European and the United States origin. However, total assets
that were held by foreign banks in the banking sector only increased from 3.1% in 1980 to
3.8% in 1990 (Denizer, 1997). New foreign banks in the market were mainly located in the 3

79 | P a g e
biggest cities in Turkey and preferred commercial banking rather than retail banking although
there are no limitation to invest other cities and no limitation to fund customers via retail
banking in Turkey. In this time period, the main reasons of these new foreign bank entries are
the tenders of dam, transportation projects, telecommunication system investments,
construction investments and large public investment tenders.
At the beginning of the 1990‟s, the Turkish economy, especially the finance sector, was
struggling with liquidity problem. Until the recovery of the liquidity problem, Turkey in 1994
faced one of the most destructive crises in its history. As a result of the crisis, Turkish Lira
(T.L.) lost its reputation and its value against US$ almost 170% from January 1994 to April
1994. In order to reduce uncertainty in the finance sector, the Turkish government started to
provide a 100% insurance guarantee for deposits into the banks that had run a business in the
banking sector. However, the guarantee encouraged both public and private banks - including
foreigners - in Turkey to take more risk which was due mostly to borrowing with high
interest rate and lending with taking an open position. Then, the new banking law - No. 4389
banking law - was prepared and came into force to fix the problems of unhealthy banks
mainly in Turkey in June 1999. According to the law, the criteria of establishing a bank,
opening a branch, taking over a bank by the Saving Deposit Insurance Fund (SDIF) and
cancelling the licence of a bank in Turkey were reedited. In fact, the law facilitated the
possible sale or merger of unhealthy banks under the control of SDIF (Denizer, 1997).
Therefore, six unhealthy Turkish banks (Interbank, Egebank, Yurtbank, Sumerbank, Esbank,
and Yasarbank) were taken over by the SDIF in 1999. Inefficient banking system at the end
of 2000 triggered the banking crisis and as a solution, the exchange rate regime changed and
a flexible exchange regime was implemented. The joining of these factors triggered the
economic crisis in February 2001. Due to these reasons, foreign bank entries in Turkey had

80 | P a g e
not been accelerated and the share of bank assets that were held by foreign banks in Turkey
remained below 6% until the middle of the 2000‟s. In order to reconstruct destroyed economy
and finance system as a result of 2000 and 2001 crises, Transition to the Strong Economy
program (TSEP) and the Restructuring Program for the Banking Sector (RPBS) were
implemented. While the goals of TSEP were to accelerate privatisation of unhealthy public
companies and to achieve economic and financial stability via reconstructing trust and
confidence in the market, RPBS aimed to restructure unhealthy banks and public banks, to
prepare world-wide acceptable banking regulation and to strengthen regulatory environment
and finally strengthen private banking either domestic or foreign. At the reconstructing
period, to benefit from know-how, technology, managerial skills and capital of foreign banks,
the penetration of foreign banks to the market was facilitated. Moreover, the capital structure
of domestic or private banks was strengthened based on Basel II criteria and the sales of
TMSF banks were accelerated. The first sale of TMSF bank at the post 2001 crisis period was
realised by the sale of Demirbank to HSBC bank with US$ 350 million. After this sale, the
perspective of European banks over TMSF banks changed, positively (Steinherr et al., 2004).
Until the beginning of 2000s, due to high systemic risk in Turkey, the share of foreign bank
in the Turkish banking sector remains below 5% and expected competitive banking system
cannot be achieved despite foreign bank entries in the 1980s. However, positive
macroeconomic indicators, achieving political stability, the acceleration of reforms especially
in the finance sector, the foundation of the Coordination Council and Investment Advisory
Council, new FDI law (No.6224) and the reduction in corporate tax led to achieve high
growth rate in the banking sector in Turkey, except for the global crisis period (4th
quarter of
2008 and 1st quarter of 2009). The ratio of the total banking assets to GNP in 2005 increased
from 67% (US$ 300 billion) to 82% (US$ 536 billion) in 2009. The share of bank assets held

81 | P a g e
by the foreign banks in Turkey has jumped from US$ 8.15 billion (3.50% of the total banking
assets) in 2005Q1 to US$ 84.24 billion (13.72% of the total banking assets) in 2010Q3
although the total number of foreign banks in the Turkish banking system declined to 17.
Moreover, the difference at the post – 2001 period in the entry mode of foreign banks to
Turkey changed. In this period, they have mostly preferred the share acquisition of domestic
banks as the entry mode rather than to open a branch or representation in the banking sector.

82 | P a g e
2.5 References
[1] Aitken, B., G.H. Hansen and A. Harrison (1997). “Spillovers, Foreign Investment and
Export Behaviour.” Journal of International Economics 43: 103–32.
[2] Aitken, B. and A. Harrison (1999). "Do Domestic Firms Benefit from Direct Foreign
Investment? Evidence from Venezuela." American Economic Review 89: 605-618.
[3] AK Party (2003). "AK Party Programme." Turkish "AK Parti Programi."
Available at: (20.07.2010)
http://www.akparti.org.tr/program.asp#top.
[4] Akguc, O. (2007). “Foreign Banks in Turkey.” Turkish “Turkiye de Yabanci Bankalar”
Muhasebe ve Finansman Dergisi 36: 6-17
[5] Alfaro, L., C. Areendam, S. Kalemli-Ozcan, and S. Selin (2003). "FDI and Economic
Grwoth: The Role of Local Financial Markets." Journal of International Economics 61(1):
512-533

83 | P a g e
[6] Albuquerque, R. (2003). "The Composition of International Capital Flows: Risk Sharing
Through Foreign Direct Investment." Journal of International Economics 61: 353–383.
[7] Alpar, C. (1978). "MNCs and Economic Growth." Turkish "Çok Uluslu Sirketler ve
Ekonomik Kalkınma." Second Edition, Ankara: AITIA Yay.
[8] Aydin N., D. (2006). “The implementations of Banking” Turkish “Bankacilik
Uygulamalari” Eskisehir: Anadolu Universitesi AOF Yayinlari.
[9] Bhattacharya, M., C. Jong-Rong and V. Pradeep (2008). "Productivity Spillover in Indian
manufacturing Firms" Discussion Paper, 30/08, Monash University: Business and
Economics, Australia.
[10] Blomstorm, M. and N. E. Wolff (1989). "Multinational Corporations and Productivity
Convergence in Mexico" National Bureau of Economic Research (NBER), Working Paper,
No:3141
[11] Blomström M. and A. Kokko (1996). "The Impact of Foreign Investment on Host
Countries: A Review of the Empirical Evidence" Stockholm School of Economics, NBER
and CEPR.
84 | P a g e
[12] Borensztein, J., J. De Gregorio and J-W. Lee (1998). "How Does Foreign Direct
Investment Affect Economic Growth?" Journal of International Economics 45: 115-135.
[13] Bulutoglu, K. (1970). "Foreign Capital in Turkey." Turkish "100 Soruda Türkiye‟de
Yabancı Sermaye." Istanbul: Gerçek Yay.
[14] Caves, R. (1971). "International Corporations: The Industrial Economics of Foreign
Investment" Economica 38: 1-27.
[15] Caves, R. (1974). "Multinational Firms, Competition and Productivity in Host Country
markets." Economica 41: 176-193.
[16] Caves, R. (1996). "Multinational Enterprise and Economic Analysis." 2nd ed.
Cambridge: Cambridge University Press.
[17] Daniels, P. W. (1993). "Service Industries in the World Economy." Oxford: Blackwell.
[18] De Gregorio, J. (2003). “The Role of Foreign Direct Investment and Natural Resources
in Economic Development” Working Paper No 196. Central Bank of Chile, Santiago.

85 | P a g e
[19] Denizer, C. (1997). “The Effect of Financial Liberalization and New Bank Entry on
Market Structure and Competition in Turkey” the World Bank WPNo: 1839.
[20] Dicken, P. (1998). "Global Shift: Transforming the World Economy." Third Edition,
New York: Paul Chapman.
[21] Dumludağ, D. (2007). "PhD: Foreign Direct Investment in Developing Economies and
Turkey; The Role of Institutions." Boğaziçi University.
[22] Dunning, J. H. (1988). "Explaining International Production." London: Unwin Hyman.
[23] Dunning, J. H. (1993). "Multinational Enterprises and the Global Economy."
Wokingham, England: Addison-Wesley.
[24] Durham, J.B. (2004). “Absorptive Capacity and the Effects of Foreign direct investment
and Equity Foreign Portfolio Investment on Economic Growth.” European Economic Review
48(2): 285-306.
[25] Enderwick, P. (1994). “Transitional Corporations and Human Resources”, UNCTAD:
Transitional Corporations and World Development: 215-249.

86 | P a g e
[26] Erdilek A. (2003). "A Comparative Analysis of Inward and Outward FDI in Turkey."
Transnational Corporations 12(3): 79-105.
[27] Ernst C. (2005) "The FDI – Employment Link in a Globalizing World: The Case of
Argentina, Brazil and Mexico." Employment Strategy Papers, Employment Strategy
Department.
[28] Feis, H. (1965). "The World‟s Banker (1870-1914), A Account of European Foreign
Investment and the Connection of World Finance with Diplomacy before World War I." (IX
Preface), New Haven: Yale University Press.
[29] Foreign Investment Advisory Service (FIAS) (2001). “Turkey: a Diagnostic Study of the
Foreign Direct Investment Environment.” (Washington, D.C.: FIAS), mimeo.
[30] Fu, X. and V.N Balasubramanyam (2005). “Exports, Foreign Direct Investment and
Employment: The Case of China.” in World Economy 28: 607-625.
[31] Germidis, D. (1977). "Transfer of Technology by Multinational Corporations"
Development Centre of Organization for Economic Cooperation and Development. Paris.

87 | P a g e
[32] Glass, A. J. and K. Saggi (1998). “FDI Policies under Shared Markets.” Journal of
International Economics 49: 309-32.
[33] Glass, A. and K. Saggi (2002). "Multinational Firms and Technology Transfer."
Scandinavian Journal of Economics 104(4): 495-513.
[34] Global Business Council, (2001). "FDI Confidence Index."
Avialable at: (10.08.2012
http://www.atkearney.com/shared_res/pdf/GBPC_FDIfeb2001_S.pdf
[35] Grazia, I. (2005). “Transnational Corporations and International Production: Concepts,
Theories and Effects.” Northampton, UK: Edward Elgar Publishing Ltd
[36] Haddad, M. and A. Harisson (1993). "Are there Positive Spillovers from Direct Foreign
Investment? Evidence from Panel Data for Morocco." Journal of Development Economics
42: 51-74
[37] Hanink, D. M. (1997). "Principles and Applications of Economic Geography." New
York John: Wiley & Sons.

88 | P a g e
[38] He, J. (2006). "Pollution Haven Hypothesis and Environmental Impacts of Foreign
Direct Investment: The Case of Industrial Emission of Sulfur Dioxide (SO2) in Chinese
provinces." Ecological Economics 60(1): 228-245.
[39] Head, K. and Ries, J. (2001). "Overseas Investment and Firm Exports." Review of
International Economics 9(1): 108-122.
[40] Hunya, G. (1998). "Relationship between FDI, Privatisation and Structural Change in
CEECs." paper prepared for the Conference on Privatisation, Corporate Governance and the
Emergence of Markets in Central-Eastern Europe, FIT, Berlin.
[41] IGEME (Undersecretariat of the Prime Ministry for Foreign Trade Export Promotion
Centre) (2005). "Foreign Investment in Turkey."
Available at: [www.igeme.org.tr/english/turkey/pdfView.cfm?sec=tr&secID=1&subID=4]
[42] Javorcik, B. (2004). "Does Foreign Direct Investment Increase the Productivity of
Domestic Firms? In search of spillovers through backward linkages." American Economic
Review 94: 605-627.
[43] Kasaba, R. (1993). "Treaties and Friendships: British Imperialism, the Ottoman Empire,
and China in the Nineteenth Centur.” Journal of World History 4(2): 215-241.

89 | P a g e
[44] Lensink, R. and O. Morrissey (2001). “Foreign Direct Investment: Flows, Volatility and
Growth in Developing Countries.” Research Report 01E16, University of Groningen,
Research Institute SOM (Systems, Organisations and Management).
[45] Lipsey, R. E. (1999). "The Role of Foreign Direct Investment in International Capital
Flows."NBER Working Paper7094: Cambridge, MA.
[46] Lipsey, R. E. (2001). "Foreign Direct Investors in Three Financial Crises "NBER
Working Paper8084: Cambridge, MA.
[47] Liu, Z. (2002). "Foreign Direct Investment and Technology Spillover: Evidence from
China." Journal of Comparative Economics 30: 579–602.
[48] Markusen, J. (1983). "Factor Movements and Commodity Trade as Complements."
Journal of International Economics 14(3-4): 341-356.
[49] Moosa, I. A. (2002). "Foreign Direct Investment: Theory, Evidence and Practice." New
York: Palgrave Macmillan.
[50] Nickell, S. (1996). "Competition and Corporate Performance." Journal of Political
Economy 104(4): 724-46.

90 | P a g e
[51] Nunnenkamp, P. (2004). “To What Extent Can Foreign Direct Investment Help Achieve
International Development Goals?” The World Economy 27(5): 657-677.
[52] OECD (1999). “OECD Benchmark Definition of Foreign Direct Investment”
Available at: (15.07.12)
http://www.oecd.org/dataoecd/10/16/2090148.pdf
[53] Ongun, M. T. (2001). "Foreign Capital and Foreign Debts." Turkish "Yabancı Sermaye
ve Dıs Borçlar." Sahinöz, A. (ed.) Türkiye Ekonomisi Sektörel Analiz, Ankara: Imaj Yay.
[54] Ozdemir, D. and Darby, J. (2009). "One Less Barrier To Foreign Direct Investment in
Turkey." European Urban and Regional Studies 16(1): 87-99.
[55] Ozdemir, Z. (2003). “The Structure of Balance Sheet in the Turkish Banking System.”
Turkish “Bilanco Yapisi Itibariyla Turk Bankacilik Sistemi.” Sosyal Siyaset Konferanslari
Kitap 50.
[56] Pamuk, S. (1987) “The Ottoman Empire and European Capitalism, 1820-1913.” First
Edition, New York: Cambridge University Press.

91 | P a g e
[57] Rhee, J. and T. Belot (1989). "Export Catalysts in Low-income Countries." World Bank
Working Paper. World Bank.
[58] Sjöholm, F. (1999). "Technology Gap, Competition and Spillovers from Foreign Direct
Investment: Evidence from Establishment Data." Journal of Development Studies 36(1): 53-
73.
[59] Smarzynska, B. K. (2002). “Does Foreign Direct Investment Increase the Productivity of
Domestic Firms?: In Search of Spillovers Through Backward Linkages.” Policy Research
Working Paper No. 29. The World Bank, Washington, D.C.
[60] Steinherr, A., A. Tukel, and M. Ucer (2004). “The Turkish Banking Sector: Challenges
and Outlook in Transition to EU Membership.” CEPS EU-Turkey Working No. 4.
[61] Tezel, Y. S. (1994), “Economic History from 1923 to 1950." Turkish "Cumhuriyet
Dönemi Iktisat Tarihi (1923-1950)." Third Edition, Istanbul: Tarih Vakfı Yurt Yay.
[62] The Undersecretariat of Treasury (2003). "Foreign Direct Investment Law."
Available at: (15.07.09)

92 | P a g e
http://www.treasury.gov.tr/irj/go/km/docs/documents/Treasury%20Web/Legislation/Foreign
%20Direct%20Investment%20Legislation/FDI%20Law.pdf.
[63] Tuncer, B. (1986). "The Problem of Foreign Investment in Turkey." Turkish
"Türkiye‟de Yabancı Sermaye Sorunu." Ankara: S.B.F. Yayınları.
[64] Turkyilmaz, M. (2009). "Developments in Foreign Capital Regulations in Turkey and its
Politic and Economic Impacts." Turkish "Turkiye‟de Yabanci Sermaye Iliskin Hukuksal
Duzenlemelerin Tarihsel Gelisimi ve Konuya Iliskin Siyasal ve Ekonomik Nedenler."
Available at: (15.07.09)
http://www.turkhukuksitesi.com/makale_142.html
[65] UNCTAD, (1993). "World Investment Report 1993: Transnational Corporations and
Integrated International Production." New York: United Nations Publications.
[66] UNCTAD, (1994). "World Investment Report 1994: Transitional Corporations,
Employment and the Workplace" New York: United Nations Publications.
[67] UNCTAD, (1998). "World Investment Report 1998: Trends and Determinants." New
York: United Nations Publications.

93 | P a g e
[68] UNCTAD, (1999). "World Investment Report 1999: Foreign Direct Investment and the
Challenge of Development." New York: United Nations Publications.
[69] UNCTAD, (2004). "World Investment Report 2004: The Shift towards Services." New
York: United Nations Publications.
[70] Uras, G. (1981). "Foreign Capital Investment in Turkey." Turkish "Türkiye‟de yabancı
sermaye yatırımlari." Ankara: DPT Yay.
[71] Wang, J. and M. Blomström (1992). "Foreign Investment and Technology Transfer: A
Simple Model." European Economic Review 36: 137-55.
[72] Wei, S. (2001). "Domestic Crony Capitalism and International Fickle Capital: Is There a
Connection?" International Finance 4(1): 15-45.
[73] Xing, Y. and C. D. Kolstad (2002). "Do Lax Environmental Regulations Attract Foreign
Investment?" Environmental and Resource Economics 22: 1–22.

94 | P a g e
[74] Yavan, N. (2006). "PhD Thesis: Location Selection of FDI in Turkey." Turkish "PhD:
Turkiye‟de Dogrudan Yabanci Yatirimlarin Lokasyon Secim Uzerine Bir Arastirma." Ankara
University, Ankara.
[75] Yilmaz, L. (2006). "The Newness of No. 4875 FDI Law." Turkish "4875 Sayili
Dogrudan Yabanci Yatirimlar Kanunu‟nun Getirdigi Yenilikler." Istanbul Ticaret
Universitesi Sosyal Bilimler Dergisi 10: 173-190.
[76] Zhang, K. H. and S. Song (2000). "Promoting Exports: The Role of Inward FDI in
China." China Economic Review 11(4): 385-396.

95 | P a g e
Chapter 3: Theory of Multination Corporation
Dervis Kirikkaleli
Stirling Management School, Division of Economics, University of Stirling, FK9 4LA
Email: [email protected]
Telephone: +44 (0) 759 100 5766
3.1 Abstract
The rising magnitude of investments of MNEs has encouraged researchers to grow their
interest in the consequences and causes of FDI. Over time, the wave has led to the
development of a number of theories to explain the pattern of FDI in the world. In other
words, this trend encourages researchers to investigate the factors that motivate investors to
invest abroad. The main aims of this chapter are to evaluate the evolution of existing theories
of MNEs, including the theories of multinational banking and to reveal their lack of power to
explain the direct investments of MNEs. The nature of FDI is one to one related with MNCs
and the theory of FDI is part of the theories of MNC because most direct investments are
realised by MNCs. These theories are monopolistic advantage theory, product cyclic theory,
currency areas and exchange rate theories, oligopolistic advantage theory, transaction cost
theory and Dunning‟s eclectic paradigm.

96 | P a g e
3.2 Introduction
The rising magnitude of investments of MNEs has motivated researchers to investigate the
consequences and causes of FDI. Over time, the rising magnitude of such investment has led
to the development of a number of theories to explain the investment of MNEs. The main
aim of this chapter is to evaluate the existing theories of MNEs, including the theories of
multinational banking and reveal their lack of power to explain the direct investments of
MNEs. FDI refers to expanding the home country firm to the foreign market or markets. The
nature of FDI is one to one related with MNEs and the theory of FDI is part of the theories of
MNE because most direct investments are realised by MNEs. These theories are monopolistic
advantage theory, product cyclic theory, currency areas and exchange rate theories,
oligopolistic advantage theory, transaction cost theory and Dunning‟s eclectic paradigm.
Mainly, these questions are answered by these theories:
Why do local companies invest abroad?
How are multinational enterprises competitive against host country companies?
When do foreigners invest abroad?
Why do multinational enterprises prefer direct investment instead of licensing or
exporting?
Where is the most appropriate place for MNCs to run business?
The last three decades mirror many changes in the financial sector in the world due mainly to
the globalisation of finance sectors. Up to the 1980s, developing countries kept their entry
requirements as strict as possible against foreign banks. Since they realised that foreign banks
can save host countries‟ banking sector via providing credits either public or private sectors,

97 | P a g e
governments in the most of the developed and developing countries have started to remove
restrictions on foreign bank entries. In the same direction with the globalisation process,
multinational bank activities have gradually risen in developing countries. Similar to the
theory of MNEs, The rising magnitude of investments of multinational banks has encouraged
researchers to grow their interest in the consequences and causes of international banking.
This pattern raises some questions about the factors that motivate banks to be multinational.
The theory of foreign investment in banking sector is called international or multinational
banking theories in the literature. The main aim of this theory is to explain why multinational
bank invest abroad. In general, the theory of multinational enterprise is used to explain the
pattern of multinational bank investments in the world. Therefore, the theory of multinational
banking is one to one related with the theory of multinational enterprise. The first attempt to
explain multinational banks were made by Grubel (1977). He used almost same way of
Kindleberger‟ FDI theory. Moreover, Aliber (1976) used international trade and industrial
organisation theories to explain foreign investment in banking sector. More comprehensively,
Williams (1997) combined both the internalisation and eclectic theories to understand reasons
behind the investments of multinational banks abroad.
In the neoclassic theory, direct investment of a local company abroad under perfect
competition, however, does not take place because the investment to the host country is more
likely to be more costly than the domestic investment of the local company due to the lack of
information about the society, culture, economy and politics in the host country. Therefore,
the theory recommends firms to export its products abroad.

98 | P a g e
Prior to Stephan Hymer‟s approach26
(Hymer, 1960 and 1976), the initial works of
economists did not contribute to the theory of FDI because there was no difference among the
types of international capital flows. In other words, FDI and FPI flows were motivated by the
same factors (Forsgren, 2009). The neoclassic theory assumes that MNEs are motivated by
the differences in the rate of return among countries and all countries are perfectly
competitive (see, Iversen (1936) and Dunning and Rugman (1936)). Another assumption of
the hypothesis is that countries cannot experience FDI inflow and outflow at the same time.
Therefore, capital flows direct from a country where the rate of return is low relative to
another country where the rate of return is high with respect to the theory (Moosa, 2002). For
instance, the theory was partially reliable as US‟ MNEs had increased their investment to
European countries where the rate of return was higher than its domestic market throughout
the 1950s. However, this situation changed and the theory began to be weak to explain the
investments of MNEs at the beginning of 1960s. While the US market was relatively more
profitable than the markets of European countries, the investments of US origin MNCs
accelerated to European countries throughout the 1960s (Hufbauer, 1975). Furthermore,
while the US‟ MNEs were investing in European countries during the 1950s, especially UK
origin MNEs mostly invested in the US market where the interest rate was relatively low.
Therefore, such theory had not been appropriate to explain the direct investment of MNCs.
Another problem in this theory is that the reported profit was used to calculate the rate of
return instead of using expected or actual profit to calculate the rate of return to explain FDI.
Realised profit and profit earned throughout a year (which was used to test the hypothesis)
may not be equal. The neoclassic theory also assumed that technological developments of
countries were homogeneous, only capital and labour were taken into account as an input. In
this situation, less developed countries where technological development was also low, would
26
The approach of Stephan Hymer is explained in the following section.

99 | P a g e
attracted high-tech FDI similar to developed countries, but in real life, this situation mostly
has not happened. Not surprisingly, the attempt of Agarwal (1980) and Weintraub (1967) to
prove the hypothesis failed.
Aliber (1976) used neo-classic theory to explain multinational banking investments in the
world. According to him, the activities of banks in competitive advantage countries are
relatively more. Based on this perspective, the rate of return is a main factor to select the
good and services of banks. Therefore, banks, which have a competitive advantage, have
more change to run business abroad, profitably. Reducing cost of banking and increasing
market share of a bank are likely to run business profitably relative to other banks in the host
market. Moreover, he also pointed out that in order to reduce the uncertainty in the market,
the bank will likely to internalise itself and prefer to invest abroad. However, this perspective
is criticised by Williams (1997) because such theory did not take into account administration
cost, risk-return balance in the finance markets, and interest rate as an important factor
effecting the decisions of multination bank while taking investment decision abroad.
One scholar - Tobin (1969) – criticised the difference rate of return theory and he concluded
that the risk factor should be taken into account as an explanatory factor even though rate of
return is an important explanatory factor to make investment decision abroad. According to
him, MNEs may prefer to minimize risk per unit of return instead of high rate of return.
As a result, the increase in the share of FDI into the international capital flows since the
1950s and the rising investment of the US origin MNEs abroad where rate of return was
100 | P a g e
relatively lower have made the portfolio theory inadequate to explain the direct investment of
MNCs. This circumstance encouraged researchers to use different explanatory variables to
explain the pattern of FDI or the behaviour of MNEs.
3.3 Monopolistic Advantage Theory
The study of the Canadian scholar -Stephen Hymer- is widely accepted to have formed the
root of modern FDI theory and contributed to the development of FDI theories (Hymer, 1960
and 1976). Up to Stephen Hymer‟s approach, there was no distinction between FDI and FPI
as explained in the previous section. In other words, his approach rejected the approach of the
neoclassical theory to direct investments of MNEs. This is because MNEs could not only be
motivated by rate of return differentials among countries. Therefore, even if FDI is a kind of
capital flow, the determinant of FDI in host and home countries might be different than that
of FPI. He answered the questions of why do local enterprises invest abroad? And how do
local enterprises run business profitably in a host country despite the disadvantages such as
lack of information about the market, society, culture and politics of the host country?
According to the neoclassical theory, profit maximisation is a most important motive for
MNCs as explained in the previous section. Stephen Hymer (1960 and 1976) asserted that
profit maximisation can be achieved by the MNEs if such corporations obtain managerial
skills, technology, patents, brand name against host country companies. Accordingly, the
answer is clear “possessing firm-specific advantage by the MNEs is the reason behind
achieving their objectives in the host market”. Most researchers (whose research area is

101 | P a g e
multinational or international business) have confirmed that a firm or industry level market
imperfection – which partly comes from firm-specific advantages – is a necessary element to
encourage MNEs to invest abroad. Therefore, Stephen Hymer‟s approach to explain the
direct investment of MNEs revealed “ownership-specific advantage” which is also called
firm-specific advantage for the first time. In other words, FDI takes place when market
structure is imperfect. Market imperfection mainly comes from the firm-specific advantage
such as product differentiation, marketing skills, patent, technology, managerial skills,
internal and external economies of scale. In addition, host country restrictions on market
entry or output can make a market imperfect as well27
.
More importantly, Stephen Hymer (1960 and 1976) also distinguished the difference between
FDI and FPI. He used the “control” issue to distinguish these two forms of international
capital flows. According to him, a foreign investor has control over host countries enterprises,
if the investor owns at least 25 % of the equity of the host countries enterprise. In this
situation, FDI takes place. However, a portfolio investor does not have control over the host
countries enterprise (Grazia, 2005). Furthermore, he also pointed out that market structure is
another important determinant of FDI because MNEs achieve a higher rate of return from its
investment if market imperfection exists in the market.
27
Monopolistic advantages are unique for foreign investors and domestic enterprises cannot benefit from such
advantages. In addition, competitive market assumptions do not exist in a market where MNEs are located. On
the other hand, Hymer (1960 and 1976) described that likelihood costs of investing abroad are gathering
information, fluctuation of exchange rate or government interventions. Moreover, cultural, economic, political
and legal differences between host and home countries, creates extra costs to the MNEs in the world.

102 | P a g e
Similar to Hymer (1960 and 1976), the perspective of Grubel (1977) underlined that foreign
banks in a host market needs to have some advantages against its host country‟ rivals. The
lack of such advantages is likely to discourage such banks to make investment abroad (Bain
et al., 2003). The multinational banking theory of Grubel (1977) focused on analytically
different three types of banking which are multinational wholesale banking, multinational
retail banking and multinational service banking. He tried to understand which factors allows
banks to penetrate into a foreign environments and being able to compete against host
countries‟ rivals.
Apart from the ownership-specific advantage, Hymer (1960 and 1976) concluded the thesis
that if market imperfection does not existing in a market, this will create problems for the
MNEs and these enterprises should solve these problems. The problems are the confliction
and competition in the market. The elimination of conflicts in the host country is an important
determinant of FDI. The episode emerges, if competitors exist in a host market or if
competitors try to enter the host market. The confliction could be eliminated when MNEs
acquire a rival firm or firms in the host country. Therefore, the power of MNCs over the host
market will increase. Second, MNEs encourage two or more companies to merge. Therefore,
these companies will transform to one company.
Caves (1971 and 1982) developed the Hymer‟s monopolistic advantage theory by combining
it with the industrial organisation hypothesis. As explained above, direct investment abroad
involves some extra costs to the MNEs. The costs come from political, culture, social, legal
system, language and other differences between host and home countries. Therefore, a firm
in order to take an investment decision, especially abroad, must have some firm specific
103 | P a g e
advantages such as brand name, managerial skills and so on. Therefore, the firm will
overcome the costs of being foreign in a host country. For example, KFC has plenty direct
investment world-wide. One reason that KFC prefers direct investment instead of selling its
advantage via licensing is to protect the formulas, methods or ways used to produce its
unique products. These advantages are difficult to sell by the company because these
advantages belong to the company and it is difficult to transfer and value. Graham and
Krugman (1991) used the hypothesis to describe the pattern of US FDI flows. In addition,
under the industrial organisation hypothesis, the difference between vertical and horizontal
FDI was identified by Caves (1971 and 1982)28
.
The unspecified explanation of Hymer (1960 and 1976) to the ownership – specific
advantage was criticised by Hymer‟s followers because Hymer (1960 and 1976) did not
explained clearly how such advantages were generated by the MNCs. Moreover, the positive
impacts of investment and strategy on the generation and development of such advantages
were not taken into account. Furthermore, Hymer‟s monopolistic advantage theory explains
only why local companies invest abroad, but his theory does not explain why companies
prefer one country instead of other countries to invest. Moreover, Cantwell (2000) and Yamin
(2000) heavily criticised the Hymer‟s monopolistic advantage theory because according to
them, Hymer did not discuss how a firm can run business efficiently in a host market?
28
Vertical FDI occurs where MNEs change its production type in a foreign market. MNEs prefer vertical FDI
whenever MNCs face difficulty to enter foreign market and try to find to prevent strategic uncertainty. High risk
perception, competitiveness and low technologic development are the reasons minimized the entry of vertical
FDI to the host countries. The main reason behind the occurring vertical FDI in the world between WWII and
1980 was to reach necessary raw material for the factories of MNEs in its home countries. Horizontal FDI – is
another type of FDI - occurs where the production type of MNEs in a host country is same as that in a home
country. MNEs, which prefer horizontal type of investment, do not share its unique technology, managerial
skills with domestic companies and these enterprises minimize negative impacts of tariff on MNCs‟ export.

104 | P a g e
In conclusion, Hymer (1960 and 1976) pointed out that FDI takes place when a firm
possesses firm – specific advantages and such advantages are not being possessed by other
firms in the market. MNEs cannot cope with the costs of running business abroad without
possessing firm – specific advantages.
3.4 Product Cycle Theory
The monopolistic advantage theory was developed by Vernon (1966). He combined the
monopolistic advantage theory with the product cycle theory to explain the pattern of FDI
flows. Moreover, Vernon (1966) answered the question of why national companies of the US
preferred FDI instead of exporting. The product cycle theory29
added “time” into the
monopolistic advantage theory and also took into account technology differences among
countries. According to the theory, there are three stages of the production process which are
“new product”, “maturing product” and “standardised product” respectively. Vernon (1966)
asserted that high-tech products initially produce in a country where technology is developed
and the profit margin is high. Afterwards, the production shifts to newly-industrialized
countries and developed countries. At the final stage, the high-tech product is standardised
and the production shifts to a country where the cost of production is low such as developing
countries.
The first stage of production – new product stage - initially began with the innovation of a
high-tech product and the theory assumed that the product is not accessible by other
companies in the home country. Therefore, a company prefers the domestic market where a
29
The product cycle theory also aimed to explain increasing export from some developing and newly
industrialized countries.

105 | P a g e
country is developed or industrialized and the level of technological development is high, for
the production and sale of its product. The production continues in the market even if the
production cost is high in the market relative to developing countries. Hereby, the company
has monopolistic power in the market. Throughout the stage, neither FDI nor trade take place.
In the second stage, the rival company or companies in the local market, where the
production takes place, will likely try to copy or even to develop the product. Therefore, the
company needs to get a patent for its product versus the reaction of its rival companies. Over
time, other companies, however, reach the technological development of the company to
produce similar products in the market. Therefore, the company may lose its monopolistic
advantage. This stage is called “maturing product”. The company loses its monopolistic
advantage, but investing abroad in order to produce the product cheaply or exporting the
product, once again, put the company one step ahead against its rivals in the market. In the
third stage, the product and its technology are standardised and the company does not need
skilled labour to produce the product. Moreover, in order to be competitive in the market
where the price starts to be elastic, the company has to keep its product price low. Beside,
investing abroad becomes more profitable instead of exporting. Then the company moves its
factory to a developing country, where labour is cheap and raw materials are abundant, in
order to reduce the cost of production. Thus, international production takes place. Reducing
market share due to standardising product technology is the reason behind preferring to invest
abroad.
As previous FDI theories, Vernon‟s product cycle theory has some weak sides. Vernon‟s
product cycle theory has explained only some sectors of realised world-wide FDI. Realised
FDI flows in textile, electronics automotive and plastic sectors can be explained by the
theory. The theory ignores strategic-asset and efficient seeker-FDI and does not explain the

106 | P a g e
direct investment of technology-intensive MNCs (see, Dicken (1998) and Buckley and
Casson (1976).
Vernon developed and reformulated his product life cycle theory with a changing
international environment in 1974 and 1979. Reducing the technological development gap
between the US and other developed countries, he, therefore, perceived that product life cycle
theory did not completely explain the investments of MNEs. He developed his theory by
taking into account oligopolistic treatment (Vernon, 1979). Two things were mainly changed
relative to the early approach. One is related to the cost issue. Not only labour cost but also
other types of costs were included in the hypothesis. His new model also tried to explain
world-wide FDI flows instead of only direct investments of US origin MNCs. As a result, the
income level and the cost of production in the host markets are the main determinants of
investments of MNEs in accordance with the product cycle approach.
3.5 Oligopolistic Reaction Theory
Caves (1971) postulated that FDI emerges if the market structure is oligopolistic instead of
monopolistic. In an oligopolistic market, firms have to react to any kind of its rivals‟ reaction
in order to survive or be competitive in accordance with the oligopolistic reaction approach.
Caves (1971), Aharoni (1966), Knickerbocker (1973), and Lall and Streeten (1977) argued
that the reaction of other firms cannot be explained by the theory of profit maximization and
ownership specific advantage. Moreover, Knickerbocker (1973) developed “follow the
leader” theory combining it with the defensive FDI approach. He pointed out that the best
market structure is an oligopoly in order to benefit from the ownership specific advantage.
Furthermore, he stated that the product concentration of MNEs is increased by the

107 | P a g e
oligopolistic reaction. In an oligopolistic market, direct investment of a firm will encourage
its rivals to invest in the same foreign market because if the rivals do not follow the leader
company – which invests first to the foreign market, the rivals will lose their competitive
position in its home market. In the literature, this strategy is called “follow the leader”30
.
Thus, spoilage balance in a home market will be offset. Knickerbocker (1973) identified the
investment of the leader company as aggressive and the investments of the followers as
defensive.
However, Knickerbocker (1973) did not answer the question of why does the “leader”
company invests abroad? This is a weak side of this theory. In addition, Buckley and Casson
(1976) criticised the approach of the oligopolistic reaction theory because the approach also
existed in the previous FDI theories. Besides, the theory is very complex and it is very
difficult to model such theory to get empirical results.
3.6 Currency Areas and Exchange Rate Theories
Another significant step in the development of a theory of the MNEs was taken by the
currency areas and exchange rate theories. The power of domestic currency, for the first time,
was taken into account as an explanatory factor of direct investments of MNEs by Aliber
(1970). The aim of Aliber (1970) is to investigate the advantage of MNEs over the local
companies because he puts forward that the advantage, which is especially to exist in strong
30
For example, assume that three companies are dominant in an industry sector in country A. The companies
names are called “X, Y and Z” respectively. If the company X decides to invest country B, other companies
know that the investment of company X will affect its rivals negatively and company X will be able to reduce its
production cost and to find a chance to control country B market. Therefore, the likelihood of exporting the
products of company Y and Z to country B will minimize. Even, company X may improve its technology,
managerial skill and knowhow via such investment. Thus, the company Y and Z have only one chance in this
situation in order to be competitive. The chance is direct investment to country B.

108 | P a g e
currency area, is not specific to a firm but also other firms in the same area. Therefore, the
power of domestic currency is the main reason behind emerging direct investments of MNEs
in accordance with Aliber (1970). He asserted that a firm, where the domestic currency is
strong, becomes “investor” or “source of FDI”, whilst a firm in a poor domestic currency or
country with poor domestic currency can be only “investment receiver”. This is because the
firm in the strong currency areas has more chance to borrow in the domestic or global area at
a lower interest rate relative to the firm in the weak currency area. Thence, the firm in the
strong currency area benefits from the differences between interest rates.
Apart from the importance of domestic currency, Aliber (1970) emphasised that market
structure is also fundamental to attract FDI inflows. According to Aliber‟s hypothesis, whilst
the overvaluation of currency is a factor behind outward FDI, the devaluation of currency is a
main reason to attract inward FDI. In 1980, one scholar – Agarwal (1980) – proved that the
overvaluation of currency is a main factor influencing FDI outflow. Agarwal (1980) also
stated that appreciating domestic currency forces domestic companies to invest abroad
because appreciating currency makes domestic firms less competitive to export. Therefore,
FDI takes place. In other words, depreciating domestic currency reduces the assets price for
especially foreign investors, vice versa. Other supporters of Aliber‟s hypothesis, Froot and
Strein (1991), found a relationship between US $ and FDI inflow by using US data and they
concluded that existing market imperfection makes the cost of borrowing more expensive
than domestic borrowing due to the information imperfection in the finance sector. Therefore,
firms that belong to a weak currency area cannot be a source of FDI.
More recently, James (2008) investigated the reasons behind FDI in Malaysia using time
series techniques. He concluded that reducing the Malaysian currency values leads to larger

109 | P a g e
direct investments of MNEs to Malaysia. Therefore, his result is consistent with the currency
areas and exchange rate theories. Moreover, Azrak and Wynne (1995) and Ramirez (2006)
found similar results.
On the other hand, this theory has some weaknesses. The hypothesis used by Aliber (1970)
and Agarwal (1980), cannot be used to explain FDI flows among same currency areas
(Lisando, 1991). The last 3 decades, some researchers have found out that exchange rate is
not one of the significant determinants of FDI.
3.7 Transaction Cost Theory (Internalisation Approach)
Initially, Coase (1937) described transaction cost, which was developed further by McManus
(1972), and then Buckley and Casson (1976) within the framework of international
investment. According to McManus (1972), internalisation is a key issue for transaction cost
and a foreign subsidiary of MNCs should be operated under central control in order to
minimize cost. Buckley and Casson (1976) asserted that internalisation of a firm can
minimize or eliminate some kinds of marketing cost. Uncertainty in clients, intermediate
goods and time lags are some of reasons behind why a firm should be internalized.
Dunning (1977) accepted Buckley and Casson‟ internalisation approach as a first
comprehensive international investment approach. The theory answered the question of why
companies or investors – who had firm specific advantages - prefer to invest abroad instead
of selling their firm specific advantage through licensing, exporting or making portfolio
investment. Therefore, with the theory, the determinant of FDI shifted from country based

110 | P a g e
factors to firm based factors. According to the internalisation approach, a firm should
minimize its dependency on other firms in term of its production. In order to obtain this type
of system, the firm must be internalized. In other words, the firm must have power over its
intermediate goods. If the firm supplies its necessary raw materials or intermediate goods
abroad for its final goods, the internalisation of the firm will also make the firm
“multinational” (Buckley and Casson, 1976).
Production stages are the most vital part of this theory. These stages are the processing of raw
material, delivery of the intermediate good and production of the final good. Assume that a
firm invests in research and development to improve existing products or to produce new
products. The firm has to be sure of the sale of the products and marketing in the future
whenever a product develops or is ready for sale. If these activities will not satisfy the
expectation of the firm, the firm must set up its own marketing and sale departments.
Therefore, the firm is internalized. Moreover, if the price of the intermediate product is much
higher than the anticipation of the buyer, this situation also encourages the buyer to produce
necessary intermediate goods within the firm or to take over the seller; this is called “forward
integration”. This situation arises especially while determining the price of knowledge-
intensive assets. Furthermore, if there is a delay in the delivery of an intermediate good, once
again, a firm which buys intermediate goods from supplier should be internalized because the
delay may lead to the reduction of reputation of the firm or the failure of the firm.
For example, assume that petrol is a necessary intermediate good for the production of
company A. High transaction cost or uncertainty in a supply market are likely to increase the
cost of purchasing necessary petrol for producing final goods and even may be concluded as

111 | P a g e
a failure of company A. However, acquiring the petrol company by company A or opening
new company in this sector eliminates the possible uncertainty in the supply side. This
situation is different in a case of seller‟s perspective. Assume that the buyer firm‟s “sale
agent” does not agree about the price of product, commission rate or promotion. This
situation forces the seller to establish its own sale and marketing organisations even though
this increases the seller‟s expenses. This type of internalisation is called “forward vertical
integration”.
For instance, US origin technology-intensive companies licensed its know-how to Japanese
local companies. The expectation of the return of these companies from the licensing activity
was long term. However, as time passed, Japanese companies improved their know-how,
which is licensed from US companies, until the licensing contract finished. At the end,
Japanese companies became the exporter. Even, some of the Japanese companies engaged in
FDI in the US market. This situation demonstrates how internalisation is significant for the
future of firms.
In this theory, changing profit and income taxes from one country to another may accelerate
the internalisation period of domestic firms. Bucklet and Casson (1976) point out that
companies engage in international production if markets assimilate foreign companies. They
concluded that MNCs select investment locations depending on the rate of return; in other
words, MNCs are willingly to engage in foreign markets until the cost of investing abroad
exceeds the benefits (Casson, 1979 and Buckley, 1983). Whenever companies invest abroad
and become multinational, the companies will use their enterprises in the home county to
minimize possible losses of ownership-specific advantages. Thus, up to where marginal cost

112 | P a g e
equals marginal benefit, the internalisation process and direct investment of companies will
continue (Moosa, 2002).
Some authors, as in other multinational enterprises theories, criticised the internalisation
theory. Firstly, they criticised that to get an empirical outcome is not possible because the
theory is very general. Another one is that FDI could not be tested directly via the theory
(Moosa, 2002).
3.8 The Eclectic Paradigm
The eclectic paradigm was exposed by Dunning in 1977. Such paradigm has detailed the
theory of FDI comprehensively. The paradigm has used a variety of theories in order to
explain the pattern of FDI flows in the world. These theories are trade theory, firm theory,
industrial organisation theory, location theory and internalization theory. As explained by
Dunning (1977), transferring intermediate goods to worthy final goods is the main objective
of firms. Inputs could be categorized under two clusters which are “accessible inputs” and
“inaccessible inputs”. The first type of input is input which is freely accessible company-
specific advantages by other firms. Although obtaining different inputs among companies
(such as distance to markets, labour cost, legal system, market size and so on) or obtaining
different endowments among countries explain why domestic companies prefer to be
“multinational”, freely accessible country – specific and company-specific advantages
minimize possible advantages to invest abroad or to be multinational.

113 | P a g e
Focus point in most of the multinational enterprise theories is the second type of inputs which
is unique and inaccessible inputs of MNEs. These inputs are know-how, technology, product
innovation, brand name, patent, size of firm, managerial skill, to obtain special raw material
or low input cost due to economic of scale and market imperfection. Moreover, purchasing
unique input of another firm by MNEs can be categorised under the second types of inputs.
These inputs are also called ownership specific advantage or firm specific advantage31
.
However, the advantages can not only be special advantages for the MNEs but these
advantages may be also obtained by other firms in the home market while other firms
(including MNEs) in the world do not possess the advantages.
Dunning‟s eclectic paradigm also takes into account country based factors as an important
determinant of FDI which is called “location specific advantage” (Rugman, 1979). The latter
can either encourage or discourage foreign investors. Obtaining firm specific advantages
only provides profit to MNCs from its direct investment but where a company should invest
is another important issue. Local companies need to decide where they should invest; such a
decision relates with Dunning‟s location specific advantage theory. Location advantages are
input price, market size, economic growth, infrastructure, regulations and so on. For instance,
while producing textile and electronic equipment created additional advantages to Japanese
companies in 1970s and 1980s, British origin companies had a comparative advantage in the
production of food and tobacco products (Dunning, 1980). Furthermore US origin companies
had a comparative advantage in the production of transportation equipment whereas German
companies had a comparative advantage in the production of chemicals (Dunning, 1979).
31
Ownership specific advantage is advantage that an investor could maximize its profit in a host country if such
advantages are obtained.

114 | P a g e
These location specific advantages of these countries are also partly mirroring the current
firm-specific advantages of their companies.
On the other hand, MNEs have a unique advantage that domestic companies do not possess
these are as followed; MNEs can:
Diversify their risk by investing in different locations.
Protect themselves against any exchange rate fluctuations by transferring their liquid
assets from one currency to another.
Minimize the possibility of strikes.
Access workers easily.
Reduce negative impacts of country or industry based problems (Dunning, 1977)
Up to that point, firm specific advantages and host country advantages are taken into account
as a determinant of FDI. Firm specific advantages by firms demonstrate which firms should
need to run its business in foreign markets. Location specific advantages determine where
firms should invest to produce its products, if not; export will be the best option for the firms.
According to Buckley and Davies‟ estimation, the volume of total licensing was only one-
tenth of the total FDI in the world in the middle of the 1970s. Therefore, why did firms- who
possess at least the firm specific advantage - mostly prefer to run its business abroad, in other
words, internalising its advantages instead of externalising its advantages via licensing or
making portfolio investment?
Dunning (1977 and 1979) answered the question with using internalisation theory which is
the last stage of eclectic paradigm. Although possessing unique inputs provides some benefits

115 | P a g e
to the firm, possible externalising its advantages via selling or licensing is likely to minimize
its benefits to the firm in accordance with the internalisation theory. Therefore, the firm
should internalise itself. In other words, the firm should neither sell nor licence its unique
advantages to foreign firms. The internalisation of the unique advantages
eliminates the cost of licensing
avoids government interventions
takes advantage of the market imperfection
avoids high transaction cost
minimizes uncertainty in customers and suppliers.
The benefits of the internalisation of supplier or buyer are different. In the perspective of
buyers, a firm should be internalised if there is uncertainty about the cost and availability of
input or there is a delay in the delivery of intermediary products. In the perspective of sellers,
a firm should be internalized (1) if price discrimination in market does not exist, (2) if the
firm considers that the control of licensed product quality or service is difficult or costly and
(3) if controlling a licensed advantage is costly.
The Dunning‟s eclectic paradigm predicts which company, industry or country attracts FDI.
Dunning expected that the three parts of OLI will change during the period. Even, there are
interactions among the three parts of OLI. Dunning (1977 and 1979) underscored that the
main FDI-determinant of one country may not be an important determinant of another
country.

116 | P a g e
The three possibilities of Moosa (2002) clearly show how Dunning‟s eclectic paradigm
works. Moosa assumed that a company has an ownership-specific advantage and has demand
for its specific product. He demonstrated how a company‟s decision will change with
changing situations.
The company licences its product, if the benefits of internalization of the product is
less profitable than that of licensing and if the favourable factors of location exist in a
demander‟s country.
In a home country, the company will expands and will export demander foreign
market if the internalisation of the product to the company is beneficial to the
company and if the favourable factors of location exist in a demander‟s country.
As a last possibility, the company will engage in FDI, if the internalisation of the
product is beneficial for the company and the factors of location are favourable to
invest abroad.
As explained by Dunning (1993), foreign investors are motivated by mainly three factors,
which are the local advantage of the host country, ownership-specific advantages and “the
presence of superior commercial benefits in an intra-firm as against an arm‟s-length
relationship between investor and recipient” (UNICAD 1998, page 89) . According to
UNCTAD (1998), the local advantage of a host country is the most significant one for
attracting foreign investors. It is divided into three clusters, which are economic

117 | P a g e
determinants, business facilitation, and the policy framework for FDI. Since the 1980s, the
importance of each determinant of FDI has changed over time due to the changing
expectations of the investors (Dunning, 1997).
Gray and Gray (1981) and Yannopoulos (1983) used Dunning‟s eclectic theory to explain
international banking. Initial attempt of Gray and Gray (1981) focused on same structure of
Eclectic theory –OLI-. According to Gray and Gray (1981), the first requirement to invest
abroad or to be multinational bank is to obtain ownership specific advantage which is (1) to
have high credibility in a market, (2) to have efficient and productive work-force, (3) to have
a brand name, (4) to have human and financial capital, (5) to obtain superior banking
strategies and managerial skills and (Mutinelli and Piscitello, 2001 and Kim, 1993). Other
two components of Eclectic theory in international banking are internalisation and location-
specific advantages. In international banking, information plays an important role while
taking an internalisation decision of banks because it is difficult for banks to control
information between clients and banks. Location advantages are another important factor
which determines where banks should invest. These advantages in the banking sectors are (1)
to reach skilled labour, (2) to enter growing markets, (3) to reach high foreign exchange
reserve locations and (4) to service banks‟ customers abroad (geographic distribution) (Gray
and Gray, 1981 and Mutinelli and Piscitello, 2001). Moreover, (5) relatively less strict
regulations in a banking sector and (6) high concentration in developing country‟ banking
sector are other important location specific advantages in banking sector (Kim, 1993).
Therefore, the locations specific advantages of Turkey are growing market, skilled labour,
liberal banking system, and high profitability as a result of high concentration in the banking
sector.

118 | P a g e
As a result, the change in the pattern of FDI and the increase in the share of FDI into the total
private capital flows have encouraged researchers to investigate the determinants of direct
investments of MNEs, specifically. Therefore, such factors have led to the development of a
number of theories to explain FDI over time. These theories are the difference in rate of
return, monopolistic advantage theory, product cycle theory, currency areas and exchange
rate theories, oligopolistic advantage theory, transaction cost theory and Dunning‟s eclectic
paradigm. Mainly, these questions are answered by these theories; why do local companies
invest abroad? How are multinational companies competitive against host country
companies? When do foreigners invest abroad? Why do multinational enterprises prefer
direct investment instead of licensing or exporting? Where is the most appropriate place for
MNEs to run business?
However, what we know is that each country has unique economic, social, political and
cultural conditions. Therefore, factors to attract foreign direct investment are likely to change
from one country to another. Moreover, the determinant of direct investment in a service
sector in a host market may be different than that in the manufacturing sector. Therefore,
each sector may have different key factors to attract FDI. The flip side of the coin, the impact
of the direct investment on the host market can be different from one country to another.
Moreover, service FDI may contribute host countries' economy more than manufacturing
FDI. In conclusion, each country should be investigated specifically to identify the impact
and determinant of MNEs. In this framework, two way linkages (1) between foreign bank
penetration and banking variables (2) between foreign bank penetration and host country risk
in Turkey is investigated in this thesis using time-series models. Moreover, the internal

119 | P a g e
relationship among the private capital flows, which are foreign direct investment, foreign
portfolio investment and foreign bank penetration, is explored using the multivariate VAR
approach.

120 | P a g e
3.9 References
[1] Agarwal, J. P. (1980). "Determinants of Foreign Direct Investment: A Survey."
Weltwirtschaftliches Archiv 116: 739-773.
[2] Aharoni, Y. (1966). "The Foreign Investment Decision Process" Division of Research,
Graduate School of Business Research, Harvard University, Boston.
[3] Aliber, R. Z. (1970). "A Theory of Direct Foreign Investment" in Charles P.
Kindleberger, ed., The International Corporation: A Symposium, Cambridge: MIT Press.
[4] Azrak, P. and K. Wynne (1995). "Protectionism and Japanese Direct Investment in the
United States." Journal of Policy Modeling 17: 293-305.
[5] Bain, E., J. Fung and I Harper (2003). “Multinational Banking: Historical, Empirical and
Case Perspectives.” Edited by A.W. Mullineux and V. Murinde. UK and USA: Edward Elgar
[6] Blomstrom, M., M. Zejan and A. Kokko (2000). "Foreign Direct Investment: Firm and
Host Country Strategies." London: MacMillan Press.

121 | P a g e
[7] Buckley, P. J. and M. Casson (1976). "The Future of the Multinational Enterprise"
London: MacMillan Press.
[8] Buckley, P. J. (1983). "Macroeconomic Versus International Business Approach to Direct
Foreign Investment: a Comment on Kojima‟s Approach" Hitotsubashi Journal of Economics
24(1): 95-100.
[9] Campos, N. F. and Y. Kinoshita (2008). "Foreign Direct Investment and Structural
Reforms: Evidence from Eastern Europe and Latin America" IMF Working Papers, No.906:
1-38.
[10] Cantwell, J. (2000) „A Survey of Theories of International Production." In the Nature of
the Transnational Firm, London: Routledge.
[11] Caves, R. (1971). "International Corporations: The Industrial Economics of Foreign
Investment" Economica 38: 1-27.
[12] Dörrenbächer C. (2000). "Measuring Corporate Internationalisation: A Review of
Measurement Concepts and their Use" Intereconomics 35(3): 119-126.

122 | P a g e
[13] Dunning, J. H. (1977). "Trade Location of Economic Activity and the Multinational
Enterprise. A Search for an Eclectic Approach" in The International Allocation of Economic
Activity. Edited by B. Ohlin, P. O. Hesselborn, and P. J. Wiskman, London: MacMillan.
[14] Dunning, J. H. (1979)."Explaining Changing Patterns of International Production: in
Defense of the Eclectic Theory." Oxford Bulletin of Economics and Statistics.
[15] Dunning, J. H. (1980). “Toward an Eclectic Theory of International Production: Some
Empirical Tests.” Journal of International Business Studies 11(1): 9-13.
[16] Dunning, J. H. (1993). "Multinational Enterprises and the Global Economy."
Wokingham: Addison-Wesley.
[17] Dunning, J. H. (1997). "Re-evaluating the Benefits of Foreign Direct Investment, in
Alliance Capitalism and Global Business." London: Routledge.
[18] Dunning, J. H. and S. M. Lundan (2008). "Multinational Enterprises and the Global
Economy." Second Edition, Cheltenham: Edward Elgar.

123 | P a g e
[19] Dunning, J. and A. Rugman (1985). "The Influence of Hymer‟s Dissertation on the
Theory of Foreign Direct Investment." American Economic Review 75(2): 228-232.
[20] Forsgren, M. (2009). "Theories of the Multinational Firm. A Multidimensional Creature
in the Global Economy." Cheltenham: Edward Elgar.
[21] Gray, J. and P. Gray (1981). “The Multinational Bank: A Financial MNC?” Journal of
Banking and Finance 5(1): 33-63.
[22] Grazia Ietto-Gillies, (2005). "Transnational Corporations and International Production:
Concepts, Theories and Effects." Cheltenham: Edward Elgar.
[22] Grubel, H. G. (1977). “A Theory if Multinational Banking”. Banca Nazionale del
Lavoro 123:349-363
[23] Hymer, S. (1960). “The International Operations of National Firms: A Study of Direct
Foreign Investment.” PhD Dissertation. MIT Press.
[24] Hymer, S. (1976). "The International Operations of National Firms: A Study of Direct
Foreign Investment." Boston: MIT Press.

124 | P a g e
[25] Hufbauer, Gary C. (1975). "The Multinational Corporation and Direct Investment." in
Peter B. Kenen, eds., International Trade and Finance, Cambridge: Cambridge University
Press.
[26] Iversen, C. (1936). "International Capital Movements" Oxford: Oxford University Press.
[27] James B. A. (2008). "Determinants of Foreign Direct Investment in Malaysia." Journal
of Policy Modeling 30: 185-189.
[28] Kehal, H. S. (2004). "Foreign Investment in Developing Countries." New York:
Palgrave Macmillan.
[29] Kim T. (1993). “International Money and Banking.” London: Routledge.
[30] Kindleberger, C. P. (1969). "American Business Abroad: Six Lectures on Direct
Investment." New Haven: Yale University Press.
[31] Kinoshita, Y. and Campos, N. (2001). “Agglomeration and the Locational Determinants
of FDI in Transition Economies.” CUNY and University of Newcastle, mimeo.

125 | P a g e
[32] Knickerbocker F. T. (1973). "Oligopolistic Reaction and Multinational Enterprise."
Boston: Harvard University.
[33] Lall, S. and Paul S. (1977). "Foreign Investment, Transnationals and Developing
Countries." London: Macmillan.
[34] Lipsey R. E. and B. Swedenborg (1999). "Wage Dispersion and Country Price Levels."
NBER Chapters, in: International and Interarea Comparisons of Income, Output, and Prices,
National Bureau of Economic Research.
[35] McManus, J. C. (1972). “The Theory of the International Firm”, In G. Paquet (ed.), The
Multinational Firm and the Nation State, Don Mills Ontario: Collier-Macmillan.
[36] Moosa I. A. (2002). "Foreign Direct Investment: Theory, Evidence and Practice."
London: Palgrave.
[37] Mukherjee, A. and K. Suetrong (2007). "Unionisation Structure and Strategic Foreign
Direct Investment." GEP Research Paper Series 22, University of Nottingham.
126 | P a g e
[38] Mutinelli, M. and L. Piscitello (2001). “Foreign Direct Investment in the Banking
Sector: the Case of Italian Banks in the 90s.” International Business Review 10(6): 661-685.
[39] Ramirez, M. D. (2006). "Economic and Institutional Determinants of Foreign Direct
Investment in Chile: A Time Series Analysis 1960–2001." Contemporary Economic Policy
24: 459–471.
[40] Razin, A., E. Sadka, and C. Yuen (1996). "A Pecking Order Theory of Capital Inflows
and International Tax Principles." CEPR Discussion Papers 1381.
[41] Rugman, A. M. (1979). "International Diversification and the Multinational Enterprise."
Lexington: D.C. Heath.
[42] Rugman, A. M. (1982). "New Theories of the Multinational Enterprise." London, Croom
Helm and New York: St. Martin's.
[43] Tobin, J. (1969) “A General Equilibrium Approach to Monetary Theory.” Journal of
Money, Credit, and Banking 1:15–29.

127 | P a g e
[44] UNCTAD, (1998). "World Investment Report 1998: Trends and Determinants." New
York: United Nations Publications.
[45] U.S. Department of Commerce, Bureau of the Census (1937a). Census of Manufactures.
[46] U.S. Department of Commerce, Bureau of the Census (1937b). Maps of Selected
Industries Reported at the Census of Manufactures.
[47] Weintraub, R. (1967). "Studio Empirico Sulle Relazioni di Lugo Andare Tra Movimenti
di Capitali e Rendimenti Differenziali." Rvisita Internalizionale di Scienze Economiche e
Commerciali 14: 401-415.
[48] Williams, B. (1997). “Positive Theories of Multinational Banking: Eclectic Theory
versus International Theory.” Journal of Economic Surveys 11: 71-100.
[49] Vernon, R. (1966). "International Investment and International Trade in the Product
Cycle." Quarterly Journal of Economics 80(2): 190-207.
[50] Yamin, M. (2000). "A Critical Re-evaluation of Hymer‟s Contribution to the Theory of
the Transnational Corporation." in the Nature of the Transnational Firm, London: Routledge.

128 | P a g e
[51] Yannopoulos, G. (1983). “The Growth of Transnational Banking.” Edited by M.Casson.
London: George Allen and Irwin.

129 | P a g e
Chapter 4: Foreign Bank Penetration and Domestic Banking System: Empirical
Evidence from Turkey Based on VAR Approach
Dervis Kirikkaleli
Stirling Management School, Division of Economics, University of Stirling, FK9 4LA
Email: [email protected]
Telephone: +44 (0) 759 100 5766
4.1 Abstract
In this study, I aimed to investigate the short run and long run relationship, if it exits, between
foreign bank penetration (FBP) and determinants of bank performance namely, domestic
bank assets, domestic credit and banking profitability in Turkey using quarterly data from
1994Q1 to 2009Q4, while controlling DGDP and 2001 financial crisis. Using a VAR model,
and the Johansen co-integration test, I examined the long run relations between FBP and bank
performance. However, I could not detect any long run relationship between DFBP and
domestic bank assets and between DFBP and domestic credit. Using Granger causality,
impulse response function, and variance decomposition, I examined the short run dynamics.
The outcome of the Granger causality test indicates that there is unilateral causality which
runs from domestic bank assets to DFBP at 10% level. Moreover, I also found feedback
causality between DFBP and domestic credit at 5% level. By employing impulse response
functions, my findings reveal that rising foreign bank assets in Turkey tend to increase
domestic bank assets and credit availability in short run, vice versa. Surprisingly, no

130 | P a g e
significant impact of foreign bank penetration on profitability in the banking sector is
observed.
4.2 Introduction
The last two decades mirror many changes in the financial sector in developing countries due
mainly to the globalisation of finance sectors. In the same direction with the globalisation
process, FDI and multinational bank activities have gradually risen in developing countries.
Rising foreign bank activities in developing countries have motivated researchers to
investigate foreign banks comprehensively. The share of banking sector assets held by
foreign banks in the developing countries, on average, increased to almost 40% in 2005 from
22% in 1996. Moreover, total credit provided by foreign banks in the developing countries
jumped to 26% of GDP in 2008 from 10% in 1996. In other words, a high growth rate was
achieved in credit provision by foreign banks and share of foreign banks in developing
countries. Overseas banks have played a significant role in domestic banking sectors in the
developed and developing countries (Claessens et al., 2008). Supporters of this pattern have
underlined the positive impact of foreign bank penetration on capital ratio, efficiency and
competition, credit availability, managerial skills, technology, and innovation capacity.
However, others have taken into account the flip side of the coin by blaming foreign bank
penetration as a main reason behind the destabilisation of the domestic banking system.
Empirical studies have revealed that the positive impact of foreign bank penetration on the
domestic banking system predominated (Cull and Peria, 2010). Due to this, politicians in the
world have tried to encourage foreign banks to take advantage of them since the beginning of
the 1980‟s. Therefore, this also made the determinants of foreign bank penetration an

131 | P a g e
interesting area to research. As time passes, both empirical and theoretical findings in this
context have risen.
This study aims to reveal the long run and short run relationship between foreign bank
penetration and bank performance (namely, domestic bank assets, domestic credit and bank
profitability), while controlling GDP and 2001 financial crisis in Turkey. In this perspective,
my hypotheses are as follows:
Hypothesis 1: Rising domestic bank assets are associated with increasing foreign bank assets
and vice versa.
Hypothesis 2: There is positive linkage between credit availability and foreign bank
penetration.
Hypothesis 3: Although the impact of profitability on foreign bank penetration is positive,
reverse relationship is negative.
In the first model, there is unilateral causality which runs from domestic bank assets to DFBP
at 10 % level. I found that in the short run, there is a positive relationship between DFBP and
domestic bank assets by analysing the impulse response functions. In the second model, my
findings indicate that there is bilateral causality between DFBP and domestic credit at 5%
level. While rising foreign bank assets in Turkey are associated with higher credit availability
in the domestic market, domestic credit in the market has positive impact on the DFBP in the
short run, as expected. In line with the literature, the sign of the relationship between DFBP
and domestic credit is positive in the second model as I expected. Finally, my study reveals
that no Granger causality between profitability and DFBP is found. The response of DFBP to
one standard deviation shock in PRO is significant and positive at 3rd
quarter. The reverse
effect is surprisingly positive but not statistically significant.

132 | P a g e
This study is organised as follows. Section 4.3 provides an overview of the existing literature
on the concept. Section 4.4 discusses developments in the banking sector of Turkey since the
1980‟s. Section 4.5 and 4.6 presents the data and empirical methodology that is used in this
study, respectively. Section 4.7 reports the empirical findings from the VAR models. Lastly,
section 4.8 concludes.
4.3 Literature Review
The on-going negotiation between the EU and Turkey about the integration of Turkey into
the EU and the gradual rise of the share of banking assets to GNP have made Turkey a more
interesting country to investigate and opened new debate on the Turkish banking sector.
Although the performance of foreign and domestic banks in Turkey was heavily investigated
by Osman (1995)32
, Ertugrul and Zaim (1999)33
, Isik and Hassan (2002)34
, Yildirim (2002)35
,
Demir et al. (2005)36
, Ozkan-Gunay and Tektas (2006)37
, Aysan and Ceyhan (2008)38
,
32 Using a non-parametric frontier technique, the primary purpose of the paper of Osman (1995) is to investigate
the impact of liberal policies on the Turkish banking system after the 1980's. His findings reveal that financial
liberalisation policies improved the allocative and technical efficiency of Turkish banks.
33 Similar to the finding of Osman (1995), Ertugrul and Zaim (1999) found that financial reforms in Turkey
seem to have positive impact on the Turkish banking system using the Data Envelope Analysis (DEA) approach.
34 Isik and Hassan (2002) aim to analysis the efficiency in the Turkish banking system over the period of 1988-
1996. Their finding, not surprisingly, mirrors that foreign banks are more efficient than domestic banks.
35 Yildirim (2002) also evaluate the banking efficiency in Turkey using the DEA approach over the period of
1988-1999. He concluded that chancing the ownership of commercial banks directly affects the performance of
them. Moreover, consistent with the finding of Denizer et al. (2007), he finds that the Turkish banking sector
struggles from scale inefficiency.
36 Demir et al. (2005) assess the efficiency of Turkish banks, comparing the pre and post liberalisation periods.
Their study reports that the technical efficiency of banks in Turkey had been affected by bank ownership, loan
quality and bank profitability.
37 Using the DEA approach, Ozkan-Gunay and Tektas (2006) aim to investigate the technical efficiency of
commercial banks over the peroid of 1990-2001.
38 Aysan and Ceyhan (2008) use a panel fixed effects regression technique to assess the performance of banks in
Turkey. Their finding shows that (1) rising bank capitalisation is associated with more efficient banking system

133 | P a g e
Denizer et al. (2007)39
and Fukuyama and Matousek (2011)40
, the short run and long run
relationship, if it exists, between banking performance and foreign bank penetration has not
been explored. More specifically, the objective of this paper is threefold. First, I aim to
investigate the relationship between domestic bank assets and foreign bank penetration in the
long run and short run in Turkey. The second objective of this paper is to detect the long run
and short run relationship, if it exists, between domestic credit and foreign bank penetration.
To investigate relationship between foreign bank penetration and banking profitability, if it
exists, is a final objective of this paper.
4.3.1 Foreign Bank Penetration and Domestic Banks
Knickerbocker (1973) developed the “follow the leader” theory combining it with the
defensive FDI approach. According to his approach, in an oligopolistic market, direct
investment of a firm will encourage its rivals to invest in the same foreign market, because if
the rivals do not follow the leader company – which invests first into the foreign market-, the
rivals will lose their competitive stature in its home market. However, how foreign bank
penetration affects the behaviour of domestic banks in the host country and how rising (or
falling) domestic assets in the bank system will affect the location choice of the foreign bank
has not been deeply explored. Regarding domestic bank assets, only one study - Engwall et
but rising the number of branches has the opposite effect on efficiency; (2) there is a complementary
relationship between efficiency and loan ratio.
39 Another study - Denizer et al. (2007) - uses DEA approach to assess banking efficiency in Turkey, comparing
the pre and post liberalisation periods over the period of 1970-1994. The main two findings are as follows; (1)
decline in efficiency as a result of the liberalisation program in Turkey and (2) existing scale problems in the
banking sector. They also underline that the main reason behind the declining efficiency is raising
macroeconomic and financial instability.
40 More recently, Matousek and Fukuyama (2011) investigate the efficiency of the Turkish banking sector
between 1991 and 2007 using a two-stage network model. Their most interesting finding is that in Turkey
foreign banks do not have a higher efficiency score than others banks in the sector.

134 | P a g e
al. (2001) - analyse the impact of the foreign bank assets on domestic bank assets in the
Nordic countries and they found that rising (or falling) foreign bank assets were associated
with higher (or lower) domestic bank assets in Norway, Sweden and Finland. However, this
hypothesis did not hold in Denmark. Otherwise, there is still big question mark about the
possible impact of domestic bank assets on foreign bank penetrations. In other words, the
reaction of foreign banks when the domestic bank assets rise (or fall) has not been
investigated in Turkey. Therefore, this study also aims to fill this gap. Hypothesis 1 considers
that the impact of domestic bank assets on foreign bank penetration is positive and the
reverse impact is also positive.
4.3.2 Foreign Bank Penetration and Domestic Credit
Similar to Hypothesis 1, Hypothesis 2 considers that rising foreign bank penetration in
Turkey is associated with increasing credit availability and vice versa. Availability of credit
to the private sector is crucial for financial development and economic growth in both
developed and developing countries. Even, credit availability has been used widely as a
proxy for financial development in empirical papers. Therefore, it is also important to know
the impact of foreign bank penetration on domestic credit for politicians because the one of
the main reason behind the motivation of politicians to attract foreign banks interest is its
possible impact on credit availability in their host markets. Overseas bank penetration to a
host country has been associated with better financial conditions, but this finding mostly
indicates that foreign banks are less willing to lend to domestic companies, especially small
ones, than domestic banks do. This may arise due to the lack of information and difficulty
and cost to gather information about small companies in the host markets.

135 | P a g e
Although some studies – Bleger and Rozenwurcel (2000), Goldberg (2000), Berger et al.
(2001), Satta (2004), Clarke et al. (2005), Jeon et al. (2006), Main (2006), Clarke (2006) and
Detragiache et al. (2008) compare the credit provision of domestic and overseas banks to the
domestic market in a specific country or group of countries, the dynamic relationship
between foreign bank penetration and credit availability has remained unexplored. The
findings of Berger et al. (2001) reveal that small companies in Argentina has a lesser chance
of getting credit from foreign and large banks relative to large companies. Moreover, Mian
(2006) finds that foreign banks in Pakistan are less willingly to lend to opaque businesses
relative to domestic banks. The findings of Bleger and Rozenwurcel (2000) show that
between 1996 and 1998, foreign bank penetration led to the reduction of bank credits to small
enterprises to 16% from 20% in Argentina. Goldberg (2000) by analysing banking sectors in
Mexico and Argentina find that the loan growth of overseas banks was much more than that
of domestic banks in these countries. Furthermore, the overseas banks contributed positively
to both the volatility of lending and credit. They also point out that credit growth of foreign
banks in these countries did not change dramatically throughout the domestic crises at the end
of the 1990‟s.
Clarke (2006) investigates the effect of foreign bank penetration on domestic market credit
availability using the surveying technique in 38 transition and developing countries. He
points out that domestic credit is positively affected by foreign bank penetration. However,
his findings also indicated that the contribution of foreign banks to credit provision for small
and medium companies is less than that of domestic banks. Jeon et al. (2006) analyse the
Korean banking system and compare the performance of the domestic and foreign banks in
the market to answer the question of how foreign banks contributed to the stabilisation of the
Korean economy. They conclude that the total lending those foreign banks provided to the

136 | P a g e
Korean economy declined when the financial crisis erupted in 1997. However, there was no
reduction in won-denominated loans. Apart from that, they find that after the Asian crisis, the
volume of total loans that domestic banks provided did not decline. Satta (2004), using bank
data between 1991 and 2001, investigates credit availability of foreign banks to small
enterprises in Tanzania. The finding of Satta (2004) indicates that foreign banks that financed
small enterprises are insignificant relative to domestic banks. The author advises the
Tanzanian government to prepare a new policy to encourage overseas banks to expand their
lending to small enterprises in Tanzania. Cross-country level evidence of Detragiache,
Tressel and Grupta (2008) also supports the idea that foreign bank penetration is associated
with less credit provision. This evidence is based on 89 low income countries for the period
of 1999-2002.
A different finding in the issue comes from Clarke et al. (2005) who conclude that large
foreign banks in Chile and Colombia lent more to small and medium size enterprises than
domestic banks. Moreover, medium and large foreign banks in Argentina and Chile achieved
higher growth of lending to small enterprises relative to medium and large domestic banks
during the period of 1997-2000. In most cases, the evidences indicate that foreign banks are
less willing to lend to domestic companies, especially small ones, than domestic banks are.
This may arise due to lack of information and difficulty and cost to gather information about
small companies and because different economic, financial, political and social factors
among countries.

137 | P a g e
4.3.3 Foreign Bank Penetration and Profitability
As mentioned in the previous section, Hypothesis 3 is related to profitability in the banking
sector in Turkey. Hypothesis 3 considers that although the impact of profitability on foreign
bank penetration is positive, the reverse relationship is negative. The substantial rise of
foreign bank assets in the world has received considerable attention by both researchers and
politicians. In common with both empirical and theoretical researches, profitability in a host
country is a main driving factor of foreign banks. The main empirical findings about the
impact and determinant of foreign bank penetration are presented in Table 17. Claessens et al.
(2001) investigate the impact of foreign bank penetration on domestic banks using almost
8000 banks from 80 countries for the period of 1988-1995. They find that foreign banks tend
to run businesses more profitably relative to domestic banks and the rising of foreign banks in
these markets tends to reduce host banking sector‟s profitability. Denizer (2000) examines
the effect of foreign banks on the banking sector in Turkey using annual data sets from 1980
to 1997. His findings reveal that foreign bank penetration is inversely related to the return on
assets. Zajc (2002) aims to find the effect of overseas banks on the performance of domestic
banks in six European transition countries. His findings indicate that overseas banks tend to
reduce profitability and raise the cost of indigenous banks.
The study of Lensink and Hermes (2004) proposes to develop the study of Claessens (2001).
They find that foreign bank penetration does not have a strong impact on the domestic
profitability at lower levels of economic development. Furthermore, at higher levels of
economic development of host countries the impacts are not clear because foreign bank
penetration is either associated with falling profitability in the banking sector or not
associated with any change in profitability. Using a panel data of 17 Thai banks over the

138 | P a g e
1990-2002 period, Okuda and Rungsomboon (2004) assessed the effect of foreign bank
penetration on the Thai banking sector. Their findings indicate that rising competition in the
domestic banking sector due to the penetration of foreign banks has a negative impact on
domestic banks in the short run; foreign bank penetration reduces domestic profitability and
increases overhead expenses.
Apart from the impact of foreign bank penetration to the host country, Facarelli and Pozzolo
(2000) and Bumin (2007) investigate the possible effects of profitability on foreign bank
penetration via investigating the factors influencing the location choice of overseas banks.
The empirical result of Facarelli and Pozzolo (2000)‟s paper using 260 banks data from
OECD countries indicates that profitability resulting from an expected growth is one of the
main factors influencing the location choice of foreign banks, especially for subsidiaries.
Moreover, integration between the host and home markets plays a role on the decision of
foreign banks. Bumin (2007) tries to identify the key factors determining foreign banks in
Turkey using data from January 2003 to June 2006. His findings indicate that profitability in
the banking sector is the main factor influencing foreign banks. Furthermore, economic
growth, potential demand for the banking services are other determinants of foreign banks in
Turkey. However, none of these papers in this section investigated two way linkages between
foreign bank penetration and profitability using the same data set. I aim to fill this gap for
Turkey via investigating the long run and short run dynamics between profitability and
foreign bank penetration.

139 | P a g e
Table 17: Determinant and Impact of Foreign Bank Penetration
Profitability and Foreign Bank Penetration
Author(s) Profitability as a
significant
determinant of
foreign bank
penetration
Impact of foreign
bank penetration
on domestic
profitability
Period Data
Claessens et al.
(2001)
None (Negative) 1988-1995 80 countries
Denizer (2000) None (Negative) 1980-1997 Turkey
Zajc (2002) None (Negative) 1995-2000 Six European transition
countries
Lensink and
Hermes (2004)
None Fail to find impact 1990-1996 Same data set that used
by Claessens et al.
(1998)
Okuda and
Rungsomboon
(2004)
None (Negative) 1990-2002 Thailand
Facarelli and
Pozzolo (2000)
(Positive) None 1994-1997
OECD countries
Bumin (2007) (Positive) None Jan. 2003-
June 2006
Turkey
Credit and Foreign Bank Penetration
Author(s) Credit as a
significant
determinant of
foreign bank
penetration
Impact of foreign
bank penetration
on domestic credit
Period Data
Goldberg et al.
(2000)
None (Positive) 1995Q2-
1999Q2
Argentina and Mexico
Clarke (2006) None (Positive) - 38 transition and
developing countries
Domestic Banks and Foreign Bank Penetration
Domestic bank
assets as a
significant
determinant of
foreign bank
penetration
Impact of foreign
bank penetration
on domestic bank
assets
Period Data
Engwall et al.
(2001)
None (Positive) - Norway, Sweden,
Finland and Denmark

140 | P a g e
4.4 Data
The time series variables used in the empirical tests of this paper consists of the quarterly for
the period 1994Q1 to 2009Q4 which includes 69 observations. The time series data were
used in this paper are collected from the Central Bank of the Republic of Turkey and The
Banks Association of Turkey. The time series variables used in the models are shown below;
FBP: Total assets held by foreign banks in the banking sector. Holding 50% share acquisition
by a foreign bank or foreign investor in a host country is accepted as a minimum requirement
to have an important influence on the management of acquired bank in Turkey. In other
words, acquiring 50% or more shares of domestic bank are recorded as a foreign bank in
most of the countries. However, FDI arises when a foreign investor acquires 10% or more
shares of domestic company and obtains, moreover, managerial control on domestic
company. Therefore, there is a difference between banking FDI and total assets of foreign
banks.
In this paper, I accepted that FBP measured as the total value of foreign bank assets. It is
important to know the relationship between FDI and foreign bank activities before to select
foreign bank assets as a proxy for foreign bank penetration. Nigh et al. (1986) and Goldberg
and Johnson (1990), as expected, found positive relationship between US FDI and foreign
activities of US banks. Similar to Nigh et al. (1986) and Goldberg and Johnson (1990),
Focarelli and Pozzolo (2000) found positive relationship between non-bank FDI and bank
choice of location in the OECD countries. In addition, the study of Miller and Parkhe (1998)

141 | P a g e
reveal that there is correlation between non-bank FDI and bank FDI. Grosse and Goldberg
(1991) and Esperanca and Gulamhussen (2001) used aggregate foreign bank assets while
examining the determinants of foreign bank penetration, same as I used. It is well-known
that lending to the private sector depends on the supply and demand for loans41
. As FDI in the
banking sector raises the credit provision to the host market. Thus, this will increase total
assets. In other world, this will increase the size of the balance sheet and therefore FDI affects
FBP.
PRO: Return on assets after tax in the banking sector was used as a proxy for profitability in
the banking sector. The raw data were used because some observations for the variable are
negative.
CREDIT: Total domestic credit provided by banks, including both domestic and foreign
banks in Turkey. The variable also was expressed in its logarithmic transformation.
DB: Total assets in the banking sector, excluding the foreign ones in the Turkish banking
sector. The variable was expressed in its logarithmic transformation.
GDP: nominal GDP is used as a control variable since it is believed that GDP is an important
determinant of FDI, FBP and FPI. The findings of Buch (2000), Brealey and Kaplanis (1996)
and Yamori (1996) Herrero and Peria (2005) underlined that GDP in host countries seems
most important factor that affects the location decision of multinational banks. Similar to
these findings, the study of Luca and Spatafora (2012) implies that rising GDP is associated
with higher capital flows in developing countries.
41
While demand for loans is simply affected by real GDP, prices, interest rate and so on, supply for loans is
affected by loan demand, loan rate and so on.

142 | P a g e
DUM2001: DUM2001 is a dummy variable and used as a control variable since it is believed
that financial crisis in 2001 led to significant changes in the Turkish banking sector.
Table 18. Descriptive Statistics for the Variables of FBP,
PRO, CREDIT and DB
FBP PRO CREDIT DB
Mean 8.900 1.191 10.769 11.852
Median 8.600 1.298 10.479 11.741
Maximum 11.280 5.023 12.401 13.049
Minimum 7.357 -3.249 9.755 10.739
Std. Dev. 1.212 1.572 0.774 0.671
Skewness 0.797 -0.831 0.868 0.294
Kurtosis 2.427 4.309 2.379 1.926
Jarque-Bera 8.266 12.881 9.788 4.307
Observations 69 69 69 69
Note: the data bases on 64 observations (1994Q1-2009Q4)
Source: The Bank Association of Turkey
Descriptive statistics for FBP, PRO, CREDIT, and DB variables are demonstrated in Table
18. The FBP variable shows variation, ranging from 7.36 to 11.28. Moreover, there is also
variation in the DB, CREDIT, and PRO variables, ranging from 10.74 to 13.05, from 9.76 to
12.40, and from -3.25 to 5.02, respectively. Table 18 also provides information about the
distribution of the variables by using Skewness, Kurtosis, and Jarque-Bera techniques.
Whereas FBP, CREDIT, and DB variables are positively skewed, the PRO variable is
negatively skewed. Regarding Kurtosis, the distribution of FBP, CREDIT and DB variables
has large tails (more peaked) while the distribution of the PRO variable has small tails
(flatter). In addition, the result of the Jarque-Bera test reveals that the distribution of FBP,
CREDIT variables, and PRO variables is normal but the null hypothesis that DB is normal
distribution cannot be rejected with a χ2
= 4.307 (p-value = 0.116).
143 | P a g e
Figure 3 shows the total assets of foreign banks in Turkey, between 1994 and 1996, the
growth of foreign bank assets was very small. Although it is difficult to see in Figure 3, 8.5 %
quarterly growth was achieved in foreign bank assets between 1996 and 2000, and then from
2000 to 2003 the growth was negative due to economic and banking crisis. Since the end of
2003, except Q4-2008, and Q1 -2009, foreign bank penetration has accelerated because of
positive macroeconomic indicators, high profitability in the banking sector, new FDI law and
reduction in corporate tax. Figure 4 and 5 present credit availability and total assets in the
Turkish banking system. Both Figures have similar pattern with Figure 3 as expected because
of using accumulated data and expected positive linkage between FBP and these variables.
Figure 6 shows profitability in the Turkish banking sector from 1994 to 2009, based on
quarterly data. Such variable, in general fluctuated between 1 % and 3 %, except 1994
(economic crisis period) and from Q3 2000 to Q2 2002 (when banking and economic crisis
were erupted).

144 | P a g e
Figure 3: Total Assets of Foreign Banks (US Billion $)
Source: The Bank Association of Turkey
Figure 4: Total Credit in the Banking Sector (US Billion $)
Source: The Bank Association of Turkey
0
10
20
30
40
50
60
70
80
1994 1996 1998 2000 2002 2004 2006 2008
0
50
100
150
200
250
1994 1996 1998 2000 2002 2004 2006 2008

145 | P a g e
Figure 5: Total Assets in the Banking Sector (US Billion $)
Source: The Bank Association of Turkey
Figure 6: Return on Assets in the Banking Sector
Source: The Bank Association of Turkey
0
100
200
300
400
500
600
1994 1996 1998 2000 2002 2004 2006 2008
-4
-3
-2
-1
0
1
2
3
4
1994 1996 1998 2000 2002 2004 2006 2008

146 | P a g e
4.5 Methodology
Although numerous numbers of papers investigated either determinant or impact of foreign
bank penetration in developed or developing markets in the short run as explained in the
section 4.3.1, 4.3.2 and 4.3.3, the long run linkage between foreign bank penetrations and
banking variables has not been explored. What is well known is that governments have been
motivated by positive impacts of foreign capital on their markets. However, dynamic
relationship – in short run and in long run – has not been investigated using same data set. It
is important for academicians and politicians to know the short run and long run relationship
between foreign bank assets and bank variables to have comprehensive view about the
concept. Therefore, this paper is likely to open new debate on this subject, not only in the
Turkish banking system. In this empirical study, I tested the short run and long run
relationship, if it exits, between foreign bank penetration and determinants of bank
performance (namely, total bank assets, domestic credit and banking profitability) in Turkey),
while controlling DGDP and 2001 financial crisis. The first step is to determine whether the
variables have a unit root or not. The early paper – Dickey and Fuller (1979)42
- investigates
how to test unit root in the time series variables. Then, Phillips and Perron (1988) develop
another unit root test which is called PP unit root test. The main difference between the ADF
and PP tests arises in a case of heteroskedasticity and serial correlation. The results of these
tests may be significantly different because of different ways to correct serial correlation
when the sample size is finite. Moreover, the PP and ADF tests have low power when AR
root is close to 1 (Cochrane, 1991). Thus, the alternative hypothesis may be accepted wrongly
when the sample size is small (DeJong et al., 1992). The conventional PP and ADF tests are
still the most popular unit root tests in macroeconomic and financial modelling despite these
42
Dickey and Fuller (1979) are advice to the readers for more details about the concept.

147 | P a g e
weaknesses of such tests. However, as suggested by Zivot and Wang (2005), to overcome
these problems, more efficient unit root tests - Ng-Perron (2001) and ERS point optimal
(1996) - were used to detect whether the banking variables have unit root, in other words, are
non-stationary. The fluctuation of time series data around a trend or an intercept reflects
stationarity of time series. The nature of time series data treats as a non-stationary time series
because of trending, wandering around an intercept and wandering around a trend. Another
problem in the unit root tests appears in a case of break. Perron (1989, pp. 1) underlined that
“standard tests of the unit root hypothesis against trend stationary alternatives cannot reject
the unit root hypothesis if the true data generating mechanism is that of stationary
fluctuations around a trend function which contains a one-time break”. In other words, Perron
(1989) argued that although a time series variable is I(0), the result of unit root tests may
indicates that such variable is I(1) if there is a break in trending data (see, Perron, 1989).
Thus, stationarity processes with breaks are easily mistaken from unit root processes.
The PP test of Perron and Ng (1996) was developed by Ng and Perron (2001) using the GLS
detrending procedure of ERS. The unit root test is constructed by four test statistics which are
MZα, MZt, MSB, and MPT. In my models, only MZα test statistic was employed and its
results are shown in Table 19. The MZα test statistic is defined as; MZα = (T-1
( )
2- f0)/(2K)
where K=∑
, the statistics MZα is a more effective version of Zα of the PP in
terms of size and power.
Another unit root test that is used in this paper is the ERS point optimum. The latter, was
developed by Elliott et al. (1996), and is based on the quasi-differencing regression which is
defined as; d (vt|a) = d (zt|a)‟ʯ (a) +et; where d (vt|a) and d (zt|a) are quasi- differenced data
for vt and zt, respectively. Moreover, et is the residual term and ʯ (a) is the coefficient to be

148 | P a g e
estimated in the quasi-differencing regression. While the null hypothesis tested is α =1, the
alternative hypothesis tested is α= ā where ā = 1-7/T when zt contains only a constant, and
ā=1-13.5/T when zt contains both a constant and a trend. The test statistic in the ERS point
optimum to test Ho is defined as; PT = (SSR (ā) – (ā) SSR (1)) / fo where fo, at frequency zero,
is an estimator for the error spectrum.
The lag length specification is another important issue for macroeconometric and financial
modelling. In the literature, there is no criterion that gives perfectly consistent result better
than others. Schwarz (SC) and Akaike (AIC) information criterions are widely used
information criterions in the macroeconometric and financial modelling. To select optimal lag
for my models, the VAR Lag Order Selection Criteria was applied to determine specific lag
for the models. SC, AIC, Hannan-Quinn (HQ) information criterions, final prediction error
(FPE) and sequential modified LR test statistics (LR) were employed to select optimal lag43
.
It is no surprise to have multiple optimal lags for the models using 5 different information
criterions. My decision was made based on the most appropriate optimal lag for the VAR
models where there was no autocorrelation, no serial correlation and no heteroskedasticity.
Therefore, different lags for the VAR models were selected based on different information
criterions.
Once it is found that the time series variables are at the same integration order I (1), the next
step is to check for the variables whether there is a cointegration relationship(s) (or
equilibrium(s)) among the variables in the long run or not. As suggested by Johansen (1988),
Johansen and Juselius (1990), and Johansen (1996), the Johansen cointegration test is
performed for I (1) variables in order to determine whether cointegration exists among the
43
See Akaike (1976), Schwarz (1978), Hannan and Quinn (1979), and Tong (1979) for details about the
information criterions.

149 | P a g e
variables using the trace and maximum eigenvalue tests. It is worthy to mention that the 3rd
model of Johansen cointegration test for the models were preferred following the suggestion
of Johansen (1991). The 3rd
model allows linear deterministic trends in data and includes only
the intercept.
This paper also employed the VAR based the Granger causality test, which is also called
block exogeneity wald test, to investigate causal relationship in the short run between foreign
bank penetration and determinants of bank performance, namely DDB, DCREDIT and PRO.
The Granger causality is a test to find (i) whether X variable Granger causes the Y variable
and (ii) whether Y variable Granger causes the X variable. If the Y variable does not cause X,
the parameters of X on the lagged Y are jointly zeros (Granger, 1969). The general equation
of the VAR based Granger causality test for my models are shown below;
eq.(1);
DFBPt =β1 + ∑ + ∑
+∑
+∑
+ et
eq.(2);
DDBt =β2 + ∑ + ∑
+∑
+∑
+ et
eq.(3);
DFBPt =β3 + ∑ + ∑
+∑
+∑ + et
eq.(4);
DCREDITt =β4 + ∑ +∑
+∑
+ ∑ +et

150 | P a g e
eq.(5);
DFBPt =β5 + ∑ + ∑
+∑
+∑
+
et
eq.(6);
PROt =β6 + ∑ + ∑
+∑
+∑
+ et
Where n denotes the numbers of lag which were determined by the information criterions, β1-
6, α1-6, ∞1-6 and ρ1-6 are parameters for estimation, and et and ut are residual terms. I detect
whether there is causal relationship among the variables using the VAR Granger causality
technique. The only criteria to perform VAR Granger causality test is to have stationary
variables because if the time series variables have unit root, the wald (χ2) test statistic will be
worthless and VAR stability will not meet. Therefore, in the VAR models, the first
differences of FBP, DB, CREDIT and GDP variables were used whereas the level of the PRO
variable was used. As in the Johansen cointegration test, the same exercises were performed
to determine the optimal lag length for the VAR models. However, the sign of relationship
among the variables and how long these impacts will remain effective or change over time
cannot be investigated by the outcomes of the Granger causality test. Therefore, to get
information about this, I also performed the generalised impulse response function and
variance decomposition as suggested by Koop et al. (1996) and Pesaran and Shin (1998)44
.
The conventional impulse response (Sims, 1980) is heavily criticised due to the orthogonality
assumption. The conventional impulse response, which is based on Choleski factorization of
Vector Autoregression, is sensitive to variable order. The conventional impulse response was
developed by Pesaran and Shin (1998) and Koop et al. (1996). The developed version of
44
See, Koop et al. (1996) and Pesaran and Shin (1998) for further details about the concept.

151 | P a g e
impulse response function, is called “generalised impulse response function” in the system is
indifferent of the ordering of the variable. The effect of the X variable on the Y variable or
the effect of changing the X variable on the Y variable can be evaluated over specific time by
the impulse response function (Hill et al., 2008). In other words, the magnitude of the effect
of the innovation is investigated by the outcome of the impulse response technique (Ramirez,
2006; Pesaran and Shin, 1998). In all models, the impulse response at 5% level was accepted
as significant at a point where both the confidence bands are above or below the horizontal
line. Since the aim of this paper is to investigate the relationship between foreign bank
penetration and determinants of bank performance, in response to a shock to the X variable
by the X variable was not investigated.
Apart from the impulse response function, I applied the variance decomposition technique to
get information about the percentage of the movement in the endogenous variables that are
because of their own innovations, against innovations to the other variables. In other words,
the technique was performed to test exogeneity of the variables. Using the Monte Carlos
simulation with 1000 replications, the lower and upper error bounds in the variance
decompositions were calculated in the models.
4.6 Empirical Findings
Before performing restricted or unrestricted VAR models, the stationarity of time series
variables is detected by the Ng-Perron (Ng and Perron, 2001) and ERS Point Optimal (Elliott
et al 1996) unit root tests. The results regarding the outcome of the unit root tests are
presented in Table 19. These tests are performed to find out the order of integration for the
FBP, PRO, CREDIT, and DB variables. For the first variable - FBP -, integration of order

152 | P a g e
zero I (0) is not found because the calculated Ng-Perron MZα test statistics which are 1.773
(the model with an intercept) and -2.392 (the model with a trend and an intercept) are greater
than 5% critical values of -8.10 (the model with an intercept) and -17.30 (the model with a
trend and an intercept), respectively. The results of the ERS point optimum test are in line
with the results of the Ng-Perron in terms of FBP in both cases; (1) the model with an
intercept and (2) the model with an intercept and a trend. Therefore, the variable has unit root
at the integration of zero order. In other words, the variable has a higher integration order. At
the first difference, I (1) of FBP, all test statistics (the model with an intercept and the model
with a trend and an intercept) are less than its critical values at 1% and 5% levels. Thus, the
null hypothesis cannot be rejected and the variable is integrated of order 1. Regarding DB and
CREDIT variables, Table 19 indicates that the variables are integrated of order 1. This is
literal because of the behaviours and trends of these variables45
. The time series data of DB,
CREDIT and FBP wanders around a trend and this is one of the main indicators of non-
stationary time series. This is due to using the accumulated foreign bank assets, accumulated
domestic bank assets and total domestic credit. With respect to PRO variable, the result is
complex, because although the calculated Ng-Perron test statistic (the model with an
intercept) and the calculated ERS– Point Optimal test statistics (the model with an intercept
and the model with a trend and an intercept) indicate that the variable has unit root, the
calculated Ng-Perron test statistic (the model with an intercept) is -3.968 which is greater
than 5% critical values of -8.10. However, I accepted the PRO variable as stationary after
examining its trend over time since the time series data of PRO clearly fluctuates around an
intercept. Consequently, whilst FBP, DB, and CREDIT variables were I (1), the PRO variable
was accepted I (0). It is worthy to mention that the findings in MZα are in line with other test
45
The nature of time series data treats as a non-stationary time series because of trending, wandering around an
intercept and wandering around a trend while the fluctuation of time series data around a trend or an intercept
reflects stationarity of time series.

153 | P a g e
statistics of Ng Perron (2001). Therefore, in the VAR models, the first differences of FBP,
DB, and CREDIT variables were used while the level of PRO was performed.
Table 19: Unit Root Test for the Variables of FBP, PRO, CREDIT and DB
Ng-Perron (MZα) a ERS Point Optimal
b
C C & T C C & T
FBP 1.773 -2.392 81.944 38.850
DFBP -22.880** -33.478** 0.747** 2.685**
PRO -3.968 -24.825** 1.533** 3.739**
DPRO N.A N.A N.A. N.A.
CREDIT 0.713 -4.314 29.876 25.459
DCREDIT -28.157** -28.889** 0.882** 3.244**
DB 1.827 5.377 143.11 20.113
DDB -31.526** -31.940** 0.814** 2.913**
Note: C and C&T denote constant and constant and trend, respectively. D initial letter
denotes the first difference of time series variables. The integration order for the logged
GDP is one using ERS Point Optimal and KPSS tests. The finding regarding GDP is not
shown in Table 19 because the aim of the paper only investigates relationship between the
banking variables and the variable used as a control variable.
**, *, and y denote statistically significant at 0.01, 0.05, and 0.10 levels, respectively.
a including only constant, one-sided test of the Ho that the variable has unit root; critical
values are equal to -5.70, -8.10, and -13.80 at 10%, 5%, and 1% levels, respectively a
including a constant and a trend, one-sided test of the Ho that the variable has unit root;
critical values are equal to -14.20, -17.30, and -23.80 at 10%, 5%, and 1% levels,
respectively b
including only constant, one-sided test of the Ho that the variable has unit root; critical
values are equal to, 4.008, 3.023, 1.900 at 10%, 5%, and 1% levels, respectively b
including a constant and a trend, one-sided test of the Ho that the variable has unit root;
critical values are equal to 6.777, 5.689, 4.235 at 10%, 5%, and 1% levels, respectively
The next step is to check for the time series variables whether there is a cointegration
relationship(s) (or equilibrium(s)) among the variables in the long run or not46
. For the
Johansen cointegration test, the optimal lag length - lag (4) - for the first model, where I
investigate relationship between DDB and DFBP, was determined by LR, FPE and AIC
46
Granger (1988), Johansen (1988), Kunst and Neusser (1990), Johansen and Juselius (1990), and Johansen
(1996) are recommended to the readers for more details about the cointegration test.

154 | P a g e
information criterions. Both the trace and maximum eigenvalue tests in the first model
indicate that the null hypothesis of the no cointegration between DFBP and DDB cannot be
rejected at 5% level. Therefore, I could not detect any long run relationship between foreign
bank penetration and domestic bank assets. The situation is not different in a case of model 2
where I investigate relationship between DFBP and DCREDIT. Hence, there is no
cointegration equation between foreign bank penetration and domestic credit. This is a
surprising result because the importance of credit availability on foreign bank penetration
cannot be underestimated in a host market and vice versa. Even, in the cointegration models,
control variables are not being added and still there is no cointegration equation in model 1
and 2. This may be appeared because such variables are not truly integration of order 1. As
Perron (1989) argued, stationarity processes with breaks are easily mistaken from unit root
processes. Therefore, although a time series variable is I(0), the result of unit root tests may
indicates that such variable is I(1) if there is a break in trending data (see, Perron, 1989).
After investigating the pattern of CREDIT and DB variables over time, it is obvious to find a
break in 2001 when the financial crisis erupted in Turkey. However, I am proceeding with the
estimation assuming the data are integrated I(1) processes and this is an approximation for
stationary processes with multiple breaks. Therefore, the variables, like CREDIT and DB, are
assumed I(1) in all models.

155 | P a g e
Table 20: Johansen Cointegration Test
Unrestricted Cointegration Rank Test (Trace and Maximum Eigenvalue)
Model 1. Lag(1)
Hypothesized Eigenvalue Trace 0.05 Max-Eigen 0.05
No. of CE(s) Statistic
Critical
Value Statistic
Critical
Value
None 0.108 7.401 15.494 7.36 14.264
At most 1 0.000 0.037 3.841 0.03 3.841
Model 2. Lag(2)
Hypothesized Eigenvalue Trace 0.05 Max-Eigen 0.05
No. of CE(s) Statistic
Critical
Value Statistic
Critical
Value
None 0.115 8.010 15.494 7.994 14.264
At most 1 0.000 0.015 3.841 0.015 3.841
Note: Trace and Max-eigenvalue tests indicate no cointegrating equation in all models
at 0.05 level. The first differences of FBP, DB, and CREDIT variables were used while
the level of PRO was performed.
* denotes rejection of the hypothesis at the 0.05 level.
**MacKinnon-Haug-Michelis (1999) p-values.
This paper employed the VAR based Granger causality test to investigate the short run causal
relationships between foreign bank penetration and banking variables, while controlling
DGDP and 2001 financial crisis. The results regarding short run causal relationships
presented in Table 21 are based on Chi-sq. In the first model, I test whether DFBP Granger
cause DDB and (ii) whether DDB Granger cause DFBP. The null hypothesis that DFBP does
not Granger cause DDB cannot be rejected with a χ2
= 1.474 (p-value = 0.688)47
. This implies
that changes in foreign bank penetration do not significantly lead to changes in domestic bank
assets. This is probably due to the dominancy of domestic banks in the banking sector in
Turkey. The share of foreign bank assets in the banking sector has not exceeded 18%.
47
The optimal lag length – lag (1) – of the first model was determined by LR, FPE and AIC information
criterions because the optimal lag length of other information criterions led to serial correlation and/or
autocorrelation. For the second and third models, the same procedures were followed to determine the optimal
lag length for the VAR models.

156 | P a g e
Therefore, the dominancy of domestic banks in the banking sector is likely to minimize any
reaction of them against foreign bank penetration to the market. Moreover, the result of the
first model in Table 21 also shows that DDB Granger cause DFBP at 10% level with a χ2
=
2.889 (p-value=0.089). The results also suggest that at 10% level there is unilateral causality
which runs from DDB to DFBP, which implies that the changes in domestic bank assets
significantly lead to changes in foreign bank penetration. As expected, the reaction of foreign
banks against possible changes in a host country is more certain and quick than that of
domestic banks because foreign banks are relatively more sensitive in case of unexpected
changes in the market.
Table 21 shows the existence of causality from DCREDIT to DFBP with a χ2
= 11.848 and
from DFBP to DCREDIT with a χ2
= 6.31248
. Thus, there is bilateral or feedback causality
between DCREDIT and DFBP at 5% level. In other words, foreign bank penetration leads to
change in domestic credit availability, and vice versa. To find bilateral causality in the second
model among the variables is not surprising, because foreign banks contribute to the credit
availability of host countries either direct by providing credits to the domestic sectors or
indirect by affecting the credit availability of domestic banks to the domestic market.
On the other hand, I could not, surprisingly, detect any causal relationship between PRO and
DFBP at 5% level in Turkey. The lack of causality from foreign bank penetration to banking
profitability is not consistent with pervious empirical findings. This is because rising foreign
bank assets in Turkey were not associated with a higher number of banks.
48
In the second model, all information criterions gave same optimal lag length which is lag (2). It is worth
mentioning that this estimates the joint effects of DFBPt-1 and DFBPt-2 on DCREDIT.

157 | P a g e
However, the results of the Granger casualty test cannot answer the questions of the sign of
relationship in all models and how long possible impacts will remain effective or change over
time. To answer these questions for my models, I apply the generalised impulse function and
variance decomposition techniques, controlling DGDP and periodic dummy (DUM2001)
variables. Figures 7 to 12 report the response of banking variables to a shock to the foreign
bank penetration, and vice versa. Since the aim of this paper is to investigate the relationship
between foreign bank penetration and banking variables, in response to a shock to the X
variable by the X variable was not investigated.
Table 21: VAR Based Granger Casualty (Block Exogeneity Wald Test)
Independent Granger Dependent DoF χ2
P-value Decision
variable cause variable
5% level 10% level
Model 1 DDB DFBP 1 2.887 0.089 X √
DFBP DDB 1 1.474 0.688 X X
Model 2 DCREDIT DFBP 2 11.848 0.003 √ √
DFBP DCREDIT 2 6.312 0.042 √ √
Model 3 PRO DFBP 2 2.814 0.244 X X
DFBP PRO 2 1.873 0.391 X X
Note: indicates the direction of Granger causality while DoF and χ2 denote the degree of freedom and
Chi-sq, respectively. The first differences of FBP, DB, and CREDIT variables were used while the level
of PRO was performed. Since the aim of this paper is to investigate the relationship between DFBP and
banking variables (namely DDB, DCREDIT and PRO), the findings between banking variables and
control variables and the findings between DFBP and control variables are not presented in Table 21.

158 | P a g e
-.08
-.06
-.04
-.02
.00
.02
.04
.06
.08
1 2 3 4 5 6 7 8 9 10 11 12
-.10
-.05
.00
.05
.10
.15
.20
1 2 3 4 5 6 7 8 9 10 11 12
-.08
-.06
-.04
-.02
.00
.02
.04
.06
.08
1 2 3 4 5 6 7 8 9 10 11 12
Response to Generalized One S.D. Innovations ± 2 S.E.
Figure 7: Response of DDB to DFBP
Figure 8: Response of DFBP to DDB
Figure 9: Response of DCREDIT to DFBP

159 | P a g e
-.10
-.05
.00
.05
.10
.15
.20
1 2 3 4 5 6 7 8 9 10 11 12
-0.4
-0.2
0.0
0.2
0.4
0.6
0.8
1.0
1.2
1 2 3 4 5 6 7 8 9 10 11 12
-.10
-.05
.00
.05
.10
.15
.20
1 2 3 4 5 6 7 8 9 10 11 12
Figure 10: Response of DFBP to DCREDIT
Figure 11: Response of PRO to DFBP
Figure 12: Response of DFBP to PRO

160 | P a g e
Using a twelve quarter period, the study also investigated the likely effects of shocks to the
variables within twelve quarters. Figure 7 illustrates that in response to initial shock to DDB
by DFBP is positive and significant but the effect of shocks dies away after the 2nd
period.
The effects of shocks in both figures are consistent with the cointegration results because the
effects of shocks die away after the 2nd
quarter. Thus, in Turkey, rising domestic bank assets
contribute to foreign bank penetration in the short run. The result of variance decomposition
in case of model 1 shows that shock to DFBP is influenced by DDB (14.475%) at 12 quarter
period. On the other hand, DDB appears more independent and the shock to DB, thus, only
accounts for 8.471% of variation in DFBP after controlling DGDP and 2001 financial crisis.
Table 22: Variance Decomposition
Model 1
Variance Decomposition of DDB: Variance Decomposition of DFBP:
Period DDB DFBP Period DDB DFBP
1 56.225 7.675 1 11.055 80.982
6 54.130 8.478 6 14.482 76.861
12 54.087 8.471 12 14.475 76.819
Model 2
Variance Decomposition of DCREDIT Variance Decomposition of DFBP:
Period DCREDIT DFBP Period DCREDIT DFBP
1 69.668 17.698 1 11.538 81.033
6 44.083 18.104 6 16.553 65.257
12 42.944 17.669 12 16.484 64.734
Model 3
Variance Decomposition of PRO: Variance Decomposition of DFBP:
Period PRO DFBP Period PRO DFBP
1 93.638 3.590 1 3.234 84.359
6 93.434 2.225 6 11.846 74.656
12 92.799 2.346 12 12.177 75.050
Note: Cholesky Ordering: DFBP DDB DCREDIT PRO. Since the aim of this
paper is to investigate the relationship between DFBP and banking variables
(namely DDB, DCREDIT and PRO), the possible impacts of control variables on
the banking variables and DFBP and the reverse impacts are not presented in
Table 22.
Standard Errors: Monte Carlo (1000 repetitions)

161 | P a g e
Figure 8 shows that the reverse line is initially significant and positive. Therefore, rising
foreign bank penetration in Turkey leads to an increase of domestic bank assets in Turkey.
This is in line with the finding of Engwall et al. (2001). However, the significant shock dies
away after the 1st period.
In the second model, the effect of a positive shock in DFBP is significantly positive for
DCREDIT at 1st and 3
rd quarter periods, suggesting that the available domestic credit in the
market has positive impact on the foreign bank penetration but just for the short run.
Regarding variance decomposition in the second model, whereas the shock to DCREDIT is
accounted for 17.669% of variation in DFBP, the shock to DFBP is explained by DCREDIT
(16.484%) at the end of the 12 quarter period after controlling DGDP and 2001 financial
crisis. The initial reverse response is significant and positive in Figure 9, implying that the
foreign banks are important for domestic credit in the short run in Turkey. Therefore, rising
foreign bank assets in the banking sector are associated with higher credit availability to the
domestic market49
. This is consistent with the findings of Goldberg et al. (2000) and Clarke
(2006). On the other hand, the figure also shows that the effect of shocks takes 3rd
quarter to
disappear.
In terms of the profitability in the banking sector, the findings are quite interesting; Figure 12
shows that the response of DFBP to one standard deviation shock in PRO is initially positive
but not statistically significant. The response is only significant in 3rd
quarter. The result is
not consistent with the existing literature because Okuda and Rungsomboon (2004), Denizer
(2000), Zajc (2002) Claessens et al. (2001) conclude that rising foreign assets in the banking
sector tends to reduce host banking profitability. However, in Turkey, rising foreign bank
49
Apart from actual foreign credit to the domestic market, rising foreign bank penetration in a host country
might also force domestic banks to increase domestic credit in order to be competitive against the foreign banks.

162 | P a g e
assets are not mostly associated with higher numbers of banks in the banking sector
especially throughout the last two decades. 20 foreign banks were running business in Turkey
at the end of 1992 where the total asset of these banks in the banking sector was US$ 2.37
billion. However, the total asset of these banks jumped US$ 75.09 billion at the end of 2009
even though the number of foreign banks in Turkey declined to 17. These numbers indicate
that although there was a substantial jump in the foreign bank assets in Turkey, the number of
foreign banks that operate in Turkey declined. Moreover, the total number of banks in Turkey
also declined from 69 in 1992 to 62 in 2009. Therefore, rising foreign assets in the banking
sector was not associated with higher competition. Therefore, it is literal that rising foreign
assets in Turkey are likely to increase profitability due to declining competition in the
banking sector. The reverse effect is not statistically significant at 1st quarter. For the banking
profitability, the contribution of DFBP to PRO variability ranges between 2.225% and
3.590% throughout 12 quarter periods. With respect to PRO, DFBP accounts for 3.234% and
12.177% of its future variability.
As a part of the diagnostic tests, I applied the numbers of diagnostic tests, such as serial
correlation LM, "portmanteau" test of Ljung and Box and VAR residual heteroskedasticity, to
test the stability of the VAR models. My evidences, presented in Table 23 to 24 in the
appendix, show that there is no heteroskedasticity, no autocorrelation, and no serial
correlation in my models. In addition, the inverse roots of AR characteristic polynomial were
performed to detect the stability of the VAR models and the results of this test are presented
in Figure 13 in the appendix. The findings in Figure 13 are found to be satisfactory for all
models.

163 | P a g e
4.7 Conclusion
The study, using a VAR techniques and the Johansen co-integration test, examined the short
run and long run dynamic relations between DFBP and determinants of bank performance,
namely domestic bank assets, profitability and total domestic credit), while controlling
DGDP and 2001 financial crisis. The time series variables are based on quarterly data from
1992Q4 to 2009Q4. To detect whether the time series variables have unit root or not, I
performed newly developed and efficient unit root tests - Ng-Perron and ERS point optimal -.
The results of such tests showed that whilst FBP, DB and CREDIT variables are integrated of
order 1, the PRO variable is I (0). Thus, I checked the long run relationship between DFBP
and DDB and between DFBP and DCREDIT using the Johansen cointegration test. However,
I could not detect any long run relationship in the first and second models using the trace and
maximum eigenvalue tests.
In the first model, I found that there is unilateral causality which runs from DDB to DFBP at
10% level. Moreover, in response to initial shock to DFBP by DDB is significantly positive.
Therefore, rising domestic bank assets in Turkey tends to contribute positively to foreign
bank penetration. The reverse line initially is positive and significant as well. Such result in
the reverse line is in line with the finding of Engwall et al. (2001). However, Engwall et al.
(2001) investigated only one way impact – from foreign bank assets to domestic bank assets
in the Nordic countries. In addition, my finding also reveals that domestic bank assets in
model 1 appear more exogenous than foreign bank assets.
164 | P a g e
The result regarding block exogeneity wald test also indicates for the second model that there
is bilateral causality between DFBP and DCREDIT. By analysing the impulse response
function, foreign bank penetration is important for credit availability in Turkey in the short
run. This finding is consistent with the finding of Clarke (2006). The reverse line is positive
and significant at 1st and 3
rd quarter periods, suggesting that available domestic credit in the
market has positive impact on foreign bank penetration. This direction of a positive impact is
also consistent with the existing literature and rational because it is well-known that financial
development is an important factor to attract foreign banks to host markets. Table 22 shows
that foreign bank penetration appears more independent than domestic credit in model 2.
Regarding the relationship between profitability in the banking sector and foreign bank
penetration, my findings are quite interesting. The Granger causality test in Table 21 showed
that although no causal relationship between DFBP and PRO was detected at 5% and 10%
levels. More interestingly, the response of DFBP to one standard deviation shock in PRO is
initially statistically significant and positive at 3rd
quarter. Such a finding is not in line with
the existing literature because rising foreign bank assets in a host market tends to reduce
profitability because of increasing competition as a result of an increase in the number of
banks in the same market but in Turkey this situation is different. Although foreign bank
assets have significantly risen since the beginning of globalisation period, the number of
foreign banks and domestic banks has declined because of mergers and acquisitions. The
reverse effect is also statistically significant and positive as expected. This is rational because
in common with empirical and theoretical research, profitability in a host market is main
driving factor of foreign banks. It is worth mentioning that none of the shocks in Figures 7 to
12 seem to have permanent impacts on the variables and the effect dies out within a few
quarters in all models.

165 | P a g e
4.8 References
[1] Akaike, H. (1976). "Canonical correlation analysis of time series and the use of the
information criterion. In system Identification: Advances and Case studies Editors: R. K.
Mehra and D. G. Laintiotis." New York Academic Press: 27-96.
[2] Akguc, O. (1989). "Turkish Banking System in 100 Questions" Turkish "100 Soruda
Turkiye‟de Bankacilik" Second Edition, Istanbul: Gercek Yayinevi.
[3] Arslan, Y. (1982). "Turkish Banking System (1923-1981)." Turkish "Cumhuriyet
Doneminde Turk Banka Sistemi (1923-1981)." Istanbul: Der Yayinevi.
[4] Aysan, A. F. and S. P. Ceyhan (2008). "What Determines the Banking Sector
Performance in Globalized Financial Markets? The case of Turkey."Physica A: Statistical
Mechanics and its Applications 387: 1593–1602.
[5] Bayraktar, N. and Y. Wang (2004). "Foreign Bank Entry, Performance of Domestic
Banks and the Sequence of Financial Liberalization." China Journal of Finance 2 (2).
[6] Boni, J. P., I. Hasan, et al. (2005). "Bank Performance, Efficiency and Ownership in
Transition Countries."Journal of Banking & Finance 29(1): 31-53.

166 | P a g e
[7] Brooks, C. (2002). Introductory Econometrics for Finance. Cambridge, Cambridge
University Press.
[8] Bumin, M. (2007). "The Determinants of Foreign Banks Entry to the Turkish Banking
Sector." Banks and Bank Systems 2(4): 84-92.
[9] Claessens, S., A. Demirguc-Kunt, et al. (2001). "How Does Foreign Entry Affect
Domestic Banking Markets?." Journal of Banking and Finance 25: 891–911.
[10] Claessens, S., T. Gurcanlar, et al. (2008). "Foreign Bank Presence in Developing
Countries 1995-2006: Data and Trends." Mimeo,
[11] Clarke, G. R. G., R. Cull, et al. (2006). "Foreign Bank Participation and Access to Credit
across Firms in Developing Countries” Journal of Comparative Economics 34(4): 774–795.
[12] Cochrane, J. H. (1991). "A Critique of the Application of Unit Root Tests."Journal of
Economic Dynamics and Control 15(2): 275-284.
[13] Cull, R. and M. S. M. Peria (2010). "Foreign Bank Participation in Developing
Countries ; What Do We Know about the Drivers and Consequences of This Phenomenon?"
Policy Research Working Paper WPS5398.

167 | P a g e
[14] DeJong, D. N., J. C. Nankervis, et al. (1992). "The Power Problem of Unit Root Tests in
Time Series with Autoregressive Errors."Journal of Econometrics 53(1-3): 323–343.
[15] Demir, N., S. F. Mahmud, et al. (2005). "The Technical Inefficiency Effects of Turkish
Banks After Financial Liberalization." The Developing Economies 48: 396–411.
[16] Demirguc-Kunt, A., R. Levine, et al. (1998). "Opening to Foreign Banks: Issues of
Stability, Efficiency, and Growth." in Proceedings of the Bank of Korea Conference on the
Implications of Globalization of World Financial Markets
[17] Demirguc-Kunt, A. and H. Huizinga (1999). "Determinants of Commercial Bank
Interest Margins and Profitability: Some International Evidence." World Bank Economic
Review1
[18] Denizer, C. (1998). "Foreign Entry in Turkey‟s Banking Sector:1980-1997." Mimeo,
World Bank.
[19] Denizer, C., M. Dinc, et al. (2007). "Financial Liberalization and Banking Efficiency:
Evidence from Turkey." Journal of Productivity Analysis 27: 177-195.
[20] Denizer, C. A. (2000). "Foreign Entry in Turkey‟s Banking Sector: 1980-97." the World
Bank WPNo: 2462

168 | P a g e
[21] Detragiache, E. and P. Gupta (2008). "Foreign Banks in Poor Countries: Theory and
Evidence." Journal of Finance 63(5): 2123-60
[22] Dickey, D. A. and W. Fuller (1979). "Distribution of the estimators for autoregressive
time series with a unit root."Journal of American Statistical Association 74: 427-431.
[23] Elliott, G., T. Rothenberg, et al. (1996). "Efficient Tests for an Autoregressive Unit
Root." Econometrica 64(4): 813-836.
[24] Engwall, L., R. Marquardt, et al. (2001). "Foreign Bank Penetration of Newly Opened
Markets in the Nordic Countries” Journal of International Financial Markets11: 53–63.
[25] Ertugrul, A. and O. Zaim (1999). "Economic Crises and Efficiency in Turkish Banking
Industry."METU Studies in Development 26(1-2): 99-116.
[26] Esperanca, J. P. and M. A. Gulamhussen (2001). “(Re)Testing the „Follow the
Customer‟ Hypothesis in Multinational Bank Expansion.” Journal of Multinational Financial
Management 11(3): 281-293.
[27] Focarelli, D. and A. F. Pozzolo (2005). "Where do Banks Expand Abroad? An Empirical
Analysis."Journal of Business 78(6): 2435-2464

169 | P a g e
[28] Knickerbocker, F. T. (1973). Oligopolistic Reaction and Multinational Enterprise.Boston
Harvard University.
[29] Matousek, R. and H. Fukuyama (2011). “Efficiency of Turkish Banking: Two-stage
System Variable Returns to Scale Model.”, Journal of International Financial Markets,
Institutions & Money 21(1): 71-91.
[30] Goldberg, L. G. and R. Grosse (1992). "Location Choice of Foreign Banks in the United
States."Journal of Economics and Business 46(5): 367-379
[31]Goldberg, L.G. and D. Johnson (1990). “The Determinants of US Banking Activity
Abroad.” Journal of International Money and Finance 9: 123-137.
[32] Goldberg, L. S., B. G. Dages, et al. (2000). "Foreign and Domestic Bank Participation in
Emerging Markets: Lessons from Mexico and Argentina " NBER Working PaperNo. w7714.
[33] Granger, C. W. J. (1969). “Investigating Causal Relations by Econometric Models and
Cross-spectral Methods.” Econometrica 37(3): 424–438.

170 | P a g e
[34] Granger, C. W. J. (1988). "Some Recent Developments in a Concept of Causality."
Journal of Econometrics 39(1-2): 199-211.
[35] Grosse, R. and L. Goldberg (1991). “Foreign Activity in the United States: An Analysis
by Country of Origin.” Journal of Banking and Finance 15(6): 1092-1112.
[36] Haas, R. T. A. d. and I. P. P. v. Lelyveld (2004). "Foreign Bank Penetration and Private
Sector Credit in Central and Eastern Europe "Journal of Emerging Market Finance 3(2): 125-
151.
[37] Hannan, E. J. and B. G. Quinn (1979). "The Determination of the Order of an
Autoregression." Journal of the Royal Statistical Society 41(2): 190–195.
[38] Hill, R. C., W. E. Grifiths, et al. (2008). Principles of Econometrics, John Wiley & Sons.
[39] Isik, I. and M. K. Hassan (2002). "Technical, Scale and Allocative Efficiencies of
Turkish Banking Industry." Journal of Banking and Finance 26: 719–766.
[40] Jeon, Y., S. M. Miller, et al. (2006). "Do Foreign Bank Operations Provide a Stabilizing
Influence in Korea?" The Quarterly Review of Economics and Finance 46: 82–109.

171 | P a g e
[41] Johansen, S. (1988). "Statistical Analysis of Cointegrating Vectors." Journal of
Economic Dynamics and Control 12: 231-254.
[42] Johansen, S. (1991). "Estimating and Resting Cointegration Vectors in Gaussian Vector
Autoregressive Models." Econometica 59: 1551-1580.
[43] Johansen, S. (1995). “Likelihood Based Inference in Cointegrated Vector
Autoregressive”. The Scandinavian Journal of Economics, 99(2): 351-354.
[44] Johansen, S. and K. Juselius (1990). "Maximum Likelihood Estimation and Inference on
Cointegration with Applications to the Demand for Money." Oxford Bulletin of Economics
and Statistics 52(2): 169-210
[45] Kamil, H. and K. Rai (2009). "The Global Credit Crunch and Foreign Banks„ Lending to
Emerging Markets: Why Did Latin America Fare Better?" International Monetary Fund
WP/10/102.
[46] Koop, G., M.H. Pesaran and S. Potter (1996). “Impulse Response Analysis in Nonlinear
Multivariate Models.” Journal of Econometrics 74(1):119-147

172 | P a g e
[47] Lensink, R. and N. Hermes (2004). "The Short-term Effects of Foreign Bank Entry on
Domestic Bank Behaviour: Does Economic Development Matter?" Journal of Banking and
Finance 28(3): 553–568.
[48] Lin, X. and Y. Zhang (2009). "Bank Ownership Reform and Bank Performance in
China" Journal of Banking & Finance 33(1): 20-29.
[49] Miller, S. R. and A. Parkhe (1998). “Patterns of Expansion of U.S. Banks‟ Foreign
Operations.” Journal of International Business Studies 29(2): 359-390.
[50] Morgan, D. P. and P. E. Strahan (2003). "Foreign Bank Entry and Business Volatility:
Evidence from U.S. States and Other Countries." NBER Working Paper No. w9710.
[51] Ng, S. and P. Perron (2001). "Lag Selection and the Construction of Unit Root Tests
with Good Size and Power."Econometrica69(6): 1519–1554.
[52] Ng, S. and P. Perron (2005). "A Note on the Selection of Time Series Models." Oxford
Bulletin of Economics and Statistics 67(1): 115-134.

173 | P a g e
[53] Nigh, D., Cho, K. R. and S. Krishnan (1986). “The Role of Location-Related Factors in
U.S. Banking Involvement Abroad: An Empirical Examination.” Journal of International
Business Studies 17: 59-72.
[54] Ocal, T. (1992). "Turkish Banking System." Turkish "Turk Banka Sistemi." Ankara:
Ankara Iktisadi ve Ticari Ilimler Akademisi Yayinlari.
[55] Okuda, H. and S. Rungsomboon (2004). "The Effects of Foreign Bank Entry on the Thai
Banking Market: Empirical Analysis from 1990 to 2002." CEI Working Paper Series No.
2004-20.
[56] Osman, Z. (1995). "The Effect of Financial Liberalization on the Efficiency of Turkish
Commercial Banks."Applied Financial Economics 5(4): 257–264.
[57] Ozkan-Gunay, E. N. and A. Tektas (2006). "Efficiency Analysis of the Turkish Banking
Sector in Precrisis and Crisis Period: a DEA Approach." Contemporary Economic Policy
24(3): 418–431.
[58] Parasiz, I. (2000). “Money, Banking and Finance Markets" Turkish "Para Banka ve
Finansal Piyasalar." Seventh Edition, Bursa: Ezgi Kitabevi Yayinlari.

174 | P a g e
[59] Perron, P. (1989). “The Great Crash, the Oil Price Shock, and the Unit Root Hypothsis.”
Econometrica 57(6): 1361-1401.
[60] Perron, P. and S. Ng (1996). "Useful Modifications to Unit Root Tests with Dependent
Errors and Their Local Asymptotic Properties." Review of Economic Studies 63: 435-465.
[61] Pesaran, M. H. and Y. Shin (1998). "Generalised Impulse Response Analysis in Linear
Multivariate Models." Economics Letters 58: 17-28.
[62] Ramirez, M. (2006). "Is Foreign Direct Investment Beneficial for Mexico? An Empirical
Analysis, 1960-2001." World Development 34(5): 802-817.
[63] Satta, T. A. (2004). "The Influence of Foreign Bank Entry on Lending to Small Firms in
Tanzania." The Journal of Policy Reform 7(3): 165-173.
[64] Sims, C. A. (1980), “Macroeconomics and Reality”, Econometrica 48(1):1-48
[65] Tong, H. (1979). "Final Prediction Error and Final Interpolation Error: a Paradox?"
I.E.E.E Transactions on Information Theory 25(6): 758 -759.

175 | P a g e
[66] Yeldan, A. E. (1997). “Financial Liberalization and Fiscal Repression in Turkey: Policy
Analysis in a CGE Model with Financial Markets.” Journal of Policy Modelling 19(1):79-
117.
[67] Yildirim, C. (2002). "Evolution of Banking Efficiency within an Unstable
Macroeconomic Environment: the case of Turkish Commercial Banks." Applied Economics
34(18): 2289–2301.
[68] Zajc, P. (2003). "The Effect of Foreign Bank Entry on Domestic Banks in Central and
Eastern Europe " Paper for SUERF colloquium.
[69] Zivot, E. and J. Wang (2005). Modelling Financial Time Series with S-PLUS. New
York, Springer.

176 | P a g e
4.9 Appendix
Table 23: VAR Residual Serial Correlation LM Tests
Null Hypothesis: no serial correlation at lag order h
Model 1 Model 2 Model 3
Lags
LM-
Stat Prob LM-Stat Prob
LM-
Stat Prob
1 2.964 0.563 2.157 0.706 7.212 0.125
2 0.789 0.939 0.846 0.932 2.056 0.725
3 1.563 0.815 2.113 0.714 4.104 0.392
4 2.053 0.725 1.328 0.856 8.032 0.090
5 0.198 0.995 3.790 0.435 6.240 0.181
6 2.576 0.631 3.526 0.473 4.223 0.376
7 4.268 0.370 4.683 0.321 1.157 0.885
8 7.866 0.096 4.446 0.348 6.272 0.179
9 4.066 0.397 2.902 0.574 2.232 0.693
10 1.195 0.878 0.330 0.987 5.503 0.239
11 0.051 0.999 3.980 0.408 0.466 0.976
12 0.645 0.957 0.401 0.982 1.298 0.861
Probs from chi-square with 4 df.
Table 24: VAR Residual Heteroskedasticity Tests
No cross terms (only levels and squares)
Model 1 Model 2 Model 3
Chi-sq Prob Chi-sq Prob Chi-sq Prob
35.218 0.505 30.358 0.173 7.572 0.817
Includes Cross Terms
Model 1 Model 2 Model 3
Chi-sq Prob Chi-sq Prob Chi-sq Prob
74.584 0.679 56.644 0.065 9.551 0.847

177 | P a g e
-1.5
-1.0
-0.5
0.0
0.5
1.0
1.5
-1.5 -1.0 -0.5 0.0 0.5 1.0 1.5
Model 2
-1.5
-1.0
-0.5
0.0
0.5
1.0
1.5
-1.5 -1.0 -0.5 0.0 0.5 1.0 1.5
Model 3
-1.5
-1.0
-0.5
0.0
0.5
1.0
1.5
-1.5 -1.0 -0.5 0.0 0.5 1.0 1.5
Figure 2. Inverse Roots of AR Characteristic Polynomial
Model 1
Figure 13: Inverse Roots of AR Characteristic Polynomial
Model 1
Model 2
Model 3

178 | P a g e
4.9.1 Data Appendix
This appendix describes the data source used in my empirical models. The time series
variables used in the models are shown below;
4.9.1.1 FBP
» Definition: Total assets held by foreign banks in the banking sector. Holding 50% share
acquisition by a foreign bank or foreign investor in a host country is accepted as a minimum
requirement to have an important influence on the management of acquired bank in Turkey.
In other words, acquiring 50% or more shares of domestic bank are recorded as a foreign
bank in most of the countries.
» Source: The Banks Association of Turkey (2011), the data are available at 20.12.2010
https://www.tbb.org.tr/en/banks-and-banking-sector-information/data-query-
system/financial-tables/41
» Measure: In this paper, I accepted that foreign bank penetration measured as the total value
of foreign bank assets. Because the total value of foreign bank assets holds the lion shares of
banking FDI. As I did, Grosse and Goldberg (1991) and Esperanca and Gulamhussen (2001)
are used aggregate foreign bank assets while examining the determinants of foreign bank
penetration. The variable was expressed in its logarithmic transformation.
» Period: The FBP variable used in the empirical tests of this paper consists of the quarterly
for the period 1994Q1 to 2009Q4 which includes 64 observations.

179 | P a g e
4.9.1.2 PRO
» Definition: Return on assets in the banking sector was used as a proxy for profitability in
the banking sector.
» Source: The Banks Association of Turkey (2011), the data are available at 08.09.2010
https://www.tbb.org.tr/en/banks-and-banking-sector-information/data-query-
system/financial-tables/41
» Measure: The raw data were used because some observations for the variable are negative.
» Period: The PRO variable used in the empirical tests of this paper consists of the quarterly
for the period 1994Q1 to 2009Q4 which includes 64 observations.
4.9.1.3 CREDIT
» Definition: Total domestic credit was provided by banks in Turkey.
» Source: The Banks Association of Turkey (2011), the data are available at 08.09.2010
https://www.tbb.org.tr/en/banks-and-banking-sector-information/data-query-
system/financial-tables/41
» Measure: The CREDIT variable was expressed in its logarithmic transformation.
» Period: The CREDIT variable used in the empirical tests of this paper consists of the
quarterly for the period 1994Q1 to 2009Q4 which includes 64 observations.
4.9.1.4 DB
» Definition: Total assets in the banking sector, excluding the foreign ones in Turkey.
» Source: The Banks Association of Turkey (2011), the data are available at 08.09.2010

180 | P a g e
https://www.tbb.org.tr/en/banks-and-banking-sector-information/data-query-
system/financial-tables/41
» Measure: The DB variable was expressed in its logarithmic transformation.
» Period: The DB variable used in the empirical tests of this paper consists of the quarterly
for the period 1994Q1 to 2009Q4 which includes 64 observations.
4.9.1.5 GDP
» Definition: Nominal GDP is used as a control variable since it is believed that GDP is an
important determinant of FDI, FBP and FPI. The findings of Buch (2000), Brealey and
Kaplanis (1996) and Yamori (1996) Herrero and Peria (2005) underlined that GDP in host
countries seems most important factor that affects the location decision of multinational
banks. Similar to these findings, the study of Luca and Spatafora (2012) implies that rising
GDP is associated with higher capital flows in developing countries.
» Source: the Central Bank of the Republic of Turkey (2011), the data was available at
05.08.2013
http://evds.tcmb.gov.tr/yeni/cbt-uk.html
» Measure: The GDP variable was expressed in its logarithmic transformation.
» Period: The GDP variable used in the empirical tests of this paper consists of the quarterly
for the period 1994Q1 to 2009Q4 which includes 64 observations.
4.9.1.6 DUM2001
» Definition: DUM2001 is a dummy variable and used as a control variable since I believe
that financial crisis in 2001 led to significant changes in the Turkish banking sector.

181 | P a g e
» Source: The dummy variable is generated by the author.
» Measure: The raw data were used.
» Period: The DUM2001 variable used in the empirical tests of this paper consists of the
quarterly for the period 1994Q1 to 2009Q4 which includes 64 observations.

182 | P a g e
Chapter 5: The Linkage between Foreign Bank Penetration and Host Country Risks:
The Case of Turkey
Dervis Kirikkaleli
Stirling Management School, Division of Economics, University of Stirling, FK9 4LA
Email: [email protected]
Telephone: +44 (0) 759 100 5766
5.1 Abstract
In this paper, I purpose to examine the two-way linkage between FBP and country risk
(namely, political risk, economic risk and financial risk) in Turkey using quarterly data from
1992Q4 to 2009Q4. My findings indicate that one cointegrating vector is detected between
DFBP and political risk in model 1 and between DFBP and economic risk in model 2
whereas I failed to find any long run relationship between DFBP and financial risk using the
Johansen co-integration test. I found one error correction term significant and positive in
vector error correction in model 1 and 2, implying that in the long run, foreign bank
penetration contributes to economic and political stability. Moreover, I investigated the short
run causality based on VAR approach between DFBP and financial risk but I failed to find
any significant causality in the VAR model, even at the 10% level. The results of impulse
response functions reveal that surprisingly there is no significant relationship between foreign

183 | P a g e
bank penetration and host country risk variables in the short run in Turkey while controlling
GDP and 2001 financial crisis
5.2 Introduction
Since the early 1980‟s, the perspective of host countries to foreign banks has changed
significantly. At the same time, foreign bank participation increased, initially in developed
countries, and the wave, then, spread to the developing countries due to liberalisation of
financial sectors. This wave has encouraged researchers to analyse multinational banks and
they have mostly tried to answer two questions; (i) why do banks invest abroad? And (ii)
what is the impact of multinational banks on host countries? Therefore, the impact and
determinant of foreign bank penetration in developing and developed countries have attracted
considerable attention by researchers.
In the case of country risk50
, Turkey, like other Middle Eastern countries, is in a high-risk
environment. When it comes to political and financial risk, Turkey is still a highly volatile
country despite current economic and financial developments. This is because of existing
regional instability, external problems, high inflation, and high current account deficit and so
on. The position of Turkey is relatively better concerning economic risks. However, current
economic, financial and political risk factors are not that bad compared to 1990s51
and early
2000s52
.
50
Country risk arises because of differences in economics, political, social and financial conditions between
host and home countries in general. 51
As a result of internal crisis (economic crisis in 1994) and external crises (Gulf crisis in 1991, East Asian
crisis in 1997, Latin America in 1998, and Russian crisis in 1999), Turkey was been in the very high risky
environment. 52
Turkey also experienced banking crisis in November 2000 and economic crisis in February in 2001 .

184 | P a g e
In Turkey, after the banking and economic crises of the early 2000‟s, financial globalisation
has accelerated and the importance of banking sector in the economy substantially increased
from 2005 to 2009. The ratio of the total banking assets to gross national product (GNP) in
2005 increased from 67% (US$ 300 billion) to 82% (US$ 536 billion) in 2009. Achieving
macroeconomic stability, the acceleration of reforms especially in the financial sector - the
foundation of the Coordination Council and Investment Advisory Council, new FDI law
(No.6224) - and the reduction in corporate tax have contributed to the high growth rate in
banking sector in Turkey, except the global crisis period (4th
quarter of 2008 and 1st quarter of
2009). Consistent with this process, multinational bank activities have increased in Turkey.
The share of bank assets held by the foreign banks in Turkey has jumped from US$ 8.15
billion (3.50% of the total banking assets) in 2005Q1 to US$ 84.24 billion (13.72% of the
total banking assets) in 2010Q353
. These numbers clearly show how Turkey attracted foreign
banks interest despite the current global crisis. There is, however, little empirical literature for
foreign banks in Turkey despite this current pattern. Specifically, what has not been
investigated in detail is the two-way linkage between foreign bank penetration and host
country risks in the empirical literature. My main aim is to reveal such a link using a bivariate
Vector Error Correction (VEC) and Vector Autoregression (VAR) models.
My findings indicate that there is a cointegrating equilibrium in model 1 and 2 while I could
not detect any long run relationship in model 3 using the Johansen cointegration test. In
Turkey, foreign bank penetration has significant impact on economic and political risk in the
long run. However, I failed to find any short run causality between foreign bank penetration
and financial risk in model 3. By analysing impulse response functions, my findings also
53
The ratios are calculated by the author. However, the raw data of total assets and GDP are collected from the
Bank Association of Turkey and the Central Bank of Republic of Turkey database.

185 | P a g e
reveal that; (i) there is a negative relationship between political risk and foreign bank
penetration; (ii) In model 2, rising foreign bank penetration is associated with less economic
risk and the reverse effect, but, is close to zero throughout 12 quarters; (iii) finally, no
relationship between foreign bank penetration and financial risk is observed.
This study is organised as follows. Section 5.3 provides existing literature on the concept.
Section 5.4 presents the data and empirical methodology that is used in this study,
respectively. Section 5.5 reports the empirical findings from the time series models. Lastly,
conclusions are presented in section 5.6.
5.3 Literature Review
Country risk simply refers to unanticipated vulnerability in one or a combination of political,
economic and financial risks that occur either by host country enterprises or host country
government (Erb et al., 1996)54
. This clearly mirrors how the performance, policies and
implementation of host country governments are of importance in attracting foreign
investment. Country risk is likely to affect the location choice of multinational banks because
the return and the future of the investment of multinational banks partially depend on these
factors. Whilst some researchers have found a significant negative effect of rising country
risk – or any sub country risk factor- on multinational bank penetration in host countries,
others have failed to find any impact of such risk on the location choice of multinational
banks.
54
However, investing abroad is also diversifying across markets and lending patterns and so reducing other
risks. There may be a reduction in total risk or the returns may outweigh the increased risk.

186 | P a g e
On the one hand, foreign bank participation to the host market is likely to affect political,
economic and financial stability, especially in developing countries where sectors are not
well developed. This is the most important issue for governments because the reason behind
the attraction of multinational banks is its positive impacts to the host market. However,
existing theoretical and empirical findings about the impact of multinational banks on
economic and financial stability is very limited. Moreover, the impact of foreign banks on
political stability in the host countries has not been explored, deeply. To fill this gap and to
identify the impact of country risk factors on foreign bank penetration in Turkey, I investigate
the two-way linkage between country risk – political, economic and financial risks, – and
foreign bank penetration.
5.3.1 Political Risk and Foreign Bank
Hypothesis 1 considers that there is a significant linkage between political stability and
foreign bank penetration. Political risk, one of the important sub elements of country risk,
includes government stability, bureaucratic quality, internal and external conflicts, ethnic
problems and so on. Some empirical papers - Root and Ahmed (1979), Wheeler and Mody
(1992), Loree and Guisinger (1995), Jun and Singh (1996), and Ngowi (2001) - underline the
importance of the political risk for multinational companies. It is clear that unexpected
changes in one of the political risk factors are likely to affect the investment decision of
multinational banks. Apart from that, substantially rising foreign bank participation or
possible dominancy of foreign banks in a host country may affect political stability, either
positively or negatively.

187 | P a g e
Papaioannou (2005) investigates the location decision of multination banks in 19 countries
using quarterly data from 1984 to 2002. His study reveals that although financial, economic,
and political risks have a significant impact on multinational bank penetration, political risk is
found to be the most significant one. Such risk influences more than 50% of the variability in
foreign bank flows. Furthermore, while EU law harmonisation, size and institution quality
have a significant positive impact on the location decision of foreign banks, corruption and
distance have negative and significant effects. Similar to the findings of Papaioannou (2005),
country risk is observed to have a significant and negative impact on the location choice of
German multinational banks by Wezel (2004), Goldberg and Grosse (1994), Focarelli and
Pozzolo (2000) and Barth et al. (2004). They also argue that foreign banks are likely to invest
in a country where restrictions on foreign bank penetration are low. Moreover, Barth (2001)
points out that using strict regulation for foreign banks in a host country is likely to trigger
banking crises. Contrary to these empirical evidences, García-Herrero and Peria (2005) fail to
find any significant effect of country risk on foreign bank penetration. Consistent with
García-Herrero and Peria (2005), the impact of country risk has not been found to be a
significant factor for the location decision of foreign banks in Italy by Magri et al. (2004).
Therefore, these findings in this section do not provide clear picture about the impact of
political instability on the location choice of multinational banks.
Although numerous papers investigate whether or not political risk is a significant factor
influencing the investment of multinational banks, the impact of foreign banks on political
stability in the host countries has not been explored in depth. What we know is that
multinational banks are likely to affect the political environment especially in developing
countries. This effect is likely to change from one country to another based on economic,

188 | P a g e
social, and political developments of host market and also based on the share of the foreign
banks in the banking system.
Hypothesis 1: There is a significant linkage between political stability and foreign bank
penetration.
5.3.2 Economic Risk and Foreign Bank
Similar to Hypothesis 1, Hypothesis 2 considers that the impact of foreign bank penetration
on economic stability is positive and the reverse impact is also positive. Simply, economic
risk arises from unexpected changes in economic variables (such as economic growth, GDP
per capita, interest rates, trade and so on) or a change in a host country‟s comparative
advantage. Such risk is another important element of country risk. In an early study Goldberg
and Saunders (1980) examine the determinant of US multinational banks in the United
Kingdom. They find that whereas the exchange rate and interest rate are not important
variables to explain location choice of US multinational banks, US trade contributes
extension of US multinational banks.
The findings of Buch (2000) indicate that there is a positive and significant linkage between
foreign banks‟ FDI and per capital GDP55
. In addition, Brealey and Kaplanis (1996) and
Yamori (1996) also try to explain the investment decision of foreign banks and they conclude
that per capital GDP in host countries seems most important factor that affects the location
decision of multinational banks. Similar to Brealey and Kaplanis (1996) and Yamori (1996),
Herrero and Peria (2005) aim to answer the question of how US, Italian and Spanish banks
55
The study of Buch (2000) is based on German multinational banks.

189 | P a g e
decide their worldwide location? Their study implies that rising GDP is associated with
higher foreign bank penetration. However, inflation, which is another economic variable, had
no significant impact on the location decision of multinational bank.
Hypothesis 2: Rising economic stability is associated with increasing foreign bank assets and
vice versa.
5.3.3 Financial Risk and Foreign Bank
Hypothesis 3 is related to financial risk. The hypothesis asserts that there is positive linkage
between financial stability and foreign bank penetration. Financial risk - another important
element of country risk - involves foreign debt, current account deficits, exchange rate and
liquidity in general. The result of recent empirical and theoretical studies is complex about
the effect of foreign bank penetration on financial stability. Ankara Chamber of Commerce
report (2006) argues that rising profit transfers in a host market increases the foreign deficit
of host market. Therefore, financial stability may be affected negatively due to profit transfer
of foreign banks. Moreover, the participation of foreign banks in a market is likely to increase
competition in the banking sector. According to Mathieson and Schinasi (2000) and Jeon et
al. (2006), competition makes domestic banking sector weaker and reduces the quality of
domestic banks‟ assets.
However, the study of Haas and van Lelyveld (2003) empirically proves that rising foreign
bank penetration in Central and Eastern European counties was associated with higher credit
supply, even throughout the crisis period. Therefore, foreign bank penetration has contributed
to most importation element of financial development which is credit availability. In line with

190 | P a g e
the finding of Hass and van Lelyveld (2003), Clarke (2006) points out that domestic credit is
positively affected by foreign bank penetration56
. However, his finding also mirrors that the
contribution of foreign banks to credit provision for small and medium companies is less than
that of domestic banks. However, the findings of Satta (2004) show that foreign banks in
Tanzania do not have a significant effect on the credit availability. Lee (2002) performs
econometric model to examine the effect of foreign bank participation and financial
liberalisation on financial development and competitiveness using 1157 commercial banks in
45 Middle East and North Africa countries (MENA). He reveals that foreign bank
penetration in MENA countries are positively affected by financial development.
Lee (2003) examines the location decision of foreign banks in Korea and his findings reveal
that not only economic development but also financial development plays an important role
in attracting foreign banks to invest in Korea after the Asian crisis. Moreover, a recent study -
Hayakawa et al. (2011) – specifically underlines the importance of exchange rate stability for
multinational companies57
.
Hypothesis 3: The impact of financial stability on foreign bank penetration is positive and the
reverse impact is also positive.
5.4 Data and Methodology
The time series variables used in the empirical tests of this study consists of quarterly data for
the period 1994Q1 to 2009Q4 which includes 64 observations. The time series data used in
56
Clarke (2006) investigates the effect of foreign bank entry on domestic market credit availability using the
surveying technique in 38 transition and developing countries. 57
They use the date of 93 countries between 1985 and 2007.

191 | P a g e
this study are collected from the Banks Association of Turkey and the Political Risk Service
(PRS) group. I employ the following variables:
FBP: Total assets held by foreign banks in the banking sector. Holding 50% share acquisition
by a foreign bank or foreign investor in a host country is accepted as a minimum requirement
to have an important influence on the management of acquired bank in Turkey. In other
words, acquiring 50% or more shares of domestic bank are recorded as a foreign bank in
most of the countries. However, FDI arises when a foreign investor acquires 10% or more
shares of domestic company and obtains, moreover, managerial control on domestic
company. Therefore, there is a difference between banking FDI and total assets of foreign
banks.
In this paper, I accepted that FBP measured as the total value of foreign bank assets. It is
important to know the relationship between FDI and foreign bank activities before to select
foreign bank assets as a proxy for foreign bank penetration. Nigh et al. (1986) and Goldberg
and Johnson (1990), as expected, found positive relationship between US FDI and foreign
activities of US banks. Similar to Nigh et al. (1986) and Goldberg and Johnson (1990),
Focarelli and Pozzolo (2000) found positive relationship between non-bank FDI and bank
choice of location in the OECD countries. In addition, the study of Miller and Parkhe (1998)
reveal that there is correlation between non-bank FDI and bank FDI. Grosse and Goldberg
(1991) and Esperanca and Gulamhussen (2001) used aggregate foreign bank assets while
examining the determinants of foreign bank penetration, same as I used. Lending to the
private sector depends on the supply and demand for loans. As FDI in the banking sector
raises the credit provision to the host market. Thus, this will increase total assets. In other
world, this will increase the size of the balance sheet and therefore FDI affects FBP. Figure

192 | P a g e
15 shows the total assets of foreign banks in Turkey, between 1994 and 1996, the growth of
foreign bank assets was very small. Although it is difficult to see in Figure 15, 8.5 %
quarterly growth was achieved in foreign bank assets between 1996 and 2000, and then from
2000 to 2003 the growth was negative due to economic and banking crisis. Since the end of
2003, except Q4-2008, and Q1 -2009, foreign bank penetration has accelerated because of
positive macroeconomic indicators, high profitability in the banking sector, new FDI law and
reduction in corporate tax.
ERR: Economic risk index indicates economic weaknesses and strengths in Turkey and takes
values between 0 and 50, while 0 correspond to the highest economic risk and 50 to the
lowest one. The index is assessed by PRS group using some sub-variables such as GDP per
capita, inflation, current account as a percentage of GDP, GDP growth, budget balance as a
percentage of GDP variables. In addition, the variable also is expressed in its logarithmic
transformation. Figure 15 shows economic risk indexes in Turkey from 1994 to 2009 based
on quarterly data. Between 1994 and 2001, such risk variable fluctuated between 32 and 24.
However, as a result of 2001 crisis in Turkey, the risk index dropped to 17. Therefore, with
the score of 17 points, Turkey was classified as a high economic risk country. Since the
middle of 2002, such index turned its direction upward because of positive macroeconomic
indicators and acceleration of privatisation activities.
FRR: Financial risk index indicates countries ability to pay its debt in general. The risk
variable ranges from 0 (maximum risk) to 50 (minimum risk). The variable is assessed using
exchange rate, foreign debt as a percentage of GDP, current account as a percentage of goods
and services, foreign debt service as a percentage of goods and services, liquidity variables.

193 | P a g e
Moreover, the variable was expressed in its logarithmic transformation. Figure 16 shows
financial risk performance of Turkey from 1994 to 2009, based on quarterly data. Over time,
such risk index fluctuated between 37 and 26 where Turkey was classified as a medium
political risk country, except Asian-Russian Crises and Turkish financial crisis periods.
PRR: Political risk index ranges from 0 (maximum risk) to 100 (minimum risk). PRS group
assesses such risk index using some sub-variables which are government stability,
bureaucratic quality, internal and external conflicts, religious and ethnic problems,
investment profile, socioeconomic conditions, democratic accountability and law and order.
Moreover, the variable is expressed in its logarithmic transformation. Figure 17 shows
political risk performance of Turkey from 1994 to 2009, based on quarterly data. Between
1994 and 1999, such risk index fluctuated between 66 and 51. Therefore, Turkey was
classified as a medium political risk country. However, as a result of 2001 crisis in Turkey,
the risk index dropped below 50 where the country was classified as a high political risk
country. Since the end of 2001, such index turned its direction upward and remained above
50.
GDP: Nominal GDP is used as a control variable since it is believed that GDP is an important
determinant of FDI, FBP and FPI. The findings of Buch (2000), Brealey and Kaplanis (1996)
and Yamori (1996) Herrero and Peria (2005) underlined that GDP in host countries seems
most important factor that affects the location decision of multinational banks. Similar to
these findings, the study of Luca and Spatafora (2012) implies that rising GDP is associated
with higher capital flows in developing countries.

194 | P a g e
DUM2001: DUM2001 is a dummy variable and used as a control variable since it is believed
that financial crisis in 2001 led to significant changes in the Turkish banking sector.
Table 25: Descriptive Statistics for the Variables of FBP,
PRR, ERR and FRR
FBP PRR ERR FRR
Mean 8.900 4.092 3.359 3.458
Median 8.600 4.094 3.344 3.486
Maximum 11.280 4.248 3.569 3.637
Minimum 7.357 3.857 2.862 3.157
Std. Dev. 1.212 0.099 0.133 0.127
Skewness 0.797 -0.421 -0.888 -0.747
Kurtosis 2.427 2.453 5.591 2.883
Note: the data bases on 69 observations (1992Q4-2009Q4)
Source: The Bank Association of Turkey and PRS group
Descriptive statistics for FBP, PRR, ERR, and FRR variables are shown in Table 25. FBP
variable shows variation, ranging from 7.357 to 11.280. Moreover, there is also variation in
PRR ERR, and FRR variables, ranging from 3.857 to 4.248, from 2.862 to 3.569, and from
3157 to 3.637, respectively. Table 25 also provides information about the distribution of the
variables by using the Skewness and Kurtosis techniques. While FBP variable is positively
skewed, PRR ERR, and FRR variables are negatively skewed. Regarding Kurtosis, the
distribution of FBP, PRR and ERR variables has large tails (more peaked) whilst the
distribution of ERR variable has small tails (flatter).

195 | P a g e
Figure 14: Total Assets of Foreign Banks (US Billion $)
Source: The Bank Association of Turkey
Figure 15: Economic Risk Index (ERR)
Source: PRS Group
0
10
20
30
40
50
60
70
80
1994 1996 1998 2000 2002 2004 2006 2008
16
20
24
28
32
36
1994 1996 1998 2000 2002 2004 2006 2008

196 | P a g e
Figure 16: Financial Risk Index (FRR)
Source: PRS Group
Figure 17: Political Risk Index (PRR)
Source: PRS Group
22
24
26
28
30
32
34
36
38
1994 1996 1998 2000 2002 2004 2006 2008
44
48
52
56
60
64
68
72
1994 1996 1998 2000 2002 2004 2006 2008

197 | P a g e
My study aims to identify the long run and short run dynamics between country risk and
foreign bank penetration in Turkey. Therefore, the study aims to open up new debate in this
field. In this framework, the first step is to check stationarity of the time series variables.
Stationarity is an important concept for time series models because nonstationary series lead
to high R2 and lead to statistically significant coefficients even though time series variables
are not related (Brooks, 2008)58
. At present, the most efficient unit root techniques are NG-
Perron (Ng and Perron, 2001), ERS point optimal and DF-GLS tests which are performed to
test whether the time series variables have unit root or not. One of the important problems in
the unit root tests appears in a case of structural breaks. Perron (1989, pp. 1) underlined that
“standard tests of the unit root hypothesis against trend stationary alternatives cannot reject
the unit root hypothesis if the true data generating mechanism is that of stationary
fluctuations around a trend function which contains a one-time break.” In other words, Perron
(1989) argued that although a time series variable is I(0), the result of unit root tests may
indicates that such variable is I(1) if there is a break in trending. The time series data (PRR,
ERR and FRR) are by design bounded above and (PRR = 0 to 100 and ERR and FRR = 0 to
50). Therefore, the data are more likely trend stationary process with breaks and these
variables cannot be truly I(1). Thus, stationarity processes with breaks are easily mistaken
from unit root processes (see, Perron (1989). However, in this paper models are been
performed based on result from the unit root tests.
The PP test of Perron and Ng (1996) was developed by Ng and Perron (2001) using the GLS
detrending procedure of ERS. The unit root test was constructed by four test statistics which
are MZα, MZt, MSB, and MPT. In my models, only MZα test statistic is employed. The MZα
58
The behaviours or properties of nonstationarity and stationary treat totally differently. While the effect of
shock gradually declines over time (t, t+1and t+n) for the stationary series, the effect of shock in time t does not
have smaller effect in time t+1 and in time t+n for the nonstationary series. This situation indicates first problem
of nonstationary series. Second problem of nonstationary series is related to spurious regression (Brooks, 2008).

198 | P a g e
test statistic is defined as; MZα = (T-1
( )
2- f0)/(2K) where K=∑
, the statistics
MZα is more effective version of Zα of the PP in terms of size and power.
Another unit root test that used in this paper is the ERS point optimum. The latter, was
developed by Elliott et al. (1996), is based on the quasi-differencing regression which is
defined as; d (vt|a) = d (zt|a)‟ʯ (a) +et; where d (vt|a) and d (zt|a) are quasi- differenced data
for vt and zt, respectively. Moreover, et is the residual term and ʯ (a) is the coefficient to be
estimated in the quasi-differencing regression. While the null hypothesis tested is α =1, the
alternative hypothesis tested is α= ā where ā = 1-7/T when zt contains only constant, and ā=1-
13.5/T when zt contains both a constant and a trend. The test statistic in the ERS point
optimum to test Ho is defined as; PT = (SSR (ā) – (ā) SSR (1)) / fo where fo, at frequency
zero, is an estimator for the error spectrum.
Last unit root test is the ADF-GLS technique. The early paper – Dickey and Fuller (1979)59
-
investigated how to test unit root in the time series variables. However, the ADF test has low
power when AR root is close to 1 (Cochrane, 1991). Thus, the alternative hypothesis can be
considered wrong when sample size is small (DeJong et al., 1992). To avoid these
weaknesses, the modified ADF test, in other words ADF-GLS, is also performed to test the
stationarity of time series variables.
It is common to use Johansen cointegration technique to test cointegrating vectors among the
integration time series variables. Such a test was initially put forward by Granger (1986),
Hendry (1986) and Engle and Granger (1987). If two or more time series variables have a
common stochastic trend, the cointegration exists among the variables and also either one
59
Dickey and Fuller (1979) are advice to the readers for more details about the concept.

199 | P a g e
(unidirectional) or two (bidirectional) way(s) causality is present60
. Therefore, the next step is
to test whether there is a long run relationship among I(1) time series variables or not because
in order to perform VEC model, at least one long run equilibrium relationship must exist. If
not, unrestricted VAR model will be suitable in order to test only short run linkages. As the
suggestion of Johansen (1988), Johansen and Juselius (1990), and Johansen (1996), the
developed version of the Johansen cointegration test - the Johansen maximum likelihood
procedure - was applied for the I (1) variables in order to determine whether cointegration
exists among the variables using the trace and eigenvalue tests.
VECM is a restricted model of VAR for the cointegrated variables. Engle and Granger (1987)
point out that the presence of long run relationship or cointegrating vector among I (1)
variables allow to perform VECM. Engle and Granger (1987) conclude that the presence of
one or more cointegrating vector(s) among the variables shows the existence of error
correction representation. The latter means that changes in predicted variable and changes in
independent variables are a function of the disequilibrium level in the cointegrating
equilibrium (Masih and Masih, 1996). With performing VECM for the cointegrated variables,
the short run and long run dynamics among the variables can be captured. However,
unrestricted VAR model - Vector Autoregression – uses to capture only short run dynamics
among the time series variables61
.
The output of unrestricted and restricted VAR based Granger causality tests does not explain
the signs of relationships in the models and how long the impacts will remain effective. To
obtain this information, the generalised impulse response and variance decomposition
60
Granger (1986), Granger (1988), Johansen (1988), Kunst and Neusser (1990), and Johansen and Juselius
(1990) are recommended to the readers for more details about the cointegration test. 61
Simply, The Granger causality is a test to find (i) whether X variable Granger cause Y variable and (ii)
whether Y variable Granger cause X variable. If Y variable does not cause X, the parameters of X on the lagged
Y are jointly zeros (Granger, 1969).
200 | P a g e
techniques are applied. Traditional impulse response (Sims, 1980), based on Choleski
factorization of Vector Autoregression, heavily criticised due to the orthogonality
assumption. Traditional impulse response, sensitive to variable order, was developed by
Pesaran and Shin (1998) and Koop et al. (1996). The developed version of impulse response
technique is called “generalised impulse response”, which is not sensitive of the ordering of
the variable in the system. The effect of X on Y or the effect of changing X on Y can be
evaluated over specific time by the impulse response functions (Hill et al., 2008). In other
words, the magnitude of the effect of the innovation is investigated by the outcome of
generalised impulse response technique (Ramirez, 2006; Pesaran and Shin, 1998). As
suggested by Pesaran and Shin (1998) and Koop et al. (1996), the generalised impulse
response technique is applied to find out the sign of relationship among variables and to find
out how these effects will remain effective or change over time62
. Apart from the generalised
impulse response technique, I employ the variance decomposition technique to get
information about the percentage of the movement in the endogenous variables that are
because of their own innovations, against innovations to other variables.
5.5 Empirical Findings
Prior to the application of cointegration test, the stationarity of FBP, ERR, FRR and PRR is
tested. To test the order of integration of these variables, NG-Perron (Ng and Perron, 2001),
ERS Point Optimal (Elliot et al., 1996) and DF-GLS tests are applied. The outcomes of these
tests for the variables are displayed, in Table 26, with both their differences and log-levels
forms.
62
See, Koop et al. (1996) and Pesaran and Shin (1998) for further details about the concept.

201 | P a g e
Table 26. Unit Root Test for the Variables of FBP, PRR, ERR and FRR
Ng-Perron (MZα) a ERS Point Optimal
b DF-GLS
c
C C & T C C & T C C & T
FBP 1.773 -2.392 81.944 38.850 1.429 -1.100
DFBP -22.880** -33.478** 0.747** 2.685** -4.496** -7.911**
ERR -5.306 -8.664 5.405 10.322 -1.450 -2.168
DERR -80.119** -79.070** 0.336** 1.080** -8.629** -8.632**
FRR -4.675 -8.297 7.636 11.247 -1.494 -2.181
DFRR -32.924** -32.938** 0.728** 2.698** -7.118** -7.132
PRR -2.587 -3.468 12.302 30.464 -1.168 -1.437
DFRR -33.452** -33.425** 0.714** 2.650** -8.431** -8.515**
C and C&T denote constant and constant and trend, respectively. D initial letter denotes the
first difference of time series variables. The integration order for the logged GDP is one
using the unit root tests. The findings regarding GDP and DUM2001 are not shown in
Table 26 because the aim of this paper only investigates relationship among types of capital
flows.
** and * denote statistically significant at 0.01 and 0.05 levels, respectively. a
including only constant, one-sided test of the Ho that the variable has unit root; critical
values are equal to -5.70, -8.10, and -13.80 at 10%, 5%, and 1% levels, respectively. a
including a constant and a trend, one-sided test of the Ho that the variable has unit root;
critical values are equal to -14.20, -17.30, and -23.80 at 10%, 5%, and 1% levels,
respectively. b
including only constant, one-sided test of the Ho that the variable has unit root; critical
values are equal to, 4.008, 3.023, and 1.900 at 10%, 5%, and 1% levels, respectively. b
including a constant and a trend, one-sided test of the Ho that the variable has unit root;
critical values are equal to 6.777, 5.689, and 4.235 at 10%, 5%, and 1% levels,
respectively. c including only constant, one-sided test of the Ho that the variable has unit root; critical
values are equal to, -1.613, -1.945, and -2.599 at 10%, 5%, and 1% levels, respectively.
c including a constant and a trend, one-sided test of the Ho that the variable has unit root;
critical values are equal to -2.836, -3.132, and -3.701 at 10%, 5%, and 1% levels,
respectively.
The result of NG-Perron test in Table 26 shows that FBP has unit root at the integration of
zero order. This is because calculated Ng Perron MZα test statistics are greater than its critical
values in the model with an intercept and the model with a trend and an intercept at the 5%
level. Thus, to find out integration of order, first difference is taken for the variable and the
results clearly indicates that the null hypothesis cannot be rejected. Therefore the variable is
integrated with order 1. Results obtained from the NG Perron tests are similar to the ones

202 | P a g e
found using the ERS point optimal and DF-GLS unit root tests. For all risk variables - ERR,
FRR, and PRR - integration of zero order is not found63
. In other words, the null hypotheses
of nonstationarity for the risk variables cannot be rejected at the integration of zero order in
all cases. However, at the first difference, these variables seem stationary at the 5% level. As
a result, all variables - FBP, ERR, FRR, and PRR - are found integration of one order. The
data (PRR, ERR and FRR) are by design bounded above and (PRR = 0 to 100 and ERR and
FRR = 0 to 50) as explained previous section. The data are more likely trend stationary
process with breaks and these variables cannot be truly I(1). However, I am proceeding with
the estimation assuming the data are integrated I(1) processes and this is an approximation for
stationary processes with multiple breaks.
The next step is to check for the time series variables whether there is a cointegration
relationship(s) (or equilibrium(s)) among the variables in the long run or not64
. The results of
Johansen maximum likelihood procedure shows that in model 1 there is one cointegrating
vector using the trace and maximum eigenvalue tests. In model 2, while the maximum
eigenvalue test indicates a cointegrating equilibrium at the 0.05 level, the trace test indicates
only 1 cointegrating equation at the 0.1 level. The null hypothesis of no cointegration
between foreign bank penetration and financial risk cannot be rejected at the 5% level.
Existing cointegrating equilibrium in model 1 and 2 allows us to investigate both the long run
and short run dynamics by performing bivariate VEC models whereas unrestricted VAR
model is applied to test short run dynamics between foreign bank penetration and financial
risk in model 3 after controlling DGDP and 2001 financial crisis.
63
The first differences of ERR, FRR and PRR variables are DERR, DFRR and DPRR, respectively. 64
Granger (1988), Johansen (1988), Kunst and Neusser (1990), Johansen and Juselius (1990), and Johansen
(1996) are recommended to the readers for more details about the cointegration test.

203 | P a g e
Table 27: Johansen Cointegration Test
Model 1.
Hypothesized Eigenvalue Trace Critical Prob. Max-Eigen Critical Prob.
No. of CE(s)
Statistic Values
(0.05)
Statistic Value(0.05)
r=0 0.212 14.778 15.494 0.063* 14.533 14.264 0.045**
r≤1 0.003 0.244 3.841 0.621 0.244 3.841 0.621
Model 2.
Hypothesized Eigenvalue Trace Critical Prob. Max-Eigen Critical Prob.
No. of CE(s)
Statistic Values
(0.05)
Statistic Value(0.05)
r=0 0.213 16.417 15.494 0.036** 16.118 14.264 0.025**
r≤1 0.004 0.298 3.841 0.584 0.298 3.841 0.584
Model 3.
Hypothesized Eigenvalue Trace Critical Prob. Max-Eigen Critical Prob.
No. of CE(s)
Statistic Values
(0.05)
Statistic Value(0.05)
r=0 0.125 9.209 15.494 0.346 9.005 14.264 0.285
r≤1 0.003 0.203 3.841 0.651 0.203 3.841 0.651
Note: ** and * denotes rejection of the hypothesis at the 0.05 and 0.1 levels. The optimal lag lengths used
for each bivariate cointegration models are determined by the LR information criteria. The first differences
of FBP, PRR, ERR and FRR variables were used in all models. Since the aim of this paper is to investigate
the relationship between DFBP and host country risk (namely DERR, DPRR and DFRR), Eigenvalue and
Trace test are performed without including control variables.
MacKinnon-Haug-Michelis (1999) p-values.
The general equations of VECM for 1st and 2
nd models are shown below;
VECM 1:
Eq.(1); DFBPt =β1 +∞1ɛt-i + ∑ + ∑
+∑
+∑ + et
Eq.(2); DPRRt =β2 +∞2ɛt-i + ∑ + ∑
+∑
+∑ + et
VECM 2:
eq.(3); DFBPt =β3 +∞3ɛt-i + ∑ + ∑
+∑
+∑ + et

204 | P a g e
eq.(4);
DERRt =β4 +∞4ɛt-i +∑ +∑
+∑
+ ∑ +et
65
VAR 1:
eq.(5); DFBPt =β5 + ∑ + ∑
+∑
+∑ + et
eq.(6); DFRRt =β6 + ∑ + ∑
+∑
+∑ + et
Where n denotes the numbers of lag which were determined by the information criterions, β1-
6, α1-6, ν1-6 and ρ1-6 are parameters for estimation, and et and ut are residual terms. ɛt-1
represents error correction term in equation 1-4.
The results from VEC and VAR models are presented in Table 28. In model 1, where we
investigate the long run linkage between political risk and foreign bank penetration in
Turkey. At the 5% level, estimated error correction term is significant, implying that there is
unidirectional long run equilibrium from foreign bank penetration to political risk in Turkey.
Therefore, this result clearly mirrors that foreign bank participation contributes to political
risk in the long run. It is surprising to find significant impact of foreign bank penetration on
political risk in Turkey because existing literature focused on only reverse effect which is not
significant, regarding my finding at 5% level.
65
To detect long-run relationship between DFBP and DPRR and between DFBP and DERR, the control
variables are avoided from my VEC model 1 and 2. However, I add control variables the generalised impulse
response functions of 1st and 2
nd models.

205 | P a g e
In model 2, I test whether there is long run linkage between foreign bank penetration and
economic risk. My finding reveals that in the long run, foreign bank penetration affects
economic stability. This is consistent with existing literature because it is well-known that the
main reason behind the motivation of governments to attract foreign bank is its direct and
indirect impact on economic environment in a host market. Moreover, this result mirrors how
foreign bank penetration is important for economy risk in the long run in Turkey. The reverse
error correction term, but, is not significant at the 5 % level. In last model, the result of VAR
based Granger causality test indicates that surprisingly there is no causal relationship between
foreign bank penetration and financial risk in the short run.
Table 28: VECM and VAR Tests
Long Run Relationship
Dep. Ind.
ECM
DPRR DFBP
DFBP 0.030 {1.842}*
Model 1. DPRR -0.008 {-2.690}**
DERR DFBP
DFBP -0.016 {-1.233}
Model 2. DERR 0.026 {3.950}**
Short Run Relationship
Ind.
DFRR DFBP
DFBP [2.391] (0.122)
Model 3. DFRR [0.598] (0.439)
Note: Dep, Ind, and ECM denote dependent variables, independent variables and
error correction terms, respectively. The first differences of FBP, PRR, ERR, FRR
and GDP variables were used in all models. The optimal lags for unrestricted and
restricted VAR models are selected by the LR information criteria. The results of
diagnostics tests such as autocorrelation LM, heteroskedasticity tests and the
inverse roots of AR characteristic polynomial, are reported in Table 29-30 and in
Figure 24 in the appendix, are found to be satisfactory. The numbers in {-}, [-] and
(-) are the t-statistics, chi-squares and probabilities, respectively. ** and * denote
statistically significant at the 5% and 10% levels, respectively. Since the aim of this
paper is to investigate the relationship between FBP and host country risk (namely
DERR, DPRR and DFRR), the possible causal impacts of control variables on the
host country risk variables and DFBP are not presented in Table 28. Moreover, to
detect long-run relationship between DFBP and DPRR and between DFBP and

206 | P a g e
DERR, the control variables are avoided from my VEC model 1 and 2.
The generalised impulse response function test is employed in three time series models to
have information about the sign of relationship and how long these impacts will remain
effective or change over time66
. Figure 18 to 23 reports the accumulated generalised response
of foreign bank penetration to one standard deviation (s.d.) in shocks in country risk
variables, vice versa. Figure 19 illustrates that in response to initial shock to foreign bank
penetration by political stability is close to zero over time. The reverse response is,
surprisingly, close to zero at the end of 12 quarters, implying that there is no impact of
foreign bank penetration on political risk in Turkey. This result is not consistent with the
finding in Table 28. Figure 20 illustrates that economic risk variable, surprisingly, does not
have any effect on the location choice of multinational banks in Turkey The reverse response
is close to zero over time in the short-run although I detected long-run linkage from DFBP to
DERR. With respect to model 3, Figures 22 - 23 illustrates that there is no distinct
relationship between foreign bank penetration and financial risk in Turkey. This is because
the significance of control variables on both the host country risk variables and DFBP is more
than the significance of host country risk variables on DFBP and the significance DFBP of
the country risk variables.
66
It is worthy to mention that since the main purpose of this study is to examine two-way linkages between
foreign bank penetration and risk in Turkey, in response to a shock to X variable by X variable is not
investigated. Therefore, six impulse response functions are presented in Figure 18 to 23.

207 | P a g e
-.04
-.02
.00
.02
.04
.06
1 2 3 4 5 6 7 8 9 10 11 12
-.20
-.15
-.10
-.05
.00
.05
.10
.15
.20
1 2 3 4 5 6 7 8 9 10 11 12
Response to Generalized One S.D. Innovations ± 2 S.E.
Figure 18: Response of DPRR to DFBP
Figure 19: Response of DFBP to DPRR

208 | P a g e
-.08
-.04
.00
.04
.08
.12
1 2 3 4 5 6 7 8 9 10 11 12
-.20
-.15
-.10
-.05
.00
.05
.10
.15
.20
1 2 3 4 5 6 7 8 9 10 11 12
Figure 20: Response of DERR to DFBP
Figure 21: Response of DFBP to DERR

209 | P a g e
As part of the diagnostic tests, I apply the numbers of diagnostic tests, such as autocorrelation
LM and Box and VAR residual heteroskedasticity, to test the stability of the VAR models.
My evidence, presented in Table 29 to 30 in the appendix, show that there is no
heteroskedasticity and no autocorrelation in my models. In addition, the inverse roots of AR
characteristic polynomial is also applied to detect the stability of the restricted and
unrestricted VAR models and the findings are found to be satisfactory for all models.
-.04
-.02
.00
.02
.04
.06
.08
.10
1 2 3 4 5 6 7 8 9 10 11 12
-.20
-.15
-.10
-.05
.00
.05
.10
.15
.20
1 2 3 4 5 6 7 8 9 10 11 12
Figure 22: Response of DFRR to DFBP
Figure 23: Response of DFBP to DFRR

210 | P a g e
5.6 Conclusion
Using restricted and unrestricted VAR models and the Johansen co-integration test, I
examined the short run and long run dynamic relations between foreign bank penetration and
country risk variables, namely political risk, economic risk and financial risk in Turkey. The
time series variables are based on quarterly data from 1992Q4 to 2009Q4. To test whether the
time series variables have unit root or not, I performed newly developed unit root tests - Ng-
Perron, ERS point optimal and DF-GLS -. I have determined that foreign bank penetration
and country risk variables are integrated of order 1. The long run relationship between DFBP
and all country risk components was tested using the Johansen cointegration test. My findings
show that one cointegrating vector exists in model 1-2 where I investigated the relationship
between DFBP and DPRR and between DFBP and DERR, respectively. However, the null
hypothesis is that no cointegrating equilibrium between FBP and financial risk could not be
rejected.
The result of VECMs indicates that foreign bank penetration has a strong power for
explaining political and economic stabilities in the long run in Turkey. It is rational and in
line with existing literature to find long run relationship from DFBP to DERR because Buch
(2000) also finds positive effect of FBP on GDP per capita. However, no detailed literature
exists about relationship between FBP and PRR, my finding, thus, is likely to open new
debate in this field. To fail to find any linkage from host country risk to DFBP in Turkey is
interesting because even one of the initial contributors of the theory of multinational
enterprises – Tobin (1969) - underlined the importance of risk factor on FDI. I also tested the

211 | P a g e
short run causality based on VAR approach between DFBP and DFRR but I failed to find any
significant causality in the VAR model, even at the 10% level. I also employed the
generalised impulse response techniques. The finding in the generalised impulse response
functions indicated that there is no impact of foreign bank penetration on any host country
risk variables (namely, DERR, DPRR and DFRR). The reverse effects are close to zero
throughout 12 quarters.

212 | P a g e
5.7 References
[1] Ankara Chamber of Commerce (2006). “Paranin Yabanci Damatlari Raporu.”
[2] Barth, J., G. Caprio, et al. (2004). "Bank Regulation and Supervision: What Works Best?"
Journal of Financial Intermediation 13: 205-248.
[3] Brealey, R. A. and E. C. Kaplanis (1996). "The Determination of Foreign Banking
Location."Journal International Money and Finance 15(4): 577-597.
[4] Brooks, C. (2008). Introductory Econometrics for Finance. London, Cambridge
University Press.
[5] Buch, C. (2000). "Why Do Banks Go Abroad? Evidence from German Data."Journal of
Financial Markets, Instruments and Institutions 9(1): 33-67.
[6] Clarke, G. R. G., R. Cull, et al. (2006). "Foreign Bank Participation and Access to Credit
Across Firms in Developing Countries "Journal of Comparative Economics 34(4): 774–795.
[7] Cochrane, J. H. (1991). "A critique of the application of unit root tests." Journal of
Economic Dynamics and Control 15(2): 275-284.
213 | P a g e
[8] DeJong, D. N., J. C. Nankervis, et al. (1992). "The Power Problem of Unit Root Tests in
Time Series with Autoregressive Errors."Journal of Econometrics 53(1-3): 323–343.
[9] Dickey, D. A. and W. A. Fuller (1979). "Distribution of the Estimators for Autoregressive
Time Series with a Unit Root."Journal of the American Statistical Association 74: 427-431.
[10] Elliott, G., T. Rothenberg, et al. (1996). "Efficient Tests for an Autoregressive Unit
Root." Econometrica 64(4): 813-836.
[11] Engle, R. F. and C. W. J. Granger (1987). "Cointegration and Error-Correction:
Representation, Estimation, and Testing." Econometrica 55 (2): 251-276.
[12] Erb, C., C. R. Harvery and T. E. Viskanta (1996). “ Political Risk, Economic Risk and
Financial Risk.” Financial Analysts Journal 52(6): 29-46.
[13] Esperanca, J. P. and Gulamhussen, M. A. (2001). “(Re)Testing the „Follow the
Customer‟ Hypothesis in Multinational Bank Expansion.” Journal of Multinational Financial
Management 11(3): 281-293.
[14] Focarelli, D. and A. F. Pozzolo (2005). "Where do Banks Expand Abroad? An Empirical
Analysis."Journal of Business 78(6): 2435-2464.

214 | P a g e
[15] Garcia-Herrero, A. (1997). “Banking Crises in Latin America in the 1990s: Lessons
from Argentina, Paraguay, and Venezuela.” International Monetary Fund Working Paper
WP/97/170.
[16] García-Herrero, A. and M. S. M. Peria (2005). "The Mix of International Banks' Foreign
Claims: Determinants and Implications." World Bank Policy Research Working Paper No.
3755.
[17] Goldberg, L. G. and A. Saunders (1980). "The Causes of US Bank Expansion Overseas:
The case of Great Britain." Journal of Money, Credit and Finance 12: 630-643.
[18] Goldberg, L. G. and R. Grosse (1992). "Location Choice of Foreign Banks in the United
States." Journal of Economics and Business 46(5): 367-379.
[19]Goldberg, L.G. and D. Johnson (1990). “The Determinants of US Banking Activity
Abroad.” Journal of International Money and Finance 9: 123-137.
[20] Granger, C. W. J. (1969). “Investigating Causal Relations by Econometric Models and
Cross-spectral Methods.” Econometrica 37(3): 424–438.
[21] Granger, C. W. J. (1986). "Developments in the Study of Cointegrated Economic
Variables."Oxford Bulletin of Economics and Statistics 48: 213–228.

215 | P a g e
[22] Grosse, R. and L. Goldberg (1991). “Foreign Activity in the United States: An Analysis
by Country of Origin.” Journal of Banking and Finance 15(6): 1092-1112.
[23] Haas, R. and I. van Lelyveld (2006)."Foreign Banks and Credit Stability in Central and
Eastern Europe. A Panel Data Analysis" Journal of Banking & Finance 30(7):1927-1952.
[24] Hayakawa, K., F. Kimura, et al. (2011). "How Does Country Risk Matter for Foreign
Direct Investment?" IDE Discussion Papers No.281.
[25] Hendry, D. F. (1986). "Econometric Modelling with Cointegrated Variables: An
Overview." Oxford Bulletin of Economics and Statistics 48: 201-228.
[26] Hill, R. C., W. E. Grifiths, et al. (2008). Principles of Econometrics, John Wiley & Sons.
[27] Jeon, Y., S. M. Miller, P. A. Natke (2006). ”Do Foreign Bank Operations Provide a
Stabilizing Influence in Korea?””, The Quarterly Review of Economics and Finance,46(1):
82-109.
[28] Johansen, S. (1988). "Statistical Analysis of Cointegrating Vectors."Journal of Economic
Dynamics and Control 12: 231-254.

216 | P a g e
[29] Johansen, S. (1996). "Likelihood Based Inference in Cointegrated Vector Autoregressive
Models." Oxford: Oxford University Press.
[30] Johansen, S. and K. Juselius (1990). "Maximum Likelihood Estimation and Inference on
Cointegration with Applications to the Demand for Money."Oxford Bulletin of Economics
and Statistics 52: 169-210.
[31] Jun, K. W. and H. Singh (1996). "The Determinants of Foreign Direct Investment: New
Empirical Evidence." Transatlantic Corporations 5: 67-106.
[32] Koop, G., M.H. Pesaran, et al. (1996). “Impulse Response Analysis in Nonlinear
Multivariate Models.” Journal of Econometrics 74(1):119-147
[33] Kunst, R. and K. Neusser (1990). "Cointegration in a Macroeconomic System."Journal
of Applied Econometrics 5(4): 351-365.
[34] Lee, B. (2003). “The Determinants of Foreign Banks' Entry in Korea and Its Effects on
Korean Domestic Banks' Performance.”Economic Papers, 6(1):42-65
[35] Lee, J. (2002), “Financial Liberalization and Foreign Bank Entry in MENA; Financial
sector strategy and policy.” The World Bank, Washington, D.C.

217 | P a g e
[36] Loree, D. and S. Guisinger (1995). "Policy and non-Policy Determinants of U.S. Foreign
Direct Investment."Journal of International Business Studies 26(2): 281-299.
[37] Margi, S., A. Mori, et al. (2004). “The Entry and the Activity Level of Foreign Banks in
Italy: An Analysis of the Determinants” Journal of Banking and Finance 29(5):1295-1310.
[38] Masih, A. M. M. and R. Masih (1996). "Energy Consumption, Real Income and
Temporal Causality: Results from a Multi-country Study Based on Cointegration and Error-
correction Modelling Techniques." Energy Econ 18: 165-183.
[39] Mathieson, D. J. and Schinasi G. J. (2000). “”International Capital Markets
Developments, Prospects, and Key Policy Issues.”International Monetary Fund.
[40] Miller, S. R. and A. Parkhe (1998). “Patterns of Expansion of U.S. Banks‟ Foreign
Operations.” Journal of International Business Studies 29(2): 359-390.
[41] Ng, S. and P. Perron (2001). "Lag Selection and the Construction of Unit Root Tests
with Good Size and Power." Econometrica 69(6): 1519–1554.
[42] Ngowi, H. P. (2001). "Attracting New Foreign Direct Investment to Tanzania."Tanzanet
Journal 1(2): 23-39.

218 | P a g e
[43] Nigh, D., Cho, K. R. and S. Krishnan (1986). “The Role of Location-Related Factors in
U.S. Banking Involvement Abroad: An Empirical Examination.” Journal of International
Business Studies 17: 59-72.
[44] Papaioannou, E. (2005). "What Drives International Bank Flows? Politics, Institutions
and Other Determinants." European Central Bank Working Paper. 437.
[45] Perron, P. (1989). “The Great Crash, the Oil Price Shock, and the Unit Root Hypothsis.”
Econometrica 57(6): 1361-1401.
[46] Perron, P. and S. Ng (1996). "Useful modifications to unit root tests with dependent
errors and their local asymptotic properties." Review of Economic Studies 63: 435-465.
[47] Pesaran, M. H. and Y. Shin (1998). "Generalised Impulse Response Analysis in Linear
Multivariate Models."Economics Letters 58: 17-28.
[48] Ramirez, M. (2006). "Is Foreign Direct Investment Beneficial for Mexico? An Empirical
Analysis, 1960-2001." World Development 34(5): 802-817.
[49] Root, F.R. and A. Ahmed (1979). “Empirical Determinants of Manufacturing Direct
Foreign Investment in Developing Countries” Economic Development and Cultural Change
27: 751-767.

219 | P a g e
[50] Satta, T. A. (2004). "The Influence of Foreign Bank Entry on Lending to Small Firms in
Tanzania."The Journal of Policy Reform 7(3): 165-173.
[51] Sims, C. A. (1980), “Macroeconomics and Reality”, Econometrica 48(1):1-48.
[52] Tobin, J. (1969). “A General Equilibrium Approach to Monetary Theory.” Journal of
Money, Credit, and Banking 1: 15–29.
[53] Wezel, T. (2004). "Foreign Bank Entry into Emerging Economies: An Empirical
Assessment of the Determinants and Risks Predicated on German FDI Data." Deutsche
Bundesbank Discussion PaperSeries 1, N.01.
[54] Wheeler, D. and A. Mody (1992). “International Investment Location Decisions: The
Case of U.S. Firms” Journal of International Economics 33:57-76.
[55] Yamori, N. (1998). "A note on the Location Choice of Multinational Banks: The case of
Japanese Financial Institutions,." Journal of Banking and Finance 22: 109-120.

220 | P a g e
5.8 Appendix
Table 29: Autocorrelation LM Tests
Null Hypothesis: no serial correlation at lag order h
Model 1 Model 2 Model 3
Lags LM-Stat Prob Lags LM-Stat Prob Lags LM-Stat Prob
4 19.224 0.257 4 14.516 0.560 5 12.039 0.741
-1.5
-1.0
-0.5
0.0
0.5
1.0
1.5
-1.5 -1.0 -0.5 0.0 0.5 1.0 1.5
Inverse Roots of AR Characteristic Polynomial
Table 30: VAR Residual Heteroskedasticity Tests
No cross terms (only levels and squares)
Model 1 Model 2 Model 3
Chi-sq Prob Chi-sq Prob Chi-sq Prob
111.397 0.964 299.473 0.202 308.617 0.945
Note: Df denotes degree of freedom.
Figure 24: Inverse Roots of AR Characteristic Polynomial
Model 1

221 | P a g e
-1.5
-1.0
-0.5
0.0
0.5
1.0
1.5
-1.5 -1.0 -0.5 0.0 0.5 1.0 1.5
Inverse Roots of AR Characteristic Polynomial
-1.5
-1.0
-0.5
0.0
0.5
1.0
1.5
-1.5 -1.0 -0.5 0.0 0.5 1.0 1.5
Inverse Roots of AR Characteristic Polynomial
Model 2
Model 3

222 | P a g e
5.8.1 Data Appendix
This appendix describes the data source used in my empirical models. The time series
variables used in the models are shown below;
5.8.1.1 FBP
» Definition: Total assets held by foreign banks in the banking sector. Holding 50% share
acquisition by a foreign bank or foreign investor in a host country is accepted as a minimum
requirement to have an important influence on the management of acquired bank in Turkey.
In other words, acquiring 50% or more shares of domestic bank are recorded as a foreign
bank in most of the countries.
» Source: The Banks Association of Turkey (2011), the data are available at 20.12.2010
https://www.tbb.org.tr/en/banks-and-banking-sector-information/data-query-
system/financial-tables/41
» Measure: In this paper, I accepted that foreign bank penetration measured as the total value
of foreign bank assets. Because the total value of foreign bank assets holds the lion shares of
banking FDI. As I did, Grosse and Goldberg (1991) and Esperanca and Gulamhussen (2001)
are used aggregate foreign bank assets while examining the determinants of foreign bank
penetration. The variable was expressed in its logarithmic transformation.
» Period: The FBP variable used in the empirical tests of this paper consists of the quarterly
for the period 1994Q1 to 2009Q4 which includes 64 observations.

223 | P a g e
5.8.1.2 PRR
» Definition: Political risk index ranges from 0 (maximum risk) to 100 (minimum risk). PRS
group assesses such risk index using some sub-variables which are government stability,
bureaucratic quality, internal and external conflicts, religious and ethnic problems,
investment profile, socioeconomic conditions, democratic accountability and law and order»
»Source: The Political Risk Service group (2011), the data were available at 05.03.2011
http://www.prsgroup.com/
» Measure: The PRR variable was expressed in its logarithmic transformation.
» Period: The PRR variable used in the empirical tests of this paper consists of the quarterly
for the period 1994Q1 to 2009Q4 which includes 64 observations.
5.8.1.3 ERR
» Definition: Economic risk index indicates economic weaknesses and strengths in Turkey
and takes values between 0 and 50, while 0 correspond to the highest economic risk and 50 to
the lowest one. The index is assessed by PRS group using some sub-variables such as GDP
per capita, inflation, current account as a percentage of GDP, GDP growth, budget balance as
a percentage of GDP variables.
» Source: The Political Risk Service group (2011), the data were available at 05.03.2011
http://www.prsgroup.com/
» Measure: The ERR variable was expressed in its logarithmic transformation.
» Period: The ERR variable used in the empirical tests of this paper consists of the quarterly
for the period 1994Q1 to 2009Q4 which includes 64 observations.

224 | P a g e
5.8.1.4 FRR
» Definition: Financial risk index indicates countries ability to pay its debt in general. The
risk variable ranges from 0 (maximum risk) to 50 (minimum risk). The variable is assessed
using exchange rate, foreign debt as a percentage of GDP, current account as a percentage of
goods and services, foreign debt service as a percentage of goods and services, liquidity
variables.
» Source: The Political Risk Service group (2011), the data were available at 05.03.2011
http://www.prsgroup.com/
» Measure: The FRR variable was expressed in its logarithmic transformation.
» Period: The FRR variable used in the empirical tests of this paper consists of the quarterly
for the period 1994Q1 to 2009Q4 which includes 64 observations.
5.8.1.5 GDP
» Definition: Nominal GDP is used as a control variable since it is believed that GDP is an
important determinant of FDI, FBP and FPI. The findings of Buch (2000), Brealey and
Kaplanis (1996) and Yamori (1996) Herrero and Peria (2005) underlined that GDP in host
countries seems most important factor that affects the location decision of multinational
banks. Similar to these findings, the study of Luca and Spatafora (2012) implies that rising
GDP is associated with higher capital flows in developing countries.
» Source: The Central Bank of the Republic of Turkey (2011), the data was available at
05.08.2013
http://evds.tcmb.gov.tr/yeni/cbt-uk.html
» Measure: The GDP variable was expressed in its logarithmic transformation.

225 | P a g e
» Period: The GDP variable used in the empirical tests of this paper consists of the quarterly
for the period 1994Q1 to 2009Q4 which includes 64 observations.
5.8.1.6 DUM2001
» Definition: DUM2001 is a dummy variable and used as a control variable since it is
believed that financial crisis in 2001 led to significant changes in the Turkish banking sector.
» Source: The dummy variable is generated by the author.
» Measure: The raw data were used.
» Period: The DUM2001 variable used in the empirical tests of this paper consists of the
quarterly for the period 1994Q1 to 2009Q4 which includes 64 observations.

226 | P a g e
Chapter 6: Capital Flows to Turkey: Multivariate VAR Approach
Dervis Kirikkaleli
Stirling Management School, Division of Economics, University of Stirling, FK9 4LA
Email: [email protected]
Telephone: +44 (0) 759 100 5766
6.1 Abstract
The gradual raising of capital flows in developing countries has made developing countries
more interesting to investigate over the last 20 years. Turkey is a typical example of a
developing country that achieved high growth rate in the foreign capital attraction, especially
throughout the last decade. I aim to investigate the linkage between foreign direct investment
(FDI), foreign portfolio investment (FPI) and foreign bank penetration (FBP), while
controlling DGDP and 2001 financial crisis in Turkey using quarterly data from 1994Q1 to
2009Q4 in this paper. In order to obtain information about causal relationship among the time
series variables, VAR based block exogeneity wald test is performed. The finding from this
test indicates that; changes in DFBP significantly lead to changes in DFDI; there is also
unilateral causality which runs from FPI to DFBP at 5% level. Using the variance
decomposition technique, I also find that DFDI and FPI have little explanatory power for the
evolution of DFBP in Turkey; the contribution of DFBP to the variability of DFDI is more
than that of FPI; the contribution of DFDI to FPI variability ranges between 0.000% and
7.611% throughout the 12 quarter periods whilst the contribution of DFBP to FPI variability
ranges between 0.000% and 9.122%.

227 | P a g e
6.2 Introduction
Capital flows to most of the developing countries have substantially increased in the last 2
decades, except the current global crisis period. According to the Institute of International
Finance (IIF), capital inflows to developing countries reached peak point in 2007 with US$
1222 billion from approximately US$ 200 billion in 2000 but declined to US$ 780 billion in
200867
. In case of the composition of capital inflows, portfolio investment is dominant with
48% of total capital inflows in 2009 in developing countries excluding Chine. The share of
direct inflows in total inflows is 34% while other inflows accounted for 18% of total inflows
to developing countries. Apart from the portfolio theory68
, this pattern in developing
countries can be explained by the minimisation of government controls on the most of the
sectors, macroeconomic stability, financial deregulation and the willingness of governments
to attract foreign capital because of its necessity to fund domestic projects69
. The distribution
of capital flows has also changed at the same period. Although the lion share of capital flows
had been attracted by developed countries until the end of the 1990s, the share had declined
dramatically at the beginning of the 2000‟s. Thus, the portion of capital flows that developing
countries attracted have significantly increased. These factors encourage researchers to
investigate capital flows that go to developing countries. Turkey is a typical example of a
developing country that achieved tremendous growth rate in the foreign capital attraction,
especially over the past decade. This factor and the on-going negotiation between the EU and
Turkey about the integration of Turkey into the EU have made Turkey a more interesting
country to investigate and opened new debate on foreign investment in Turkey.
67
The database of IIF involves around 50 low, middle and high income developing countries. 68
According to the portfolio theory, an investor prefers to invest in a foreign market where rate of return is more
relative to that in home market (see Cuddington, 1987). 69
As well known, short and long term capital flows to a host country are one of the important ways to finance
public deficit and current account.

228 | P a g e
Turkey did not face the difficulty to adapt itself to liberalisation process in the world at the
beginning of the 1980‟s. The liberalisation process in Turkey started with the implementation
of Economic Stabilisation program -, which was supported by the IMF and World Bank – to
minimize the intervention of Turkish government in monetary policy and finance system and
to restructure Turkish economy on 24 January 1980. Other improvements in the 1980‟s are
capital account liberalisation, reopening Istanbul stock exchange, the acknowledgment of
Foreign Capital Decree. However, until the beginning of the 2000‟s, the capital flow could
not be attracted as expected because of internal crises, ethnic problems, political and
macroeconomic instability, more importantly, bureaucratic barriers for foreign projects.
Over the period 1994-1999, the accumulated net capital flow to Turkey is US$ 15 billion.
The accumulated net FDI and FPI in this time period are $US 3 and -0.4 billion, respectively.
However achieving macroeconomic and political stability as a result of sound fiscal and
monetary policies have attracted more and more foreign investors to Turkey since the
beginning of the 2000‟s (Yorukoglu and Kilinc, 2012). From 2000 to 2005, the accumulated
net capital flow that Turkey attracted is US$ 57 billion, which is more than three-fold relative
to previous period. At the same period, FDI, FPI and FBP increased to approximately US$
16, 15 and 15 billion, respectively, this is mainly because of new FDI law, restructuring of
the banking system, and the acceleration of privatisation. Even in the current crisis period -
2006 to 2010-, the accumulated net capital flow in Turkey jumped approximately $US 250
billion. Consistent with the pattern of capital flows in Turkey, FDI, FPI and FBP substantially
increased at the period of 2006-2010, as shown in Table 31.

229 | P a g e
This study aims to reveal relationship among the types of capital flows in Turkey (namely,
FDI, FBP and FPI), while controlling GDP and 2001 financial crisis. In this perspective, my
hypotheses are as follows:
Hypothesis 1: There is significant relationship between FBP and FDI. This is because foreign
bank penetration in most of the host countries record as a FDI in the banking sector. In other
words, to some degree, foreign bank investment involves FDI in a host market.
Hypothesis 2: There is significant causality from the long term investment variables to short
term one. The maturity of FDI and FBP is more than that of FPI. Therefore, direct investors
are likely to obtain relatively deeper information about the political, social, economic
conditions of host markets. I know that obtaining detailed information about the specific
sector(s) of host markets is likely to affect other investors‟ decision. Thus, it is rational to find
causal effect of FDI and FBP on FPI.
My findings from VAR based block exogeneity wald test show that one way causality from
DFBP to DFDI is detected at 5% level. Moreover, the null hypothesis that FPI does not
Granger cause DFBP can be rejected. I also find that FBP appears most exogenous within the
foreign investment variables; DFBP appears to have higher influence than FPI on DFDI in
Turkey; the contribution of DFDI to FPI variability ranges between 0.217% and 9.070%
throughout 12 quarter periods whilst the contribution of DFBP to FPI variability ranges
between 4.755% and 12.451%.

230 | P a g e
Table 31: Capital Flows in Turkey (Million US $)
Period FPI FDI FBP Capital Flow
1994-1999 -468 3208 6972 15365
2000-2005 15146 16130 15438 57467
2006-2010 20313 70831 75317 191549
Source: The Central Bank of the Republic of Turkey and The Banks
Association of Turkey
6.3 Literature Review
Capital flows to most of the developing countries have substantially increased over the last 20
years, except during the current global crisis period. This trend encourages researchers to
investigate the factors that motivate investors to invest abroad and the impact of foreign
investment on the development and the performance of emerging markets. Therefore, rising
capital flows in the world have encouraged researchers to investigate this field either
empirically or theoretically. The impact and determinant of capital flows, specifically FDI
and FPI, have taken considerable attention by researchers.
As a result of deregulation, financial integration and globalisation, the impact of capital flows
on a host market has been investigated, more and more. Rising capital flows to developing
countries are likely to accelerate economic growth rates, this, however, may also trigger
economic or financial crisis as a result of capital flow reversal while Clarke (1996), Claessens
et al. (1995)70
, Grabel (1995)71
underlined the importance of capital flows on the volatility of
host countries financial markets. Liquidity and currency risks of the host country can be
affected dramatically as a result of instant capital outflow. The result of capital outflows can
70
Claessens et al. (1995) use the data of five developing and developed countries. 71
The primary aim of the study of Grabel (1995) is to examine the hypothesis that financial liberalisation tend to
volatile stock markets in six developing economies which are Argentina, Chile, Colombia, Korea, Philippines
and Venezuela.

231 | P a g e
be more tragic if banking system is not developed and lacks a sufficient regulatory
framework. Turkey in 1994 and 2001, Mexico in 1994, Asia in 1997, and Argentina in 2001
can be good examples of this situation. In contrast, Tesar and Warner (1995) and Bakaert
(1995)72
conclude that rising capital flows as a result of financial liberalisation does not
trigger volatility in the finance markets.
In the case of the impact of FPI on the host markets, there is trade-off between its benefits
and costs. This is because while some authors underline the importance of FPI on economic
and financial stability, others blame FPI as the main reason behind the volatility in finance
sectors in the world73
. Nevertheless, authors, who analyse the pattern of FDI, mostly
underline the stability factor of FDI on a host country‟s economy rather than its costs. For
instance, Lipsey (1999 and 2001)74
, Albuquerque (2003)75
and Wei (2001) examine the
stability effect of FDI and FPI on host countries‟ economies and they find that FDI are less
volatile than FPI76
. More recently research is done by Levchenko and Mauro (2007) to
analysis the behaviour of types of capital flows. Their finding is similar to the finding of
Lipsey (1999 and 2001), Albuquerque (2003) and Wei (2001). Regarding foreign bank
penetration, the results of recent empirical and theoretical studies is less complex about the
effect of FBP on financial stability because the majority of researchers underline the
importance of FBP on credit availability and financial stability (see, Haas and van Lelyveld
(2003), Clarke (2006) and Lee (2002)). In line with such findings, Altinkemer (1998) and
72
Tesar and Werner (1995) investigate the effect of U.S. equity flows to 64 emerging economies using annually
data from 1978 to 1991 whereas Bakaert (1995) use the data of nineteen emerging economies between 1985 and
1992. 73
1994 Mexican and 1997 Asian crises can be good example for this situation. 74
Lipsey (1999) is purpose to analysis the pattern of the types of capital flows in US, Japan, Europa, Asia and
Latin America from 1970 to 1996 while Lipsey (2001) only focuses on the volatility of the forms of capital flow
in the three crises which are Latin America, Mexico in 1994 and East Asia in 1997. 75
Albuquerque (2003) aims to model the forms of capital flow under the assumptions of imperfect enforcement
of financial contracts. His model is based on the model is used by Thomas and Worral (1994). The data sample
that used in this paper is from 1975 to 1997. 76
However, Claessens et al. (1995) put forward that FDI is as volatile as other types of international investment.

232 | P a g e
Yeldan (2003) perform the empirical model to identify the impact of capital flows on Turkish
banking sector. They clearly conclude that capital inflows to Turkey increase credit
availability in the market and provide extra financial source to fund additional investment
projects.
To benefit from the direct or indirect advantages of capital flows, governments, initially in
developed countries and then in developing countries, tried to implement some innovative
ways to accelerate foreign investments to their countries. This wave has encouraged
researchers to investigate the determinant of capital flows. In general, the factors that affect
capital flows can be divided into two parts which are push and pull factors. The factors have
been deeply analysed in the literature. The study of Chuhan et al.(1993)77
; Claessens et al.
(1995); Fernandez-Arias (1996); Agenor (1998), Mody et al. (2001) and Ferrucci et al. (2004)
determined the factors that affect the destination of capital flows in the context of two factors
which are the pull and push factors.
Pull factors refer to global motivation factors of capital flow to emerging markets. Such
factors, also called “country specific factors” reflect risk and domestic opportunities in
general (Goldstein et al., 1991). Bekaert (1995) examines the relationship between
investment barriers and market integration in nineteen countries and also investigates whether
the expected return are related to the measure of openness. His finding indicates that
opportunities and risks in the host markets are important factors for attracting foreign
investment.
77
Chuhan et al. (1993) use the date of US capital flows in 9 Latin American and 9 Asian countries between
January 1988 and September 1992.

233 | P a g e
The second is push factors reflecting external determinants. Many authors put forward that
push factors in economic growth, stock price, interest rates, and regulations related to the
foreign investment are likely to be important factors affecting the capital flows originating in
the capital abundant countries. Calvo et al. (1993) point out that the pattern of foreign
investment in U.S. can be explained by push factors such as the decrease in interest rates.
Kim et al. (2004) performed the VAR model to investigate the macroeconomic effects of
capital account liberalisation in Korea. Their finding revealed that regulations on the capital
account transactions are the main determinant of capital flows to Korea. The determinant of
foreign portfolio investment in Turkey is examined by Çulha (2006) between the periods of
1992 and 2005. His finding shows that the rising US interest rate is associated with more and
more foreign portfolio and short-term capital flows. Balkan et al. (2002) aim to examine the
relationship between macroeconomic variables and short term capital flows in Turkey, using
monthly data from 1992 to 2002. Their finding indicates that the rising stock market prices
are associated with higher short term capital flow to Turkey, whereas the ratio of public
sector borrowing requirement to GNP does not have any significant impact on it.
Ruffin and Russekh (1986)78
– examine the hypothesis that US direct investment in
developing countries is a perfect substitute for US portfolio investment and vice versa. Their
finding puts forward that these two forms of capital flows are perfect substitute in developing
countries. Moreover, they concluded that there is no significant effect of multinational
enterprises on the net capital flows. Contrary to the finding of Ruffin and Russekh (1986),
Kant (2010) finds that portfolio investment in developing markets is increased by 54 cent as a
result of increasing one dollar in US direct investment. In other words, relationship between
FDI and FPI is complementary. Feldstein-Horioka (1980) reported that their most striking
78
The primary aim of the study of Ruffin and Russekh (1986) is to investigate linkage between domestic
investment and domestic saving in 21 OECD countries using annually data from 1960 to 1974.
234 | P a g e
finding was that there is no relationship between two types of capital flows - FPI and FDI.
This is because rising FDI by a dollar is associated with declining FPI by a dollar to restore
capital market equilibrium in a domestic market (Froot and Stein, 1991).
Why foreign banks encourage foreign direct investment and foreign portfolio investment is
another important concept. Foreign bank penetration is important for the direct investment of
multination enterprises as well as foreign portfolio investors in developed and developing
countries because foreign banks especially are more willingly to provide credits to foreign
investors than domestic banks and to obtain credit for the short and long term investments in
a host markets is vital in order to realise investment.
Although the impact and determinant of FBP, FDI, and FPI were deeply examined by
researchers, either empirically or theoretically, the linkage between these variables still
remains a puzzle. Meaning that, this paper aims to reveal what the relationship between FBP,
FDI, and FPI in Turkey is using multivariate VAR approach. The analysis can be applied to
any developing country.
The paper adopts a four-stage procedure to test the relationship among foreign investment
variables which are FBP, FDI, and FPI. As an early step, I perform KPSS and ERS point
optimal unit root tests to detect the stationarity of the time series variables, in other words to
detect the integration order of the time series variables. In the second stage, VAR based block
exogeneity wald test is performed in order to obtain information about causal relationship
among the time series variables. Apart from the VAR based block exogeneity wald test, the
variance decomposition technique is also applied.

235 | P a g e
6.4 Data
The data used in this paper are foreign bank penetration (FBP), foreign direct investment
(FDI) and foreign portfolio investment (FPI). The data of such variables are collected from
the Central Bank of the Republic of Turkey and the Banks Association of Turkey. The time
series variables used in the empirical tests of this paper consists of the quarterly for the period
1994Q1 to 2009Q4 which includes 64 observations. The definition of time series variables
are shown below;
FBP: Total assets held by foreign banks in the banking sector. Holding 50% share acquisition
by a foreign bank or foreign investor in a host country is accepted as a minimum requirement
to have an important influence on the management of acquired bank in Turkey. In other
words, acquiring 50% or more shares of domestic bank are recorded as a foreign bank in
most of the countries. However, FDI arises when a foreign investor acquires 10% or more
shares of domestic company and obtains, moreover, managerial control on domestic
company. Therefore, there is a difference between banking FDI and total assets of foreign
banks.
In this paper, I accepted that FBP measured as the total value of foreign bank assets. It is
important to know the relationship between FDI and foreign bank activities before to select
foreign bank assets as a proxy for foreign bank penetration. Nigh et al. (1986) and Goldberg
and Johnson (1990), as expected, found positive relationship between US FDI and foreign
activities of US banks. Similar to Nigh et al. (1986) and Goldberg and Johnson (1990),
Focarelli and Pozzolo (2000) found positive relationship between non-bank FDI and bank
choice of location in the OECD countries. In addition, the study of Miller and Parkhe (1998)

236 | P a g e
reveal that there is correlation between non-bank FDI and bank FDI. Grosse and Goldberg
(1991) and Esperanca and Gulamhussen (2001) used aggregate foreign bank assets while
examining the determinants of foreign bank penetration, same as I used. Lending to the
private sector depends on the supply and demand for loans. As FDI in the banking sector
raises the credit provision to the host market. Thus, this will increase total assets. In other
world, this will increase the size of the balance sheet and therefore FDI affects FBP.
.
FDI: Foreign direct investment is one of the types of international investment. Such
investment arises when a foreign investor acquires 10% or more shares of domestic company
and obtains, moreover, managerial control on domestic company. The variable was also
expressed in its logarithmic transformation.
FPI: Another type of international investment is foreign portfolio investment which arises
when a foreign investor does not have any managerial control on domestic company in a host
country. The raw data of FPI variable were used in the multivariate VAR model to investigate
relationship among the time series variables because some observations for the variable are
negative.
GDP: Nominal GDP is used as a control variable since it is believed that GDP is an important
determinant of FDI, FBP and FPI. The findings of Buch (2000), Brealey and Kaplanis (1996)
and Yamori (1996) Herrero and Peria (2005) underlined that GDP in host countries seems
most important factor that affects the location decision of multinational banks. Similar to
these findings, the study of Luca and Spatafora (2012) implies that rising GDP is associated
with higher capital flows in developing countries.

237 | P a g e
DUM2001: DUM2001 is a dummy variable and used as a control variable since it is believed
that financial crisis in 2001 led to significant changes in the Turkish banking sector.
Figure 25 shows the total assets of foreign banks in Turkey. Between 1994 and 1996, the
growth of foreign bank assets was very small. Although it is difficult to see in Figure 25, 8.5
% quarterly growth was achieved in foreign bank assets between 1996 and 2000, and then
from 2000 to 2003 the growth was negative due to economic and banking crisis. Since the
end of 2003, except Q4-2008, and Q1-2009, foreign bank penetration has accelerated because
of positive macroeconomic indicators, high profitability in the banking sector, new FDI law
and reduction in corporate tax. Figure 26 shows total FDI inflows in Turkey. Until 2000,
Turkey attracted less than US $ 1 billion FDI inflows annually. From 2003 to 2007 high
growth rate been achieved in FDI inflows and in 2007, US $ 22 billion FDI directed to
Turkey but current global crisis has led to dramatic reduction in direct investment to Turkey.
The pattern of FPI is much more volatile relative to that of FDI, especially in Asian crisis in
1997, Russian crisis in 1998, economic crisis in Turkey in 2001 and current global crisis
periods, as seen in Figure 27.

238 | P a g e
Figure 25: Total Assets of Foreign Banks (US Billion $)
Source: The Bank Association of Turkey
Figure 26: Foreign Direct Investment (US Million $)
Source: The Central Bank of the Republic of Turkey
0
10
20
30
40
50
60
70
80
1994 1996 1998 2000 2002 2004 2006 2008
-2,000
0
2,000
4,000
6,000
8,000
10,000
1994 1996 1998 2000 2002 2004 2006 2008

239 | P a g e
Figure 27: Foreign Portfolio Investment (US Million $)
Source: The Central Bank of the Republic of Turkey
6.5 Empirical Modelling and Findings
6.5.1 Unit Root Test
Past papers – Dickey and Fuller (1976 and 1979) - investigate how to test unit root in time
series variables. Then, Phillips and Perron (1988) developed another unit root test which is
called the PP unit root test. However, the early version of such tests has some weaknesses
relative to newly developed unit root tests. Augmented Dickey Fuller (ADF) and Phillips-
Perron (PP) tests have low power when the process is stationary but coefficient of yt-1 in the
regression is close to 1. In addition, when trend adds to the regression in these tests, the
power of these tests reduces therefore, including only constant in the regression has more
power than the test including both the intercept and trend. Because of these disadvantages of
-8,000
-6,000
-4,000
-2,000
0
2,000
4,000
6,000
1994 1996 1998 2000 2002 2004 2006 2008

240 | P a g e
the PP and ADF tests, newly developed and more efficient techniques – KPSS and ERS point
optimal tests – are applied to decide whether the time series variables have unit root or not79
.
Before deciding to perform restricted or unrestricted VAR model, it is pre-request to the test
stationarity of time series variables which was detected by KPSS (Kwiatkowski et al., 1992)
and ERS– Point Optimal (Elliott et al., 1996) unit root tests80
. Whereas the ERS point optimal
test tests the null hypothesis, a time series variable has a unit root, the KPSS test tests the null
hypothesis that the variable is stationary. The KPSS test statistics are calculated as
∑
Where σ2 (q) is a consistent estimate of the long run variance. The lag truncation parameter
is presented by q term. A test of σ2 (q) = 0 is a test to detect whether a time series variable is
stationary or not. T symbol shows the number of observation and s2 is the residual of a
regression (Kwiatkowski et al., 1992).
Another unit root test that I used in this paper is the ERS point optimum. The latter, was
developed by Elliott et al. (1996), is based on the quasi-differencing regression which is
defined as; d (vt|a) = d (zt|a)‟ʯ (a) +et; where d (vt|a) and d (zt|a) are quasi- differenced data
for vt and zt, respectively. Moreover, et is the residual term and ʯ (a) is the coefficient to be
estimated in the quasi-differencing regression. While the null hypothesis tested is α =1, the
alternative hypothesis tested is α= ā where ā = 1-7/T when zt contains only constant, and ā=1-
13.5/T when zt contains both a constant and a trend. The test statistic in the ERS point
79
The conventional PP and ADF tests are still most popular unit root test in macroeconomic and financial
modelling, despite these disadvantages of the conventional PP and ADF tests. 80
To get further information about these unit root test (see, Kwiatkowski et al., 1992 and Elliott et al., 1996).

241 | P a g e
optimum to test Ho is defined as; PT = (SSR (ā) – (ā) SSR (1)) / fo where fo, at frequency
zero, is an estimator for the error spectrum.
Table 32: Unit Root Test for the Variables of FBP, FDI and FPI
ERS Point Optimal a KPSS
b
C C & T C C & T
FBP 81.944 38.850 0.883 0.162
DFBP 0.747*** 2.685*** 0.230*** 0.0773***
FDI 11.037 6.242* 0.889 0.155
DFDI 0.674*** 3.461*** 0.0442*** 0.0447***
FPI 0.799*** 2.90*** 0.138*** 10.487***
DFPI NA NA NA NA
Note: C and C&T denote constant and constant and trend, respectively. D initial
letter denotes the first difference of time series variables. The integration order for
the logged GDP is one using ERS Point Optimal and KPSS tests. The finding
regarding GDP is not shown in Table 32 because the aim of the paper only
investigates relationship among types of capital flows and the variable used as a
control variable.
***, **, and * denote statistically significant at 0.01, 0.05, and 0.10 levels,
respectively. a
including only constant, one-sided test of the Ho that the variable has unit root;
critical values are equal to, 4.008, 3.023, and 1.900 at 10%, 5%, and 1% levels,
respectively . a
including a constant and a trend, one-sided test of the Ho that the variable has
unit root; critical values are equal to 6.777, 5.689, and 4.235 at 10%, 5%, and 1%
levels, respectively. b including only constant, one-sided test of the Ho that the variable is stationary;
critical values are equal to, 0.347, 0.463, and 0.739 at 10%, 5%, and 1% levels,
respectively. b
including a constant and a trend, one-sided test of the Ho that the variable is
stationary; critical values are equal to 0.119, 0.146, and 0.216 at 10%, 5%, and 1%
levels, respectively.
Table 32 displays the outcome of the KPSS and ERS point optimal tests at levels and first
differences to find out the order of integration for FBP, FDI and FPI variables in Turkey.
These tests for the levels and first differences are performed with only constant and with a
constant and a trend. For the first variable –FBP-, integration of order zero I (0) is not found
because the calculated KPSS test statistics which are 0.883 (the model with an intercept) and

242 | P a g e
0.162 (the model with trend and intercept) are greater than 5% critical values of 0.463 (the
model with an intercept) and 0.146 (the model with trend and intercept), respectively. The
result of the ERS point optimum test is in line with the result of the KPSS test in both cases;
(1) the model with an intercept and (2) the model with an intercept and a trend. Therefore, the
variable has unit root at the integration of zero order. At the first difference, I (1) of FBP,
both t-statistics (with only intercept and trend and intercept) are less than critical values at 1%
and 5% levels. Thus, the null hypothesis of nonstationarity can be rejected and the variable is
integrated of order 1 for all tests. This situation is not different for FDI variable. However,
both results of KPSS and ERS point optimal tests also indicate that the level of FPI seems
stationary in both cases; (1) the model with an intercept and (2) the model with an intercept
and a trend. Therefore, in multivariate VAR models, the first difference of FBP and FDI is
used whereas the level of FPI is used.
6.5.2 Block Exogenous Wald Test
The main purpose of this study is to investigate relationship among foreign investment
variables which are FBP, FDI and FPI. Therefore, information can be gathered by performing
a multivariate vector autoregressive (VAR) model. The VAR model is useful to analyse the
behaviour of economic and financial time series. Simply, such a model provides a
multivariate framework where for example, change in variable A are related to change in
lagged values of the variables of B and C and its own lagged values. Therefore, The VAR
model for three time series variables can be written as:

243 | P a g e
eq.(1);
DFBPt =β1 + ∑ + ∑
+∑
∑
+
∑ + et
eq.(2);
DFDIt =β2 + ∑ + ∑
+∑
∑
+
∑ + et
eq.(3);
FPIt =β3 + ∑ + ∑
+∑
∑
+
∑ + et
Where n denotes the numbers of lag which were determined by the information criterions, β1-
3, α1-3, ν1-3, ∞1-3 and ρ1-3 are parameters for estimation, and et and ut are residual terms. I
detect whether there is causal relationship among the variables using the VAR Granger
causality technique. For each equation, the chi-square statistic from the block exogenous
wald test indicates whether a dependent variable can be treated as exogenous.
I detect whether there is causal relationship among the foreign investment variables using the
block exogenous wald test, while controlling DGDP and 2001 financial crisis. The primary
criteria to perform VAR Granger causality test is to have stationary variables because if the
time series variables have a unit root, the Wald (χ2) test statistic will be worthless and VAR

244 | P a g e
stability will not meet. Therefore, in the multivariate VAR models, the first differences of
FDI and FBP variables are used whereas the level of FPI variable is used. Therefore, the
primary criterion for performing the VAR model is achieved.
This paper employs the block exogeneity wald test to examine the short run causal
relationships among the foreign investment variables which are FDI, FBP and FPI after
controlling GDP and 2001 financial crisis. The results regarding the short run causal
relationships presented in Table 33 are based on the Chi-square and Probabilities. I test
whether there is causality from DFDI and FPI to DFBP in the first model, controlling DGDP
and periodic dummy (DUM2001) variables. Table 33 mirrors that there is unilateral causality
which runs from FPI to DFBP at 5% level, implies that the changes in FPI significantly lead
to changes in DFBP in Turkey. I, however, failed to find from the investments of
multinational corporations in Turkey to foreign bank penetration. The finding in the first
model is interesting because foreign bank penetration in most of the host countries records as
a FDI. In other words, to some degree, foreign bank investment involves FDI in a host
market. This finding may indicate the lack of relationship among the sub categories of FDI
which are service, manufacturing and agriculture FDI. The finding of Brouthers and
Brouthers (2003) is in line with my finding. They put forward that the entry mode of
manufacturing and service FDI can change independently and these sub-categories of FDI
can react differently when transaction cost, risk and trust factors change in a host market.
In the 2nd equation, I investigate whether DFBP Granger cause DFDI and (ii) whether DFPI
Granger cause DFDI. The null hypothesis that DFBP does not Granger cause DFDI can be
rejected with a χ2
= 12.957 (p-value = 0.001) at 5% level, indicating that changes in DFBP
significantly lead to changes in DFDI in Turkey. This result mirrors how foreign bank

245 | P a g e
penetration is important for the direct investment of multination enterprises in Turkey.
Foreign banks, especially in developing markets, are more willingly to provide credits to
foreign companies than domestic banks and to obtain credit for the investment of
multinational enterprises in a host markets is vital in order to realise investment. Therefore, it
is rational to find causal relationship from DFBP to DFDI. Surprisingly, FPI does not
Granger cause DFDI with a χ2
= 1.601 (p-value = 0.448). I also test whether there is causality
from DFDI and DFBP to FPI in the third model. I, however, fail to find any causal
relationship in this model, meaning that changes in DFDI and DFBP do not significantly lead
to any changes in FPI. This may be because of differences in definition between short-term
capital flows and long-term capital flows.
Table 33: Block Exogeneity Wald Test for the Variables of FBP, FDI and FPI
Short-run Relationship
Ind. Dep.
DFBP Df
DFDI [3.737] (0.443) 4
FPI [10.036] (0.039)** 4
All [47.270] (0.000)*** 16
DFDI Df
DFBP [10.513] (0.033)** 4
FPI [6.438] (0.168) 4
All [56.056] (0.000)*** 16
FPI Df
DFBP [3.722] (0.445) 4
DFDI [3.681 (0.451) 4
All [13.846] (0.610) 16
Notes: Dep. and Ind. denote dependent and independent variables, respectively. FBP
and FDI time series variables are in first differences. The numbers in [-] and (-) are
chi-squares and probabilities, respectively. ***, ** and * denote statistically
significant at the 1%, 5% and 10% levels, respectively. Df denotes degree of
freedom. The optimal lag for multivariate VAR model is selected by sequential
modified LR test statistic, Akaike and Schwarz information criterion. The result of
diagnostics tests such as autocorrelation LM, heteroskedasticity tests and the inverse
roots of AR characteristic polynomial, are reported in Table 34-35 in the appendix,
are found to be satisfactory. Since the aim of this paper is to investigate the
relationship between DFDI, FPI and DFBP, the possible causal impacts of control
variables on the types of capital slow are not presented in Table 32.

246 | P a g e
6.5.3 Variance Decomposition
The VAR based block exogeneity wald test provides information about the causality
relationship among the time series variables. However, such test does not provide any
information about how significant the causal effects that represented in Table 33 is and how
the effect changes over time. Such information is provided by the variance decomposition.
The information about each shock (innovation) to the dependent variable is provided by the
variance decomposition which is also called “forecast error variance decomposition”. Table
34 reports the variance decomposition of each variable over a twelve quarter period. I apply
the variance decomposition technique to get information about the percentage of the
movement in the endogenous variables that are because of their own innovations, against
innovations to the other variables. In other words, the technique is performed to test
exogeneity of variables (Pesaran and Shin, 1998). I report only the results in 1st, 6
th and 12
th
quarters. The result from such a technique indicates that; while the DFDI innovations explain
5.689% forecast error variance of DFBP at the 12 quarter horizon, the shock to DFBP is only
explained by FPI (0.445%) in model. Meaning that, FDI in Turkey contributed relatively
more to FBP but foreign bank penetration seems exogenous. In other words, FDI and FPI
have little explanatory power for the evolution of FBP in Turkey.

247 | P a g e
Table 34: Variance Decomposition
Variance Decomposition of DFBP:
Period DFDI DFBP FPI
1 0.000 86.354 13.645
6 9.285 45.863 30.065
12 5.689 93.865 0.445
Variance Decomposition of DFDI
Period DFDI DFBP FPI
1 97.735 2.085 0.179
6 53.150 19.970 9.934
12 50.470 21.937 9.988
Variance Decomposition of FPI:
Period DFDI DFBP DFPI
1 0.000 0.000 100.000
6 7.708 7.818 80.311
12 9.122 7.611 77.970
Notes: FBP, FDI and GDP time series variables are
in first differences. Since the aim of this paper is to
investigate the relationship between DFDI, FPI and
DFBP, the contribution of DGDP and DUM2001 to
the variability of DFDI, FPI and DFBP and the
reverse contributions are not presented in Table 34.
Standard Errors: Monte Carlo (1000 repetitions)
The shock to DFDI is influenced by DFBP (21.937%) at 12 quarter period, but the shock to
DFDI is only accounted for 9.988% of variation in FPI. Therefore, DFBP appears to have
higher influence than FPI on DFDI in Turkey. This may be because of similarity in definition
between DFBP and DFDI and this is consistent with the finding of the block exogeneity wald
test (see Table 33). The final variance decompositions, those for FPI, are also reports in Table
34. The contribution of DFDI to FPI variability ranges between 0.000% and 9.122%
throughout 12 quarters while the portion of DFBP shock in the variance of FPI in 1 and 12
quarters are 0.000% and 7.611%, respectively, indicating that the effect of DFDI and DFBP
on FPI in the long run is larger than that in the short run. Thus, foreign bank penetration
appears to be more important relative to FPI on DFDI in Turkey.

248 | P a g e
6.6 Conclusion
Using a multivariate VAR approach and block exogeneity wald and variance decomposition
tests, the paper investigated the short run dynamic relations between FBP, FDI and FPI, after
controlling GDP and 2001 financial crisis. The time series variables are based on quarterly
data from 1994Q1 to 2009Q4. To detect whether the time series variables have unit root or
not, I perform KPSS and ERS point optimal tests. The findings from such tests indicate that
FBP and FDI are integrated with order one whereas FPI is integrated of order zero.
The results regarding the block exogeneity wald test indicate that there is bilateral causality at
5% level runs from FPI to DFBP, implying that changes in short-term investments of foreign
investors significantly lead to changes in the assets of foreign banks in Turkey. Moreover,
another causal relationship is detected from DFBP to DFDI, implying that changes in the
assets of foreign banks significantly lead to changes in direct investments of multinational
enterprises in Turkey. This is because the lion share of DFDI in the banking sector involves
foreign bank assets in Turkey.
To obtain information about the each shock (innovation) to the dependent variable, the
variance decomposition technique was employed. The result from such technique indicated
that; direct investments of multinational enterprises in Turkey contributed relatively more to
foreign bank penetration but such variable seems most exogenous within three foreign
investment variables. Therefore, DFDI and FPI have little explanatory power for the
evolution of DFBP in Turkey. The finding of variance decomposition also shows that in
Turkey the influence of DFBP to the variability of DFDI is more than that of FPI. Moreover,

249 | P a g e
my finding indicated that the contribution of DFDI to FPI variability ranges between 0.000%
and 9.122% throughout 12 quarter periods whilst the contribution of DFBP to FPI variability
ranges between 0.000% and 7.611%.

250 | P a g e
6.7 References
[1] Albuquerque, R. (2003). "The Composition of International Capital Flows: Risk Sharing
Through Foreign Direct Investment." Journal of International Economics 61: 353–383.
[2] Altınkemer, M. (1998). Capital Inflows and Central Bank‟s Policy Response. R.
Department. Ankara, Central Bank of the Republic of Turkey.
[3] Aqeel, A. and M. Nishat (2004)."The Determinants of Foreign Direct Investment in
Pakistan."The Pakistan Development Review 43(4): 651-664.
[4] Asiedu, E. (2006). "Foreign Direct Investment in Africa: The Role of Government Policy,
Institutions and Political Instability." World Economy 29(1): 63-77.
[5] Balkan, E., F. G. Bicer, et al. (2002). Patterns of Financial Capital Flows and
Accumulation in the Post-1990 Turkish Economy. the IDEAS session at METU International
Conference on Economics. Ankara.
[6] Bandera, V. N. and J. T. White (1968)."U.S. Direct Investments and Domestic Markets in
Europe."Economia Internazionale 21: 117–133.
[7] Barrell, R. and N. Pain (1996)."Domestic Institution, Agglomeration and Foreign Direct
Investment in Europe."European Economic Review 43: 29-45.

251 | P a g e
[8] Bekaert, G. (1995). "Market Integration and Investment Barriers in Emerging Equity
Markets."The World Bank Economic Review 9(1): 75-107.
[9] Brouthers, K. D. and L. E. Brouthers (2003). "Why Service and Manufacturing Entry
Mode Choices Differ: The Influence of Transaction Cost Factors, Risk and Trust." Journal of
Management Studies 40(5): 1179–1204.
[10] Calvo, G., L. Leiderman, et al. (1993). "Capital Inflows and the Real Exchange Rate
Appreciation in Latin America: The Role of External Factors." IMF Staff Papers 40(1): 108-
151.
[11] Chuhan P., S. Claessens, et al. (1993). "Equity and Bond Flows to Asia and Latin
America." The World Bank, Policy Research Working Papers No. 1160.
[12] Claessens, S., M. Dooley, et al. (1995). "Portfolio Capital Flows: Hot or Cool?" The
World Bank Economic Review 9(1): 153-174.
[13] Claessens, S., D. P. Michael, et al. (1995). "Portfolio Capital Flows: Hot or Cold?" The
World Bank Economic Review 9(1): 153-174.
[14] Clarke, R. (1996). "Equilibrium Interest Rates and Financial Liberalisation in
Developing Countries."Journal of Development Studies 32(3): 391-413.
[15] Cuddington, J. T. (1987). "Capital Flight "European Economic Review 31: 382-388.

252 | P a g e
[16] Çulha, A. (2006). "A Structural VAR Analysis of the Determinants of Capital Flows into
Turkey." BRT Research and Monetary Policy Department Working Papers No: 06/05.
[17] Erinç, Y. (2003). Küresellesme Sürecinde Türkiye Ekonomisi Bölüsüm, Birikim ve
Büyüme. Istanbul, Iletisim Yayinlari.
[18] Esperanca, J. P. and M. A. Gulamhussen (2001). “(Re)Testing the „Follow the
Customer‟ Hypothesis in Multinational Bank Expansion.” Journal of Multinational Financial
Management 11(3): 281-293.
[19] Feldstein, M. and C. Horioka (1980). "Domestic Saving and International Capital
Flows." Economic Journal 90: 314-329.
[20] Fernandez-Arias, E. (1996). "The New Wave of Private Capital Inflows: Push or Pull?
."Journal of Development Economics 48(2): 389-418.
[21] Ferrucci, G., V. Herzberg, et al. (2004). "Understanding Capital Flows to Emerging
Market Economies."BoE Financial Stability Review.
[22] Froot, K. and J. Stein (1991). "Exchange Rates and Foreign Direct Investment: An
Imperfect Markets Approach." Quarterly Journal of Economics 56: 1191-1219.
[23]Goldberg, L.G. and D. Johnson (1990). “The Determinants of US Banking Activity
Abroad.” Journal of International Money and Finance 9: 123-137.

253 | P a g e
[24] Goldstein, M., D. J. Mathieson, et al. (1991)."Determinants and Systemic Consequences
of International Capital Flows."IMF Research Department, Determinants and Systemic
Consequences of International Capital Flows.Occasional Paper 77. Washington, D.C.:
International Monetary Fund.
[25] Grabel, I. (1995). "Assessing the Impact of Financial Liberalisation on Stock Market
Volatility in Selected Developing Countries."Journal of Development Studies 31(6): 903-917.
[26] Grosse, R. and L. Goldberg (1991). “Foreign Activity in the United States: An Analysis
by Country of Origin.” Journal of Banking and Finance 15(6): 1092-1112.
[27] Grosse, R. and L. J. Trevino (1996). "Foreign Direct Investment in the United States: An
Analysis by Country of Origin." Journal of International Business Studies 27: 139-155.
[28] International Monetary Fund (2011). “Recent Experiences in Managing Capital Inflows-
-Cross-Cutting Themes and Possible Policy Framework.” Washington, DC.
[29] Kim, S., S. H. Kim., et al. (2004). "Macroeconomic Effects of Capital Account
Liberalization: The Case of Korea." Review of Development Economics 8(4).
[30] Kwiatkowski, D., P.Phillips, et al. (1992). "Testing the Null Hypothesis of Stationary
against the Alternative of a Unit Root: How Sure are we that Economic Time Series have a
Unit Root?" Journal of Econometrics 54: 159-178.

254 | P a g e
[31] Levchenko, A. and P. Mauro (2007). "Do Some Forms of Financial Flows Help Protect
from Sudden Stops?" World Bank Economic Review 21: 389–411.
[32] Lipsey, R. E. (1999). "The Role of Foreign Direct Investment in International Capital
Flows."NBER Working Paper7094: Cambridge, MA.
[33] Lipsey, R. E. (2001). "Foreign Direct Investors in Three Financial Crises "NBER
Working Paper8084: Cambridge, MA.
[34] Miller, S. R. and A. Parkhe (1998). “Patterns of Expansion of U.S. Banks‟ Foreign
Operations.” Journal of International Business Studies 29(2): 359-390.
[35] Mlambo, K. (2006). "Reviving Foreign Direct Investments in Southern Africa:
Constraints and Policies."African Development Review 17(3): 552-579.
[36] Mody, A., M. P. Taylor, et al. (2001). "Modeling Economic Fundamentals for
Forecasting Capital Flows to Emerging Markets." International Journal of Finance and
Economics6(3): 201-216.
[37] Nigh, D., Cho, K. R. and S. Krishnan (1986). “The Role of Location-Related Factors in
U.S. Banking Involvement Abroad: An Empirical Examination.” Journal of International
Business Studies 17: 59-72.

255 | P a g e
[38] Pierre-Richard, A. (1998). "The Surge in Capital Flows: Analysis of „Pull‟ and „Push‟
Factors." International Journal of Finance and Economics 3: 39-57.
[39] Reinhart, C., G. Calvo, et al. (1996). "Inflows of Capital to Developing Countries in the
1990s."Journal of Economic Perspectives 10(2): 123-139.
[40] Ruffin, R. and F. Rassekh (1986)."The Role of Foreign Direct Investment in US Capital
Outcomes."American Economic Review: 1126-1130.
[41] Schmitz, A. and J. Bieri (1972)."EEC Tariffs and U. S. Direct Investment."European
Economic Review 3: 259 – 270.
[42] Taylor, M. P. and L. Sarno (1999). "Capital Flows to Developing Countries: Long and
Short-Term Determinants." World Bank Economic Review11(3): 451-470.
[43] Tesar, L. and I. M. Werner (1995)."U.S. Equity Investment in Emerging Stock
Markets."The World Bank Economic Review 9(1): 109-129.
[44] Thomas, J. and T. Worral 1994. “Foreign Direct Investment and the Risk of
Expropriation” Review of Economics Studies 61: 81–108.
[45] Trevino, L., J. J. D. Daniels, et al. (2002). "Market Reform and Foreign Direct
Investment in Latin America: Evidence from an Error Correction Model." International Trade
Journal 16(4): 367-392.

256 | P a g e
[46] Veugelers, R. (1991). "Locational Determinants and Rankings of Host Countries: An
Empirical Assessment." Kyklos 44(3): 363-382.
[47] Wei, S. (2001). "Domestic Crony Capitalism and International Fickle Capital: Is There a
Connection?" International Finance 4(1): 15-45.
[48] Wheeler, D. and A. Mody (1992). "International Investment Location Decisions: the
Case of U.S. Firms." Journal of International Economics 33: 57-76.
[49] Yorukoglu, M. and M. Kilinc (2012). “Globalisation of the Interaction between Fiscal
and Monetary Policy.” Fiscal Policy, Public Debt and Monetary Policy in Emerging Market
Economies 67: 335-350.
[50] Zhang, H. K. (2008). "What Attracts Foreign Multinational Corporations to China?"
Contemporary Economic Policy 19(3): 336-346.

257 | P a g e
6.8 Appendix
Table 35: Autocorrelation LM Tests
Null Hypothesis: no serial correlation at lag
order h
Lags LM-Stat Prob
4 28.392 0.290
Probs from chi-square with 9 df.
Table 36: VAR Residual Heteroskedasticity Tests
No cross terms (only levels and squares)
Chi-sq Prob df
515.335 0.771 540
Note: Df denotes degree of freedom.
-1.5
-1.0
-0.5
0.0
0.5
1.0
1.5
-1.5 -1.0 -0.5 0.0 0.5 1.0 1.5
Inverse Roots of AR Characteristic PolynomialFigure 28: Inverse Roots of AR Characteristic Polynomial

258 | P a g e
6.8.1 Data Appendix
This appendix describes the data source used in my empirical models. The time series
variables used in the models are shown below;
6.8.1.1 FBP
» Definition: Total assets held by foreign banks in the banking sector. Holding 50% share
acquisition by a foreign bank or foreign investor in a host country is accepted as a minimum
requirement to have an important influence on the management of acquired bank in Turkey.
In other words, acquiring 50% or more shares of domestic bank are recorded as a foreign
bank in most of the countries.
» Source: The Banks Association of Turkey (2011), the data are available at 20.12.2010
https://www.tbb.org.tr/en/banks-and-banking-sector-information/data-query-
system/financial-tables/41
» Measure: In this paper, I accepted that foreign bank penetration measured as the total value
of foreign bank assets. Because the total value of foreign bank assets holds the lion shares of
banking FDI. As I did, Grosse and Goldberg (1991) and Esperanca and Gulamhussen (2001)
are used aggregate foreign bank assets while examining the determinants of foreign bank
penetration. The variable was expressed in its logarithmic transformation.
» Period: The FBP variable used in the empirical tests of this paper consists of the quarterly
for the period 1994Q1 to 2009Q4 which includes 64 observations.

259 | P a g e
6.8.1.2 FDI
» Definition: Foreign direct investment is one of the types of international investment. Such
investment arises when a foreign investor acquires 10% or more shares of domestic company
and obtains, moreover, managerial control on domestic company. The variable was also
expressed in its logarithmic transformation.
» Source: the Central Bank of the Republic of Turkey (2012), the data was available at
10.11.2010
http://evds.tcmb.gov.tr/yeni/cbt-uk.html
» Measure: The FDI variable was expressed in its logarithmic transformation.
» Period: The FDI variable used in the empirical tests of this paper consists of the quarterly
for the period 1994Q1 to 2009Q4 which includes 64 observations.
6.8.1.3 FPI
» Definition: Foreign portfolio investment arises when a foreign investor does not have any
managerial control on domestic company in a host country.
» Source: the Central Bank of the Republic of Turkey (2012), the data was available at
10.11.2010
http://evds.tcmb.gov.tr/yeni/cbt-uk.html
» Measure: The raw data of FPI variable were used in the multivariate VAR model to
investigate relationship among the time series variables because some observations for the
variable are negative.

260 | P a g e
» Period: The ERR variable used in the empirical tests of this paper consists of the quarterly
for the period 1994Q1 to 2009Q4 which includes 64 observations.
6.8.1.4 GDP
» Definition: Nominal GDP is used as a control variable since it is believed that GDP is an
important determinant of FDI, FBP and FPI. The findings of Buch (2000), Brealey and
Kaplanis (1996) and Yamori (1996) Herrero and Peria (2005) underlined that GDP in host
countries seems most important factor that affects the location decision of multinational
banks. Similar to these findings, the study of Luca and Spatafora (2012) implies that rising
GDP is associated with higher capital flows in developing countries.
» Source: The Central Bank of the Republic of Turkey (2011), the data was available at
05.08.2013
http://evds.tcmb.gov.tr/yeni/cbt-uk.html
» Measure: The GDP variable was expressed in its logarithmic transformation.
» Period: The GDP variable used in the empirical tests of this paper consists of the quarterly
for the period 1994Q1 to 2009Q4 which includes 64 observations.
6.8.1.5 DUM2001
» Definition: DUM2001 is a dummy variable and used as a control variable since it is
believed that financial crisis in 2001 led to significant changes in the Turkish banking sector.
» Source: The dummy variable is generated by the author.
» Measure: The raw data were used.

261 | P a g e
» Period: The DUM2001 variable used in the empirical tests of this paper consists of the
quarterly for the period 1994Q1 to 2009Q4 which includes 64 observations.