Embed Size (px)
Citation preview

Private Equity and Long-Run Investment:
The Case of Innovation
Josh Lerner, Morten Sorensen, and Per Stromberg*
June 2010
Abstract: A long-standing controversy is whether LBOs relieve managers from short-
term pressures from public shareholders, or whether LBO funds themselves sacrifice
long-term growth to boost short-term performance. We examine one form of long-term
activities, namely investments in innovation as measured by patenting activity. Analyzing
472 LBO transactions, we find no evidence of any subsequent decrease in these activities.
LBO firm patents are more cited (a proxy for economic importance), show no shifts in
the fundamental nature of the research, and become more concentrated in important areas
of companies' innovative portfolios. These findings are inconsistent with the hypothesis
that LBOs sacrifice long-run investments.
* Harvard University and National Bureau of Economic Research; Columbia University, NBER, and SIFR;
and Stockholm School of Economics, SIFR, CEPR, and NBER. We thank Geraldine Kim, Jodi Krakower,
Sanjey Sivanesan, and especially Sarah Woolverton for assistance with this project. The World Economic
Forum and Harvard Business School’s Division of Research provided financial support for this research.
We are grateful for helpful comments from participants in the American Economic Association, European
Finance Association, NBER Summer Institute, and Western Finance Association meetings, the World
Economic Forum “Global Economic Impact of Private Equity” project, and various seminar participants,
especially Bronwyn Hall, Laura Lindsey, Paul Oyer, Mark Schankerman and John van Reenen. Many
thanks also to Campbell Harvey (the editor) and two anonymous referees, whose comments greatly
improved the paper. All errors and omissions are our own.
2
Introduction
In his influential 1989 paper, “The Eclipse of the Public Corporation,” Michael
Jensen predicted that the leveraged buyout would emerge as the dominant corporate
organizational form. With its emphasis on corporate governance, concentrated ownership,
monitoring by active owners, strong managerial incentives, and efficient capital structure,
he argued that the buyout is superior to the public corporation with its dispersed
shareholders and weak governance. These features enable LBO managers to add value
more effectively and make long-run investments without catering to the public market’s
demands for steadily growing quarterly profits, which Stein (1988) and others argue can
lead firms to myopically sacrifice such expenditures.1 In this case, it would not be
surprising that the efficiency of R&D expenditures improves after buyouts, consistent
with the suggestions of Hall (1990).
These claims excited much debate in subsequent years. Critics questioned the
extent to which private equity creates value, suggesting that funds’ profits are instead
driven by favorable tax treatment of corporate debt, inducing senior executives of
publicly traded firms to accept deals that go against the interests of the shareholders, or
abrogating explicit and implicit contracts with workers (e.g., Shleifer and Summers
(1988) and, for a more popular view, Kosman (2009)). More specifically, they queried
whether private equity-backed firms actually focus on adding value and take a longer-run
perspective than their public peers, pointing to practices such as special dividends and
“quick flips”—that is, initial public offerings (IPOs) of firms soon after a private equity
3
investment—that enable private equity groups to extract fees and raise new funds more
quickly.
Ultimately, the nature of the changes in corporate time horizons associated with
private equity transactions is an empirical question. In this paper, we present evidence
about one form of long-run investment, namely changes in innovative investments around
the time of private equity transactions. This presents an attractive arena to examine these
issues for a number of reasons. R&D expenditures have typical features of long-run
investments. Their costs are expensed immediately, yet their benefits are unlikely to be
observed for several years: several studies of managerial “myopia” (e.g., Meulbroek, et
al. (1990)) have examined R&D expenditures for this reason. Second, an extensive body
of work about the economics of technological change documents that patenting activity
and the characteristics of patents reflect the quality and extent of firms’ innovations,
allowing us to measure firms’ innovative output rather than merely R&D expenditures.
Since not all research expenditures are well spent, and some critics of major corporations
(e.g., Jensen (1993)) suggest that many corporate research activities are wasteful and
yield a low return, changes in R&D expenditures would be more difficult to interpret.
While the literature acknowledges that patents are not a perfect measures of innovation—
for example, many inventions are protected as trade secrets—the use of patents as a
measure of innovative activity is widely accepted. Moreover, unlike many other measures
of corporate activity, patents are observable for both public and privately-held firms,
which is important when studying private equity transactions. Finally, our focus is
consistent with the argument of Zingales (2000) that more emphasis should be devoted to
issues that go beyond firms’ investments in physical assets.

4
We examine the changes in patenting behavior of 472 firms with at least one
successful patent application filed in the period from three years before to five years after
being part of a private equity transaction. Throughout this paper, when we refer to private
equity transactions or investments, we are referring to equity investments by
professionally managed partnerships that are leveraged buyouts or other equity
investments with a substantial amount of associated indebtedness. Our main finding is
that firms pursue more influential innovations, as measured by patent citations, in the
years following private equity investments. Firms display no deterioration in their
research, as measured either by patent “originality” or “generality,” and the level of
patenting does not appear to change after these transactions. We find some evidence that
patent portfolios become more focused in the years after private equity investments. The
increase in patent quality is greatest in the patent classes where the firm has been focused
historically and in the classes where the firm increases its patenting activity after the
transaction. The patterns are robust to a variety of specifications and controls.
Collectively, these findings are largely inconsistent with the hypothesis that private
equity-backed firms sacrifice long-run investments. Rather, private equity investments
appear to be associated with a beneficial refocusing of firms’ innovative portfolios.2
One limitation is that we cannot formally distinguish whether private equity
investors cause these changes or selectively invest in firms that are ripe for an
improvement in innovative activity. We do not have an instrumental variable to help us
resolve the causation question. However, our findings related to the timing of the changes
and the predominantly “old economy” nature of the firms in our sample suggest that

5
selection plays a relatively minor role in our results. Nonetheless, this alternative
interpretation should be kept in mind below.
There are two main related literatures. A number of studies consider the impact of
leverage, which is a prominent feature of private equity investments, on innovation.
These studies typically examine publicly traded firms with differing debt levels and reach
somewhat ambiguous conclusions. There is a clear association between greater leverage
and lower levels of R&D spending, as documented by Hall’s (1992) examination of over
1,200 manufacturing firms and Himmelberg and Petersen’s (1994) more targeted study of
170 small high-technology firms. However, the direction of causality is unclear. It is
difficult to determine whether debt leads to R&D reductions or if struggling firms simply
have more debt and less spending on innovation. Hao and Jaffe (1993), who carefully
grapple with this question, conclude that more debt reduces R&D spending only for the
smallest firms. For larger firms, the causal relationship is ambiguous. Recently,
Atanassov, et al. (2007) examine the relation between capital structure and patenting
activity. They find that firms relying primarily on bank financing have fewer and less-
cited patents compared to firms relying on outside equity or bond financing. They
interpret this as evidence that banks are less able to evaluate novel technologies and
therefore discourage investment in innovation.
A second set of papers examines the impact of leveraged buyouts on innovative
activity generally. Focusing on buyouts of manufacturing firms during the 1980s, Hall
(1990) looks at 76 public-to-private transactions, i.e., transactions where a publicly traded
firm is purchased and taken private. She finds that the impact of these transactions on
6
cumulative innovation is likely slight. While these firms represent four percent of
manufacturing employment in 1982, they only account for one percent of the R&D
spending. Lichtenberg and Siegel (1990) examine 43 LBOs during the 1980s where the
firms participate in the Bureau of the Census’s survey about research activities prior to
and after the transaction. They find that these firms increase research spending after the
LBO, both on an absolute basis and relative to their peers.
There are a several reasons to revisit the questions in the earlier studies. The
private equity industry is more substantial today than it was in the 1980s. This growth not
only means that we have a larger sample, but changes in the industry–such as the
increased competition between and greater operational orientation of private equity
groups–suggest that the earlier relationships may no longer hold. In addition, transactions
involving technology-intensive industries have become more common recently. It is also
desirable to look beyond public-to-private transactions, since these transactions represent
a fairly small fraction of the private equity universe.3 Finally, the digitization of patent
records in the past two decades has substantially enhanced our ability to measure and
study the impact on innovation.
The plan of the paper is as follows. In Section 2, we describe the construction of
the data-set. Section 3 reviews the methodology employed in the study. We present the
empirical analyses in Section 4. The final section concludes the paper and discusses
future work.

7
I. The Sample
A. Identifying Private Equity Transactions
To identify private equity investments, we start from the Capital IQ database.
Since 1999, Capital IQ has been specialized in tracking private equity deals on a world-
wide basis. Through extensive research, it attempts to “back fill” information about
investments prior to this period.4
Our starting point is the universe of transactions in Capital IQ that closed between
January 1980 and December 2005. We eliminate two types of transactions. First, Capital
IQ contains some transactions by private equity groups that did not entail the use of
leverage. Capital IQ captures a considerable number of venture capital investments by
traditional venture funds, and many buyout groups made some venture capital
investments in the late 1990s. Hence, we eliminate transactions that are not classified in
the relevant categories (which involve the phrases “going private,” “leveraged buyout,”
“management buyout,” “platform,” or slight variants of these). Second, the data contain a
number of transactions that do not involve a financial sponsor (i.e., a private equity firm),
and we eliminate these deals as well. While transactions in which a management team
takes a firm private using their own resources and/or bank debt are interesting, they are
not the focus of this study. We also remove investments by private equity groups in
companies that remain traded in public markets after the transaction (called PIPEs). After
these eliminations, the data contain approximately eleven thousand transactions.
We supplement the Capital IQ data with data from Dealogic, another data vendor.
The Dealogic data often contain more comprehensive information about the
8
characteristics of the transactions, such as the multiple of earnings paid and the capital
structure employed. It also frequently records information about alternative names of the
firms, add-on acquisitions, and exits (i.e., when the private equity fund divests the
portfolio company, typically by selling the company or taking it public), which are useful
for matching the data to patent records. Finally, we use a variety of databases, including
Capital IQ, SDC VentureXpert, Dealogic, and compilations of news stories, to identify
the characteristics of the transactions and the nature of the exits.
B. Capturing Patent Data
We restrict our sample to firms with at least one successful patent application
from three years before the transaction to five years afterwards. We match the firms
involved in buyout transactions to their patenting records based on their name and
location. To do this, we employ the Harvard Business School (HBS) patent database. The
HBS data contain all electronic records of the U.S. Patent and Trademark Office
(USPTO) through May 2007, but these records have been researched and consolidated,
which is important, since the names of assignees in the original USPTO database are
riddled with misspellings and inconsistencies.5 We search the HBS database for each of
the firms, using both the original name and any alternative names from Dealogic. The
firms’ location is contained in Capital IQ, and the patent data contain the location of both
the inventor(s) and the entity to which the patent is assigned at the time of issue, which is
typically the inventor’s employer. There are ambiguous situations where the names are
similar, but not exactly identical, or where the location of the patentee differs from the
records of Capital IQ. In these cases, we research the potential matches, using historical
9
editions of the Directory of Corporate Affiliations, Hoover’s Directory, the Factiva
database of news stories, and web searches. An observation is only included when we are
confident of a match. In total, we identify 473 entities with at least one U.S. utility patent
grant in the period from the calendar year starting three years before to the calendar year
starting five years after the year of the private equity transaction.6
The seemingly small number of patentees likely reflects two facts. First, in many
instances the companies are “old economy” firms in which intellectual property is less
central and which have a greater reliance on trade secrets or branding to protect
intellectual property. Second, the acceleration of private equity activity means that many
transactions are undertaken in 2004 and 2005. In cases of divisional buyouts, where new
firms are created, this leaves only a short time for observing any patenting activity. Even
if these new entities filed for patents, they would be unlikely to be issued by May 2007,
and we only see patent applications that have been successful granted by the USPTO (not
pending applications). An additional concern arises since more than one-quarter (2,540)
of the 8,938 utility patents we identify are assigned to Seagate Technologies. In contrast,
the second largest patentee accounts for less than 5% of the sample. Since Seagate would
dominate our sample, we do not include it in the main analyses. Instead, we provide a
separate case study of the Seagate Technologies transaction in section 4A below. Thus,
our final sample consists of 6398 patents from 472 firms granted from 1984 through May
2007. For most our analysis, however, we calculate the number of citations a patent
receives over the three years following the grant date. Hence, for these parts of the
analysis, we exclude patents granted after 2005, restricting the sample to 4207 patents.
10
In Table 1, Panel A, we first summarize the annual private equity investments and
exits. The transactions are concentrated in the second half of the 1990s and the first half
of the 2000s. This reflects both the increasing volume of transactions during these years
and the growing representation of technology firms, which have more patents. The
absence of transactions before January 1986 and after December 2005 reflects the
construction of the sample, which only includes buyout transactions completed during
this period. Exits, not surprisingly, lag the transactions by several years.
Panel A also displays the timing of the patent applications and awards. Each
patent is associated with two dates: the application date and the grant date. The
application dates extend from 1983 (three years before the first private equity investment)
to 2006. No applications from 2007 appear because we only examine successful
applications that have already been granted by the USPTO. Moreover, the number of
awards falls sharply in 2007, because we only identify grants through May 2007.
Panel B shows the distribution across types of transactions. Buyouts of corporate
divisions are most common, followed by private-to-private deals (investments in
independent unquoted entities), secondary deals (firms that were already owned by
another private equity investor), and public-to-private deals. These patterns mirror private
equity investments more generally, as does the preponderance of exits by trade sales (i.e.,
acquisitions by non-financial buyers), revealed in Panel C (see also Strömberg (2008)).
Panel D presents the industry composition of firms and patents. Patents are
assigned to the primary industry of the parent, as reported by Capital IQ. In later
analyses, we use the patent-specific industry classification by the USPTO. No single
11
industry dominates. Our sample is overrepresented in manufacturing industries and
underrepresented in non-manufacturing industries.
Panel E shows the distribution of the lag between the patent applications and the
private equity transactions, and it illustrates one of the challenges faced by our
methodology. The patents we observe are disproportionately applied for in the years
before and immediately after the buyout. This reflects the “back-end loaded” nature of
the sample, were the bulk of transactions occur towards the later years of our sample, and
the lags associated with the patent granting process. Obviously, we cannot see successful
patents filed five years after a buyout undertaken in 2005, and we do not yet observe
most of the patents filed five years after a buyout in 2000, since patents, on average, take
more than 30 months to issue, with a substantial minority taking considerably longer.7
Insert Table 1 about here
We capture a variety of information about the patent awards. Over the past two
decades, several quantitative measures of patent quality have become widely adopted
(Jaffe and Trajtenberg (2002); Lanjouw, Pakes and Putnam (1998)). These measures rely
on the citations either to or by the patent to characterize the nature of the grant (also
called forward and backward citations). Citations are extremely important in patent
filings, since they serve as “property markers” delineating the scope of the granted
claims.

12
Patents that are more cited are typically interpreted as having more impact or as
being more important than less cited patents. However, the distribution of citations is also
important. Patents that cite other patents in a broader array of technology classes are
often viewed as having more “originality.” Patents that are themselves cited by a more
technologically dispersed array of patents are viewed as having greater “generality.” Both
“originality” and “generality” have been interpreted as measures of the fundamental
importance of the research being patented.8
In addition to the truncation problem delineated above, we also face challenges
around divisional buyouts and cases where the target firm was subsequently acquired by
another corporation. In these instances, the firm’s patents may not be assigned to the
target but rather to the corporate parent. For instance, consider a divisional buyout. Many
of the patents applied for three years before the buyout are likely to be issued before the
private equity investment. In most instances, these will be assigned to the corporate
parent, and even some patents applied for by employees of the bought-out division that
are issued after the buyout may nonetheless be assigned to the corporate parent rather
than to the target corporation.
While we are unable to comprehensively solve this problem, we can partially
address this issue. In unreported analyses, we repeat the analyses, capturing some, though
not all, of the additional patents associated with bought-out firms that are units of larger
concerns during part of the period during the period from three years before to five years
after the investment. We identify all patents assigned to the corporate parent prior to the
private equity investment or assigned to the target’s acquirer after the private equity
13
investment that have the same assignee as one of the patents assigned to the target. We
believe that this criterion is conservative. It will lead us to some, though not all, of the
missing patents associated with the target, but identify few “false positives,” or patents
assigned to the parent that are not associated with the target. When we include these
supplemental patents in the analysis, the statistical and economic significance of the
results do not change materially.
II. Method
We focus on the quality, size, and structure of the company’s patent portfolios.
These features are characterized in several ways. First, following the literature, we use
the citation count as a measure of the quality, or economic importance, of the patent. The
citation count is the number of times the patent has been cited by other patents in the
calendar year of the patent grant and the three subsequent years (we will refer to this
period below as a “three-year window”). In particular, we examine whether citation
counts change for patents granted before and after the transaction. Second, we examine
whether the nature of the patents change after the transactions, measured by the patents’
“originality” and “generality,” which are computed using the dispersion of the patents
that cite or are cited by the awarded patent. Moreover, we examine variations in the
propensity of firms to file for patent protection before and after private equity
investments. Finally, we explore whether firms alter their patent filing practices after the
transactions. In particular, we examine whether the changes in patent quality can be
explained by firms increasingly patenting in certain areas.
14
These patterns provide some indications of the impact of private equity
transactions on long-run investments. If indeed we observe a higher quality of patent
filings, and a more targeted allocation of innovative activity, the pattern would be
consistent with the arguments postulated by Jensen (1989, 1993) about the salutatory
effects of private equity transactions. If we find a decrease in these measures of
innovative activity, the results would be consistent with the more skeptical views of these
transactions.
III. Analysis
A. Case Study of Seagate Technologies
The case of Seagate Technologies, which as noted above is the largest single
patentee in our sample, provides an interesting illustration of the issues confronting
private equity investors.9 Seagate was founded in 1979 by entrepreneurs who were
among the pioneers in the development of disk drives. In 2000, Seagate was an industry
leader, with total annual revenues of nearly $7 billion and a market share of 21 percent of
the worldwide disk drive market.
Seagate employed a strategy of vertical integration, encompassing all phases of
the disk drive development and manufacturing operations. In contrast, Seagate’s
competitors, such as IBM, were increasingly outsourcing manufacturing to specialized
outsiders. Seagate’s structure attracted criticism from analysts, who claimed that
vertically integrated firms had substantially higher fixed costs, and that the strategy was
particularly inappropriate in an industry that was rapidly changing from an innovative
15
high-tech industry to a commodity business. In response, Seagate launched a broad
restructuring effort in 1997, involving closing or selling off overseas manufacturing
operations, exiting from a number of product lines, and reducing capital expenditures and
R&D.
In March 2000 an investor group led by Silver Lake Partners announced the
buyout.10 Seagate sold its disk drive, tape drive, and software businesses to the investor
group in exchange for approximately $2 billion, including $1.1 billion in equity. In return
Seagate’s shareholders received cash and VERITAS stock, with a total value of
approximately $77.50 per share, a dramatic improvement from the average price of about
$30 at which the stock traded during 1999. Silver Lake’s role in Seagate’s transformation
extended beyond financial engineering. The private equity group was intimately involved
in key decisions to improve operations and position for sale Crystal Decisions, the
accounting software unit that Seagate had acquired in 1994.
This transition is evident in the summary data for Seagate’s patenting and
citations presented in Table 2. In this table we compare Seagate to two large independent
competitors, Maxtor and Western Digital. (It is difficult to compare Seagate to more
diversified manufacturers, such as Hewlett-Packard, given their broad patent portfolios.)
Panel A presents three measures of patenting: the number of (ultimately successful)
patent applications filed annually between 1985 and 2003, the subsequent citations to
these patents through October 2009, and the ratio of citations to patents. The decline in
the number of patents and citations partly reflects that more recent applications are less
16
likely to have been issued and garner citations. For this reason, we do not include patent
applications filed in 2004 and after.
Panel B presents the percentage changes in the three measures. We report the
year-to-year changes in the number of patents. Since these changes may be affected by
changes in the industry and the granting and citation lags reported above, we focus on
the adjusted changes, calculated as the annual percentage change for Seagate less the
average percentage change for Maxtor and Western Digital. Due to substantial year-to-
year fluctuations, we compare the averages of these adjusted changes for the years
before the buyout (1996 to 1999) and the years after (2000 to 2003).
Insert Table 2 about here
First, it is clear that Seagate’s competitive position was deteriorating prior to the
buyout. While the aggregate numbers of patents and citations were increasing, they were
declining sharply relative to the competitors (with average annual adjusted changes of -
35% and -41%). Similarly, citations per patent were declining on average (average annual
change of -5%). After the buyout Seagate’s position continued to lag behind its rivals’,
but the rate of decline slowed, particularly in the case of aggregate patents and citations
(the three average annual measures are now -8%, -10%, and -4%). Thus, the buyout
appears to have partially stemmed the deterioration of Seagate’s innovative position.
B. Measuring Patent Importance
17
We begin the large-sample analysis by examining the quality of the patents in the
sample. As noted above, the most widely used measure in the literature is patent citations.
Implementing this measure requires deciding the number of years over which the
citations are counted after the patent is granted. There is a considerable amount of serial
correlation in patent citations, and patents that are highly cited in their first few years tend
to be cited heavily throughout. Moreover, since our sample is back-end loaded, we prefer
a shorter window to reduce the truncation of the sample at the end. Consequently, we use
a three-year period of citations to construct our citation counts variable, but the serial
correlation limits the information loss from ignoring later citations.11 We examine the
sensitivity of the results to this choice in Section 4C below.
Table 3 presents the first comparison of patents filed for before and after the
transactions. The two panels treat patents filed in the calendar year of the private equity
investment differently. Focusing on Panel A, we observe that, on average, patents issued
before and in the year of the transactions are cited 1.99 times in the first three years after
they are granted. In contrast, patents issued after the transactions are cited 2.49 times over
the three years after the grant date, a 25% increase in the number of citations.
Insert Table 3 about here
These comparisons are instructive but coarse, since they are based on the raw
citation counts. Therefore, we define matching patents as follows. For each patent in the
18
sample, we determine all U.S. patents granted in the same year and assigned to the same
USPTO technology class.12 We observe a clear increase in the average number of
citations for the patents granted to the private equity-backed firms. In part, this may
reflect the increasing importance of patents in later years, but it may also reflect two other
changes. As the pace of patenting world-wide accelerates, the frequency of patent
citations has increased. Furthermore, as private equity investments in high-technology
industries become more common, the representation of patents in technologically
dynamic industries has grown. Hence, it is important to control for the timing of the
patent grant and its technology class.
To address this concern, Table 3 also reports the relative citation counts. These
are calculated as the number of citations in the calendar year of the grant and the three
calendar years thereafter (citation count) less the average number of citations during this
period to matching patents, which have the same grant year and primary USPTO class.
Before the transactions, the relative citation counts are 0.065 and 0.075. Neither of these
figures is statistically different from zero, suggesting that the buyout firms are not
targeting companies with unusual patenting activity. After the transactions, the relative
citation counts increase to 0.761 and 1.140, an increase that is highly statistically
significant. When comparing the relative citation counts, both the absolute and
percentage increases in the counts are as great as or greater than the increases for the raw,
unadjusted citation counts. For the measures of “originality” and “generality,” the
economical and statistical magnitudes of the changes are smaller when comparing the
relative measures to the raw ones. Again, the relative originality and generality measures
are not statistically significantly different from zero before the transactions.
19
To provide a more nuanced view of the changes in the patent citations, we turn to
a multivariate analysis. A natural starting point is the Poisson count model, which
assumes that the three-year citation count is distributed according to a Poisson
distribution. However, we find substantial overdispersion in the citation counts, which is
typical for patent data, but leads to a rejection of the Poisson model. Following the
literature, we turn to the Negative Binomial model instead, which can be interpreted as
generalizing the Poisson model with an additional error term in the specification of the
citation intensity, capturing the overdispersion. Both models are standard (e.g., Cameron
and Trivedi (1998) and Hausman, Hall, and Griliches (1984)).
To control for changes in citation behavior and the industry composition of
companies over time, we control for the baseline citation intensities, using the matching
patents described above. This is implemented as follows. For each patent, we calculate
the average citation intensity of the matching patents as
i
Total Citations
Number of Matching Patents , (1)
where Total Citations is the number of citations received by all matching USPTO patents
during the three years following their grant dates. By including this average intensity in
the estimation – with a fixed coefficient of one – we control for technology- and year-
specific variations in the citation patterns. The resulting estimates reflect relative citation
intensities of patent granted to companies in our sample compared to the matching
patents.
20
Finally, note that all reported coefficients are incidence rates, reflecting the
proportional effect of an increase in the underlying characteristic. An incidence rate
greater than one corresponds to a positive coefficient and a positive effect of the
characteristic on the intensity. An incidence rate below one corresponds to a negative
effect. Correspondingly, indications of statistical significance do not reflect whether the
coefficients are different from zero, as is usual, but whether they differ from one.
Table 4 contains pooled regressions, using the Negative Binomial model, of
citation counts on year dummies. In the first two regressions the independent variables
are indicators for the individual years of the patent filing relative to the year of the private
equity transaction (Event Year 0 is the omitted base category with a coefficient
normalized to one). In each case, applications in the second through fifth year after the
transaction are cited significantly more frequently. To illustrate, in the first regression,
the coefficient of 1.786 for patents applied for three years after the transaction implies
that these patents garner 78.6% more citations than those applied for in the year of the
transaction. The individual coefficients for Event Years -3 to 1 are not significantly
different from one. The coefficients may suggest a decline in citation intensity from the
years prior to the transaction to the year of the transaction, but this decline is an order of
magnitude smaller than the subsequent increase and not significant. In specification two,
using relative citation intensities, this initial decline largely disappears, meaning that
patents filed for before the transaction are cited about as frequently as the patents in the
matching group. However, except for the year immediately after the transaction, the
coefficients for subsequent years are greater than one and consistently significant. The
coefficients suggest a gradual increase in the citation intensity starting in the year

21
subsequent to the transaction, progressing through the second year, and peaking in year
three, after which the level declines a notch. This post-buyout increase in relative
citations is displayed graphically in Figure 1. This shows that patents filed in the years
after the private equity investment are cited significantly more frequently than the patents
in the matched group. This pattern is found both for absolute and relative citation
intensities, although it is slightly more pronounced for the relative intensities that control
for the timing and industry composition of the patents.
Insert Figure 1 about here
To confirm this pattern, we consolidate controls into three three-year periods. The
first goes from event year -3 to -1. The second period, the base period, runs from year 0
to 2; and the last goes from event years 3 to 5. In specifications three and four we confirm
that the citation intensities in the period before the transaction are virtually similar to the
intensities for the base period (as also suggested by specifications 1 and 2). For the last
period, however, the citation intensities show a substantial increase.
In the last four columns of Table 4, we use even more parsimonious
specifications. The dummy variable Post equals one if the patent was applied for in the
first through fifth year after the private equity investment. The variable Post Plus One
equals one if the application was in the second to fifth year, to capture the gradual
increase seen in the previous specifications. Again, these coefficients are substantially

22
greater than one and statistically highly significant, confirming our finding that the
citation count increases following private equity transactions.
Insert Table 4 about here
One concern is that buyout funds “cherry pick” companies and focus their
investments in companies with stronger innovation potential. In this case, our findings
may reflect this selection rather than the investors’ effect on the companies. While we do
not have an instrumental variable that would allow us to definitively resolve this issue,
we believe that this is a small concern for two reasons. As mentioned above, the majority
of the companies in our sample are “old economy” companies where innovation and
intellectual property are less central to their businesses. The innovation potential of these
companies is unlikely to be an important factor for the private equity funds when they
make investment decisions. More importantly, as observed both in Table 4 and in Figure
1, the majority of the increase in the citation rate comes in the second and third years
after the transaction. Hall, Griliches, and Hausman (1986) study the lag between R&D
activities and patent applications and find that they move virtually simultaneously,
suggesting that most of the change in the patent quality does not take place until
sometimes after the transaction, making it less likely to having influenced the investors’
initial decision to undertake the investment.

23
The results are robust to the inclusion of patentee fixed- and random-effects, as
reported in Table 5, although the statistical significance naturally declines somewhat. In
these specifications we also control for the time variation over the sample period by only
estimating relative intensities, as discussed above. In particular, we find that in the
specifications with controls for individual years that the coefficients for event years 3 and
4 are significantly greater than one. Dividing the event period into three three-year
periods, as above, we confirm that the citation intensity increases in the years following
the transaction. This specification also suggests that there is a slight decline in citations
from the period before the private equity investment to the base period. This may also
explain the somewhat muted coefficients in the final specifications with the Post and Post
Plus One variables. With the slight decline in citations before the transaction and the
gradual increase subsequently, the coefficient on Post is now close to one and
insignificant. The coefficient on Post Plus One better captures the gradual increase
following the investment and is significantly greater than one, albeit muted. While these
coefficients confirm our main conclusion, the specifications that include only Post and
Post Plus One may be too parsimonious to capture the dynamic pattern in the citation
counts that is indicated by the previous specifications in this table.
Insert Table 5 about here
C. The Fundamental Nature of the Patents

24
One possibility is that the patents awarded to the firms are more economically
important, but the firms are sacrificing more basic or fundamental research that will not
yield commercial benefits for some time going forward.
We thus turn to examining the fundamental nature of the patents awarded to these
firms, using the measures of patent originality and generality described above. In Table 3,
we see that patents applied for after the private equity investments are slightly more
general and original than those applied for beforehand. Once we adjust for the average
generality and originality of awards in the same patent class and with the same grant year,
these differences largely reverse, but their magnitudes remain small.
A similar conclusion emerges from the regression analyses in Table 6. When we
run regressions akin to those in earlier tables (now employing an ordinary least squares
specification with patentee fixed effects), we find that the awards applied for after the
private equity investments are slightly more original and less general, but the magnitudes
and levels of statistical significance are small.13 Thus, private equity investments do not
seem to be associated with a change in the fundamental nature of the (patented) research.
Insert Table 6 about here
25
D. Robustness Checks of the Patent Quality Analyses
In undertaking the analyses of patent quality, we needed to make a number of
assumptions. In this section, we summarize the results of unreported supplemental
analyses, where we relax these assumptions.
One issue was posed by private equity investments where there was already an
existing investor. These investments are typically secondary buyouts, where one sponsor
buys out the stake of another. As a result, some patents may be double-counted: they may
be simultaneously prior to one transaction and after another. We repeat the analysis,
employing these patents only the first time they appear and then dropping them entirely.
The results are little changed.
A second concern was posed by our measure of patent citations, which only uses
the citation count during the three years after the award. As mentioned above, the number
of citations to a given patent in each year is strongly serially correlated, so we should
identify the same patents as heavily cited ones whatever window we use. Using a long
window to identify citations enhances the accuracy of our identification of important
patents but reduces our sample size. We repeat the analysis, using citations through the
end of the second calendar year after the patent grant, as well as after the fourth year, and
the results are qualitatively similar.
A third concern has to do with what we term “cherry picking” in divisional
buyouts. In particular, we worried that corporate parents, when they determine which
pending patent applications will be assigned to the private equity-backed firm at the time
of the buyout, will select only low quality patents: the best patents, even if very relevant
26
to the target firm, will be retained by the corporate parent. This tendency might lead to an
apparent increase in quality in the patents applied for after the award, while all we are
really seeing is an unbiased sample of the unit’s patents.
We can partially address this concern by using the enhanced sample described
above. We also address this issue by rerunning the cross-tabulations and regressions
above while excluding the divisional buyouts from our sample. Since the buyouts in the
sub-sample are not “carved out” of firms, but involve the purchase of an entire
corporation, this problem should not be present. The key results are little changed as a
result of this shift.
Another robustness check is to examine the impact of the holding periods of the
private equity groups. If private equity groups only affect the companies in their
portfolios gradually, we might expect that firms that have been held by private equity
investors for longer periods would have a more dramatic increase in innovative output. In
unreported regressions analyzing patent citations, we find support for this hypothesis.
The pattern is no longer statistically significant, however, when we add firm fixed effects
to the specification.
E. Analysis of Level of Patenting
In the last three tables, we move from examining the quality of individual patents
to looking at the mixture of the overall patenting activity generated in the years before
and after the private equity investments. If the average number of successful patent
filings falls dramatically, our interpretation of the earlier finding that the importance of
the issued patents rises considerably might be quite different: it would suggest cutbacks
27
of unproductive innovative activities rather than repositioning of research from lower to
higher impact topics.
Comparing the amounts of patenting prior to and after the private equity
investment is problematic, however, for several reasons. While we can adjust for the
truncation associated with the timing of the patent applications, it is very difficult to
control for the assignment of patents to corporate parents and the fact that many of our
companies are not stand-alone entities in the years surrounding the transaction. We will
be able to see some but not all patents assigned to targets that were units of larger firms
prior to divisional buyouts or else were ultimately acquired by other concerns.
Consequently, we exclude divisional buyouts for the analysis below. Moreover, we
estimate specifications restricted to buyouts taking place before 1999 and to companies
that have patent filings in three years before the transaction and five years after the
transaction, suggesting that these companies were independent entities during the entire
period.
Moreover, the analysis faces an identification problem. As observed previously,
the composition of firms and the citation patterns change during our sample period,
making time controls important. Ideally, the specification would also include individual
company fixed effects as well as separate indicators for the years surrounding the
transactions. However, this specification is not identified, since the company fixed effect
defines the event time, which, together with the indicator for the year surrounding the
event, uniquely determines the year. (See Berndt and Griliches (1993) and Hall,
Mairesse, and Turner (2007) for detailed analyses of this problem). There is no entirely
28
satisfactory solution. We circumvent this problem by replacing the individual indicators
for the years surrounding the event with a single “Post” dummy. This identifies the
regression, but the identifying assumption is that the patenting levels are constant before
and after the transaction (i.e., the full transition takes place in the year of the transaction).
To verify the robustness of this assumption, we also report estimates of specifications
with a dummy that equals one from year two after the transaction (“Post Plus One”),
allowing for a more gradual effect. Note that this identification problem is not a concern
for our analysis of citation counts, since we could use the citation rates for matching
patents to calculate the relative citation intensities, and in this way avoid including
individual year fixed effects.
Despite these limitations, in Table 7 we undertake an analysis of the number of
ultimately successful patent filings made in a given calendar year. An observation is a
target firm-year pair: that is, for each transaction in 2000 and before, we use nine
observations for each transaction, from three years prior to five years after the
transaction. (For transactions in subsequent years, we use smaller number of
observations, reflecting our inability to see patent filings made after 2005.) The initial
analysis, in the first two columns of Table 7, uses the entire sample. These regressions,
like all those reported in this table, include fixed effects for each year and each firm to
control for the differing propensity to patent. In these specifications, we include a dummy
denoting observations after the buyout. The coefficients smaller than one on the post
dummies suggest that there is a decline in patenting activity following the buyouts.
29
Insert Table 7 about here
We might worry, however, that this result is an artifact of our sample
construction: in particular, while we observe some successful patent filings in the final
years of the sample, there are likely to be many applications that were filed in these years
that had not been issued as of May 2007. (Recall the average patent pendency today is
about 30 months.) Because observations of patent filings in 2004 and 2005, where this
selection bias will be the worst, are disproportionately likely to be in the years after
private equity transactions, this effect may bias our counts of patent filings.
We thus repeat the analyses restricting the sample in two ways. First, in columns
3 and 4, we limit the analysis to private equity investments prior to 1999. In these
regressions, effects due to not-yet-issued patent applications should be much less severe.
Again, we include both firm and year fixed effects. The trend reverses and we find
significant positive effects of buyouts on patenting activity.
A remaining worry is that these results may be affected by some firms not being
stand-alone firms in the years before or after this transaction, even if the transaction itself
is not a divisional buyout. To ensure we have patenting information about the individual
firms in the years surrounding the transaction, specifications 5 and 6 condition on the
firm having received a patent both in the years three years before and five years after the
transaction: i.e., we require that the firm had received a patent both in Event Year -3 and
in Event Year +5. This reduces the concern that we do not observe patents for the firm in
30
the entire nine-year window. (It does introduce a concern that companies that are stand-
alone entities before and remain stand-alone entities after the transaction are special in
other ways.) In the two reported specifications (and other unreported ones), we find that
the post-buyout dummy is either weakly negative or weakly positive.
Taken together, the results do not suggest any clear change in the amount of
patenting. While our conclusions must be somewhat tentative due to the discussed
difficulties in measurement, questions of causation, and the remaining uncertainties, the
absence of a consistent pattern is evident.
F. Analysis of Patent Portfolios
In the final section, we turn to considering the structure of the patent portfolios
constructed by these firms in the years before and after the private equity investments.
Since the previous section shows that the increase in patent importance is not driven by
private equity-backed firms reducing the number of filings, it is natural to wonder about
the dynamics behind the change in quality.
The initial analysis is presented in the final line in Panel A of Table 3. We
compare the Herfindahl index, or concentration measure, of the patent classes in which
firms’ awards are assigned. We restrict the sample to the 80 firms with at least four patent
applications in the sample filed prior to the private equity investment and at least four
patents applied for afterwards, in order to ensure the computed measures of concentration
are meaningful. When we undertake this comparison, we find that firms after private
equity investments have more concentrated patent portfolios than beforehand.

31
We can gain some additional insights as to how these more concentrated
portfolios emerge from the cross-tabulations in Table 8. In this table, each patent is an
observation, and we examine citations in the years prior to and after the private equity
investment, similar to the analysis in Table 3. We now divide the patents, though, in two
ways. In Panel A, we divide the observations into those whose primary patent class
assignment was more or less well populated prior to the investments: more precisely,
whether the firm, in applications filed in the three years prior to the private equity
transaction, had above or below its median share of patenting in that primary patent class.
In Panel B, we divide the patents by whether the share of patenting in the primary class
increased or decreased after the private equity transaction.
The cross-tabulations provide additional insights into the sources of the increase
in patent importance. First, we see from Panel A that awards in the firms’ focal
technologies—the areas where they had done a disproportionate amount of patenting
prior to the transaction—are more likely to increase in quality, whether raw or adjusted
patent counts are used. Panel B reveals that patent classes that experience an increase in
patenting share are also disproportionately where the increase in patent quality occurred.
Private equity-backed firms appear to focus their innovative investments in their core
areas of strength and generate higher-impact patent portfolios as a result.
Insert Table 8 about here
32
Consistent results emerge from Table 9, which presents Negative Binomial
regression analyses akin to that in the fifth and sixth columns of Table 4. We now add
controls for the share of patenting in the primary patent class prior to the private equity
investment (in the first and second regressions) and for the change in the share of
patenting in that class from before to after the investment (in the third and fourth
regressions), as well as interactions between the patent measure and the dummy denoting
an award filed in the first through fifth years after the private equity investment. Because
the measures of patent shares may be misleading if there are just a handful of patents
assigned to a given firm, we undertake the analysis both using the entire sample (the first
and third columns) and only for patents of firms which had at least four patents prior to
the private equity investments and four after (the second and fourth columns).
Insert Table 9 about here
The greater than one coefficient for the variable “Share of Firm's Pre-Investment
Patents in Class” suggest that patents in the firms’ “core” areas—the areas where there
was more patenting prior to the private equity investment—are disproportionately likely
to be more cited ones. Moreover, the interaction term is greater than one. Not only are
these patents more important, but their impact appears to increase substantially after the
private equity investment.

33
The variable “Change in Firm’s Patent in Class Pre- and Post- Investment”
initially presents a similar picture. The coefficient is again greater than one—areas where
there is growth are more important ones— although the difference is insignificant. Again,
the interaction term is greater than one, suggesting that an increase in patenting is also
associated with a sharp boost in patent quality.
Another indication of innovation focus that has been used in the literature is self-
citations, i.e., filings citing previous patents by the same firm. According to Hall et al.
(2005), self-citations suggest that a firm has a strong competitive position in a particular
technology and is therefore in a position to internalize some of the knowledge spillovers
from innovation. Consistent with this, Hall et al. (2005) find that patents with more self-
citations are more valuable. In our sample,14 18.7% of citations to patents applied for
prior to the buyout are self cites; for the patents filed afterwards, the fraction increases to
22.5%. This difference is significant at the 1% confidence level. This pattern is also
consistent with increasing specialization, suggesting that firms are more likely to build on
prior innovations rather than to pursue unrelated new ones after a buyout. Table 10
reports results from a fixed effects analysis using only self citations, and it shows the
same pattern of significant increases in self citations post buyout.
Insert Table 10 about here
34
Thus, these analyses suggest that private equity-backed firms tend to focus their
patent filings. This focusing process is not indiscriminate, however, but tends to
concentrate on core technologies. Moreover, the very process of focusing seems to lead
the patents in these classes to have greater impact after the private equity investment.
IV. Conclusions
This paper examines the changes around the time of investments by private equity
groups on firms’ long-run investments, focusing on innovative activities. We examine
patents filed by 472 firms that received private equity backing between 1986 and 2005.
We find that patents of private equity-backed firms applied for in the years after the
investment are more frequently cited. These firms show no deterioration after the
investments in patent originality and generality, which proxy for the fundamental nature
of the research. The level of patenting does not appear to consistently change, and the
firms’ patent portfolios become more focused in the years after the private equity
investments. The areas where the firms concentrate their patenting after the private equity
investment, and the historical core strengths of the firm, tend to be the areas where the
increase in patent impact is particularly great.
We see three avenues for future research into the relationship of private equity
and innovation. First, is sensitivity of innovative activity to market changes less for
private equity-backed firms? Financial economists have argued that the public market can
give misleading signals to firms regarding appropriate investments, but that managers
nonetheless feel pressured to follow the market’s lead (e.g., Baker, Stein, and Wurgler
(2003)). If this argument is right, and private equity investors provide insulation against
35
these pressures, we might anticipate that investments in innovation by private equity-
backed firms would be less sensitive to the shifts in market sentiment. To examine this,
we will need to link the patent activity to changes in financial and accounting
performance. This issue is particularly relevant given the sharp downturn in financing
availability after the 2008 crisis. (Of course, private equity groups were also limited in
their ability to access financing, particularly debt.)
Second, do private equity-backed firms differ in their management of patent
portfolios? U.S. patentees have to pay renewal fees in order to keep their patents active.
Some large firms appear to have an automatic policy of renewing patents, even if the bulk
of patents have little value. It would be interesting to observe if private equity-backed
firms are less likely to renew patents, particularly lightly cited ones, than the norm.
Finally, how do divisional buyouts affect innovation by the parent firms?
Research suggests that firms reliant on internal capital markets to allocate resources
across divisions produce fewer and less novel innovations (Seru (2007)). Do the changes
associated with the sell-off of the target change the parent firm’s innovation strategy?
36
References
Andrade, Gregor, Stuart Gilson, and Todd Pulvino, 2003. Seagate Technology Buyout,
Harvard Business School Case no. 9-201-063.
Atanassov, Julian, Vikram Nanda, and Amit Seru, 2007. Finance and Innovation: The
Case of Publicly Traded Firms, Unpublished working paper, University of
Oregon.
Baker, Malcolm, Jeremy Stein, and Jeffrey Wurgler, 2003. When Does the Market
Matter? Stock Prices and the Investment of Equity-Dependent Firms, Quarterly
Journal of Economics 118, 969-1006.
Berndt, Ernst R., and Zvi Griliches, 1993. Price Indices for Microcomputers: An
Exploratory Study, in Murry Foss, Marylin Manser, and Allan Young, editors:
Price Measurements and their Uses (Chicago: University of Chicago Press).
Bushee, Brian J., 1998. The Influence of Institutional Investors on Myopic R&D
Investment Behavior, The Accounting Review 73(3), 305-333.
Cameron, A. Colin and Pravin K. Trivedi 1998, Regression Analysis of Count Data,
(Cambridge University Press).
Ferreira, Daniel, Gustavo Manso, and Andre Silva, 2010. Incentives to Innovate and the
Decision to Go Public or Private, Unpublished working paper , MIT
Graham, John R., Campbell Harvey, and Shiva Rajgopal, 2005. The Economic
Implications of Corporate Financial Reporting, Journal of Accounting and
Economics 40 3-73.

37
Gallo, David, and Josh Lerner, 2000. Francisco Partners, Harvard Business School Case
no. 9-200-063.
Guo, Shourun, Edie Hotchkiss, and Weihong Song, 2007. Do Buyouts (Still) Create
Value? Forthcoming, Journal of Finance.
Hall, Bronwyn, 1990 The Impact of Corporate Restructuring on Industrial Research and
Development, Brookings Papers on Economic Activity (1), 85-136.
Hall, Bronwyn, 1992. Investment and Research and Development at the Firm Level:
Does the Source of Financing Matter? Working Paper No. 4096, National Bureau
of Economic Research.
Hall, Bronwyn H., Zvi Griliches, and Hausman, Jerry, 1986 Patents and R and D: Is
There a Lag? International Economic Review 27, 265-283.
Hall, Bronwyn H., Adam B. Jaffe, and Manuel Trajtenberg, 2001 The NBER Patent
Citation Data File: Lessons, Insights and Methodological Tools, Working paper
no. 8498, National Bureau of Economic Research.
Hall, Bronwyn H., Adam B. Jaffe, and Manuel Trajtenberg, 2005 Market value and
patent citations, Rand Journal of Economics 36 16-38.
Hall, Bronwyn, Jacques Mairesse, and Laure Turner, 2007 Identifying Age, Cohort, and
Period Effects in Scientific Research Productivity: Discussion and Illustration
Using Simulated and Actual Data on French Physicists, Economics of Innovation
and New Technology 16, 159-177
38
Hao, Kenneth Y., and Adam B. Jaffe, 1993. Effect of Liquidity on Firms' R&D Spending,
Economics of Innovation and New Technology 2, 275-282.
Hausman, Jerry, Bronwyn H. Hall, and Zvi Griliches, 1984. Econometric Models for
Count Data with an Application to the Patents-R&D Relationship, Econometrica
52, 909-938
Himmelberg, Charles P., and Bruce C. Petersen, 1994. R&D and Internal Finance: A
Panel Study of Small Firms in High-Tech Industries, Review of Economics and
Statistics 76, 38-51.
Jaffe, Adam B., and Manuel Trajtenberg, 2002. Patents, Citations, and Innovations: A
Window on the Knowledge Economy (MIT Press, Cambridge, MA).
Jensen, Michael C., 1989. The Eclipse of the Public Corporation, Harvard Business
Review 67, (September-October), 61-74.
Jensen, Michael C., 1993 The Modern Industrial Revolution, Exit, and the Failure of
Internal Control Systems, Journal of Finance 48, 831-880.
Kaplan, Steven N., and Jeremy C. Stein, 1993 The Evolution of Buyout Pricing and
Financial Structure in the 1980s, Quarterly Journal of Economics 108, 313-357.
Kosman, Josh, 2009,The Buyout of America: How Private Equity Will Cause the Next
Great Credit Crisis, (Penguin, New York).
Lai, Ronald, Alexander D’Amour, and Lee Fleming, 2009. The Careers And Co-
Authorship Networks of U.S. Patent-Holders, Since 1975, Unpublished Working
Paper, Harvard University.

39
Lanjouw, Jean O., Ariel Pakes, and Jonathan Putnam, 1998. How to Count Patents and
Value Intellectual Property: The Uses of Patent Renewal and Application Data,
Journal of Industrial Economics 46, 405-432.
Leslie, Mark, and Alexander Tauber, 2004 Crystal Decisions, Stanford Graduate School
of Business Case no. E-169.
Lichtenberg, Frank R., and Donald Siegel, 1990. The Effects of Leveraged Buyouts on
Productivity and Related Aspects of Firm Behavior, Journal of Financial
Economics 27, 165-194.
Muelbroek, Lisa K., Mark L. Mitchell, J. Harold Mulherin, Jeffry M. Netter, and Annette
B. Poulsen, 1990. Shark Repellents and Managerial Myopia: An Empirical Test,
Journal of Political Economy 98, 1108-1117
Seru, Amit, 2007. Do Conglomerates Stifle Innovation? Unpublished Working Paper,
University of Chicago.
Shleifer, Andrei, and Lawrence Summers, 1988. Breach of Trust in Hostile Takeovers, in
Alan J. Auerbach, ed.: Corporate Takeovers: Causes and Consequences
(University of Chicago Press).
Stein, Jeremy C., 1988. Takeover Threats and Managerial Myopia, Journal of Political
Economy 96, 61-80.
Strömberg, Per, 2008. The New Demography of Private Equity, Unpublished Working
Paper, Institute for Financial Research.

40
Zingales, Luigi, 2001. In Search of New Foundations, Journal of Finance 55, 1623-
1653.
41
1 Consistent with Stein’s arguments, Graham, et al. (2005) in a survey of 400
public company executives find that 78% admit to sacrificing long-term value to smooth
earnings. Similarly, Bushee (1998) finds that firms with a high fraction of ownership by
short-horizon institutional investors are more likely to reduce R&D in order to reverse an
earnings decline. By way of contrast, Atanassov, et al. (2007) document that firms
relying on public equity and bond financing, as opposed to bank debt financing, have a
larger number of patents and that these patents are more cited. Ferreira, Manso, and Silva
(2010) develop a formal theory of differences in incentives to innovate in private and
public companies.
2 One anecdote consistent with this finding is from a practitioner who described a
major public corporation where scientists and engineers received badges identifying the
number of patent filings they had made. Having a platinum or gold badge—awarded only
to the most prolific inventors—was very prestigious. One can imagine the effect of this
incentive scheme on the filing of infra-marginal patents.
3 Strömberg (2008) shows that public-to-private transactions account for roughly
6% of all private equity-sponsored LBO activity in terms of numbers, and roughly 27%
in terms of total enterprise value of firms acquired. Moreover, R&D intensive industries
such as Information Technology, Telecom, Medical equipment, and Biotech account for
roughly 14% of all LBO activity in 2000-2007 (both on an equal- and value-weighted
basis), compared to around 7% in the pre-1990 period.

42
4 Most data services tracking private equity investments were not established until
the late 1990s. The most geographically comprehensive exception, SDC VentureXpert,
was primarily focused on capturing venture capital investments (rather than LBOs) until
the mid-1990s. Strömberg (2008) compares the CIQ LBO data during the 1980s with
older LBO studies using 1980s data and estimates the CIQ coverage to be somewhere
between 70% and 85% for this period. The CIQ sample is likely to be biased towards
deals for larger, surviving, and more established private equity firms before the mid-
1990s. Only 7 of our 472 LBO transactions occur before 1995, and our results are robust
to dropping these observations.
5 The database is constructed in a similar manner to the NBER data, but is more
updated. The database builders did a concerted effort to consolidate variant spellings of
the same assignee, but did not attempt to match assignee names to Compustat. The
database is documented in Lai, D’Amour, and Fleming (2009).
6 We follow the literature in focusing only on utility patents, rather than other
awards, such as design or reissue awards. Utility patents represent about 99% of all
awards (Jaffe and Trajtenberg (2002)).
7 Statistics available at
http://www.uspto.gov/web/offices/com/annual/2006/50304_table4.html (accessed
October 21, 2007). It is natural to ask why we only examine successful patent
applications, rather than all patent filings. Unfortunately, the USPTO did not publish
information on applications for patents filed prior to November 2000, and even the later

43
data are imperfect: not all applications in the U.S. are published and information on
unsuccessful applications is often removed from the database of applications.
8 Each patent is assigned to a primary (three-digit) patent class as well as a
subclass using the USPTO’s classification scheme. These classifications are important to
the USPTO as they are used to search subsequent awards. We compute these measures as
one minus the Herfindahl index of the cited or citing patents. Thus, a higher measure of
originality or generality means that the patent is drawing on or being drawn upon by a
more diverse array of awards. We map the primary U.S. patent class into the aggregated
patent categories used in Hall, Jaffe and Trajtenberg (2001) and Jaffe and Trajtenberg
(2002), and use these categories to undertake the calculations. We use the bias correction
of the Herfindahl measures, developed by Hall, and described in Jaffe and Trajtenberg
(2002) as well.
9 This account is based on Andrade, Gilson, and Pulvino (2003), Gallo and Lerner
(2000), and Leslie and Tauber (2004).
10 The immediate genesis of the transaction, however, was a market anomaly. In
1999 Seagate Technology sold a unit to VERITAS Software, and in exchange it received
approximately 40% of VERITAS equity. In the six months following the transaction,
VERITAS’ stock price increased by more than 200%, while Seagate’s value climbed by
only 25%. At times the value of Seagate’s stake in VERITAS exceeded the entire market
value of Seagate. Seagate’s ability to sell the shares was limited by an agreement with

44
VERITAS, and the perception that investors would object to such a transaction, as the
firm would incur a tax liability.
11 In the USPTO data, patents are typically not cited prior to issuance. This
reflects the fact that many awards are not published prior to issuance and that the USPTO
does not update its records of citations to published patent applications to include the
number of the ultimately granted patents. Thus, the grant date is the beginning of the
period when a patent can garner citations.
12 Patents are assigned during the application process to one of approximately one
thousand technology classes, as well as a more detailed subclass. These classifications are
important, since they are the primary way in which the USPTO identifies other relevant
patents during the examination process.
13 The sample size is smaller in regressions examining generality because
computing this measure requires that patents are subsequently cited.
14 The self-citation rate cannot be readily compared with those computed in Hall,
Jaffe and Trajtenberg (2001). Not only is the time period quite different, but we use a
more detailed screen to identify citations from affiliates, joint ventures and subsidiaries,
all of which we code as self-citations.

Table I: Summary Statistics
Panel A: Transaction and exit years for PE deals involving companies with patents in our sample and application and grant years for those patents.
PE Deals Patents
Transactions Exits Applications Grants
1983 N/A N/A 52 0
1984 N/A N/A 52 17
1985 N/A N/A 56 55
1986 1 0 60 58
1987 0 0 42 54
1988 0 0 37 56
1989 2 0 25 48
1990 0 0 19 23
1991 0 0 17 21
1992 0 0 16 14
1993 3 0 30 19
1994 1 0 64 20
1995 10 0 99 30
1996 18 1 153 57
1997 23 4 313 79
1998 30 2 456 166
1999 51 2 593 309
2000 43 5 805 412
2001 36 3 968 587
2002 52 4 1035 683
2003 69 22 869 680
2004 82 28 462 819
2005 51 42 155 801
2006 N/A 44 20 996
2007 N/A 26 0 394
Total 472 183 6,398 6,398
Panel B: Type of Private Equity Investments with Patenting in [-3,+5] Window
Number of Investments
Public-to-Private 64 Private-to-Private 127 Divisional 219 Secondary 81 Other 4

Panel C: Type of Private Equity Exits with Patenting in [-3,+5] Window
Number of Investments
No Exit 191 Secondary 59 Initial Public Offering 38 Trade Sale 150 Bankruptcy 3 Other/Unknown 54
Panel D: Industry Distribution of Private Equity Investments with Patenting in [-3,+5] Window and Associated Patents: Top Industries in Sample
Top ten industries in sample % of sample
firms % of sample
patents Industrial Machinery 9.9% 8.3% Auto Parts and Equipment 5.2% 11.4% Commodity Chemicals 4.8% 4.8% Electrical Equipment Manufacturers 4.8% 5.8% Building Products 4.2% 1.9% Application Software 3.4% 3.2% Leisure Products 3.0% 4.5% Healthcare Equipment 2.6% 3.0% Specialty Chemicals 2.4% 4.8% Electrical Components and Equipment 2.0% 1.6%
Panel E: Industry Distribution of Private Equity Investments with Patenting in [-3,+5] Window and
Associated Patents: Top Industries in Overall LBO Populations
Representation of sample in the top ten industries in the
overall LBO population
Industry share in overall LBO population
% of sample
firms % of sample
patents
Industrial Machinery 9.9% 8.3% 4.4% Application Software 3.4% 3.2% 3.3% Office Services and Supplies 1.6% 2.5% 2.5% Distributors 0.8% 0.2% 2.3% Packaged Foods and Meats 1.4% 0.5% 2.2% Commodity Chemicals 4.8% 4.8% 2.0% Hotels, Resorts and Cruise Lines 0.0% 0.0% 1.9% Publishing 0.6% 0.1% 1.9% Restaurants 0.8% 0.1% 1.9% Building Products 4.2% 1.9% 1.9%
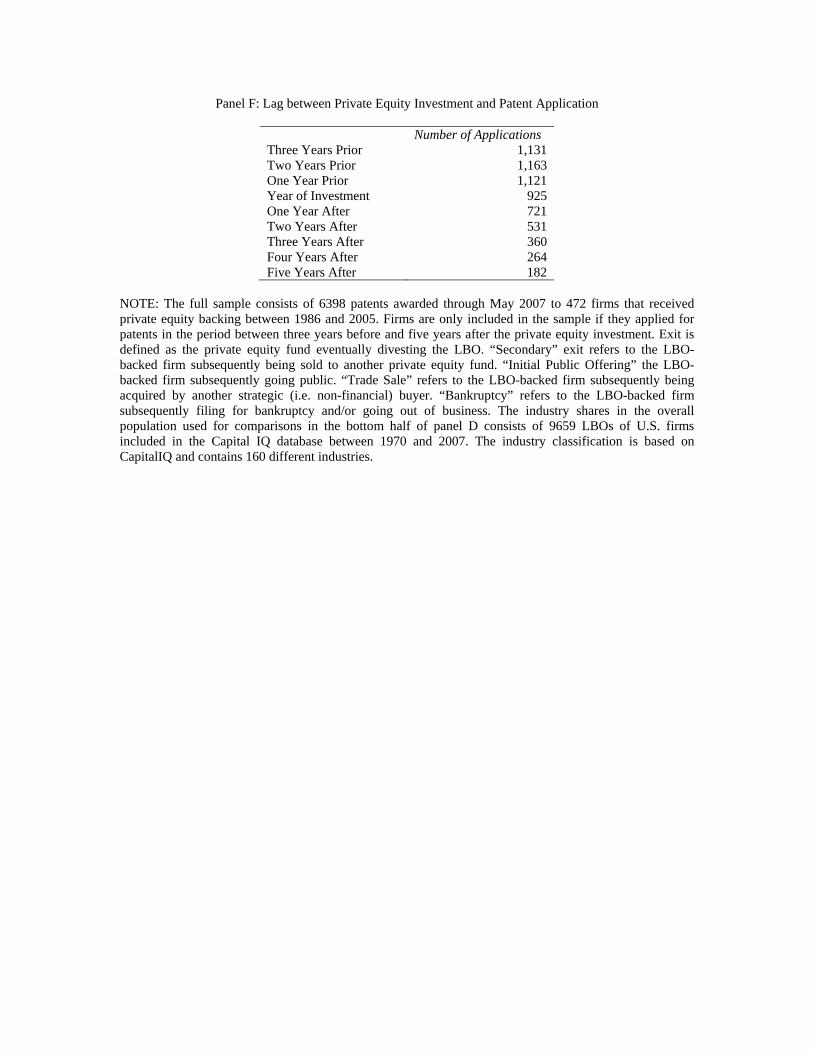
Panel F: Lag between Private Equity Investment and Patent Application
Number of Applications Three Years Prior 1,131 Two Years Prior 1,163 One Year Prior 1,121 Year of Investment 925 One Year After 721 Two Years After 531 Three Years After 360 Four Years After 264 Five Years After 182
NOTE: The full sample consists of 6398 patents awarded through May 2007 to 472 firms that received private equity backing between 1986 and 2005. Firms are only included in the sample if they applied for patents in the period between three years before and five years after the private equity investment. Exit is defined as the private equity fund eventually divesting the LBO. “Secondary” exit refers to the LBO-backed firm subsequently being sold to another private equity fund. “Initial Public Offering” the LBO-backed firm subsequently going public. “Trade Sale” refers to the LBO-backed firm subsequently being acquired by another strategic (i.e. non-financial) buyer. “Bankruptcy” refers to the LBO-backed firm subsequently filing for bankruptcy and/or going out of business. The industry shares in the overall population used for comparisons in the bottom half of panel D consists of 9659 LBOs of U.S. firms included in the Capital IQ database between 1970 and 2007. The industry classification is based on CapitalIQ and contains 160 different industries.

Table II: Disk Drive Innovation: Comparison of Seagate, Western Digital (WD), and Maxtor
Panel A: Summary Statistics on Patenting and Citations
Patents
Total Citations to Patents
Citations/Patent
App. Year WD Maxtor Seagate WD Maxtor Seagate WD Maxtor Seagate
1985 3 1 13 70 26 209 23.3 26.0 16.1 1986 14 1 24 198 44 337 14.1 44.0 14.0 1987 10 4 35 133 112 827 13.3 28.0 23.6 1988 9 8 63 354 199 1255 39.3 24.9 19.9 1989 11 4 54 365 68 1240 33.2 17.0 23.0 1990 5 5 88 62 134 2144 12.4 26.8 24.4 1991 13 7 58 440 124 1201 33.8 17.7 20.7 1992 4 17 64 115 348 1307 28.8 20.5 20.4 1993 3 28 78 62 341 1507 20.7 12.2 19.3 1994 3 17 104 66 174 1407 22.0 10.2 13.5 1995 11 18 148 237 154 1936 21.5 8.6 13.1 1996 25 17 150 360 136 1897 14.4 8.0 12.6 1997 54 9 269 679 67 2537 12.6 7.4 9.4 1998 46 27 346 222 105 2343 4.8 3.9 6.8 1999 54 100 354 320 390 1787 5.9 3.9 5.0 2000 92 63 387 253 178 1535 2.8 2.8 4.0 2001 114 83 497 198 196 1004 1.7 2.4 2.0 2002 162 58 310 194 52 284 1.2 0.9 0.9 2003 97 48 275 46 25 97 0.5 0.5 0.4
Panel B: Change in Seagate Patenting and Citations
Patents
Total Citations to Patents
Citations/Patent Adjusted Adjusted Adjusted Change Change Change Change Change Change
1986 85% -99% 61% -65% -13% -28% 1987 46% -90% 145% 85% 68% 89% 1988 80% 35% 52% -70% -16% -108% 1989 -14% 0% -1% 30% 15% 39% 1990 63% 78% 73% 66% 6% 9% 1991 -34% -134% -44% -345% -15% -85% 1992 10% -26% 9% -45% -1% -2% 1993 22% 2% 15% 39% -5% 29% 1994 33% 53% -7% 15% -30% -25% 1995 42% -94% 38% -86% -3% 6% 1996 1% -60% -2% -22% -3% 17% 1997 79% 45% 34% 15% -25% -16% 1998 29% -64% -8% -2% -28% 26% 1999 2% -142% -24% -182% -25% -37% 2000 9% -7% -14% 24% -21% 19% 2001 28% 1% -35% -29% -49% -22% 2002 -38% -44% -72% -34% -55% -8% 2003 -11% 17% -66% -2% -61% -10%
Avg., 1986-99 32% -35% 24% -41% -5% -6% Avg., 2000-03 -3% -8% -47% -10% -47% -5%
NOTE: Adjusted changes are calculated as the annual percentage change for Seagate less the average percentage change for Maxtor and Western Digital. The Seagate buyout occurred in March 2000.
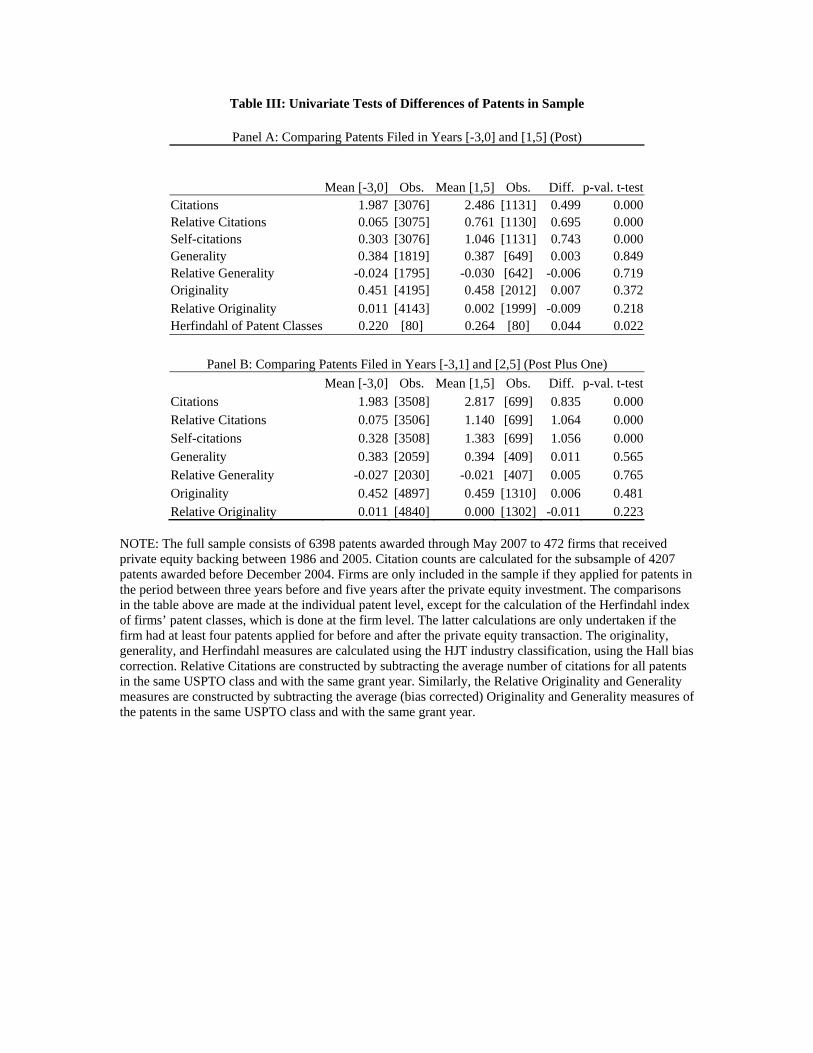
Table III: Univariate Tests of Differences of Patents in Sample
Panel A: Comparing Patents Filed in Years [-3,0] and [1,5] (Post)
Mean [-3,0] Obs. Mean [1,5] Obs. Diff. p-val. t-test Citations 1.987 [3076] 2.486 [1131] 0.499 0.000 Relative Citations 0.065 [3075] 0.761 [1130] 0.695 0.000 Self-citations 0.303 [3076] 1.046 [1131] 0.743 0.000 Generality 0.384 [1819] 0.387 [649] 0.003 0.849 Relative Generality -0.024 [1795] -0.030 [642] -0.006 0.719 Originality 0.451 [4195] 0.458 [2012] 0.007 0.372 Relative Originality 0.011 [4143] 0.002 [1999] -0.009 0.218 Herfindahl of Patent Classes 0.220 [80] 0.264 [80] 0.044 0.022
Panel B: Comparing Patents Filed in Years [-3,1] and [2,5] (Post Plus One)
Mean [-3,0] Obs. Mean [1,5] Obs. Diff. p-val. t-test Citations 1.983 [3508] 2.817 [699] 0.835 0.000 Relative Citations 0.075 [3506] 1.140 [699] 1.064 0.000 Self-citations 0.328 [3508] 1.383 [699] 1.056 0.000 Generality 0.383 [2059] 0.394 [409] 0.011 0.565 Relative Generality -0.027 [2030] -0.021 [407] 0.005 0.765 Originality 0.452 [4897] 0.459 [1310] 0.006 0.481 Relative Originality 0.011 [4840] 0.000 [1302] -0.011 0.223
NOTE: The full sample consists of 6398 patents awarded through May 2007 to 472 firms that received private equity backing between 1986 and 2005. Citation counts are calculated for the subsample of 4207 patents awarded before December 2004. Firms are only included in the sample if they applied for patents in the period between three years before and five years after the private equity investment. The comparisons in the table above are made at the individual patent level, except for the calculation of the Herfindahl index of firms’ patent classes, which is done at the firm level. The latter calculations are only undertaken if the firm had at least four patents applied for before and after the private equity transaction. The originality, generality, and Herfindahl measures are calculated using the HJT industry classification, using the Hall bias correction. Relative Citations are constructed by subtracting the average number of citations for all patents in the same USPTO class and with the same grant year. Similarly, the Relative Originality and Generality measures are constructed by subtracting the average (bias corrected) Originality and Generality measures of the patents in the same USPTO class and with the same grant year.

Table IV: Negative Binomial Estimates of Citation Intensity
(1) (2) (3) (4) (5) (6) (7) (8) Absolute
Intensity Relative Intensity
Absolute Intensity
Relative Intensity
Absolute Intensity
Relative Intensity
Absolute Intensity
Relative Intensity
Event Year -3 1.089 1.035 (0.0853) (0.0774)
Event Year -2 1.107 1.060 (0.0895) (0.0818)
Event Year -1 1.029 1.024 (0.0848) (0.0805)
Event Year 1 1.042 1.092 (0.0985) (0.0986) Event Year 2 1.300** 1.375*** (0.135) (0.135) Event Year 3 1.786*** 1.919*** (0.210) (0.213) Event Year 4 1.574*** 1.714*** (0.219) (0.225) Event Year 5 1.473** 1.787*** (0.281) (0.323) Event Years -3 to -1
0.994 0.931 (0.0502) (0.0448)
Event Years 3 to 5
1.538*** 1.639*** (0.127) (0.128)
Post 1.251*** 1.381*** (0.0637) (0.0668)
Post Plus One 1.421*** 1.569*** (0.0849) (0.0886)
Constant 1.871*** 1.001 2.026*** 1.118*** 1.987*** 1.033 1.983*** 1.040* (0.116) (0.0591) (0.0826) (0.0434) (0.0533) (0.0265) (0.0497) (0.0249)Observations 4207 4205 4207 4205 4207 4205 4207 4205 NOTE: The full sample consists of 6398 patents awarded through May 2007 to 472 firms that received private equity backing between 1986 and 2005. The regressions here use the subsample of 4207 patents awarded before December 2004. Firms and patents are only included in the sample if patents were applied for between three years before and five years after the private equity investment. The unit of observation is a patent in the sample with at least three years to be cited. The dependent variable is the number of citations the patent received during the three years after the award. Indicator variables named Event Year equal one for the given year in event time (the base year is year zero with the PE transaction). The indicator Post equals one for event years 1 and forward. The indicator Post Plus One equals one for event years 2 and forward. Reported coefficients are incidence rates. A coefficient greater than one corresponds to a positive relationship between the explanatory variable and the citation intensity. The models are estimated using Maximum Likelihood, and asymptotic standard errors are given in parentheses. *, **, and *** indicates that the coefficient is statistically significantly different from one at the 10%, 5%, and 1% levels, respectively.
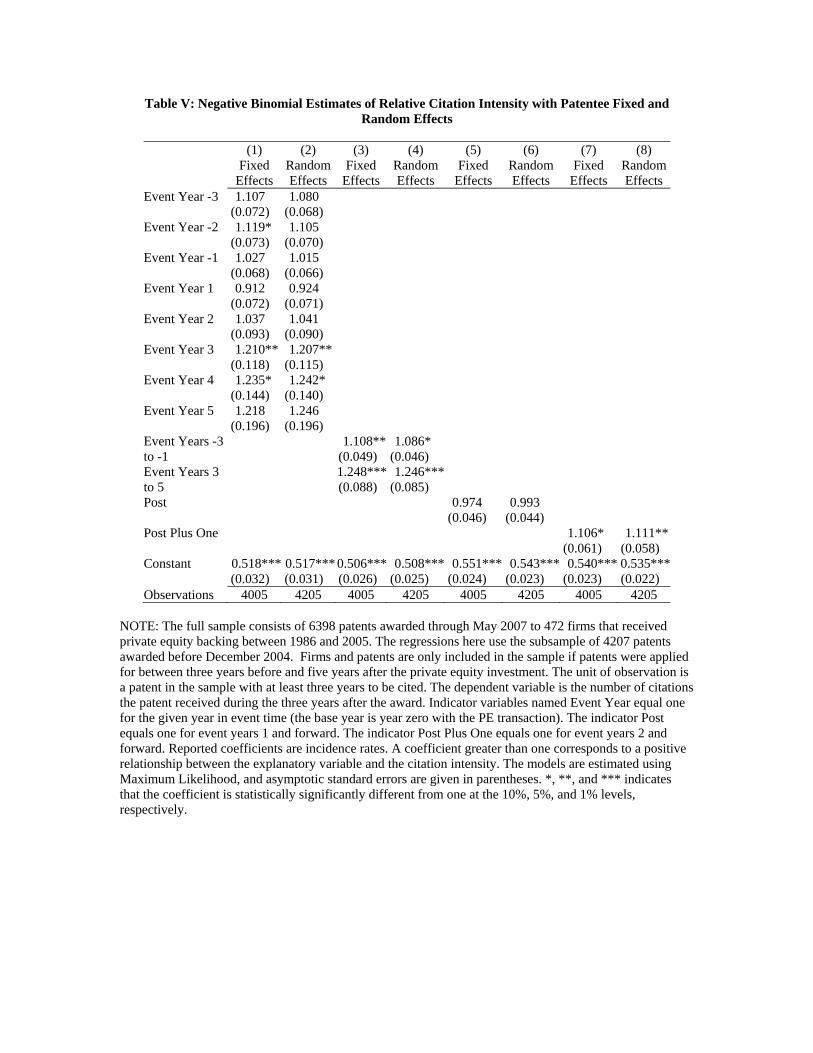
Table V: Negative Binomial Estimates of Relative Citation Intensity with Patentee Fixed and Random Effects
(1) (2) (3) (4) (5) (6) (7) (8) Fixed
Effects Random Effects
Fixed Effects
Random Effects
Fixed Effects
Random Effects
Fixed Effects
Random Effects
Event Year -3 1.107 1.080 (0.072) (0.068) Event Year -2 1.119* 1.105 (0.073) (0.070) Event Year -1 1.027 1.015 (0.068) (0.066) Event Year 1 0.912 0.924 (0.072) (0.071) Event Year 2 1.037 1.041 (0.093) (0.090) Event Year 3 1.210** 1.207** (0.118) (0.115) Event Year 4 1.235* 1.242* (0.144) (0.140) Event Year 5 1.218 1.246 (0.196) (0.196) Event Years -3 to -1
1.108** 1.086* (0.049) (0.046)
Event Years 3 to 5
1.248*** 1.246*** (0.088) (0.085)
Post 0.974 0.993 (0.046) (0.044)
Post Plus One 1.106* 1.111** (0.061) (0.058)
Constant 0.518*** 0.517*** 0.506*** 0.508*** 0.551*** 0.543*** 0.540*** 0.535*** (0.032) (0.031) (0.026) (0.025) (0.024) (0.023) (0.023) (0.022) Observations 4005 4205 4005 4205 4005 4205 4005 4205
NOTE: The full sample consists of 6398 patents awarded through May 2007 to 472 firms that received private equity backing between 1986 and 2005. The regressions here use the subsample of 4207 patents awarded before December 2004. Firms and patents are only included in the sample if patents were applied for between three years before and five years after the private equity investment. The unit of observation is a patent in the sample with at least three years to be cited. The dependent variable is the number of citations the patent received during the three years after the award. Indicator variables named Event Year equal one for the given year in event time (the base year is year zero with the PE transaction). The indicator Post equals one for event years 1 and forward. The indicator Post Plus One equals one for event years 2 and forward. Reported coefficients are incidence rates. A coefficient greater than one corresponds to a positive relationship between the explanatory variable and the citation intensity. The models are estimated using Maximum Likelihood, and asymptotic standard errors are given in parentheses. *, **, and *** indicates that the coefficient is statistically significantly different from one at the 10%, 5%, and 1% levels, respectively.

Table VI: OLS Estimates of Originality and Generality with Patentee Fixed Effects
(1) (2) (3) (4) (5) (6) (7) (8)
Originality Relative
Originality OriginalityRelative
Originality GeneralityRelative
Generality Generality Relative
GeneralityEvent Year -3 -0.039*** -0.010 0.051** 0.029
(0.013) (0.013) (0.024) (0.023) Event Year -2 -0.011 0.001 0.010 -0.006 (0.013) (0.012) (0.024) (0.023) Event Year -1 -0.006 0.001 0.016 0.013 (0.013) (0.012) (0.024) (0.024) Event Year 1 0.007 -0.008 -0.023 -0.024 (0.014) (0.014) (0.028) (0.028) Event Year 2 0.000 -0.021 -0.022 -0.019 (0.016) (0.015) (0.032) (0.031) Event Year 3 0.004 -0.020 -0.068* -0.044 (0.018) (0.017) (0.036) (0.035) Event Year 4 0.019 -0.028 -0.073* -0.053 (0.020) (0.020) (0.044) (0.043) Event Year 5 0.058** 0.011 0.139*** 0.126** (0.024) (0.023) (0.052) (0.051) Post 0.023*** -0.013 -0.045*** -0.029*
(0.008) (0.008) (0.017) (0.017) Constant 0.465*** 0.016 0.450*** 0.014* 0.366*** -0.026 0.390*** -0.015 (0.012) (0.011) (0.009) (0.008) (0.024) (0.023) (0.018) (0.016) Observations 6207 6142 6207 6142 2468 2437 2468 2437
NOTE: The full sample consists of 6398 patents awarded through May 2007 to 472 firms that received private equity backing between 1986 and 2005. The sample size is smaller in regressions examining generality because computing this measure requires that patents are subsequently cited. Firms and patents are only included in the sample if patents were applied for between three years before and five years after the private equity investment. The unit of observation is a patent in the sample for which originality and generality can be computed. The dependent variables are the originality and generality of the patents. Relative originality and generality are computed by subtracting the average originality and generality for patents in the same USPTO class and grant year. Indicator variables named Event Year equal one for the given year in event time (the base year is year zero with the PE transaction). The indicator Post equals one for event years 1 and forward. *, **, and *** indicates statistical significance at the 10%, 5%, and 1% levels, respectively
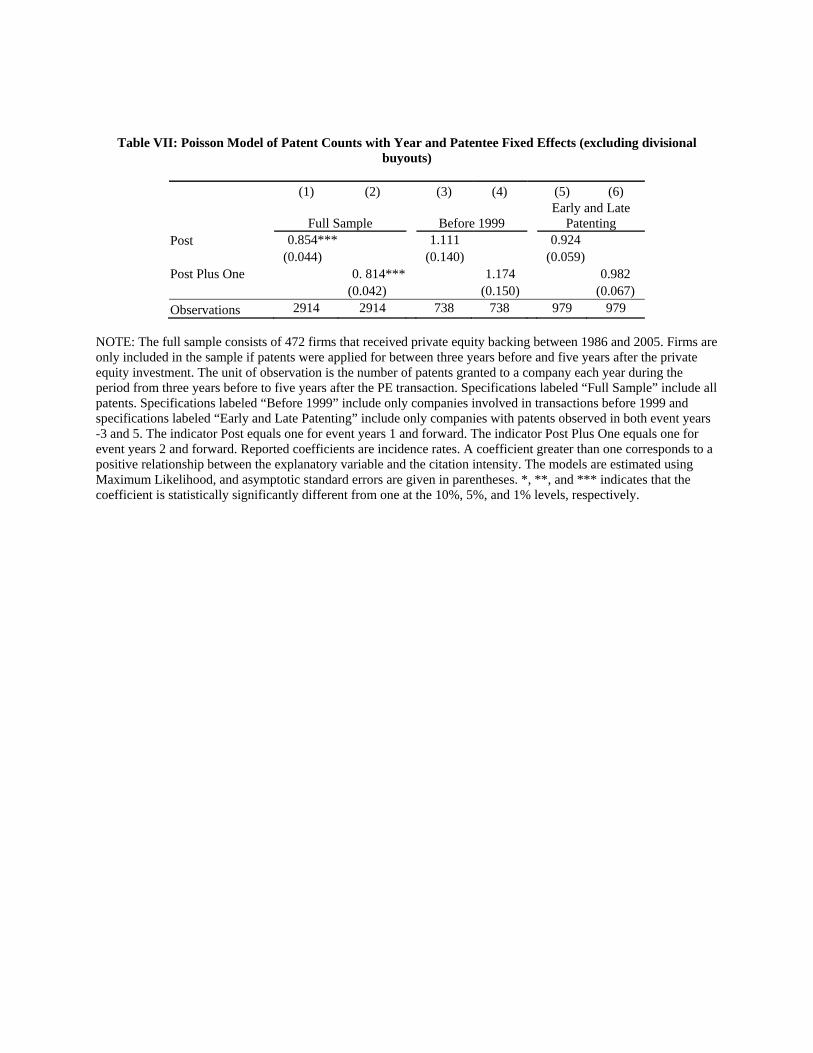
Table VII: Poisson Model of Patent Counts with Year and Patentee Fixed Effects (excluding divisional
buyouts)
(1) (2) (3) (4) (5) (6)
Full Sample Before 1999 Early and Late
Patenting Post 0.854*** 1.111 0.924 (0.044) (0.140) (0.059) Post Plus One 0. 814*** 1.174 0.982
(0.042) (0.150) (0.067)
Observations 2914 2914 738 738 979 979
NOTE: The full sample consists of 472 firms that received private equity backing between 1986 and 2005. Firms are only included in the sample if patents were applied for between three years before and five years after the private equity investment. The unit of observation is the number of patents granted to a company each year during the period from three years before to five years after the PE transaction. Specifications labeled “Full Sample” include all patents. Specifications labeled “Before 1999” include only companies involved in transactions before 1999 and specifications labeled “Early and Late Patenting” include only companies with patents observed in both event years -3 and 5. The indicator Post equals one for event years 1 and forward. The indicator Post Plus One equals one for event years 2 and forward. Reported coefficients are incidence rates. A coefficient greater than one corresponds to a positive relationship between the explanatory variable and the citation intensity. The models are estimated using Maximum Likelihood, and asymptotic standard errors are given in parentheses. *, **, and *** indicates that the coefficient is statistically significantly different from one at the 10%, 5%, and 1% levels, respectively.

Table VIII: Comparing Patent Citations in More or Less Active Classes
Panel A: Comparing Patents in Well- and Poorly Populated Patent Classes Prior to the PE Investment
Mean for
[-3,0] Mean for [+1,+5]
p-Value, t-Test Obs.
Citations in First Three Years
In Well-Populated Classes 2.10 3.27 0.00 2801
In Poorly Populated Classes 1.68 1.69 0.93 1254
Relative Citations in First 3 Years
In Well-Populated Classes 0.36 1.52 0.00 2801
In Poorly Populated Classes -0.07 -0.06 0.93 1254
Panel B: Comparing Patents in Growing and Shrinking Patent Classes Around Time of the PE Investment
Mean for
[-3,0] Mean for [+1,+5]
p-Value, t-Test Obs.
Citations in First Three Years
In Growing Classes 2.04 3.10 0.00 1637
In Shrinking Classes 2.11 1.71 0.03 1951
Relative Citations in First 3 Years
In Growing Classes 0.29 1.35 0.00 1637
In Shrinking Classes 0.36 -0.04 0.03 1951 NOTE: The full sample consists of 6398 patents awarded through May 2007 to 472 firms that received private equity backing between 1986 and 2005. The cross-tabulations here use the subsample of 4207 patents awarded before December 2004. The comparisons in the table are made at the individual patent level using HJT industry classification of the patents. We divide the patents by whether the share of the firm’s patents prior to the private equity investment in the given patent class was above or below the median share (15.3%), and by whether the share of the firm’s patents in the class after the buyout was greater or smaller (or equal) to the share in the class prior to the transaction.

Table IX: Negative Binomial Regressions of Citation Counts Controlling for Patent Class Share
Full Sample
With Patenting
Full Sample
With Patenting
(1) (2) (3) (4) Post 0.980 0.886 0.963 0.980 (0.077) (0.076) (0.081) (0.090) Share of Firm's Pre-Investment Patents in Class
1.110 1.274** (0.097) (0.155)
Post x Share … 2.819*** 3.769*** (0.464) (0.749) Change in Firm’s Patents in Class
1.024 1.013 (0.058) (0.0623
Post x Change… 1.691*** 1.719*** (0.184) (0.202) Observations 4054 2956 3587 2956
NOTE: The full sample consists of 6398 patents awarded through May 2007 to 472 firms that received private equity backing between 1986 and 2005. The regressions here use the subsample of 4207 patents awarded before December 2004. Firms and patents are only included in the sample if patents were applied for between three years before and five years after the private equity investment. The subsample named “With Patenting” only includes patents in firms that had, at least four successful patents before the transaction and four after the transaction. The unit of observation is a patent in the sample with at least three years to be cited. The dependent variable is the number of citations the patent received during the three years after the award. Share of Firm’s Pre-Investment Patents in Class is the fraction of the firms’ pre-transaction patents that are in the same HJT industry class. Change in Firm’s Patents in Class is an indicator for whether the difference in the share of patents in the class between the pre- and post-transaction periods is positive. The Post x Share and Post x Change variables are interaction terms. Reported coefficients are incidence rates. A coefficient greater than one corresponds to a positive relationship between the explanatory variable and the citation intensity. The models are estimated using Maximum Likelihood, and asymptotic standard errors are given in parentheses. *, **, and *** indicates that the coefficient is statistically significantly different from one at the 10%, 5%, and 1% levels, respectively.

Table X: Fixed Effects Negative Binomial Estimates of Self-Citations with Patentee Fixed Effects
(1) (2) (3) Event Year -3 1.115 0.161 Event Year -2 1.304* 0.185 Event Year -1 1.108 0.156 Event Year 1 0.983 0.164 Event Year 2 1.336* 0.234 Event Year 3 1.581** 0.291 Event Year 4 1.569** 0.336 Event Year 5 1.626* 0.454 Post 1.125 0.106 Post Plus One 1.354***
0.141 Constant 0.343*** 0.384*** 0.378*** 0.044 0.034 0.033 Observations 3096 3096 3096
NOTE: The full sample consists of 6398 patents awarded through May 2007 to 472 firms that received private equity backing between 1986 and 2005. The regressions here use the subsample of 3096 patents awarded before December 2004 for which we were able to identify self citations. Firms and patents are only included in the sample if patents were applied for between three years before and five years after the private equity investment. The unit of observation is a patent in the sample with at least three years to be cited. The dependent variable is the number of self-citations during the three years after the award. Indicator variables named Event Year equal one for the given year in event time (the base year with the PE transaction is year zero). The indicator Post equals one for event years 1 and forward. The indicator Post Plus One equals one for event years 2 and forward. Reported coefficients are incidence rates. A coefficient greater than one corresponds to a positive relationship between the explanatory variable and the citation intensity. The models are estimated using Maximum Likelihood, and asymptotic standard errors are given in parentheses. *, **, and *** indicates that the coefficient is statistically significantly different from one at the 10%, 5%, and 1% levels, respectively.

Figure 1: Citation Intensities from Negative Binomial Regression
NOTE: The full sample consists of 6398 patents awarded through May 2007 to 472 firms that received private equity backing between 1986 and 2005. The chart uses the subsample of 4207 patents awarded before December 2004. Firms and patents are only included in the sample if patents were applied for between three years before and five years after the private equity investment. The chart presents the estimated incidence rates and confidence intervals from the patent timing variables in the second specification in Table 4.