Embed Size (px)
Citation preview

FINANCIAL TIMES | Saturday June 17 2017
An FTMoney Guide
Private Client Wealth Management
I What does Brexit mean for wealth managers? Expat Britons may no longer be served by UK firms after EU departure — PAGES 4 & 5
I A passive argument Why are wealth managers so reluctant to invest in cheaper tracker funds? — PAGE 6
I Mifid II looms — Page 2
I Tide turns offshore — Page 6
I Robo refuseniks — Page 11

2 | FTMoney FINANCIAL TIMES Saturday 17 June 2017 FINANCIAL TIMES Saturday 17 June 2017 FTMoney | 3
PRIVATE CLIENT WEALTH MANAGEMENT
PerformanceReturns on averaged balanced portfolio (%) Returns on average growth portfolio (%)
Wealth manager Over 1 year Over 3 years (cum)
Over 5 years (cum)
ARC verified Over 1 year Over 3 years (cum)
Over 5 years (cum)
ARC verified
ACPI 3.7 12.7 33 √ 2.3 11.6 √Adam & Co 10.61 16.55 43.04 √ 12.9 19.73 53.2 √Barclays Wealth and Investment Management 11.7 18.4 41.7 √ 14 23.3 49 √Beaufort Investment Management 9.59 22.55 57.12 13.33 27.78 69.83Brewin Dolphin 10.4 18.92 √ 11.93 21.31 √Brooks MacDonald Asset Management 7.65 16.52 40.52 √ 9.23 18.62 46.5 √Canaccord Genuity Wealth Management 9.83 17.65 47.95 √ 10.42 21.33 57.35 √Cantab Asset Management 12.49 28.84 69.8 14.64 29.98 70.52Cazenove Capital Management 11.5 16.6 41.4 √ 13.3 19.2 50.2 √Charles Stanley 10 16.7 39 √ 11.9 18.3 49.5 √Citi Private Bank 12.69 20.09 33.65 √ 16.35 27.03 49.74 √Citigold 5 12 36 6 13 43Close Brothers Asset Management 9.44 18.93 40.85 √ 11.71 20.49 47.03 √Coutts 12.17 19.88 38.8 √ 16.19 23.38 49.22 √Credit Suisse 8.48 13.14 37.5 √ 10.89 15.81 48.56 √Dart Capital 8.79 23.32 52.89 9.47 24.35 57.24Equilibrium Asset Management 7.88 19.1 52.45 11.35 23.64 55.58GAM 9.4 15.1 43.5 √ 13.3 19.1 56.5 √Greystone 12.26 22.36 51.25 √ 13.02 26.61 62.15 √HSBC 12.1 21.96 31.52 16.82 26.67 46.13Investec Wealth and Investment 12.3 19 51.6 √ 13.9 20.7 57.8 √Investment Quorum 9.57 18.81 51.48 11.37 30.65 74.13JM Finn 12.34 18.61 50.63 12.35 19.21 50.4James Hambro & Partners 10.5 21.8 49.6 √ 13.1 24.6 60.3 √Julius Baer 21.3 33.2 56 23.4 35.8 68.6Killik & Co - - - - - - -London & Capital Asset Management 5.44 13.31 31.5 √ 14.4 29.47 53.39 √McInroy & Wood 14.3 20.6 52.5 √ 18.6 31 62.4 √Psigma Investment Management 11.62 15.02 39.89 √ 14.27 18.64 47.46 √Rathbones Investment Management 10.46 18.32 41.05 √ 12.7 20.58 50.9 √Redmayne-Bentley 9.82 16.58 37.46 √ 11.12 17.57 47.4 √Rothschild Wealth Management 10.13 20.17 45.36 √ 12.48 24.03 55.38 √Ruffer 10.9 15.5 34.1 √Sarasin & Partners 10.06 20.14 45.59 √ 11.79 22.18 51.91 √Saunderson House Limited 10.5 19.88 50.71 √ 12.01 22.29 58.14 √Smith and Williamson 11.73 20.29 41.5 √ 13.51 22.7 54.41 √St. James's Place 12.9 20.4 45.7 √ 16.2 24.4 69.7 √Standard Life Wealth 12.19 23.9 47.6 √ 12.65 26.64 61.67 √Stonehage Fleming 10.76 16.55 28.35 √ 11.82 16.89 32.25 √Tilney Group 10.5 21.1 54.6 √ 11.8 23.2 61 √UBS Wealth Management (UK) 9.58 16.89 38.38 √ 13.38 21.13 51.12 √Veritas Investment Management 14.4 25.8 47.5 √ 15.6 28.5 54.4 √W H Ireland 8.47 19.68 46.07 √ 11.88 22.4 52.12 √Walker Crips 19.1 29.3 22.3 32.4Waverton Investment management 7.88 15.1 36.87 √ 12.77 21.5 49.84 √Average 10.74 19.35 44.19 13.08 22.97 54.65Max 21.30 33.20 69.80 23.40 35.80 74.13Min 3.70 12.00 28.35 2.30 11.60 32.25
Source: Wealth-X Private Client Wealth Management Survey 2017 Killik & Co declined to issue performance data Returns are net of fees
Current asset allocation of the average capitalgrowth portfolio invested on behalf of UKprivate clients (%)
Source: WealthX
Equities 66.3
Corporate Bonds 10.4Government Bonds 5.1
Cash 4.1Hedge Funds 4.1Property 2.5Commodities 1.2
Private Equity 0.6
Others 5.7
PRIVATE CLIENT WEALTH MANAGEMENT
AIME WILLIAMS
It might not sound very scary,but the whisper the words“Mifid II” to any wealth man-ager and watch the bloodslowlydrainfromtheir face.
Afearsomepieceof financiallegislation, the Markets inFinancial Instruments Direc-tive II has been seven years inthe making, but comes intoforce in January next year.With just months to go beforethese complex rules are imple-mented, firms complain thatthey are still waiting for regu-lators to clarify exactly howtheywillwork.
“It is the project from hellanddetailsarecomingout late,
so firms are having to take aview and crack on,” says IanCornwall, director of regula-tion at the wealth managers’industrybody.
In this year’s snapshot of thewealth management industry,conducted by Wealth-X for theFT, the majority of firms sur-veyed said getting ready forMifid II was a major preoccu-pation, eating up considerablecostsandresources.
According to an estimatefrom consultancy EY, a typicalmedium-sized UK wealthmanager is spending between£3m and £5m on “gettingready” for Mifid II. “This is theissue de jour for most wealthmanagers,” says AnthonyKirby, director of regulatoryandriskmanagementatEY.
The regulations requirewealth managers to send fundhouses detailed reports on
who is buying their funds — aswell as writing to retail inves-tors more frequently to tellthem how their portfolio isperforming.
These new requirements arecausing “grief and work”, saysDavid Ogden, complianceofficer at Seven InvestmentManagement, not to mentionthe vast expense of buying innew technology and data sys-tems.
More than half of thosewealth managers surveyed byWealth-X said the new ruleswould have a “large” or “verylarge” impact on their busi-ness, with many citing theneed to upgrade their technol-ogy to handle the new level ofscrutinytheyface.
There is also a human cost,says Mr Cornwall. “You’ll haveto take your best staff out ofthe day-to-day business to
work on this. It doesn’t stay inthe compliance [depart-ment].”
On top of this, the regulationwill change how wealth man-agers pay for investmentresearch from brokers andinvestment banks. Several ofthe managers surveyed saidthis was among their mainconcerns, and they are expect-inga largebill.
Exactly how large is unclear,
but some banks have put for-wards quotes of $10m (£7.8m)a year to provide larger assetmanagers with completeaccess to their research, sowealthmanagersareworried.
Other concerns revolvearoundanewlevelof transpar-ency for costs and charges.Mifid II will require wealthmanagers to be much clearerabout the fees they are charg-ing. That is good news for cli-ents, who will find it easier tocompare costs and shoparound, but analysts say it willfurther weigh on the profits ofwealthmanagers.
“Transparency comes fromgreater disclosure of fees, andnot just for high net worth [cli-ents] but for retail [investors]too,” says Kinner Lakhani,Deutsche Bank’s head of Euro-pean bank research. “Greatertransparency leads to marginpressure.”
This all comes aside fromthe matter of Brexit, whichthreatens to cut off many UK-based wealth managers fromtheir continental clients. TheWealth-X survey found thatmore than half of those withEuropean clients do not knowhowtheywill continuetoservethem if the UK leaves the sin-gle market, and are waiting formore information beforeputtingaplaninplace.
On a more positive note,Brexit helped the bulk ofwealth managers’ portfolioperformance. The Brexit votecaused sterling to plunge to itslowest level against the dollarfor more than 31 years — butthis flattering currency effectprovided a boost for those withoverseas investments.
Most UK wealth manage-ment portfolios would havebeen sterling denominated buthad international exposure,says Tom Sheridan, chiefinvestment officer at SevenInvestment Management.“The devaluation of the poundwould have helped them a lot.”
According to Wealth-X, theaverage balanced portfolioreturned 10.74 per cent (net offees) in 2016 — up from just 2.3percenttheyearbefore.Toputthis figure in context, 2015 was
particularly poor, with wealthmanagers returning 4.8 percent in 2014, 11.3 per cent in2013and9.1percent in2012.
There was a similar story forgrowth portfolios, whichposted returns of 13.08 percent (net of fees) in 2016, com-paredwith3.2percent in2015,5.1 per cent in 2014 and 14.9per cent and 12 per cent thetwopreviousyears.
Managers safely outper-formed the FTSE All Worldindex, which includes equitiesfrom around the globe andreturned approximately 5 percent in2016.
The asset allocations in anaverage growth portfolio havenot changed a great deal fromlast year. Wealth managershave about 66 per cent of theirassets invested in equities,around 15 per cent in bonds,2.5 per cent in property andaround 5 per cent in hedgefundsorprivateequity.
As the expectation of risinginterest rates in the UK andEurope grows, investors saythey plan to reduce exposureto bonds and increase theirexposure to equities. Somehave taken renewed interest inalternative asset classes —includinghedgefunds.
Managers may have man-aged to outperform the indexin 2016, but their allocation tolow-cost index-tracking pas-sive funds is increasing (albeitfromalowbase).
More than half of the man-agers surveyed have increasedtheir exposure, although pas-sive funds still only account forless than a tenth of their assetsundermanagement.
Some wealth managers haverecently been candidly advis-ing their clients of the benefitsof switching into passive fundsas asset managers faceincreased scrutiny over highfees and poor performancefromregulators.
Following Vanguard’s entryto the UK marketplace thisyear, the fear of large low-costfund houses selling passiveproducts directly to investorswill be looming large overwealth managers as they grap-plewithregulatory issues.
Gloomy spectreof Mifid II hangsover managers
Mifid II is due to come fully into force in January — Bloomberg
REGULATION
Firms still waiting forregulator to clarifycomplex new rules
Tilney Group has the best-performing average balancedportfolio over five years of the34 ARC-verified wealthmanagers surveyed byWealth-X, posting acumulative return of 54.6 percent, net of fees.
McInroy & Wood ranked
second with 52.5 per cent,closely followed by InvestecWealth & Investment, whichposted 51.6 per cent.
A total of 45 wealthmanagers responded to the2016 survey, of which 34committed to have theirperformance figuresindependently verified byAsset Risk Consultants (ARC),an investment consultancy.
Jason Hollands, managing
director of Tilney Group,ascribes the company’sperformance to a “robustasset allocation approach”that combined predominantlyactive management with acommitment to use passives.
For the average growthportfolio over five years, StJames’s Place took first placeof the 33 ARC-verifiedcompanies with a cumulativereturn of 69.7 per cent, net of
fees. McInroy & Wood weresecond with 62.4 per cent,while Greystone was justbehind on 62.15 per cent.
Andrew Humphries, privateclient director at St. James’sPlace, says the companyoffers good performance “bycombining different strategiesand asset classes” and“identifying high-qualityactive managers from aroundthe globe”. Hugo Greenhalgh
Top performersrevealed
ARC verification
Asset Risk Consultants(ARC) provide independentverification of participatingcompanies’ performancefigures. Not all companiessubmit data or subscribe toARC, so where indicated,the performance data hasnot been verified.
4 | FTMoney FINANCIAL TIMES Saturday 17 June 2017 FINANCIAL TIMES Saturday 17 June 2017 FTMoney | 5
PRIVATE CLIENT WEALTH MANAGEMENT PRIVATE CLIENT WEALTH MANAGEMENT
ATTRACTA MOONEY
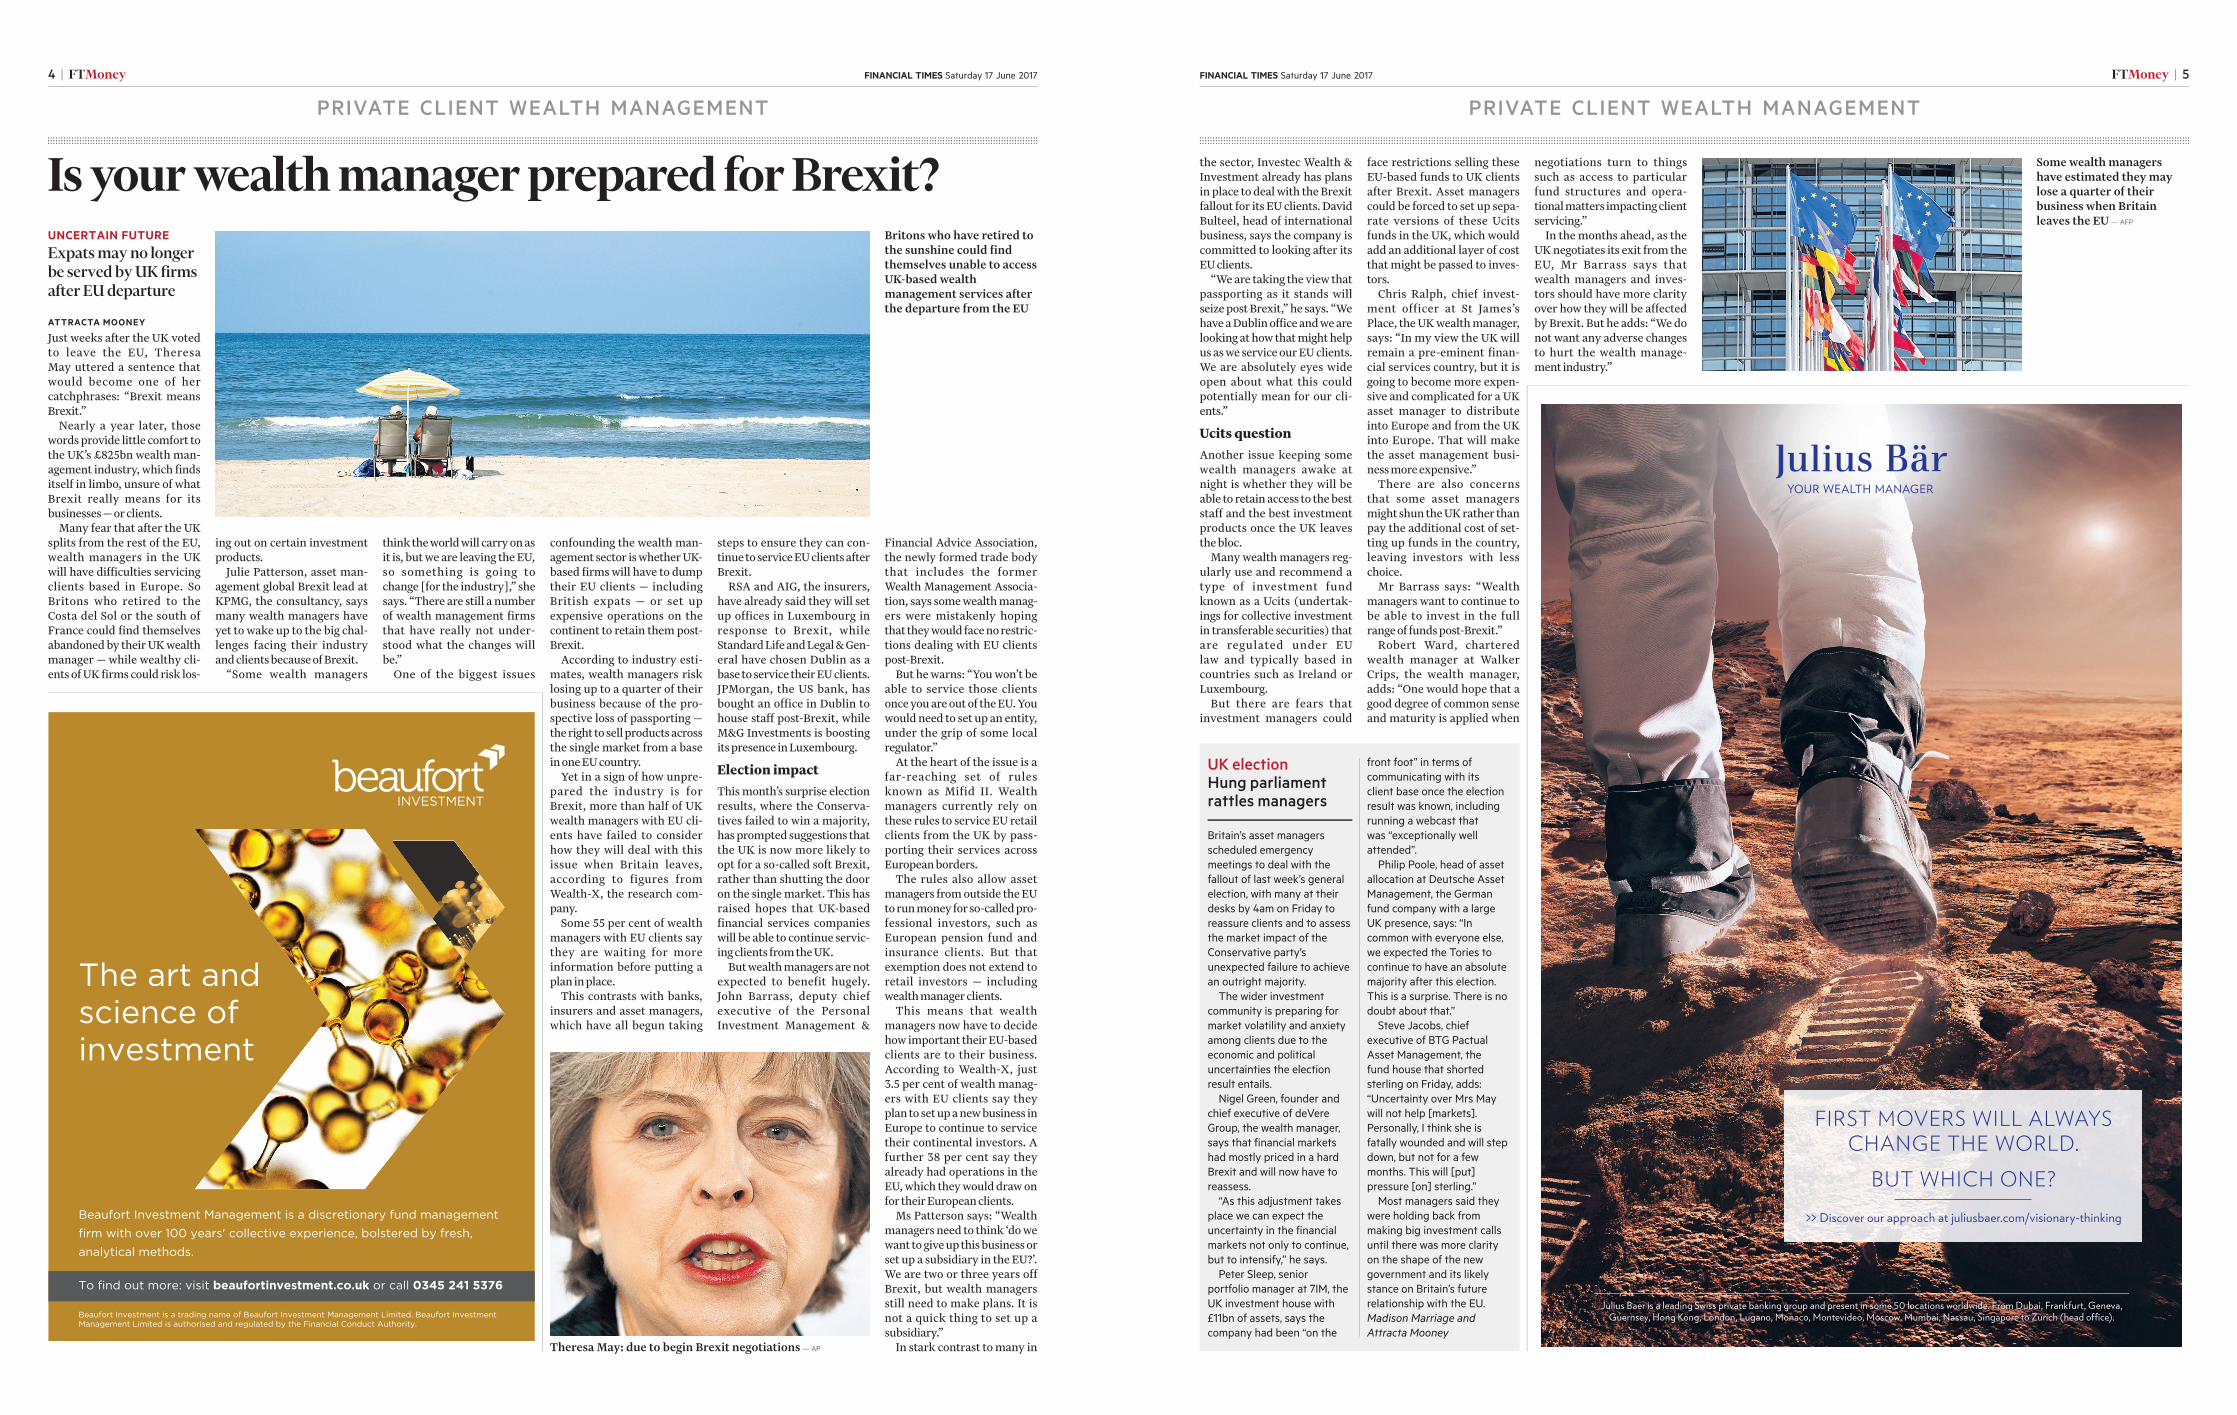
Just weeks after the UK votedto leave the EU, TheresaMay uttered a sentence thatwould become one of hercatchphrases: “Brexit meansBrexit.”
Nearly a year later, thosewords provide little comfort tothe UK’s £825bn wealth man-agement industry, which findsitself in limbo, unsure of whatBrexit really means for itsbusinesses—orclients.
Many fear that after the UKsplits from the rest of the EU,wealth managers in the UKwill have difficulties servicingclients based in Europe. SoBritons who retired to theCosta del Sol or the south ofFrance could find themselvesabandoned by their UK wealthmanager — while wealthy cli-ents of UK firms could risk los-
ing out on certain investmentproducts.
Julie Patterson, asset man-agement global Brexit lead atKPMG, the consultancy, saysmany wealth managers haveyet to wake up to the big chal-lenges facing their industryandclientsbecauseofBrexit.
“Some wealth managers
thinktheworldwill carryonasit is, but we are leaving the EU,so something is going tochange [for the industry],” shesays. “There are still a numberof wealth management firmsthat have really not under-stood what the changes willbe.”
One of the biggest issues
confounding the wealth man-agement sector is whether UK-based firms will have to dumptheir EU clients — includingBritish expats — or set upexpensive operations on thecontinent to retain them post-Brexit.
According to industry esti-mates, wealth managers risklosing up to a quarter of theirbusiness because of the pro-spective loss of passporting —theright tosellproductsacrossthe single market from a baseinoneEUcountry.
Yet in a sign of how unpre-pared the industry is forBrexit, more than half of UKwealth managers with EU cli-ents have failed to considerhow they will deal with thisissue when Britain leaves,according to figures fromWealth-X, the research com-pany.
Some 55 per cent of wealthmanagers with EU clients saythey are waiting for moreinformation before putting aplaninplace.
This contrasts with banks,insurers and asset managers,which have all begun taking
steps to ensure they can con-tinuetoserviceEUclientsafterBrexit.
RSA and AIG, the insurers,have already said they will setup offices in Luxembourg inresponse to Brexit, whileStandardLifeandLegal&Gen-eral have chosen Dublin as abase toservice theirEUclients.JPMorgan, the US bank, hasbought an office in Dublin tohouse staff post-Brexit, whileM&G Investments is boostingitspresence inLuxembourg.
Election impactThis month’s surprise electionresults, where the Conserva-tives failed to win a majority,has prompted suggestions thatthe UK is now more likely toopt for a so-called soft Brexit,rather than shutting the dooron the single market. This hasraised hopes that UK-basedfinancial services companieswill be able to continue servic-ingclients fromtheUK.
But wealth managers are notexpected to benefit hugely.John Barrass, deputy chiefexecutive of the PersonalInvestment Management &
Financial Advice Association,the newly formed trade bodythat includes the formerWealth Management Associa-tion, says some wealth manag-ers were mistakenly hopingthat theywouldfacenorestric-tions dealing with EU clientspost-Brexit.
But he warns: “You won’t beable to service those clientsonce you are out of the EU. Youwould need to set up an entity,under the grip of some localregulator.”
At the heart of the issue is afar-reaching set of rulesknown as Mifid II. Wealthmanagers currently rely onthese rules to service EU retailclients from the UK by pass-porting their services acrossEuropeanborders.
The rules also allow assetmanagers from outside the EUtorunmoneyforso-calledpro-fessional investors, such asEuropean pension fund andinsurance clients. But thatexemption does not extend toretail investors — includingwealthmanagerclients.
This means that wealthmanagers now have to decidehow important their EU-basedclients are to their business.According to Wealth-X, just3.5 per cent of wealth manag-ers with EU clients say theyplan to set up a new business inEurope to continue to servicetheir continental investors. Afurther 38 per cent say theyalready had operations in theEU, which they would draw onfortheirEuropeanclients.
Ms Patterson says: “Wealthmanagers need to think ‘do wewant to give up this business orset up a subsidiary in the EU?’.We are two or three years offBrexit, but wealth managersstill need to make plans. It isnot a quick thing to set up asubsidiary.”
In stark contrast to many in
the sector, Investec Wealth & Investment already has plans in place to deal with the Brexitfallout for its EU clients. DavidBulteel, head of internationalbusiness, says the company iscommitted to looking after itsEUclients.
“We are taking the view thatpassporting as it stands willseize post Brexit,” he says. “Wehave a Dublin office and we arelooking at how that might helpus as we service our EU clients.We are absolutely eyes wideopen about what this couldpotentially mean for our cli-ents.”
Ucits questionAnother issue keeping somewealth managers awake atnight is whether they will beable to retain access to the beststaff and the best investmentproducts once the UK leavesthebloc.
Many wealth managers reg-ularly use and recommend atype of investment fundknown as a Ucits (undertak-ings for collective investmentin transferable securities) thatare regulated under EUlaw and typically based incountries such as Ireland orLuxembourg.
But there are fears thatinvestment managers could
face restrictions selling theseEU-based funds to UK clientsafter Brexit. Asset managerscould be forced to set up sepa-rate versions of these Ucitsfunds in the UK, which wouldadd an additional layer of costthat might be passed to inves-tors.
Chris Ralph, chief invest-ment officer at St James’sPlace, the UK wealth manager,says: “In my view the UK willremain a pre-eminent finan-cial services country, but it isgoing to become more expen-sive and complicated for a UKasset manager to distributeinto Europe and from the UKinto Europe. That will makethe asset management busi-nessmoreexpensive.”
There are also concernsthat some asset managersmight shun the UK rather thanpay the additional cost of set-ting up funds in the country,leaving investors with lesschoice.
Mr Barrass says: “Wealthmanagers want to continue tobe able to invest in the fullrangeof fundspost-Brexit.”
Robert Ward, charteredwealth manager at WalkerCrips, the wealth manager,adds: “One would hope that agood degree of common senseand maturity is applied when
negotiations turn to thingssuch as access to particularfund structures and opera-tionalmatters impactingclientservicing.”
In the months ahead, as theUK negotiates its exit from theEU, Mr Barrass says thatwealth managers and inves-tors should have more clarityover how they will be affectedby Brexit. But he adds: “We donot want any adverse changesto hurt the wealth manage-ment industry.”
Is your wealth manager prepared for Brexit?UNCERTAIN FUTURE
Expats may no longerbe served by UK firmsafter EU departure
Britons who have retired tothe sunshine could findthemselves unable to accessUK-based wealthmanagement services afterthe departure from the EU
Theresa May: due to begin Brexit negotiations — AP
Some wealth managershave estimated they maylose a quarter of theirbusiness when Britainleaves the EU — AFP
Britain’s asset managersscheduled emergencymeetings to deal with thefallout of last week’s generalelection, with many at theirdesks by 4am on Friday toreassure clients and to assessthe market impact of theConservative party’sunexpected failure to achievean outright majority.
The wider investmentcommunity is preparing formarket volatility and anxietyamong clients due to theeconomic and politicaluncertainties the electionresult entails.
Nigel Green, founder andchief executive of deVereGroup, the wealth manager,says that financial marketshad mostly priced in a hardBrexit and will now have toreassess.
“As this adjustment takesplace we can expect theuncertainty in the financialmarkets not only to continue,but to intensify,” he says.
Peter Sleep, seniorportfolio manager at 7IM, theUK investment house with£11bn of assets, says thecompany had been “on the
front foot” in terms ofcommunicating with itsclient base once the electionresult was known, includingrunning a webcast thatwas “exceptionally wellattended”.
Philip Poole, head of assetallocation at Deutsche AssetManagement, the Germanfund company with a largeUK presence, says: “Incommon with everyone else,we expected the Tories tocontinue to have an absolutemajority after this election.This is a surprise. There is nodoubt about that.”
Steve Jacobs, chiefexecutive of BTG PactualAsset Management, thefund house that shortedsterling on Friday, adds:“Uncertainty over Mrs Maywill not help [markets].Personally, I think she isfatally wounded and will stepdown, but not for a fewmonths. This will [put]pressure [on] sterling.”
Most managers said theywere holding back frommaking big investment callsuntil there was more clarityon the shape of the newgovernment and its likelystance on Britain’s futurerelationship with the EU.Madison Marriage andAttracta Mooney
UK electionHung parliamentrattles managers

6 | FTMoney FINANCIAL TIMES Saturday 17 June 2017
PRIVATE CLIENT WEALTH MANAGEMENT
Investment allocationCurrent asset allocation of the average balanced portfolio invested on behalf of UK private clients (%)
Current asset allocation of the average capital growth portfolio invested on behalf of UK private clients (%)
Wealth manager Cash Equities Bonds: Corporate
Bonds: Government
Property Private Equity
Hedge Funds
Commodities Other Cash Equities Bonds: Corporate
Bonds: Government
Property Private Equity
Hedge Funds
Commodities Other
ACPI 15.0 30.0 50.0 0.0 0.0 0.0 5.0 0.0 0.0 5.0 40.0 40.0 0.0 0.0 0.0 15.0 0.0 0.0Adam & Co 2.0 52.0 25.0 17.0 4.0 0.0 0.0 0.0 0.0 2.0 78.0 10.0 7.0 3.0 0.0 0.0 0.0 0.0Barclays Wealth and Investment Mgnt 4.0 54.0 8.0 4.0 4.0 0.0 8.0 4.0 14.0 4.0 62.0 5.0 2.0 4.0 0.0 7.0 4.0 12.0Beaufort Investment Management 8.3 45.7 18.6 0.0 12.0 0.0 8.5 0.0 6.9 6.5 65.8 8.2 0.0 7.5 0.0 6.6 0.0 5.4Brewin Dolphin 4.0 56.0 15.5 6.5 3.5 0.0 0.0 0.0 14.5 2.0 80.0 4.5 2.0 3.0 0.0 0.0 0.0 8.5Brooks MacDonald Asset Mgnt 5.0 43.0 35.0 3.0 4.0 0.0 0.0 0.0 10.0 3.0 66.0 17.0 3.0 4.0 0.0 0.0 0.0 7.0Canaccord Genuity Wealth Mgnt 5.0 68.5 13.6 0.0 0.0 0.0 0.0 0.0 12.8 3.4 79.8 5.4 0.0 0.0 0.0 0.0 0.0 11.4Cantab Asset Management 0.0 55.0 20.0 0.0 5.0 0.0 0.0 0.0 20.0 0.0 65.0 10.0 0.0 5.0 0.0 0.0 0.0 20.0Cazenove Capital Management 5.5 45.5 8.2 14.0 5.2 0.0 6.6 3.8 11.2 3.1 65.7 3.6 9.2 2.6 0.0 5.3 2.5 8.0Charles Stanley 0.0 68.9 4.3 12.1 3.4 0.1 5.8 0.0 5.4 0.0 86.1 1.8 5.3 1.8 0.3 1.9 0.0 2.8Citi Private Bank 2.0 42.0 19.0 19.0 0.0 0.0 12.0 0.0 6.0 1.0 62.0 12.0 11.0 0.0 0.0 10.0 0.0 4.0Citigold 1.0 44.0 28.0 21.0 6.0 0.0 0.0 0.0 0.0 1.0 57.0 26.0 8.0 4.0 0.0 0.0 0.0 4.0Close Brothers Asset Management 3.0 71.4 17.7 3.5 0.0 0.0 0.0 1.3 3.2 2.9 84.7 7.1 1.2 0.0 0.0 0.0 1.7 2.4Coutts 3.6 46.4 21.0 6.5 6.0 0.0 12.0 1.5 3.0 2.6 73.4 12.5 0.0 4.0 0.0 6.0 1.5 0.0Credit Suisse 1.3 46.9 33.6 0.0 2.4 0.0 10.0 5.8 0.0 0.6 68.4 13.8 0.0 2.3 0.0 9.1 5.8 0.0Dart Capital 1.0 60.5 9.0 9.0 5.5 0.0 12.0 3.0 0.0 1.5 69.5 6.0 7.8 4.5 0.0 7.8 3.0 0.0Equilibrium Asset Management 11.0 29.0 15.0 5.0 3.0 0.0 0.0 0.0 37.0 10.0 43.0 9.0 3.0 3.0 0.0 0.0 0.0 32.0GAM 5.5 48.0 5.3 4.0 0.0 0.0 24.0 0.0 13.2 3.7 66.8 4.2 0.0 0.0 0.0 21.3 0.0 4.0Greystone 2.0 49.0 22.0 6.0 10.0 0.0 0.0 0.0 11.0 1.0 69.0 8.5 5.5 0.0 0.0 0.0 0.0 16.0HSBC 4.5 23.8 24.8 27.0 3.3 0.0 13.3 3.3 0.0 4.5 35.2 21.0 14.3 5.0 5.5 12.5 2.0 0.0Investec Wealth and Investment 4.0 62.0 10.0 9.5 5.5 0.0 4.0 3.0 2.0 3.0 78.0 4.0 5.0 3.0 0.0 2.0 3.0 2.0Investment Quorum 2.0 47.0 25.0 15.0 11.0 0.0 0.0 0.0 0.0 3.0 70.0 5.0 0.0 0.0 0.0 0.0 5.0 17.0JM Finn - - - - - - - - - - - - - - - - -James Hambro & Partners 8.0 55.0 4.5 13.5 0.0 0.0 0.0 0.0 19.0 7.0 70.0 0.0 9.0 0.0 0.0 0.0 0.0 14.0Julius Baer 7.7 56.0 16.0 11.8 2.5 0.0 4.5 0.0 1.5 7.7 72.0 8.0 1.8 3.5 0.0 5.5 0.0 1.5Killik & Co - - - - - - - - - - - - - - - - -London & Capital Asset Management 8.0 44.0 46.0 2.0 0.0 0.0 0.0 0.0 0.0 7.0 65.0 26.0 2.0 0.0 0.0 0.0 0.0 0.0McInroy & Wood 1.0 60.0 0.0 34.0 0.0 0.0 0.0 5.0 0.0 1.0 60.0 0.0 34.0 0.0 0.0 0.0 5.0 0.0Psigma Investment Management 6.5 43.5 20.5 14.0 0.0 0.0 3.5 2.5 9.5 2.8 56.3 18.0 7.3 0.0 0.0 3.5 3.0 9.3Rathbones Investment Management 22.0 33.0 16.0 10.0 0.0 0.0 0.0 5.0 14.0 9.5 62.0 12.5 5.0 0.0 0.0 0.0 3.0 8.0Redmayne-Bentley 0.0 50.0 7.5 17.5 10.0 0.0 0.0 0.0 15.0 0.0 67.0 4.0 4.0 10.0 0.0 0.0 0.0 15.0Rothschild Wealth Management 15.0 59.3 11.4 0.0 0.0 0.0 14.2 0.0 0.1 9.4 72.2 3.0 0.0 0.0 0.0 15.3 0.0 0.1Ruffer 14.0 37.0 0.0 38.0 0.0 0.0 1.0 4.0 6.0Sarasin & Partners 5.1 42.6 7.9 30.6 1.3 0.0 0.0 1.7 11.0 5.5 59.2 7.1 14.4 1.6 0.4 2.0 1.7 8.2Saunderson House Limited 6.0 50.0 28.0 8.0 8.0 0.0 0.0 0.0 0.0 3.0 61.0 22.0 6.0 8.0 0.0 0.0 0.0 0.0Smith and Williamson 2.0 79.0 5.0 2.0 5.0 3.5 3.5 0.0 0.0 2.0 65.0 10.0 8.0 5.0 5.0 5.0 0.0 0.0St. James's Place 9.0 49.2 24.4 5.6 8.8 0.0 0.0 2.0 1.0 7.5 62.6 18.4 9.9 0.0 0.0 0.0 0.0 1.7Standard Life Wealth 7.7 59.7 13.1 8.3 3.6 0.0 0.0 0.0 7.7 2.6 72.9 9.7 4.6 4.4 0.0 0.0 0.0 5.8Stonehage Fleming 0.6 50.9 13.0 15.1 0.0 10.0 0.0 0.0 10.4 0.6 63.3 11.0 5.3 0.0 15.0 0.0 0.0 4.8Tilney Group 8.0 56.0 8.0 4.0 4.0 0.0 16.0 4.0 0.0 7.0 68.0 4.0 1.0 3.0 0.0 13.0 4.0 0.0UBS Wealth Management (UK) 5.0 42.0 17.0 16.0 0.0 0.0 18.0 0.0 2.0 5.0 62.0 10.0 7.0 0.0 0.0 14.0 0.0 2.0Veritas Investment Management 17.0 53.0 27.0 3.0 0.0 0.0 0.0 0.0 0.0 16.4 68.3 13.1 2.2 0.0 0.0 0.0 0.0 0.0W H Ireland 5.5 50.5 18.5 5.0 8.0 0.0 2.5 5.0 5.0 5.0 67.0 8.0 2.5 6.5 0.0 6.0 5.0 0.0Walker Crips 3.0 62.5 10.0 7.5 5.0 0.0 0.0 0.0 12.0 1.0 77.5 5.0 2.5 5.0 0.0 0.0 0.0 9.0Waverton Investment management 8.9 51.0 13.4 3.4 2.7 0.0 9.8 1.9 8.9 7.6 68.7 10.3 2.6 0.9 0.0 2.8 2.1 5.0
Average (mean) 5.8 50.5 17.1 10.0 3.5 0.3 4.5 1.3 6.8 4.1 66.3 10.4 5.1 2.5 0.6 4.1 1.2 5.7Max 22.00 79.00 50.00 38.00 11.98 10.00 24.00 5.80 37.00 16.40 86.10 40.00 34.00 10.00 15.00 21.30 5.80 32.00Min 0 24 0 0 0 0 0 0 0 0 35 0 0 0 0 0 0 0Source: Wealth-X Private Client Wealth Management Survey 2017 JM Finn and Killik & Co declined to issue investment allocation data. Portfolios may not add up to 100 per cent as they have been rounded to one decimal place
ATTRACTA MOONEY
Less than a tenth of wealthmanagement clients’ assetsare invested incheaperpassivefunds, despite widespreadcriticism of active stockpick-ers by academics and regula-tors over high fees and badperformance.
Active funds, where portfo-lio managers select invest-ments rather than follow anindex, have come underintense scrutiny in recentyears on the back of damningresearch that found that themajority fail to beat theirbenchmark.
More than half of wealth
managers in the UK say theyhave increased the use ofcheap passive funds, but theystill remain a tiny part of clientportfolios, according to figuresfrom Wealth-X, the researchprovider.
Just 9 per cent of assets inportfolios run by UK wealthmanagers, on average, wereinvested in passive funds,which track an index ratherthan try to actively pick thebest-performing stocks. Morethan a quarter of 36 Britishwealth managers polled saidzero per cent of their clients’portfolios were invested inpassive funds.
Amin Rajan, chief executiveof Create Research, the invest-ment industry consultancy,says wealth managers havebeen slow to embrace passivefunds over concerns that these
strategies could suffer in diffi-cultmarkets.
“Passives are cheap, but notcheerful, as most wealth man-agers recognise,” he says.“However, if active funds con-tinue to underperform, wealthmanagers will be forced toincrease their allocations topassives in order to attract andretainassets.”
Last year, research by S&PDow Jones, the index provider,found that almost all US,global and emerging marketfunds had failed to outperformthe market since 2006.Regulators in Europe alsofound that many active fundswere charging high feesdespite closely following theirbenchmark, a practice known
ascloset tracking.Matt Philips, managing
director at Thomas MillerWealth Management, a UKcompany that oversees £3bnfor its investors, says he hasbeen advising clients to usepassive funds for many yearsover concerns about activefundmanagers’performance.
“The underperformance ofactive funds is a consequenceof too many managers mas-querading as active when thenare really index ‘huggers’ anddoing it at an expense, which isnot justified by the outcomesand performance,” he says. “Inthese circumstances we’d buya passive strategy. We avoidthese fundscompletely.”
Lynn Hutchinson, senior
analystatCharlesStanley, saysthe wealth manager hasturned to passive funds —including exchange tradedfunds (ETFs) and index track-ers — in recent years in a bid tofind cheaper ways of accessingmarkets.
She says: “The bottom line isthat you can’t rely on a brandname or a past record to besure of outperformance fromanactive fundmanager.”
Rising concerns about activefunds have contributed to therapid growth of the passivemanagement industry.Figuresfrom Morningstar, the dataprovider, show that moneyinvested into passive fundsglobally grew 4.5 times fasterthan those under active man-agement in2016.
In the UK, assets managed inpassive funds grew by morethan 24 per cent between theend of 2015 and April 2017,while active fund assetsincreasedbyjust3percent.
However, strong demandfor passive funds has alsosparked concerns. Mick Gilli-gan, head of fund research atKillik & Co, the wealth man-ager, believes that as moremoney is raised passively,there is a risk that markets
couldbecomelessefficient.There are also fears that pas-
sive funds are fuelling anunsustainable price bubble intheUSstockmarket.
According to Wealth-X, fewwealth managers havedecreased their overall alloca-tion to passive funds over thepast five years. But ThomasMiller’s Mr Philips says thewealth manager has recentlybegun switching back to activefunds.
“We have been trimmingour passive exposure back aswe believe there are defensivequalities in certain sectors ofactive management that willprove useful at this point in thecycle,”saysMrPhilips.
Chris Ralph, chief invest-ment officer at St James’sPlace, the UK wealth manager,adds that there are legitimateconcerns about what wouldhappen to investors in passivefunds if there was a marketcorrection.
“If we experience marketvolatility, we are in untestedmarkets,” he says. “The coun-terpart to that is for our activefund managers, who are buy-ing shares because they thinkthey are good value. All of thiscreatesopportunity.”
Wealth groupsshun passiveinvestments
Rapid growth: assets in index funds
Source: Morningstar
Total assets under management in UK-domiciled passive funds(£bn)
0
50
100
150
2012 13 14 15 16INDEX TRACKERS
Cheaper funds remaintiny part of portfolios,survey reveals

8 | FTMoney FINANCIAL TIMES Saturday 17 June 2017 FINANCIAL TIMES Saturday 17 June 2017 FTMoney | 9
PRIVATE CLIENT WEALTH MANAGEMENT PRIVATE CLIENT WEALTH MANAGEMENT
Clients, assets and feesMin. portfolio
size £k Annual fee tariff (%)
Wea
lth m
anag
er
% o
f dis
cret
iona
ry fu
nds
inve
sted
in in
-hou
se fu
nds
Adv
isor
y
Dis
cret
iona
ry
Exec
utio
n on
ly
£10
0,0
00
£25
0,0
00
£50
0,0
00
£1m
£2m
£3m
£5m
Min
imum
fee
(£)
Add
ition
al c
harg
es (
£)
Dea
ling
char
ges
Sep
arat
e 'p
latf
orm
' or
cust
ody
char
ge?
Any
alte
rnat
ive
fee
stru
cter
s?
ACPI 2 - 1000 - - - - - - - - - - External custodians and brokers used charge between 0.10% and 0.20% in equities
N/A N/A
Adam & Co 1 - 500 - 1.25 1.25 1.25 1.25 1.13 0.88 0.73 £2,000 - Actual dealing costs passed to the client with no margin added.
N N
Barclays Wealth and Investment Management
4.5 500 250 500 1.25 1.25 1.25 1.25 1.13 1.08 0.95 - - Included in the annual management charge. N N
Beaufort Investment Management 0 - 10 - 0.30 0.30 0.30 0.30 0.30 0.30 0.30 N/A N/A Platforms may have specific dealing charges, Transaction charge 0.05%.
Y N
Brewin Dolphin 0 - 150 4 1.30 1.30 1.30 1.30 1.10 0.93 - 1000 - £20 per transaction N Y
Brooks MacDonald Asset Management
2.53 - 250 - 0.75 0.75 0.75 0.60 0.60 0.50 0.50 - - First £10k = 1.00%, £10k to £250k = 0.15%, After £250k = 0.11%
N/A N
Canaccord Genuity Wealth Management
2.8 - 100 - 1.50 1.50 1.25 1.00 1.00 1.00 - - - £30 per trade for onshore clients N Y
Cantab Asset Management 0 500 500 - - - 0.75 0.75 0.75 0.75 0.50 - - Not applicable N/A Y
Cazenove Capital Management 14.51 - 1000 1000 - - - - - - - - - Not applicable N Y
Charles Stanley - 100 100 0.15 0.85 0.85 0.85 0.65 0.45 0.25 0.25 £850 - Included within investment management fee. N N
Citi Private Bank 0 3900 5000 - - - - - - - - - - No dealing charges for discretionary mandates. N N
Citigold - 150 - - - - - - - - - - - Transaction fee 2%, advisory fee 1% (both transaction amount based)
Y N/A
Close Brothers Asset Management 5 1000 1000 1000 - - - 1.00 1.00 1.00 1.00 No Custody included. Dealing charges may apply
No dealing costs but there may be underlying brokerage charges payable by the client
N N/A
Coutts - 3000 1000 1 0.94 0.94 0.94 1.00 1.00 1.00 - - VAT For discretionary portfolios and funds there are no additional dealing fees.
N/A N
Credit Suisse 0.9 3000 3000 3000 - - - 1.50 1.30 1.30 1.10 £2800 per quarter
- Between 0.15% - 1.00% (depending on asset class & deal size)
Y Y
Dart Capital 0 250 250 - 1.00 1.00 1.00 1.00 1.00 - - - - £40 per trade. However there is a transaction fee free tariff for smaller portfolios
Y N
Equilibrium Asset Management 0 100 100 - 1.50 1.50 1.50 1.25 1.00 1.00 0.80 £1,250 ongoing annual fee
None None N N
GAM 30 2000 2000 - - - - - 0.50 0.50 0.50 - Custody and underlying manager fees apply
Preferred custodian charge a flat fee of 0.10% per annum, including all dealing charges.
N/A N
Greystone 100 0 1 - 0.75 0.75 0.75 0.75 0.75 0.75 0.75 0.75 - Not applicable N/A N/A
HSBC - - - - - - - - - - - - - - -
Investec Wealth and Investment 0.29 150 150 - 1.25 1.25 1.25 1.25 - 1.04 0.60 £1500 - Bargain administration charge £35 N Y
Investment Quorum 0 100 100 0 1.00 1.00 1.00 0.75 0.75 0.75 0.50 - Financial planning and platform fees
Included in investment fees Y Y
JM Finn 0 - - - 0.75 0.75 0.75 0.75 0.63 0.55 0.47 £750 per annum
1% commission on first £10,000, 0.5% thereafter
£20 compliance charge per transaction N N/A
James Hambro & Partners 2 1000 1000 - 1.15 1.15 1.15 1.15 1.15 1.15 0.75 - Only broker execution services and VAT are charged in addition to fees
None N Y
Julius Baer 0 - - - - - - 1.55 1.55 1.55 1.35 CHF 3850/quarter
0.10% for simple restrictions, 0.25% for complex restrictions
None for discretionary mandates. Varies for advisory N N
Killik & Co 0 0 5 - 1.25 1.25 1.13 0.88 0.69 0.63 0.58 £250 per quarter
Additional transactions charges may apply depending on service
1% on trades up to £15,0000 .5% on amount over £15,000
N N
London & Capital Asset Management
95 - 750 - - - - - - - - - - - Y N
McInroy & Wood 83 - 250 - 1.00 1.00 1.00 1.00 1.00 - - - - Charged at cost. N N
Psigma Investment Management 0 - 250 - 1.50 1.50 1.50 1.35 1.28 1.15 1.05 - Probate valuations are charged for at a rate of £4 plus VAT per line of stock (maximum £250 plus VAT)
None N N
Rathbones Investment Management
1.87 100 100 15 1.20 1.20 1.00 0.99 0.81 0.70 0.62 No None None N N/A
Redmayne-Bentley 0 50 50 0 0.85 0.85 0.85 0.85 0.85 0.85 0.85 - - 1.75% on the first £10,000. 0.5% on the balance above £10,000. A £10 settlement and compliance charge.
N Y
Rothschild Wealth Management 20.3 - 5000 - - - - - - - 1.00 - FX transactions None N N
Ruffer - - 250 - 1.00 1.00 1.00 1.00 1.00 1.00 1.00 - - Charged at cost. N N
Sarasin & Partners 59 - 500 - - - 1.00 1.00 1.00 0.96 0.87 - - None N N
Saunderson House Limited 0 750 100 - 1.25 1.25 1.00 1.00 0.65 0.50 0.50 - 0.8%+VAT up to £20k initial charge
Custodian does not charge for dealing in UK-based assets. However, for assets deemed “non-UK” there is a £10 transaction charge.
N Y
Smith and Williamson 3.22 0 0 0 0.80 0.80 0.80 0.80 0.80 0.65 0.53 - custody and dealing charges Dealing commission 0.4% for fixed interest, 0.6% for all other investments, minimum £40
Y Y
St. James's Place 0 5 100 0 1.00 1.00 1.00 0.75 0.50 - - - - No dealing commissions, fee only N N
Standard Life Wealth - - 500 - - - 1.38 1.38 1.38 1.38 0.75 - For target return portfolios the cost would increase by circa 0.7% per annum due to embedded annual management charges for the collective funds held within portfolios.
Included in the annual management charge. N N
Stonehage Fleming 5 7500 7500 - 0.85 0.85 0.85 0.85 0.85 0.85 0.85 - - Actual cost passed to client with no margin added N/A Y
Tilney Group 42 100 350 0.5 1.00 1.00 1.12 1.00 0.88 0.75 0.65 - - £15 for discretionary portfolios. £7.50 for online execution-only share trades (no fee fund deals)
N/A Y
UBS Wealth Management (UK) - 1000 500 - - - - - - - - - - Included in account fees for discretionary and some advisory fee options. Where applicable, a scale of transaction charges applies with a minimum charge of £100.
N Y
Veritas Investment Management 0 - 3000 - - - - - - 1.00 - - - No in house dealing charges. Y N
W H Ireland 0 100 100 - 1.00 1.00 1.00 1.00 0.75 0.67 - £1,000 - £17.50 per transaction Y Y
Walker Crips 0 100 2 0.1 0.70 0.70 0.70 0.70 0.70 0.70 0.70 No None Model portfolios: Nonea bespoke service: 0.5% N -
Waverton Investment management 13 - 500 - - - 1.20 1.20 1.00 0.93 0.88 - - Third party dealing costs of up to 0.15% per equity transaction.
N N
Source: Wealth-X Private Client Wealth Management Survey 2017
O ver the years,Wealth-X hasinterviewedmany wealthyindividuals who
say they have found it difficultto choose between potentialinvestment managers. Manyperceive wealth managementfirms to be very much alike. Sothe choice of which wealthmanager to invest with is oftenreduced to a comparison oftiny differences; focusing onrapport, proactivity, and costsofservices.
But this year’s survey of theleading wealth managers inthe UK reveals that a widerange of potential returns havebeen achieved over a five-yearperiod—andahugenumberofasset allocations have beenused within the same type ofportfolio.
For the past eight years,Wealth-X Custom ResearchhascollaboratedwiththeFTtoinform readers of the changes— including financial perform-ance — within the UK’s wealthmanagement industry.
This year, we receiveddetailed responses from 45 ofthe most significant wealthmanagers in the UK. During2016, the performance of atypical balanced portfolio sig-nificantly improved on 2015,following a period of stronggains intheFTSE100.
Over the five years toDecember 31 2016, the FTSE100 index gained around 25per cent. However, those port-foliossubmittedbyourleadingwealth managers gained anaverage 44 per cent return, netof fees,overthesameperiod.
While they have all beatenthe benchmark, those five-year returns range considera-bly, from 28 per cent to almost
Not all wealth managers are alike70 per cent (see feature onpages2-3).
Given the huge variations inperformance, one area thatprospective clients shouldlook at closely is investmentstrategy and typical asset allo-cations.
Asset allocations vary enor-mously for typical balancedportfolios. The three assetclasses that make up, on aver-age, three-quarters of mostportfolios are equities, corpo-rate bonds and governmentbonds. And the allocations toeach of these vary hugelybetweenwealthmanagers.
Equity allocations can rangefrom 24 per cent to 79 per centof a balanced portfolio. Corpo-rate bonds can make up any-thing between zero to half, andgovernment bonds accountfrom zero to 38 per cent. Andremember — this is before theinvestment managers pickwhich equities and bonds toinvest inwithinthatweighting.
What Wealth-X has found isthat broadly speaking, there isa positive correlation betweenoutperformance and the
equity weighting of balancedportfolios. The more equityrisk your manager has takenover the past five years, thegreater the rewards will havebeen. And the reverse appliesfor those portfolios withhigher allocations towardsbonds.
With many stock marketsaround the world reaching all-time highs, the million dollarquestionis:howlongthis trendcangoonfor?
I won’t attempt to answerthat — but the data tells us thataverage allocations within bal-anced portfolios have notchanged significantly since
2015.Thissuggests that invest-ment philosophies are fairlyfixed within wealth manage-mentcompanies.
Of course, these allocationsand strategies take intoaccount the openness to risk ofclients too. Considering thepoliticalupheavalwitnessed in2016, a more risk-averse strat-
egy could easily explain port-folios with higher allocation tobonds, where the desire to riskhigher returns has beentrumped by a strategy to mini-mise losses.
As wealth and investmentmanagers regularly tell us,past performance is no judgeof future performance. But
when choosing a wealth man-ager, make sure that theirinvestment strategy, riskassessment and asset alloca-tion is appropriate andmatches your preferences.This could be a much strongerdeterminant of achieving per-formance objectives thanother aspects such as rapport,
proactivity and costs, eventhough these are often moreprominent inourminds.
David Barks is a research directorat Wealth-X Custom Research,the global provider of wealthintelligence and research partnerof the FT Private Client WealthManagement survey
COMMENT
DavidBarks
Average allocations in balanced portfolios have changedlittle since 2015 — Bloomberg
There is a positivecorrelation betweenoutperformance andequity weighting ofbalanced portfolios

10 | FTMoney FINANCIAL TIMES Saturday 17 June 2017 FINANCIAL TIMES Saturday 17 June 2017 FTMoney | 11
PRIVATE CLIENT WEALTH MANAGEMENT
Services
Wea
lth m
anag
er
UK
offi
ces
Num
ber
of a
dvis
ors
Adv
iser
s jo
inin
g in
20
16
Act
ive
indi
vidu
al c
lient
s
Clie
nts
per
advi
sor
Valu
e of
Adv
isor
y A
uM (
£m
)
Valu
e of
Dis
cret
iona
ry A
uM (
£m
)
Valu
e of
Exe
cutio
n on
ly A
uM (
£m
)
Inve
stm
ent p
rodu
cts/
serv
ices
use
d
Acc
ess
to A
ltern
ativ
e Fi
nanc
e /
Cro
wdf
undi
ng
Adv
isor
y In
vest
men
t Man
agem
ent
Ban
king
Bro
kera
ge
Cha
rity
Ser
vice
s
Com
mod
ities
Con
cier
ge
Dis
cret
iona
ry In
vest
men
t Man
agem
ent
Fam
ily O
ffice
ser
vice
s
Hed
ge F
unds
(in
clud
ing
fund
s of
fund
s)
In-h
ouse
Fun
d M
anag
emen
t
Insu
ranc
e
Mor
tgag
es
Off
shor
e S
ervi
ces
Onl
ine
Dis
cret
iona
ry In
vest
men
t Man
agem
ent
Onl
ine
Ser
vice
s
Pens
ion
& R
etire
men
t Pla
nnin
g
Phi
lant
hrop
ic P
lann
ing
Pri
vate
Equ
ity
Tax
Pla
nnin
g
Trus
t & E
stat
e P
lann
ing
ACPI 1 15 3 - - 854 1514 - EM x x x x
Adam & Co 4 55 4 11900 216 - 1300 - EM x x x x x x x x
Barclays Wealth and Investment Manage-ment
26 - - 16000 - 3500 20500 10800 EM x x x x x x x x x x x x x x x x x x
Beaufort Investment Management 13 43 2 3377 79 226.6 384.2 - EM x x x x x
Brewin Dolphin 29 427 28 80000 187 2800 31500 3500 EM x x x x x x x
Brooks MacDonald Asset Management 11 - - 21619 - - 9040 290 EM x x x
Canaccord Genuity Wealth Management 4 110 10 12000 109 3459 5789 4801 EM x x x x x x x x x x x
Cantab Asset Management 2 9 2 400 44 250 250 - EM x x x x x x x x x x x
Cazenove Capital Management 6 84 3 7686 92 783 23557 3704 EM x x x x x x x x x x x x x x x
Charles Stanley 24 274 4 73562 268 3720 9220 6780 EM x x x x x x x x x
Citi Private Bank 2 46 4 - - 11500 12439 800 SU x x x x x x x x x x x x x x
Citigold 1 100 10 - - 2000 - - SU x x x x x x x
Close Brothers Asset Management 9 185 50 2400 13 2300 7800 0 SU x x x x x x x x x x x x
Coutts 18 322 - - - 1000 16200 4500 SU x x x x x x x x x x x x x x x x x x
Credit Suisse 2 77 11 1400 18 4200 3100 6200 SU x x x x x x x x x x x x x x x x
Dart Capital 1 3 0 365 122 52 377 14 SU x x x x x x
Equilibrium Asset Management 2 7 0 931 133 57.5 595 0 EM x x x x x
GAM 1 6 1 360 60 320 1889 - EM x x x x x x x
Greystone 2 19 0 2246 118 780 267 - EM x x x x x x x
HSBC 7 - - - - - - - EM x x x x x x x x x x x x x x x x x
Investec Wealth and Investment 15 278 8 65000 234 6520 24902 - EM x x x x x x x x x
Investment Quorum 1 4 0 550 138 25 200 0 EM x x x x x x x x
JM Finn 5 90 2 15000 167 1053.2 5943.4 607.1 EM x x x x x x
James Hambro & Partners 1 15 2 1684 112 277 1822 - EM x x x x x x x x x
Julius Baer 1 70 6 - - - - - SU x x x x x x x x x x x
Killik & Co 8 78 5 20000 256 4000 1500 0 EM x x x x x x x x x x x
London & Capital Asset Management 1 10 - 750 75 250 2500 - EM x x x
McInroy & Wood 3 12 2 764 64 - 1362 - IH x
Psigma Investment Management 3 23 3 4644 202 0 2338.67 272.5 EM x x x x
Rathbones Investment Management 16 270 10 38291 142 1298 28734 937 EM x x x x x x x x x x x x x
Redmayne-Bentley 37 109 22 96768 888 1176 812 3544 EM x x x x x
Rothschild Wealth Management 3 24 4 787 33 563 6827 0 EM x x x x x x x x x x x x x x x
Ruffer 3 37 0 5809 157 0 6280 0 EM x
Sarasin & Partners 1 22 2 - - - 2850 - SU x x x x x
Saunderson House Limited 1 57 0 1970 35 4494.4 82 - EM x x x x x x x
Smith and Williamson 7 171 9 16000 94 1964 12128 1457 EM x x x x x x x x x x x x x
St. James's Place 22 3415 302 313000 92 74000 1300 0 SU x x x x x x x x x x x x
Standard Life Wealth 6 42 2 3845 92 - 6790 - EM x x x
Stonehage Fleming 2 15 0 - - 1375 3752 198 EM x x x x x x x x x x x
Tilney Group 30 328 182 110000 335 2800 17100 2400 EM x x x x x x x x x x x x x x x
UBS Wealth Management (UK) 7 208 16 9293 45 - - - SU x x x x x x x x x x x x x x x x x x x
Veritas Investment Management 1 12 1 300 25 - 1649 - - x
W H Ireland 7 94 - - - 783 1016 1073 EM x x x x x x x x x x x x
Walker Crips 12 115 7 28551 248 1520 1240 2040 EM x x x x x x x x x
Waverton Investment management 1 18 0 2000 111 - 4256 - EM x x x
Totals 359 7299 717 969252 - 139901 281105 53918 1 34 13 15 33 10 4 44 16 16 23 10 11 26 4 28 29 20 14 24 31
% offering services 2% 76% 29% 33% 73% 22% 9% 98% 36% 36% 51% 22% 24% 58% 9% 62% 64% 44% 31% 53% 69%
Source: Wealth-X Private Client Wealth Management Survey 2017 EM=Entire market (‘open architecture’) SU=Selected universe (‘guided architecture’) IH=In house only
PRIVATE CLIENT WEALTH MANAGEMENT
AIME WILLIAMS
UK wealth managers are qui-etly scaling back access to off-shore accounts for their clientsas the global crackdown on taxhavensgatherspace.
The number of wealth man-agers offering UK investorsoffshore services dropped by afifth in 2016 compared withthe previous year, according toa survey by Wealth-X for theFinancial Times. However,two-thirds of wealth managerssurveyed said they still offeredsomeoffshoreservices.
The retreat is partly due torules surrounding theexchange of informationbetween tax jurisdictionstighteningoverrecentyears.
In 2010, the US introducedits Foreign Account Tax Com-pliance Act (Fatca) whichforced overseas banks andwealth managers to hand overdetailsof theircustomers.
“Post-Fatca, the ability tohide money offshore has goneaway,” says Matt Thomas,partner at global consultancyKPMG.
Other countries soon signedup to similar agreementswith each other — tax authori-ties in more than 100 juris-dictions now exchange infor-mation with each other auto-matically.
“Pretty much wherever youare in the world, you’re goingto be reported back to the hostnation,” says Andy Thompson,director of operations at theUK’s trade association forwealth managers and financialadvisers.
Previously, suchdetailswerehard to find, and investigatorscould only get hold of them ifthey could prove they hadgood reasons for suspectingtaxevasion.
“The ultimate end game of
this is that secrecy cannot bedefended any more,” says Kin-ner Lakhani, Deutsche Bank’shead of European bankresearch. “When that’s elimi-nated, you get a level playingfield between offshore andonshore.”
Along with this is the emer-gence of public anger directedat anyone using offshore struc-tures, even if completelylegallyandlegitimately.
The Panama Papers — atrove of 11.5m documents —saw several high-profile politi-cians and celebrities criticisedfor using offshore structures toreducetheir taxbills.
Prime ministers, film starsand footballers were amongthose named in the PanamaPapers, and subsequentlyfound themselves splashedacross themedia.
Mr Thompson says thisfurore has discouraged clients
fromusingoffshorestructures.“Let’s be honest — whenever
people say they have anaccount offshore, the immedi-ate thought is that they’reavoiding tax,” says Mr Thomp-son. “There’s a stigmaattached.”
Pictet & Cie, Switzerland’slargest independent privatebank, last year said it wouldallow its clients to domiciletheir wealth in the UK for thefirst time — a move it said wasbeing demanded by its clientsin the face of “increasingstigma”.
In turn, falling demand fromclients has made the difficultyand expense of offering off-shore services less worthwhilefor those in the wealth man-agement industry, especiallyasregulationandinternationalreporting requirements
increase inonerousness.“You have got the general
perception, from the providerside of things, [that offeringoffshore services] is not partic-ularly profitable,” says SimonBasharoun, a financial plannerat InvestecWealth.
Mr Basharoun adds thatdealing with non-UK-domi-
ciled clients requires “veryspecialist” skills, whileincreasing focus on taxregimes from politicians wascausing instability and uncer-tainty.
“There’s not a Budget thatgoes by where we don’t thinkthe rules around offshoremight change,” Mr Basharoun
adds. As a global trend,the transfer of wealth fromoffshore centres to onshore isset to hit wealth managershard.
A report from consultancyOliver Wyman and DeutscheBank predicts that wealthmanagers will lose $13bn ofannual revenue as a result of
the outflows linked to the taxcrackdown, which will make itharder for the wealthy to useoffshore accounts to avoidpayingtax.
The feeling among UKwealth managers — evensmallerones—is that thepolit-ical focus on tax evasion canonly intensifyas timegoeson.
Wealthy turn their backs on offshore tax havensTAX AVOIDANCE
Tighter rules lead tofewer options forwealth managers
Jersey: traditionally a centre for offshore services
‘Pretty much whereveryou are in the world,you’re going to bereported back to thehost nation’
12 | FTMoney FINANCIAL TIMES Saturday 17 June 2017
T here’sadigital revolutionsweepingthroughthewealthmanagementsector—sowhyaresomanytraditional firms
turningtheirbacksonit?Atinyminorityofwealthmanagers
surveyedbyWealth-Xthisyearsaytheyplantoofferrobo-advicetotheircustomers,despiteanincreasingnumberofnimble,digitalupstartsenteringthewidermarket.
Sowhatdoes it involve?Ofcourse,youdon’tactuallyhandovercontrolofyourfinancestoarobot.The“robo”monikerstemsfromthefactthatalgorithms—notanexpensiverelationshipmanager—willdecidehowtostructureyour investments.
Expensiveofficesarereplacedbydigitalplatforms. Insteadofanewclientmeetingfollowedbyadecentlunch,mostroboplatformshavesomeformofonlinequestionnaire togatherdataaboutyourfinancesandriskappetite.Thiswilldetermineyoursuitability foraselectionofdifferentproformainvestmentportfolios,oftenassembledbyusingcheapexchangetradedfunds(ETFs)andpassive funds.
Manyentry-level roboadvisersareaimedat the“Henrys”of thisworld—highearnerswhoare“notrichyet”.
Nutmeg,WealthifyandMoneyFarmhaveall launchedlow-costonlinewealthmanagementplatformsinrecentyears,designedtoscoopupthisgrowingmassaffluentmarket.Nutmeg, forexample,keepscosts toaminimum—charging0.75onthefirst£100,000investedand0.35percent thereafter—by
buildingrisk-weightedportfolioswithETFs,whichmimicthemovementsofvarious indices.
Inthepastyear,manyestablishedwealthmanagementbrandshavebeendevelopingtheirownversionofthese lower-costservices for thosenotyet inthesuper-rich league.
Lastyear,BrewinDolphin, theFTSE250wealthmanager, launchedarobo-adviseraimedat investorswithbetween£10,000and£200,000forachargeof0.7percentof investedassets.AndrivalKillik&Coisset to
bringoutSilo,designedtoattractcustomerswhocanaffordtosaveaslittleas£25permonth.
Thisputs thewealthmanager incompetitionwiththehighstreetbankswhoarealsoseekingclientsat the lowerendof thewealthbracket.HSBC,RBS,Barclays,
LloydsandSantanderareallmovingtowardsofferingrobo-advice.
Theyhaveahugeadvantage inthismarket,as theriseofonlinebankingmeanstheyhavealreadyinvestedheavily intechplatformsandapps.
Oneof thefirst stories IwroteasFTwealthcorrespondenttwoyearsagolookedathowmanyprivatebanksandwealthmanagerswerepoisedtolaunchnewwebormobileappsforwealthyclients.Butnotallof thesehavecometofruition—andthepaceatwhichthebankshaveadaptedandimprovedtheirownonlineservicesmeanstheyarestill arguablystreetsahead.Withinthewealthmanagementworld, firmswhichwere“bornonthe internet”aresimilarlyadvantaged.
Sothenextstage inthefast-evolvingrobomarketcouldbehighernetworthclientsswitchingtheirallegiancefromtraditionalwealthmanagers tocheaperroboplatforms.
Oneof thetraditional firmstorespondtothispotential threat is
UBS,which lastyear launchedSmartWealth.Withaminimuminvestmentof£15,000, itopens
thedoors farwidertothosewholackthe£2mneededtoaccessanaccountat theprivatebank.
“Iseverythingmovingtorobo-advice?Absolutelynot,”saysDirkKlee,chiefoperatingofficeratUBSWealthManagement.“But there isaneedforclients toaccessadvisorycapabilities,wherevertheyareandwithanydigital tool theywant.”
Thismessageofa“hightouch,hightech”servicethatcombinesboththepersonalandtheautomatedisgainingmomentum.
Yetwhenitcomestorobo-advice,manyinthe industryareadamant:“Clientsare lookingforrelationshipsbuiltovertime,”saidone.“Theydon’tjustwanttopressabuttononacomputer,”saidanother.
“Thereality is that thewealthyfamiliesweworkwithplaceasequalimportanceonserviceas theinvestmentelementofouroffering,”
saysPaulFletcheratLondon&Capital. “Thefeemarginbenefit thatrobo-adviceprovides isoutweighedbythe lossofservice.”
Hispoint—thatwealthycustomerswantthatpersonal touch—iswidelyheldacross the industry.Wealthmanagersoffera“full service”beyondinvestmentmanagement,providingtheirclientswithtaxadviceandsuccessionplanning, forexample, thatrobo-adviserscannot.
Theoverwhelmingviewis that theindustrywouldreact if therewasdemand.Butthis iswherethedisconnectbetweenthewealthmanagersandtheirpotentialmarketbecomesmoreobvious.Surveyaftersurveysuggests thatcustomers,particularly theyoungergeneration,wantmoreonlineservices—andthat
includesautomatedadvice.Lastyear,Capgeminiquestioned
morethan5,200peoplewithat least$1mof investableassets.Theconsultancyreportedthatprivatebanksandwealthadviserswerefacinggrowingcalls fromyoungerclients tobeefuptheironlineprovisionbyofferingservicessuchasrobo-advice,mobileappsandreal-timereporting(involatilemarkets,the importanceof the lattershouldnotbeoverlooked).
Provide it, the firmwarnedstarkly,otherwiseyourclientswillwalk.
Yet therobo-rejectingresponses totheWealth-Xsurveysuggest thatmost traditionalwealthmanagerswanttoprioritise theirrichestandmostprofitableclients.
Forwealthmanagers, thequestionnowisasimpleone: shouldtheyinvestmore intech,or let thecheaperroboshooverupthe lowerendof themarket—andhopethatwealthierclientswon’tbetemptedtomigrate?Whicheveroptiontheychoosecouldpotentiallybecostly.
Andthewealthyarealreadyusingrobos.Nutmegrecently tookasingle£5minvestmentthroughitsplatform.Thecompany“regularly”gets£1m-£2mstakesplacedatatime.Why?AccordingtoShaunPortofNutmeg, theonline-onlybusinessoffersamuchcheaperalternativetothefeeschargedbytraditionalwealthmanagers—andthewealthy loveabargainasmuchasanyone.
This isnot lostonSchroders, theassetmanagementgiant,whichownsasmall stake inNutmeg.
It ispossiblewewill seemoreoftheseallegiances,asdemandforrobo-advice isonlygoingtogrow—andacross thewealthspectrum,notjust for themassmarket.Asthewealthybecomemoretech-savvy, therobothreat is realandgrowing.
Hugo Greenhalgh is the FT’s wealthcorrespondent; [email protected], Twitter: @hugo_greenhalgh
Wealth managersshun the digitalrevolution
Many robo advisers areaimed at the “Henrys” ofthis world — high earnerswho are “not rich yet”
Hugo Greenhalgh