Embed Size (px)
Citation preview

29 October 2011
Priority among EPAs - Impacts of Trade Liberalization -
Kenichi Kawasaki RIETI, Japan October 2012

• Macroeconomic benefits of bilateral trade liberalization will be the largest with China, followed by EU, Japan and USA
• Relative significance of trade creation and trade diversion effects of regional trade liberalization will vary among the economies
• The wider the participants of regional trade agreements and the higher their levels of achievements, the larger their economic benefits
1
Overview Priority among EPAs

I. Impacts of Bilateral Trade Liberalization
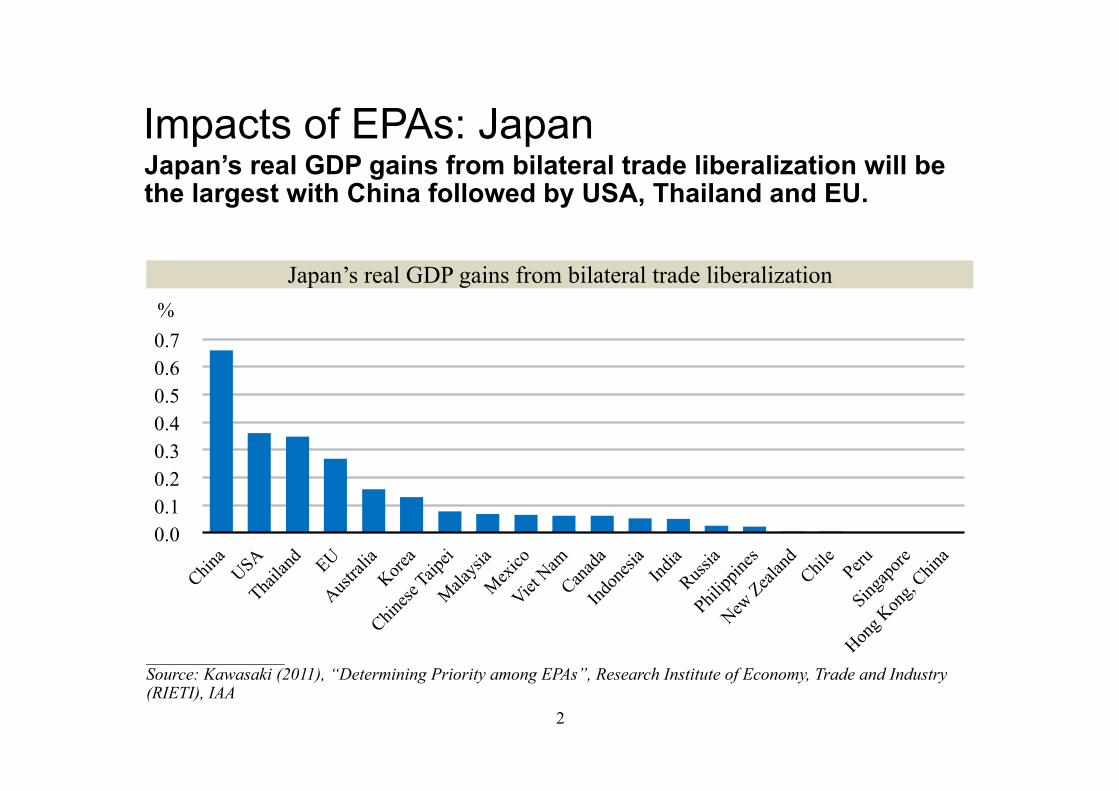
Impacts of EPAs: Japan Japan’s real GDP gains from bilateral trade liberalization will be the largest with China followed by USA, Thailand and EU.
Japan’s real GDP gains from bilateral trade liberalization
0.0 0.1 0.2 0.3 0.4 0.5 0.6 0.7 %
2
________________ Source: Kawasaki (2011), “Determining Priority among EPAs”, Research Institute of Economy, Trade and Industry (RIETI), IAA

Impacts of EPAs: EU
EU’s real GDP gains from bilateral trade liberalization
0.00
0.05
0.10
0.15
0.20
0.25 %
3
EU’ real GDP gains from bilateral trade liberalization will be the largest with China followed by Japan, Russia, India and USA.
________________ Source: Kawasaki (2011), “Determining Priority among EPAs”, Research Institute of Economy, Trade and Industry (RIETI), IAA

Impacts of EPAs: USA
USA’s real GDP gains from bilateral trade liberalization
0.00 0.02 0.04 0.06 0.08 0.10 0.12 0.14 %
4
USA’s real GDP gains from bilateral trade liberalization will be the largest with EU followed by China and Japan.
________________ Source: Kawasaki (2011), “Determining Priority among EPAs”, Research Institute of Economy, Trade and Industry (RIETI), IAA

Impacts of EPAs: China
China’s real GDP gains from bilateral trade liberalization
0.0
0.5
1.0
1.5
2.0
2.5 %
5
China’s real GDP gains from bilateral trade liberalization will be the largest with EU followed by USA and Japan.
________________ Source: Kawasaki (2011), “Determining Priority among EPAs”, Research Institute of Economy, Trade and Industry (RIETI), IAA

EPA Partners’ Ranking
Significance of generating real GDP gains from bilateral trade liberalization
0
20
40
60
80
100 %
6
China will generate the largest real GDP gains from bilateral trade liberalization. This position will be followed by EU, Japan and USA.
________________ Source: Kawasaki (2011), “Determining Priority among EPAs”, Research Institute of Economy, Trade and Industry (RIETI), IAA

II. Impacts of Regional Trade Liberalization

Development of Regional Integration Trans-Pacific Partnership (TPP) has emerged in the Asia-Pacific (APEC) region. Other agreements include Regional Comprehensive Economic Partnership (RCEP) in East Asia.
Regional integration framework
7
APEC
Russia
RCEP
Canada, Meico
TPP
India
USA ASEAN
Chile
Peru
Hong Kong; China Laos
Chinese Taipei Cambodia
Papua New Guinea MyanmarThailand
Japan, China, Korea
Australia, New Zealand
Singapore, Brunei
Malaysia, Viet Nam
Indonesia
Philippines

Impacts of RTAs: Japan
Real GDP gains from regional trade liberalization
0.0
0.2
0.4
0.6
0.8
1.0
1.2
1.4
Global FTAAP RCEP TPP9+Japan Japan-EU
%
Japan’s real GDP gains from East Asia trade liberalization is estimated to be larger than TPP and a Japan-EU EIA. But…
________________ Source: Kawasaki (2011), “Determining Priority among EPAs”, Research Institute of Economy, Trade and Industry (RIETI), IAA
8

Impacts of RTAs: EU
Real GDP gains from regional trade liberalization
-0.4
-0.2
0.0
0.2
0.4
0.6
0.8
1.0
Global FTAAP RCEP TPP9+Japan EU-China EU-Japan EU-USA
%
EU’s trade diversion effects of Asia-Pacific trade liberalization will be sizable in comparison with the benefits of bilateral trade liberalization with China, Japan and USA
________________ Source: Kawasaki (2011), “Determining Priority among EPAs”, Research Institute of Economy, Trade and Industry (RIETI), IAA
9

Impacts of RTAs: USA
Real GDP gains from regional trade liberalization
-0.1
0.0
0.1
0.2
0.3
0.4
Global FTAAP RCEP TPP9+Japan USA-EU
%
USA’s real GDP gains from global trade liberalization will be larger than Trans-Pacific and Trans-Atlantic Partnerships.
________________ Source: Kawasaki (2011), “Determining Priority among EPAs”, Research Institute of Economy, Trade and Industry (RIETI), IAA
10

Impacts of RTAs: China
Real GDP gains from regional trade liberalization
-2.0
0.0
2.0
4.0
6.0
8.0
Global FTAAP RCEP TPP9+Japan China-EU
%
China’s real GDP gains from Asia-Pacific wide, and moreover, global trade liberalization will be far larger than East Asia trade liberalization.
________________ Source: Kawasaki (2011), “Determining Priority among EPAs”, Research Institute of Economy, Trade and Industry (RIETI), IAA
11

(Reference)

CGE model estimates compare two equilibrium states, one without trade liberalization and two with trade liberalization, at some time in the future.
Trade Liberalization Future
Without trade liberalization
With trade liberalization
GDP
Impacts
Estimated economic impacts of trade liberalization
________________ Source: Author
12
CGE Model Estimates