Embed Size (px)
Citation preview
Policy Research
WORKINQ PAPERS
| International Trade
International Economics DepartmentThe World BankDecember 1991
WPS 813
Price Stabilizationfor Raw Jute
in Bangladesh
Takamasa Akiyamaand
Panos Varangis
The costs of the present systemii of price stabilization of raw juteby Bangladesn's public sectordo not yield the expected benefits.Price stabilization coLild be better handled by the private sector.In any case, the loss of welfare to jute growers from pricefluctuations is small.
Policy Research WokLng Papers disseintnare the findings of v.ork t progress and encournge the cxchange of idCas among Bank staff andallothers interested in development ssues Thewepapers, dAstnhuied b) the Research Ad. isory Staff,crr) the names oftheauLhors, renectonly theirviews, and should heused and eted accord ngl) T'he fni digs, interpretauonis, and eonclusions arethe authors'own The) shouldnot be atlributed to the World Bank, Its lloard orl')Drecworx, tLi management, or any of its member counines
Pub
lic D
iscl
osur
e A
utho
rized
Pub
lic D
iscl
osur
e A
utho
rized
Pub
lic D
iscl
osur
e A
utho
rized
Pub
lic D
iscl
osur
e A
utho
rized
Pub
lic D
iscl
osur
e A
utho
rized
Pub
lic D
iscl
osur
e A
utho
rized
Pub
lic D
iscl
osur
e A
utho
rized
Pub
lic D
iscl
osur
e A
utho
rized

i ~~Policy Research|
LInternational Trade
WPS 813
This paper-a product of the International Trade Division, Intemational Economics Department- is partof a larger effort in tie Department to address issues of price and income stabilization in primarycommodities. Copies are available tree from the World Bank, 1818 H Street NW, Washington DC 20433.Please contact Dawn Gustafson, room S7-047, extension 33714 (49 pages). December 1991.
Fluctuating prices for raw jute have been viewed and Varangis contend that if the parastatals hadas contributing to economic problems in the jute refrained from ad hoc stocking and if the privatesubsector. Price fluctuations were thought to sector had stocked efficiently, jute prices andreduce the jute farmers' welfare and there has incomes would have been just as stable - and atbeen concem about the costs of parastatals' no cost.stocking operations in attempts to stabilize juteprices and incomes. They argue that the Bangladeshi jute market
should be free of govemment intervention andAkiyama and Varangis examine the causes that Bangladesh should establish a market-based
and consequences of these fluctations and credit system that allows efficient stockholdinganalyze policies that might reduce them. They .havior by the private sector.find that price fluctuations for raw jute reducefarmers' welfare only slightly because farmers' Akiyama and Varangis also found thatactivities are typically diversified and jute's improving the flow of market information toshare in total income is small. farmers and greater price responsiveness by jute
milis lo raw jute purchases would significantlyAlthough stocking operations by the improve the stability of raw jute prices and
parastatals contribute to stability in prices and incomes. Having more information availablereal income, they have been extremely costly and would also make private stocking operationshave crowded out private stocking. Akiyam;a more efficient.
The Policy Rescarch Working paper Series dissemiinates the findings of work under way in Lhc Bank. An objcctive or the scricsis to get these findings out quickly, even if presentations arc lcss than fully polished. Thc findings, interpretations, and
conclusions in thcsc papers do not necessarily reprecsent official Bank policy.
Produced hy thc Plolicy' Rcsearch Dissemnination Ccnter

TABLE OF CONTENTS
I. STRUCTURE OF THE JUTE MARKET IN BANGLADESH . . . . . . . . . . . . . 2
II. CAUSES AND CONSEQUENCES OF RAW JUTE PRICEINSTABILITY ........................... 4
III. THE ANALYTICAL FRAMEWORK . . . . . . . . . . . . . . . . . . . . . . 13
IV. SIMULATIONS OF DIFFERENT POLICIES AIMED ATREDUCING RAW JUTE PRICE FLUCTUATIONS .......... .. 24
V. CONCLUSION ............ ... . . . .*.....32
Annex I. ........ ................ ....... 34
STATISTICAL ANNEX TABLES ...................... 41
REFERENCES .......................... 48

PRICE STABILIZATION FOR RAW JUTE IN BANGLADESH
by: Takamasa Akiyama and Panos Varangis *
World raw jute prices historically have fluctuated widely. This has
been a matter of great concern in Bangladesh and is believed to be an important
contributor to a number cf economic problems in the jute sub-sector. These
perceived problems include a reduction in jute farmers' welfare, erosion of the
international competitiveness of ra-w jute and of jute goods against synthetics,
the huge costs associated with stocking operations of the parastatals, the
Bangladesh Jute Mill Corporation (BJMC) and the Bangladesh Jute Corporation
(BJC), and the large losses incurred by almost all the Bangladesh jute mills.
The focua of the present paper is an analysis of the ca.ses of raw
jute price fluctuations and policies that can be taken to reduce them. The
first section gives a brief description of the jute market in Bangladesh. The
second section examines the extent, causes and consequences of raw jute price
instabUity. The third section describes the jute model used for the analysis.
Section four uses the econometric model for the jute market to simulate several
policies aiming at stabilizing jute prices. The final section concludes.
*The authors wish to thank Messrs. Fahrettin Yagci, Pravin Trivedi, Ron Duncanand Elton Thigpen for their valuable comments.

2
I. STRUCTURE OF THE JUTE MARKET IN BANGLADESH
Detailed descriptions of the world jute market are given in several
papers, including Thigpen and Akiyama (1986) and Thigpen, Marerngiu and Lasker
(1987), so only those comments specifically relevant to the Bangladesh jute
sector are given here.
Jute is an important cash crop to farmers in Bangladesh and in the
Northwestern states of India. According to the 1983/84 Bangladesh Census of
Agriculture and Livestock, more than 3 million farm households receive cash
income from jute which accounts for about 5-7% of their total income. Jute
competes with rice for land at the growers' level and the price ratio of jute to
rice is found to be the key factor affectins jute growers' decisions to allocate
land to growing jute. Based on the agricultural calendar and statistical
analysis, the boro rice is considered to be the more important competitor. All
jute in Bangladesh is grown by smallholders who are diversified in jute, rice and
vegetables. Jute does not compete with rice in some upland areas and in low
areas. While jute yields are largely determined by weather events, they also
respond to planting period fertilization, weeding, thinning, and post-emergence
fertilization. Climatic effects of significance include lack of rain in the
sowing period : flooding in the post-emergence period of June to September.
There are two -Aor fypes of jute growing in Bangladesh: white and tossa.
Because tossa cannot survive flooding, and white jute is a less valuable crop,
white jute is grown on low lands which are the more susceptible to flooding.
Finally, adequate water supply for retting is essential for quality fiber
production. Both jute types are grown throughoat Bangladesh but the district-
level mix varies considerably. Tossa retains its high quality during bumper
years, while white jute quality declines as yield increases. This physical
characteristic implies that tossa prices decline less than white jute prices in
bumper years.

3
An important characteristic of the raw jute maLket in Bangladesh is
it6 close relationship with that in India. Annex Table 1 shows raw jute prices,
rJce prices and their ratios in the two countries. For the period 1973/74-
1988/89, the correlation coefficient for the ratios of raw jute prices to rice
prices in the two countries is found to be 0.83; the correlation between raw jute
prices (expressed in US dollars') in the two countries is 0.90; while the
correlation between production in Bangladesh and India is 0.85. These iiigh
correlation coefficients suggest that the raw jute markets of the two countries
are integrated and that the extent of arbitrage is such that raw jute prices in
the two countries are simultaneously determined and do not diverge much.
Two major components of raw jute demand in Bangladesh are exports and
mill consumption (see Annex Table 2). Mill demand comes from BJMC, the Bangladesh
Jute Mill Corporation (BJMC), the Bangladesh Jute Mill Association (BJMA) and the
Bang'.adesh Jute Spinners' Association (BJSA). BJMC is a parastatal and
constitutes about two-thirds of the weaving capacity. BJMA is an association of
privately-owned mills. They were previously part of BJMC hut were returned to
their previous owners in 1982. BJSA mills are alt.o privately-owned and mainly
produce jute yarn for exports.
Jute mills process raw jute into jute goods. The main jute goods
produced and exported are sacking, hessian and carpet backing (see Annex Tabl1
3). About 90% of the jute goods produced are exported. Bangladesh's jute goods
exports compete with those of India and other jute goods exporting countries and
with synthetics. Bangladesh's jute goods prices usually have been lower than
those of India and as a result Bangladesh has succeeded in capturing jute goods
market shares from other countries, especially from India (see Section III for
more details).
i Discussions with jute traders in Bangladesh stiggest that the black marketexchange rates between the Bangladeshi Taka and Indian Rupee have been close tothe official exchange rate.

4
iI. CAUSES AND CONSEOUENCES OF RAW JUTE PRICE INSTABILITY
The extent, causes and consequences of raw jute price instability
have been the subject of controversy and have been extensively analyzed.2 These
issues are examined here mainly by applying statistical and econometric
techniques to recent data for jute and jute goods of Bangladesh, India and
elsewhere.
II.1. Causes of Raw Jute Price Instability in Banoladesh
Although there are several methods for measuring instability the
coefficient of variation (Cv) around the time trend is used exclusively in this
paper. Not only is the CV a widely used measure of instability but it is an
important statistic that relates directly to the benefits or welfare gains from
price stabilization schemes.
From the point of view of jute growers and jute s:pply in Bangladesh,
the relevant measure of instability is the fluctuation of the ratio of jute to
rice prices. This ratio has fluctuated much more widely (roughly twice) than raw
jute export prices in US dollars. It was also found that tossa jute prices are
significantly less volatile than white jute prices.
Wide fluctuations in agricultural commodity prices from year to year
are usually due to fluctuations in supply caused by weather variations, which,
given the low short-term elasticities of demand and supply, generate large price
changes. Additional factors causing price fluctuations are wide fluctuations in
demand and poor price expectations by farmers.
2 Some studies on the subject include Rahman (1981) and studies associatedwith the Integrated Program for Commodities of UNCTAD in the second half of the1970s.
(il Weather
Floods and droughts occur pericdically in Bangladesh and they cause
substantia.l reductions in jute output. In recent yeazs, abnormal weather reduced
jute suprly in a significant way in the 1984/85 and 1988/89 seasons. 3 These
reductions in supply, in turn, caused both domestic and international prices to
increase sharply. 3tatistical analysis shows that the damage caused by weather
has been considerably more severe for white than for tossa jute. This is due to
the fact that white jute is grown on lower land than tossa and thus is more prone
to flood damage. The impact of weather on prices is aggravated by the fact that
the same weather usually affects jute-growing regions in Bangladesh and in India
in West Bengal which together produce ahrut two-thirds of the world's output.
(ii) Farmers' Price expectations
Statistical analysis shows that about 80% of the jute output
variation can be attributed to harvested acreage fluctuations and the rest to
yield fluctuations. A number of studies have shown that jute growers allocate
land to grow jute based on their expectations of the price ratio of jute to
rice.4 These studies also suggest that the growers' expectations are based mainly
on the previous years' price ratios. Statistical analysis shows that the
previous year's price ratio does not predict the current year's ratio well. i
Apparently because of these poor price expectations, jute production and prices
behave in a "cob-web" manner. A typical example of this "cob-web" effect can be
seen in the prices and production of 1984/85 and 1985/86. Mainly because of bad
weather and panic (see below for more details), jute supplies in both Bangladesh
and India declined and jute prices skyrocketed in 1984/85. Farmers expected
3 This was confirmed by taking the difference between actual supply andpotential supply estimated by regression equations.
4 See for example, Rahman (1981) and Akiyama (1985).
s Regressions were run on the current year's price ratio against theprevious year's price ratio for the period 1973/74-1988/89. The adjusted R2
value was -0.037 and the t-value for the pravious year's price ratio was 0.68.

6
1984/85 prices to prevail in 1985/86 end as a result the 1985/86 season
experienced a very large crop, which in tx-n caused prices to fall sharply in
that year. Typically, jute prices stay low for 3 years followed by another 2-3
year period of higher prices.
(iii) Lgw short-term, price elasticities of demand
Shocks in supply and/or demand do not cause prices to change greatly
if short-run price elasticities of supply and demand are large. The same weather
shock results in much greater price changes when supply and demand elasticities
are high.
Estimated price elasticities of demand for stocks, exports and mill
consumption in Bangladesh and India are given in Table 1. As shown in the table,
price elasticities of export and mill consumption demand are very low. It is
notable that jute mills in Bangladesh do not adjust to production levels to
prevailing raw jute prices. Such behavior exacerbates raw jute price
fluctuations. HIL ever, ralatively high price elasticities of stocks in the two
countries suggest that an important role has been played by stocks in stabilizing
jute prices.
Table 1: PRICE ELASTICITIES OF DEMAND FOR RAW JUTEIN BANGLADESH AND INDIA
Bangladesh India
Stock 1.11 0.70
Exports 0.30 __l
Mill Consumption 0.00 /a 0.17
/a The elasticity of lagged row jute prices is 0.15.
A number of studies (e.g. Mujeri (1978), Rahman (1981), Akiyama
(1985), Rahman (l196)) found jute supply to be responsive to previous year's
price ratio of jute to rice. The elasticity of jute acreage with respect to

7
changes in jute/rice prices and revenues differ depending on periods and
specifications used to estimate them but fall between 0.3 and 0.5 in the short-
run and between 0.7 and 0.9 in the long-run.
(iv) Market Panic (the 1984/85 incident)
Raw jute and jute goods prices would have been much more stable in
recent years if it were not for the 1984/85 incident. Thus it is of importance
to examine the jute si,b-sector in some detail in that year to determine what
policies were taken and those which could have been taken to avoid the incident.
In nominal terms, raw jute prices were at their highest level ever
in 1984/85, (average of almost $600/ton in terms of BWD, f.o.b.
Chittagong/Chalna) although in real terms, i.e., deflated by the World Bank's
measure of international inflation, they were lower than in the early 1970s.
Production and carry-over stocks in Bangladesh and India that season do not show
a very tight condition compared with 1977/78 and 1978/79. What seemed to have
occurred was an exaggerated perception by the market of the flood damage. A raw
jute export ban was imposed by the government from late 1984 through mid-1985
aimed at ensuring availability of raw jute to the mills. Bangladesh jute mills
did not reduce their raw jute demand but increased jute goods prices in order to
cover the high raw jute costs.6 As a result 1984/85 ended with relatively high
raw jute stocks (they were higher in 1984/85 than in the late 1970e), and the
highest jute goods stocks ever, as goods could not be sold at the higher prices.
Commodity market panics do occur from time to time, especially fc-
commodities with low short-term price elasticities of demand.7 There are limited
6 According to BJMC data, the percentage share of raw jute in BJ1C's totalrevenue was almost 70% in 1984-85 compared with 30-40% in normal yease.
7 Notable ones are coffee in 1977, sugar in 1974 and 1980, and fertilizerin 1975.

8
measures that can be taken to avoid such panics. The only meaningful measures
would be to constantly provide the market with good estimates o' production,
stocks, demand and prices. Timely and accurate information on crop damage caused
by floodp and droughts would help to avoid creating panics.
(v) Fluctuatina demand
The developing countries' share of raw jute and jute goods import
demand has been increasing over the years.8 Demand from these countries tends
to fluctuate widely for several reasons, including; (a) jure and jute goods
imported are used mainly to package various kinds of agricultural goods (e.g.
grains, cocoa, coffee, cotton) for transport and storage. Hence jute demand
varies with fluctuations in production of these commodities, (b) most of these
countries suffer from severe shortage of foreign exchange, which also reduces
their ability to import, including jute and jute goods, and (c) recently .arge
quantities of jute bags have been used as sand bags, and hence, demand has
fluctuated with military needs.
To summarize, the main factors that cause raw jute prices to
fluctuate widely are:
a. Concentration of world jute production in Bangladesh and Northwest
India (about two-thirds of world output) which experience similar
weather patterns.
b. Inaccurate price expectations held by farmers, causing a "cob-web"
effect on prices and production.
c. Very low price elaeticities of demand, especially by the Bangladesh
mills.
d. - adequate information and estimates of production and demand,
occasionally creating panic in the market, in great part the cause
for the high prices in 1984-85.
e. Fluctuating port demand for jute and jute goods.
8 See World Bank (1990).

9
II.2. gonseauencas of Raw Jute Price Instability
It should be stated at the outset that raw jute price fluctuations
should .ot necossarily be a cause of economic problems. Prices transmit and
provide important information to market participants with regard to what is
happening with the market and prices should fluctuate with dynamic market
conditions. It is true that large price fluctuaticns can cause market
participants to react in sub-optimal ways especially in the long-run and could
cause welfare loss to producers. Producers would not incur welfare loss due to
price fluctuations if producers have meai.q to hedge income fluctuations or if
they are risk-neutral. Jute mills should not suffer from raw jute price
fluctuationa per-se because they have means to minimize fluctuations of operating
costs arising from raw jute price fluctuations, by adju.tLing jute goods
production, jute goods prices, and operating their own income stabilization
measures. Smallholder jute farmers have only limited means to stabilize their
income from jute. Hence, a major concern as regards welfare loss due to raw jute
price fluctuations is that of farmers. However, jute production makes up only
a small part of smallholders' total income in Bangladesh.
The theoretical effects of price instability on producers' welfare
have been developed by a number of economists including Newbery and Stiglitz
(1981). Welfare analysis is based on income fluctuations and not on price
fluctuations. In other words, jute farmers' welfare is not affected by price
fluctuations if incomes do not fluctuate. statistical analysis using the data
for the period 1972/73-1988/89 shows that income from raw jute, i.e., average
prices multiplied by production, is closely correlated with raw jute prices
(correlation coefficient was found to be 0.90). The coefficient of variation for
the same period is 40.23. Excluding the 1984/85 season the CV is 31.98. Because
tossa and white jute prices behave differently, coefficients of variation were
calculated for each type of jute. The estimated impact of price stabilization
on jute growers' welfare is given in Table 2. These estimates are in terms of
percentages of income from jute when the coefficient of relative risk aversion

10
as defined by Newbery and Stiglitz (1981) is 1 and 2. This coefficient is a
measure of how risk-averse farmers are. Because jute farmers in Bangladesh have
limited means to hedge and are poor, a coefficient of 2 may be approoriate.
During the period 1972/73-1988/89, jute growers would have gained the equivalent
of 16% of their income from jute if jute prices had been completely stable. This
corresponds to about Taka 1 billion in 1985 conseant Taka terms. This amount
decreases substantially if 1984/85 is excluded. The figures also show that risk-
benefit from price stabilization is smaller for the toesa jute growers compared
with the white jute growers. The estimated benefit is based on achievement of
complete price stabilization which is impossible and undesirable. If it is
assumed that a typical jute grower obtains 10% of their incomes from jute and
that a jute price stabilization program reduces instability by one-half, the
risk-benefit of such a pr,gram would be, at most, 0.8% of their total income.
Table 2: ESTIMATES OF RISK-BENEFIT FROM RAW JUTE PRICESTABILIZATION AS SHARE OF INCOME FROM JUTE
All Years Excluding 1984-85R = 1 /L R = 2 R = 1 R = 2
All jute /a 8.1 16.2 5.1 10.2
Toss& /D 7.8 15.6 3.3 6.6White /b 9.1 18.2 6.3 12.7
/a For the period 1972/73-1988/89.Jk For the period 1975/76-1988/89 due to lack of data.
cg R - Uoefficient of relative risk aversion.Source: IECIT, World Bank.
The effects of raw jute price fluctuations on jute goods prices are
limited. Regression analysis of sacking and hessian prices on average jute mill
wages and raw jute prices indicates that on average a 10% increase in raw jute
prices increases sacking and hessian prices by 3.3% and 3.4% respectively in
Bangladesh. Because of these relatively small effects, jute goods prices have
been sunstantially more stable than raw jute prices. To the extent that raw jute
prices affect jute goods prices, raw jute price fluctuations affect jute gocods
export revenues and quantities as well as profitability of the jute mills

11
In the private sector, the ratio of raw jute export prices to
primary market prices is considerably higher than those in by BJMC (parastatal).
Statistical analysis shows that this ratio for the private sector is high when
the seasonal variation is high and low when domestic prices are high.9 This
suggests that the commission charged by raw jute traders in terms of the
percentage of the price paid at the primary market is high when seasonal price
fluctuations are large. This volatile part of the differential can be
interpreted as the risk premium. If prices are stabilized, the margins should
become smaller and hence increase growers' prices, ceteris Daribus.
The analysis also suggests that raw jute exporters play a role in
stabilizing export prices by the lowering the percentage profit margin when
prices at the primary markets are high and vice versa, and hence keeping export
prices more stable than the pr.ces at the primary markets.
One important long-term effect of jute and jute goods price
fluctuations is thought to be the loss of jute's market share to polypropylene.
However, there are difficulties in substantiating this argument for several
reasons, including:
(a) Reliable data are scarce, especially those on polypropylene goods
prices and demand to undertake analysis of the competition.
9 Results of regression analysis for the period 1974/75-1988/89.
DPXPBGD = 37.56 + 6.64T - 0.0155 JUPPBGD(10.98) (3.63) (4.33)
+ 1.46 SVJUPPBGD(2.54)
where
DPXPBGD = the ratio of export price to primary market priceT = time trendJUPPBGD - price at the primary marketSVJUPPBGD - seasonal variation of prices at the primary market
= 0.57D.W. = 2.29Figures in brackets are t-statistics

12
(b) There are a number of other factors, such as introduction of bulk
handling, introduction of new polypropylene products, and stagnacy
in industry or agriculture that use jute goods, that are known to
have caused a decline in jute goods demand. Thus, it would be
extremely difficult to identify how much of the decline in jute
goods demand was due to price fluctuations and to other factors even
if reliable data were available.
(C) There could be confusion as to whether the levels of raw jute and
jute goods prices or their price fluctuations were the main cause
of decline in jute goods demand.

13
YII. THE ANALYTICAL FRAMEWORK
To evaluate the impact of aifferent policies aiming at stabilizing
real jute prices and the real jute income of growers we developed an econometric
model for raw jute and jute products. The analysis of Section II suggests that
a major role in raw jute price stabilization has been played by the stockholding
operations of the parastatals, however, at great cost. Hence, in Section III.2
we present the "optimal stocking rule" to be used for simulation exercises in
Section IV. The advantage of the "optimal stocking rule" is that it achieves
socially optimal levels of price stability.
I11.1 Jute Econometric Model
The model consists of three markets: the combined raw jute market
for India and Bangladesh and separate jute goods markets in Bangladesh and India.
For each of these markets there is a market clearing equation which determines
the corresponding price. The model includes India, Bangladesh and the rest of
the world.'0 For the estimated equations used see Annex 1. Differences in the
specification of equations between Bangladesh and India are mostly due to data
avaLiability.
The structure of the model is shown in Figures 1 and 2. The model
determines raw jute and jute goods prices by simultaneoulsy equating raw jute and
jute goods supply and demand. As shown in Figure 1, Bangladesh and India's raw
jute markets are treated as an integrated market. Raw jute prices are determined
by clearing total supply and demand originating from Bangladesh and India.
Important components of demand are mill consumption in Bangladesh and India.
These demands are demand components for the raw jute block but become supply
components for the jute goods block in Figure 2.
tO India and Bangladesh account for around 90% of production and exports ofraw jute and products (see Annex tables 3, 4 and 5).

14
Figure 2 shows India's hessian price determination mechanism.
Although not shown, a similar mechanism exists for determining sacking prices in
Bangladesh. The rupply component is equivalent to demand for raw juts in this
block and demand components are those of export and domestic demands. Again,
prices are determined by equating total supply and demand for jute goods.
Statistical analysis shows that the price elasticities of demand for
jute goods are low, but elasticities of market shares with regard to the
differences between Bangladesh's and India's jute goods prices are relatively
high. For example, the price elasticity for the market share for hessian of 2.3
in Table 3 implies that Bangladesh's hessian market share will increase by 2.3%
if its price is reduced by 1% vis-a-vis India's hessian price. Bangladesh appears
to have succeeded in increasing its shares of jute goods by pricing its jute
goods lower than India. These elasticities are shown in Table 3. They imply a
rather complicated relationship among key variables. For example, a bumper jute
crop and low raw jute prices in Bangladesh and India do not necessarily imply
higher profits for Bangladesh's jute mills. A bumper jute crop would enable the
jute mills in India to produce substantial quantities of jute goods for export
and, hence, would lower India's export price of jute goods. Bangladesh's mills,
in order to keep their export market share, will also need to lower their jute
goods prices. However, if they were to lower jute goods prices more than the
gain from lower raw jute prices, their profitability would decline.
Table 3 : ESTIMATED PRICE ELASTICITIES OF DEMAND AND MARKET SHAREFOR BANGLADESH'S HESSIAN AND SACKING
Hessian Sacking
World Imports 0.17 0.23
Market Share vis-a-vis India 2.30 0.68
Source: IECIT, World Bank.

Figure 1: Jute Model for Bangladesh and India: Raw Jute Block
Woldd - xw Dmn
byROWStck Demand .Jute MD Jute MD------__________ lDemand In Demand
| >9 S l ~~~~~~~~~Barig adsh _in IrKia
Lao LStockDemana IjLag~~~~~~~~~~~~~~~~~~~~~~~~a
Prevous LPrevious YearsYeares Stodk Market-Clear Raw Jute Price Stock
.* 1 Exchin BRatdesh
Bore LIr ImportSanaldshg_ PdoeS of | /. IdaPoufnPM=cio Tossa /| *Price OTf ____
Xlag tag )3 / ladesh~~~~~~~~~~~~~~~~~~~~ Lag* ! * __ EI India. *
I Prb ~ ~ Pre o f Price d IWie II Pceof Is otow Atus F l Rce
Note: * " soJrdes exogenous varale
be&WO96 (1

Figure 2: Jute Model for Bangladesh and India: India Jute Goods Block
Exps r a In WaSa&k Wol Expoft ofI
8ackk|g Exp nEfor Hi DrDemandforBaansdtacWshHes soldn
Export Demand
India's Saddrf Soksofor~~~~~~~~~~~~~~~~~~~~~~~~~~~~Ofl , 1? ~~~Jute Goods
hi India ~ ~ n rd
Madket~Clear forI~~~~~~rmdis Jtfe Goods I PreWousT ~~~~~dtenTsrdna | Year's
kdxs ~~~~~~~~Hasshn Pice of Incfia 4- Jute GoodsSackHI Stck
LpLi Net.: * *ne sigets exog s I iDomes.cllKlia'8 Producfion n ~~~~~~~~~~Denmand for
Emr~~~~~~~~~~~~~~~~~~~~~~~I h India
+ | l | I~~~~~~~~~~~~~~~~~~~~~~ndla's I
In dlmus Prlodsh |-In Indnexa
NoU: 18* *dil_ eaxownos vabb

17
III.2. optimal Storage Rules
As discussed by Newbery and Stiglitz (1981), the optimal stocking rule
is derived from the problem of optimizing the consumption flow from a serially
uncorrelated sequence of supply (e.g., annual harvests in the case of
agricultural commodities).
Mathematically, the objective function is:
MaxE i atU(Ce,M:-ySt) (1)
where
, =- utility formation
C, = consumption of the commodity
X, = money expenditure on all other goods
y - annual storage costs; y per unit stored
St stocks
6 = discount factor
The choice variables are the amounts carried over, S,, and expenditure
on other goods, M,, subject to the constraints:
St 0,Xo,Sr given
E peM W 0,givenC-O

18
where
X1/(1+6)
WO present value of wealth and future money income receipts
This maximization problem gives:
PC+y 2Ž p EP. 1(2)
St20
Equation (2) is often called the competitive storage rule. If the
distribution of income between producers and consumera is of no concern, and if
both are risk neutral, the competitive equilibrium achieves the optimum amount
of price stabilization. Equation (2) implies that storage today continues until
the present price, p,, plus storage cost, y per unit stored, has been driven up
to equality with the present discounted value of the expected future price; or
if present prices are high, stocks are sold now until the price plus storage
costs have been driven down to this level, or until stocks, S,, are exhausted.
If h irs the harvest and x, is total supply then
x= h+ St=C+ St (3)
We, seek a function f(x) such that for all x,
St=ff(x,) 0 (4)
If demand is non-stochastic, this function must solve (2) and since
c xt - f (xc)

19
this implies
pbe-f (xt))+y,fpEp [h..,+f(x,) -f (h..,+f (x¢)}](5)
f (xt) x 0
Choose units so that the average harvest is unity and the elasticity of
demand at the mean pre-shipment price p, so the inverse demand schedule is:
(C-1)) Eh=l (6)
then (5) can be written
f(x) I lx-a+P f {1 f (x))}], x?x,1 4P (7)
=0, xk0
where
asl+e(1-P+y/p) (8)
The "optimal storage rule" has the following key features:
(a) It is non-linear;
(b) The stock function f(x) is continuous and monotonically
increasing;
(c) In a stationary world with bounded harvests, stocks are
bounded; and
(d) The buffer stock breaks even on average if marginal storage
costs are constant.

20
There are several methods of solving (7) but here the method
developed by Gustaf son (1958) is shown. His method consists of approximating the
optimal rule by piecewise linear approximation as shown in the figure 3 below.
The approximated equation is:
f(x) =a1 (X-xX1 ) + f-L (xi-l) (9)
With subscription "i" demoting linear segments.
f(x)
X. X X2
Figure 3: Linear approximation of the competitive stocking rule.
where:
(10)
XI-Xi 1 = k (a-1) (11)
Modified Rule
It was not possible to apply Gustafson's rule directly in the model
simulations because inserting Gustafson's rule as a stock equation made the total
demand for raw jute extremely inelastic. Since the model solves for raw jute
prices by searching for the equilibrium points that equate total supply and
demand, the model fails to converge when the total demand is very inelastic.

21
To avoid this problem, Gustafson's rule was transformed to a
function of price. This was done by finding ps that correspond to the kink
points in Gustafson's rule, x0, x ...... x; by solving:
TSMBSS = f(p) (12)
fe(x) x,x, .... , xn (13)
TSl<Bt + t (X) h t + St-, (14)
where:
TSMBS a Total supply of raw jute in Bangladesh and India
p - price of raw jute deflated by boro rice prices
Equation (12) is a demand equation for raw jute in Bangladesh and
India excluding stocks held in Bangladesh and was estimated using OLS. This
gives:
Z (p) - (P-PI-1) ffjl (P-,) (15)
Graphically fi (p) is shown in Figure 4.
f(p)
P2 Pi PO
Figure 4: Modified Competitive storage rule.
" The estimated equation for the period 1975/76-1988/89 is:
ln TSMBS = 5.11 - 0.24 ln P, + 0.322 D85(120.73) (2.67) (3.03)
Period estimated: 1976/77-1988/89 R2 = 0.565 D.W. = 1.38

22
Because f1 (p) is non-linear and would not be accepted by the computer
program for simuilation using the Newton method, values for f1ls were calculated
and regressed using p's for the period 1975/76-1988/89 to obtain an equation
approximating (15).
We obtained:
ln f = 3.703 - 6.794 ln P + 4.819 D84
(2.93) (13.17) (8.81)
+ 2.38 D77 + 1.197 D76
(5.91) (3.44)
R2 = 0.944 D.W. = 1.616 SER = 0.102
This equation was inserted into the model to evaluate the effects of the
optimal stocking rule on the jute market. The estimated equation is basically
a demand-for-stock equation with a high price elasticity. It is clear that such
an equation if inserted in the model, would stabilize prices by increasing the
price elasticity of total demand.
Practical Difficulties in Imolementinc the Otimal Storace Rule in Bancladesh for
Raw Jute
A difficulty in implementing the original Gustafson's rule in the case
of Bangladesh's raw jute is that it requires fairly accurate estimates of India's
and Bangladesh's total supply and stocks held in India at the end of the season.
Furthermore, if the optimal stocking is to be undertaken by one of the
parastatals in Bangladesh, then estimates of end-season stocks held by the
private sector in Bangladesh will be required. To the extent these estimates
contain errors, estimated optimal stock levels to be held will deviate from the
"true" optimal levels. The "modified" optimal rule, on the other hand, requires
a good estimate of price to prevail during the current period and of stocks held
by the private sector in Bangladesh. Another problem with both of the optimal
rules is that many of the parameters are calculated based on historical data for

23
supply andl defldild. Henck- if thers is an abrupt structural chance in theme
variableo, the eiaLivuatLud vpLirtial stocks leve3c; w-hlrl clpviAea^ frnm the "trlUe"
optimal lcvelsZ.
* v .~~~~~~~~~~~~~~~~~~~~~

24
IV. SIMULATIONS OF DIFFERENT POLICIES AIMED AT REDUCING RAW
JUTE PRICE FLUCTUATIONS
This section reviews the causes of raw jute price instability that
originate in Bangladesh, and examines factors to be taken into account in
designing policies aimed at reducing raw jute price fluctuations and their
adverse effect.
Section II discussed in some detail the main causes of jute price
instability originating in Bangladesh: weather, inaccurate price expectations
held by farmers, very low price elasticity of demand, inadequate dissemination
of analysis and information, and demand fluctuations. An analysis of how the
impact of these factors on price instability could be minimized is given below.
Also, there is discussion and analysis of stockholding policy to stabilize prices
in a socially optimal way.
li) Weather. Obviously, strengthening flood control facilities wolild be
one measure to reduce raw jute price fluctuations. This, however, is expensive
and would not be justified if its only objective was to stabilize raw jute
prices. However, efforts at flood control have already been made in Bangladesh
as a means of strengthening its infrastructure and this will also help reduce
jute price instability.
(ii) Inaccuracy of price expectations held by farmers and inadequate
information dissemination. As discussed in Subsection II.2, farmers' price
expectations about jute and rice prices have been inaccurate forecasts. Farmers'
price expectations could be improved by providing them with more information and
analysis of the jute market. Enhanced dissemination of analysis and up-to-date
information would also be an effective measure to alleviate market panic at times
of production shocks.

25
To evaluate the effects more accurate price expectations would have on
jute prices, a simulation run was made on the jute econometric model assuming--
that the farmers' expected jute prices depend on lagged lavel of ending stocks.'2
This assumption effec.ively increases the accuracy of price forecasts by 0.4 in
terms of the R2 of a regression with the lagged levels of stocks as the
independent variable and the assumed expected prices as the dependent variable.
The simulation results are shown in Table 4.
As shown in Table 4, impro.ement in farmers' price expectations reduces
jute price variability (the C.V. of the deflated jute price is reduced from 38.9
to 32.4) and also reduces the fluctuations in farmers' real income (the CV
declines from 39 to 29.9).
Table 4: SIMULATION RESULTS OF THE EFFECTS OF VARIOUS POLICIES ON PRICEAND INCOME FLUCTUATIONS
(Ex-Post Simulation 1975/76-1988/89)
IncomeJute Price from Jute
Nominal Deflated DeflatedJute by Boro by Boro
Price Rice Price Rice Price
… ----------------- (CV, %)…
Without policy change 46.3 38.9 39.0
With improved farmers'price expectations 40.2 32.4 29.9
With higher price elasticity 39.0 29.8 27.0for mills
Without stock operationsby the Parastatals 63.3 56.1 56.6
With "optimal" stocks 51.3 38.1 39.0
Source: IECIT, World Bank
12It is also assumed here that the coefficient for the expected price in theacreage equation does not change when farmers use stocks to form theirexpectations of the following years' price.

26
tiSil I t,-a st i u iut de,. f:ll:,y 1,111ls. w IC !Iysi"3 .. r rdW jute
denttaad by thle unills : u,,-eLsts th-at tliey iecide.il '. '!c _'ntity _'r jute; yI Lu-
produce based on the nutber of looms available, wages, and raw jute and jute
goods' prices in preceding years. The ine'lastic nature of the mills' de,mand, as
shown in Subsection II.1, exacerbates raw jute price fluctuations.
The situation in 1984/85 demonstrated the important impact that mills'
raw jute purchases can have on raw jute prices and on the mills' profitability.
Model simulations indicate that real raw jute prices and real farmers' incomes
would have been substantially more stable if jute mills' purchases of raw jute
had been more responsive to prevailing raw jute prices, as shown in Table 4.13
Raw jute prices would be more stable if mills' demand for raw jute were
more responsive to current prices rather than lagged, and mills' jute goods
production schedule were more responsive to prevailing jute goods market
conditions. This would require the mills to be flexible in staff level
adjustments and purchases of raw jute. For the simulation we assumed a price
elasticity of mill demand for raw jute to be 0.3. The result indicated that a
higher mill demand elasticity would have resulted in a significant reduction in
both jute prices and real farmers' income from raw jute. In Table 4, the
coefficients of variation declined by about a third for both prices and real
income.
(iv) Stock operations by the parastatals
Although stock operations by the parastatals had some price stabilizing
effect they were very costly (see 'able 5). An important reason for their being
so costly was that stock purchase and selling decisions were made in an ad-hoc
manner and not based on sound analysis. However, it is estimated that raw jute
prices would have been significantly more volatile had these operations not been
Ps noted earlier, the jute mills' price elasticity of raw jute demand wasnil.
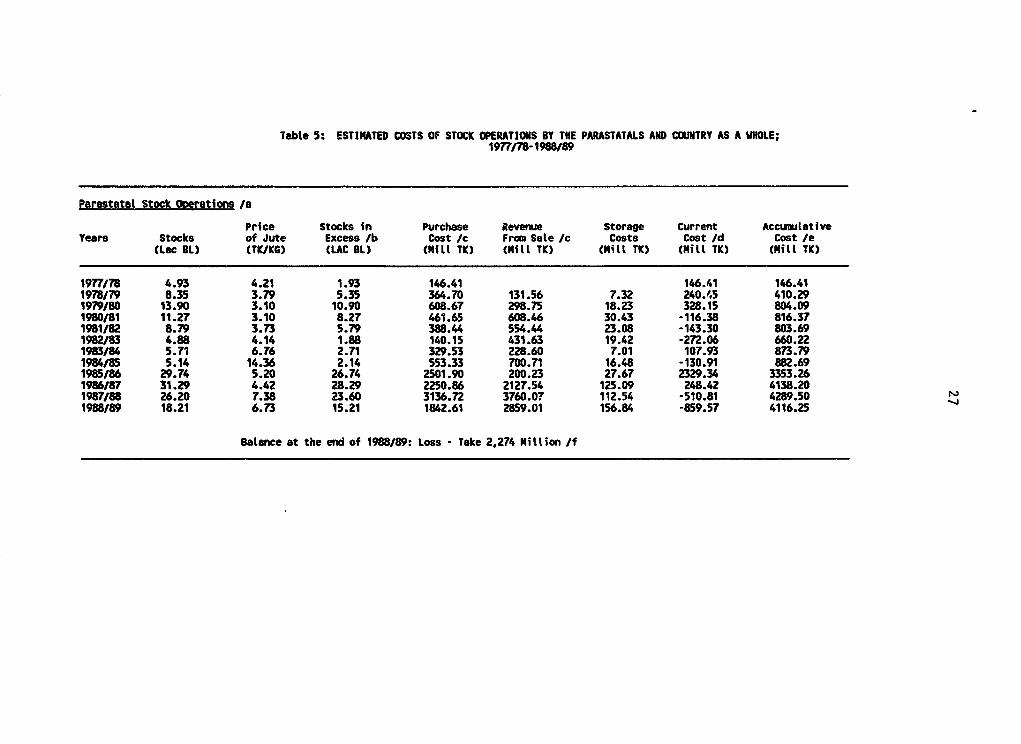
Teble 5: ESTIMATED COSTS OF STOCK OPERATIONS BY THE PARASTATALS AND COUNTRY AS A WHOLE;1977/78-1988/89
ParastataL Stock Ooerations /a
Price Stocks in Purchase Revenue Storage Current AccumulativeYears Stocks of Jute Excess /b Cost Jc From Sale /c Costs Cost Jd Cost Ie
(Lec BL) CTK/KG) (LAC BL) (Mill TK) (Mill TK) (Mill TK) (Mill TK) (Mill TK)
19771/78 4.93 4.21 1.93 146.41 146.41 146.411978/79 8.35 3.79 5.35 364.70 131.56 7.32 240.'.5 410.291979/80 13.90 3.10 10.90 608.67 298.75 18.23 328.15 804.091980/81 11.27 3.10 8.27 461.65 608.46 30.43 -116.38 816.371981/82 8.79 3.73 5.79 388.44 554.44 23.08 -143.30 803.691982/83 4.88 4.14 1.88 140.15 431.63 19.42 -272.06 660.221983/84 5.71 6.76 2.71 329.53 228.60 7.01 107.93 873.791984/85 5.14 14.36 2.14 553.33 700.71 16.48 -130.91 882.691985/86 29.74 5.20 26.74 2501.90 200.23 27.67 2329.34 3353.261986/87 31.29 4.42 28.29 2250.86 2127.54 125.09 248.42 4138.201987/88 26.20 7.38 23.60 3136.72 3760.07 112.54 -510.81 4289.501988/89 18.21 6.73 15.21 1842.61 2859.01 156.84 -859.57 4116.25
Balance at the end of 1988/89: Loss - Take 2.274 Million /f

Table 5: EST114ATED COSTS OF STOCK OPEtATIONS BY THE PAJASTATALS AND COXJTRY AS A WHOLE,1977/75-1968/89 (Continued)
Countrv as a l,hae
Price Stocks in Purchase Revemie Storage Current AccuwlativeYears Stocks of Jute Excess /b Cost /c From Sale /c Costs Cost /d Cost /e(Lac BL) (TI/KG) (LAC BL) (NiIt TK) ("itl TK) (Mitt TK) (MiLl TK) (Mill TK)
1977118 6.92 4.21 2.92 221.51 221.51 221.511978/79 23.32 3.79 19.32 1317.00 199.05 11.08 1129.03 1385.981979/80 42.20 3.10 38.20 2133.14 1078.85 65.85 1120.13 2727.871980/81 32.53 3.10 28.53 1592.60 2132.40 106.66 -433.14 2731.191981/82 18.52 3.73 14.52 974.11 1914.01 79.63 -860.27 2307.911982/83 13.50 4.14 9.50 708.21 1082.44 48.71 -325.53 2351.651983/84 10.10 6.76 6.10 741.75 1155.18 35.41 -378.02 2349.901984/85 9.76 14.36 5.76 1489.34 1577.25 37.09 -50.82 2675.051985/86 42.65 5.20 38.65 3616.25 538.93 74.47 3151.78 6254.851986/87 39.00 4.42 35.00 2134.73 3075.14 180.81 -109.60 7146.031987/88 32.08 7.38 28.08 3732.16 4651.91 139.24 -780.51 7508.881988/89 23.11 6.73 19.11 2315.07 3401.74 186.61 -900.06 7810.24
Balance at the end of 1988/89: Loss - Taka 5,445 Million /f
/a Stocks of the parastatals are those of BJMC and BJC given in Table 13./b Working stocks of 3 Lac bales and 4 Lac bates for the parastatal and total stocks are assumed./c Cost calculations are done by assuming that all stocks at the end of the season are bought at
the average jute price of the current season and carried-over stocks are sold at the averagejute price of the current season.
/d Purchase cost - Revene from sale/e It is the sum of current cost and previous years accumulated costs plus interest costs on
previous years, accumuLated costs./f Calculated by subtracting "purchase costs" for 1988/89 from "accumilated cost" of 1988/89 as
it is assumed that at the end of 1988/89, the operation is to liquidate itself. Both figuresshow negative ntmSers indicating loss.
Source: IECIT, World Sank.

29
implemented. This is also evident from the fact that stocks had significant and
relatively large price elasticity.
We have estimated the costs of the stock operations by assuming that the
nominal interest rate was 16%, the stock carrying cost as a percentage of the
value of the stock was 5% a year, and that no parastatals other than BJMC
kept stock before 1983/84.14 Under these assumptions the total cost to the
parastatal at the end of the period was more than Taka 3 billion for the period
1977/78-1988/89 (see Table 5). Estimated costs for holding total stocks in
Bangladesh for the same period is about Taka 5.5 billion. Such high costs were
unsustainable. As a result, these operations eventually become ineffective and
a major problem of themselves.
Studies on buffer stocks suggests that the optimal stocking rule
formulated by Gustafson (1958) and discussed by Newbery and Stiglitz (1981, 1982)
is theoretically sound and efficient. The rule assumes that carry-over stocks
would be at the socially optimal level, if consumers are price risk neutral. The
rule also suggests that if the private sector has the necessary means and
information it will hold stocks according to this rule. Whether the private
oector actually performed according to this rule in the past for raw jute in
Bangladesh is not possib le to examine due to a lack of data and erratic
government intervention.
Simulation of jute econometric model to test the performance of the
modified version of the optimal stocking rule gives the results shown in Table
4 and the costs from applying such a rule in Table 6. The stocks and costs
presented in Table 6 are estimates for the total stocks held in Bangladesh, i.e.,
stocks held both by the parastatals and the private sector. Pnder the rule, the
more stocks held by the private sector the less are required to be held by the
parastatals.
14 This assumption had to be made because no data on parastatals' stocks,other than BJMCs, exists before 1983/84.

TabLe 6: SIMULATED OPTIMAL STOCKS AND THEIR COSTS; 1977/78-1988/89
Optimal RevenueStock Price Stocks in Purchase from Storage Current AccmulatedYear Levels of Jute Excess Cost /c Sates Ic Costs Costs /d Costs /e
(Lac Bl) (TK/KG) (Lac Bl) (MiLl TK) (Hill TK) (Mill TK) (Mill TK) (Mill TK)1977/78 5.66 3.84 2.66 183.86 183.86 183.861978/79 17.10 3.13 14.10 794.39 149.66 9.19 653.72 867.001979/80 27.89 2.83 24.89 1267.90 718.25 39.72 589.36 1595.081980/81 7.30 3.02 4.30 233.75 1353.02 63.39 -1055.68 794.421981/82 3.20 5.48 0.20 19.73 424.15 11.69 -392.74 528.791982/83 3.18 4.34 10.18 795.26 15.62 0.99 780.62 1394.021983/84 10.57 5.3P 7.57 733.08 985.83 39.76 -212.99 1404.071984/85 4.19 13.f/ 1.79 292.81 1862.67 36.65 -1533.21 95.511985/86 33.00 4.i8 30.00 2257.20 89.54 14.64 2182.30 2293.101986/87 21.02 5.34 18.02 1732.08 2883.60 112.86 -1038.66 1621.341987/88 12.14 5..09 9.14 969.02 1910.48 86.60 -854.85 1025.901988/89 3.00 9.9) 0.00 0.00 1628.75 48.45 -1580.30 -390.25
Balance at the end of i986/,; Profit Taka 390.25 Million /f
Note: Footnotes /b through /f see footnotes in Table 16.

31
An interesting result in Table 6 is that the balance of the total stock
operation at the end of 1988/89 is a profit of Taka 390 million. This compares
with the estimated losses of Taka 5,445 million for total stock operations and
Taka 2,274 million for the parastatal stock operations for the same period (see
Table 5). It is to be emphasized that these estimated costs apply only for the
period 1977/78-1988/89 and compare the hypothetical results under the modified
optimal rule with the actual ad-hoc behavior of the parastatals. The same result
may not hold in the future. However, the optimal stocking rule is always
expected to lead to a break-even result over the long-run. The simulated results
for prices and income under the "modified" optimal stocking rule show that the
degree of price stabilization achieved by this rule is almost exactly the same
as that of the ad-hoc stocking undertaken by the parastatals. However, growers'
income is significantly more stable. Thus, under the "modified" optimal stocking
rule, growers' welfare is substantially higher than under ad-hoc stocking.
Implementation of the optimal storage rule by parastatals would be
difficult, as discussed in Section III. It would be much preferable if storage
were to be undertaken by the private sector. The private sector could be
expected to carry out stocking operations according to the optimal storage rule
if it had adequate information and means, such as credit. Seasonal variations
of raw jute prices suggest, however, that the private sector has not held stocks
according to the optimal storage rule.'5 Therefore, an examination of the
availability of information and credit to private jute traders needs to be
carried out.
The discussions above do not imply that special credit systems should be
established for the purpose of encouraging stockholding by the private sector.
Rather, there should be a market-based system which ensures financial discipline
by the stockholders. This would be a precondition for efficient stockholding
behavior.
15 It is possible toL estimate optim&l private sector stockc levels in thepresence of government interventions (See Wright and Williams (1991)).

32
V. CONCLUSION
The perceived problems in Bangladesh's jute sub-sector related to raw
jute price fluctuations include:
(a) Reduction of jute growers' welfare,
(b) Large deficits incurred by the parastatals (BJC and BJMC) from ad-hoc
stock operations aimed at stabilizing prices,
(c) Large deficits incurred by the mills when raw jute prices are high, and,
(d) Possible loss of competitiveness of raw jute and jute goods, mainly
against synthetic substitutes, due to wide price fluctuations.
The paper argued that the reduction of jute growers' welfare due to raw
jute price fluctuations is small, as the jute growers' activities are diversified
and their share of income from raw jute in their totaL income is small.
Analysis in this paper indicates that the extent of raw jute price
stabilization achieved by the parastatals could have been achieved by the private
sector at no cost to the government provided that the private sector has access
to relevant information and credit markets. Thus, parastatals should refrain
from ad-hoc stock operations and allow the private sector to hold stocks. For
the private sector to undertake efficient stocking operations, the credit system
ehould be market-based instead of the current directed system.
Mill deman.id for raw jute in Bangladesh has been inelastic, implying that
they purchased fixed quantitites of raw jute from year to year regardless of
prices. This has not only hurt the mills' profitability but also magnified raw
jute price fluctuations. Indeed, it has been a lack of concern with profit
making which has led to this behavior. Making the mills more profit-conscious
should improve their financial performance and also help stabilize raw jute
pricen.

33
Although some have considered raw jute price fluctuations to be one of
the major reasons for jute's loss of fiber market share, it has not been possible
to evaluate this argument because of the lack of data.
The analysis suggests that public raw jute price stabilization programs
which can be expected to be costly would not be justified by the expected
benefits. Government policies and actions should be such that they increase
market transparency, reduce or eliminate market distortions, and enhance the
proper functioning of the market.

34
Annex I. ESTIMATED EQUATIONS OF THE JUTE MODEL
RAW JUTE BLOCK
1) Bangladesh: White Jute Yield (1975-88)
YLDJUWH - 2.74 - 2.62 RWGBO1 + 0.09 FERTUJE 0.42 D84 - 0.82 D88(0.18) (1.56) (4.53) (2.62) (4.18)
R2 (adj) - 0.66 D.W. = 2.26 SER 0.14
2) Banaladesh: Tossa Jute Yield (1975-88)
YLDJUTO = 2.89 - 0.56 RWGBO1 + 0.06 PERTUJE + 0.63 D31 - 0.57 D84(0.20) (-1.28) (3.63) (3.56) (3.56)
a2 (adj) = 0.76 D.W. = 1.99 SER = 0.15
3) Bangladesh: White Jute Area (1975-88)
ARJUWH - 0.34 + 1368.37 WHBO(-1) - 632.96 RWGBO1 - 311.85 RWHBO2(-1)(0.14) (4.42) (1.73) (3.48)
- 405.17 D88 - 270.84 D84(3.71) (2.47)
R (adj) = 0.80 D.W. 2.56 SER = 99.6
4) Bangladesh: Tossa Jute Area (1975-88)
ARJUTO = 143.24 + 189.38 RTOBO(-1) + 1191.46 RWGBO1 - 231.52 D77(1.34) (4.73) (1.70) (2.75)
R (adj) = 0.72 D.W. = 2.51 SER = 79.8
5) India: SuVDlv of Raw Jute (1973-89)
JUQIND = 29.73 + 0.22 PRRTJURCIND(-1) + 0.05 PRRTJURCIND(-2)(4.42) (7.38) (1.61)
a (adj) = 0.79 D.W. = 1.45 SER = 7.19
6) Price Linkage of Farmoate Prices: India and Bangladesh (1975-89)
JUPPINDS = 33.92 PRJU$ - 89.97 D77 + 57.27 D86(35.83) (2.64) (1.73)
(2 (adj) 0.99 D.W. = 1.84 SER = 32.69

35
7) Banaladesh: Mill Demand for Raw Jute 11975-88)
CRJMILL 4.96 - 0.50 RRJWG(-1) F 0.09 RSAWG(-l) + 0.01 TLOOMS(0.49) (4.28) (2.06) (2.86)
R2 (adj) - 0.78 D.W. = 1.52 SER = 1.118)
8) India: Mill Demand for Raw Jute (1975-881
JUMIND = 3.85 + 0.05 JGPDIND + 9.37 D77 + 7.63 D76(1.00) (18.26) (6.52) (6.51)
R2 (adj) = 0.97 D.W. = 1.73 SER = 1.119)
9) Bangladesh: Raw Jute Demand for Stocks (1975-88)
ESRJ -18.75 DERRJBO + 0.04 PDJUTE + 23.06 D84(5.25) (11.36) (2.42)
R2 (adj) = 0.94 D.W. = 2.23 SER = 6.46
10) India: Raw Jute demand for Stocks (1973-80
ESJUIND - 12.27 + 0.20 JUQIND - 0.09 PRRTJURCINDD(3.21) (4.27) (0.67)
- 12.78 D8283 - 16.62 D757677(6.05) (9.21)
R2 - 0.96 D.W. = 1.83 SER - 2.58
ll)Banaladesh: Linkaae of Price Paid by the Mills for Raw Jute and Raw JuteFarmaate Price (1974-89)
APRJU = -4.70 + 1.04 APRWHTO(0.88) (43.85)
R (adj) - 0.99 D.W. = 2.05 SER = 10.59
12) Raw Jute Exoort Demand (1975-88S
JUEXWOR G 970.68 - 20.97 T - 0.36 JUPRFYMUVD(27.10) (13.60) (8.01)
+ 98.29 D86 - 51.33 D79 - 60.35 D75(4.62) (2.48) (2.64)
R2 (adj) = 0.95 D.W. = 2.51 SER = 19.32
13) Rest of the World: Raw Jute ExRorts (1975-881
JUEXROW = 627.34 - 106.98 T + 0.10 JUPRFYMUV(-2)(6.14) (6.02) (1.44)
- 64.27 D77 - 54.76 D82(2.56) (2.26)
R2 (adj) - 0.84 D.W. = 1.81 SER - 22.93

36
JUTE GOODS BLOCK
14) Banqladesh: Production of Jute Goods (1975-88)
JGBPDBGD = 9.56 + 1.05 CRJMILL - 2.84 SQRTT - 2.11 D76(3.03) (9.84) (4.80) (2.45)
Fe = 0.89 D.W. = 1.27 SER = 0.7615)
15) India: Production of Jute GoodsB 1976-88)
JGPDIND 1557.39 - 0.39 PRRTJUBTIND - 291.78 D7677(18.61) (2.48) (8.12)
- 287.36 D78 - 238.35 D83 - 143.38 D87(6.53) (5.41) (3.25)
R2 (adj) = 0.92 D.W. = 2.41 SER 41.35
16) Banaladesh: Demand for Jute Goods Stocks (1973-881
JGBESBGD = 6.62 + 0.14 DPRRTJUBTBGD3 - 3.52 D778 - 1.71 D81(36.93) (5.27) (7.45) (2.66)
- 1.54 D76(2.38)
R2 (adj) = 0.84 D.W. = 1.00 SER = 0.62
17) India: Demand for Jute Goods Stocks (1974-88)
JGESIND = -33.85 + 0.05 DPRRTJUHIND3 + 1.90 JUMIIND(0.66) (4.00) (2.67)
- 61.12 D84 - 36.6 D88(3.29) (2.08)
R2 (adj) = 0.58 D.W. = 1.65 SER = 16.39
18) India: Domestic Demand for Jute Goods (1975-88)
JGDCIND -290.95 + 12.71 AGPIIND - 0.26 JBTPRDFIND(1.45) (7.20) (1.73)
- 226.73 D77 + 178.46 D79(2.66) (1.93)
R2 (adj) = 0.84 D.W. = 1.36 SER - 79.0
19) World Imoort Demand for Sackina (1973-88)
JSEXBIT = 266.28 - 0.07 JBTPRBGDMUV + 4.94 PPHSIOMUV(5.97) (3.31) (2.60)
+ 66.51 D80 + 94.22 D81(2.38) (3.38)
R2 (adj) - 0.69 D.W. = 1.88 SER - 26.79

37
20) World Import Depiand for Hesgian (1969-801
JHEXINDBGD = 525.04 - 3.17 T - 49.80 BURPPRT + 95.67 D80 - 83.15 D88(8.54) (1.99) (1.27) (2.34) (1.97)
R2 (adj) - 0.44 D.W. = 3.06 SER - 37.92
21) Bangladesh: Share in Total Hessian Extorts (1974-88)
JHEXSHBGD = 149.39 - 59.42 RJHPR - 46.66 RJHPR(-1) + 9.61 D82 + 12.94 D83(8.05) (3.04) (2.36) (2.84) (3.73)
R2 (adj) = 0.77 D.W. = 1.50 SER - 3.21
22) Banaladesh: Share in Total Sacking Exgorts (1975-88)
JSEXSHBGD = 120.29 - 0.52 PRRTBTBGDIND$2 + 6.28 D8182 - 9.94 D84 + 5.95 D85(10.12) (4.15) (3.16) (3.32) (2.18)
R2 (adj) = 0.72 D.W. = 2.83 SER - 2.52
23) Price Linkaae of N.Y. BurlaD Price to Banaladeshi Hessian Price (1973-89)
BURlONY = 1.40 + 0.45 JHPRBGD$ + 0.72 JHPRBDG$(-1)(0.86) (5.68) (9.38)
R2 (adj) = U.92 D.W. = 2.11 SER = 1.36

38
Descri$tion of Variables
APRJV: Average price for raw jute paid by the mills
APRWHTO: Average farmgate price of white and tossa raw jute (=PRJU)
SQRTT: Square root of the time trend
JUEXROW: Raw jute exports by the rest of the world (i.e. excluding
India and Bangladesh)
JUPRFYMUV: Raw jute price in Bangladesh on fiscal year basis, converted
into USS and divided by the MUV
JUPRFYMUVD: first difference of JUPRFYMUV
ESRJ: Stocks of raw jute in Bangladesh
DERRJBO: RRJBO-RRJB03
RRJBO: Real interest rate in Bangladesh
RRJB03: Three-year moving average
PDJUTE: Production of raw jute in Bangladesh
CRJMILL: Mill demand for raw jute in Bangladesh
RRJWG: Raw jute by the mills in Bangladesh over wages paid by jute
mills
RSAWG: Sacking price over wages paid by jute mills
TLOOMS: Total number of looms in Bangladeshi mills
JUQIND: Production of raw jute in India
PRRTJURCIND: Ratio of farmgate raw jute in India to farmgate price for
rice.
PRRTJURCINDD: PRRTJURCIND-PRRTJURCIND3(-1)
PRRTJURCIND3: Three-year moving average
JUPPIND$: Farmgate price in India in USS terms
PRJU$: Farmgate price in Bangladesh in U.S. $ terms
ESJt'TND: Ending stocks for raw jute in India
JGBPDBGD: Jute goods production in Bangladesh
BURlONYs Burpal price in New York
JHPRBGD$: Hessian price of Bangladesh in US$ terms

39
JSEXBIT: Total world import demand for sacking equal to export supply
of sacking by Bangladesh, India and Thailand.
JBTPRBGDMUVW Export sacking price in Bangladesh divided by MUV
PPHS1OMUVs Polypropylene price in the U.S. divided by MUV.
JGBESBDG: Jute goods stocks in Bangladesh
DPRRTJUBTBGD3: PRRTJUBTBGD-PRRTJUBTBGD3
PRRTJUBTBGD: Farmgate price of raw jute in Bangladesh divided by the export
price cf sacking in Bangladesh
PRRTJUBTSGD3s Three-year moving average
JUMIIND: Mill demand for raw jute in India
JGPDIND: Production of jute goods in India
PRRTJUBTINDs Jute price in India divided by the hessian price in India
JGDCIND: Domestic demand for jute goods in India
AGPIND: Agricultural production index of India
JBTPRFIND: Sacking price of India deflated by the wholesale price index
JGESIND: Jute goods stock demand in India
DPRRTJUHIND3: PRRTJUHIND-PRRTJUHIND3
PRRTJUHIND: Price of raw jiSte in India deflated by the hessian price in
India
PRRTJUHIND3: Three-year moving average
JHEXSHBGD: Bangladesh share in world hessian exports
RJHPR: Hessian price in Bangladesh (in USS) divided by the Hessian
price in India (in USS).
JHEXINDBGD: World import demand for hessian
BURPPRT: Burlap price in N.Y. divided by the polypropylene price in the
U.S.
JSEXSHBGD: Bangladesh share in world sacking exports
PRRTBTBGDIND$2t (PRRTBTBGDINDS + PRRTBTBGDIND$(-1)J/2
PRRTBTBGDIND$s: Ratio of sacking price of Bangladesh (in USS) over the sacking
price of India (in US$)
ARJUWH: Area of white jute in Bangladesh

40
RWHBO: Ratio of white jute price to rice boro price in Bangladesh
RWHBOl: Ratio of current agriculture wage to lagged rice boro price in
Bangladesh
ARJUTO: Area of tossa jute in Bangladesh
RTOBOs Ratio of tossa jute price to rice boro price in Bangladesh
YLDJUTOs Yield of tossa jute in Bangladesh
FERTUSE: Use of fertilizers in Bangladesh
YLDJUWHt Yield of white jute in Bangladesh

41
STATISTICAL ANNEX TABLES

Annex Table 1: PRODUCER PRICES FOR JUTE AND PADDY IN BANGLADESH AND INDIA
Season Bangladesh IndiaJuly-June Jute LA Paddy JU/PD Jute Area Jute If Paddy JU/PD (Jute Area)
(TX/ton) (TX/ton) (Ratio) ('000 HA) (RS/Ton) (RS/Ton) (Ratio) ('000 HA)
1970/71 890 1534 728 2.107 1,0791971/72 678 1475 769 1.918 1,1111972/73 1468 928 1.582 896 1685 884 1.906 9931973/74 1502 1222 1.229 889 1398 1058 1.321 1,1621974/75 2389 3170 0.754 583 1758 1400 1.256 983
1975/76 2292 2064 1.110 526 1879 1508 1.246 9151976/77 2735 1547 1.768 659 2005 1241 1.616 1,0891977/78 4282 2061 2.078 741 2229 1310 1.702 1,1621978/79 3552 1966 1.807 842 2164 1274 1.699 1,2641979/80 2682 2152 1.246 768 2124 1404 1.513 1,217 4
1980/81 3267 2557 1.278 642 2166 1615 1.341 1,3001981/82 3555 2709 1.312 578 2413 1765 1.367 1,1501982/83 5173 3535 1.463 584 2725 1860 1.465 1,0201983/84 5443 3608 1.509 587 3848 1950 1.973 1,0541984/85 11616 4904 2.369 608 8173 2104 3.885 1,129
1985/86 5646 4131 1.367 1,012 3140 2028 1.548 1,4941986/87 3074 4888 0.629 664 3085 2323 1.328 1,0751987/88 7100 5653 1.256 512 3416 2238 1.526 9511988/89 6058 5724 1.058 544 4497 2300 1.955 9411989/90 6120 2400 2.550 880
La Average price of jute at growers level./b WS at Calcutta.
Sources: Bangladesh Ministry of Jute and Bangladesh Bureau of Statistics:Indian Jute Manufactures Development Council.

Annex Table 2: SUPPLY AND DISTRIBUTION OF JUT$ IN BANGLADESH,1964/65-1988/89 (TRADE ESTIMATE)
Distribution_Suvplv Export Mill Domestic Closing
Period Carryover Production Total Overseas Issue Consumption Shortfall Total Stock
------------------------------------ Lakh bales----------------------_----------_
1964-65 11.68 54.24 65.92 39.24 17.12 2.50 - 58.86 7.061965-66 7.06 71.58 +79.78 44.48 24.50 2.50 - 71.48 8.301966-67 8.30 77.51 35.40 24.10 24.10 2.50 - 62.00 15.511967-68 15.51 69.68 85.19 38.63 30.01 2.00 - 70.64 14.551968-69 14.55 58.16 72.71 32.49 29.93 2.50 - 64.42 8.291969-70 8.29 73.91 82.20 35.08 36.18 2.13 - 73.39 8.811970-71 8.81 68.01 76.82 21.98 27.39 2.00 3.98 55.35 21.471971-72 21.47 42.86 64.33 19.17 19.17 1.50 11.60 51.71 12.621972-73 12.62 66.24 78.86 28.28 24.91 1.50 2.06 55.75 22.11 *1973-74 22.11 61.50 83.61 26.62 29.41 2.00 2.00 60.03 23.581974-75 23.58 39.67 63.25 15.49 25.46 1.00 2.00 43.95 19.301975-76 19.30 43.46 62.76 23.47 26.73 1.50 0.41 52.11 10.651976-77 10.65 47.00 57.65 22.76 28.91 3.00 0.53 55.20 2.451977-78 2.45 55.08 57.53 16.67 30.74 3.00 0.20 50.61 6.921978-79 6.92 67.21 74.13 19.68 28.09 3.00 0.05 51.81 23.321979-80 23.32 72.38 95.70 19.68 29.82 3.00 1.00 53.50 42.201980-81 42.20 47.83 90.03 19.44 33.56 4.00 0.50 57.50 32.531981-82 32.53 43.17 75.70 19.11 33.46 4.00 0.61 57.18 18.521982-83 18.52 55.14 73.66 22.46 33.20 4.00 0.50 60.16 13.501983-84 13.50 53.10 66.60 19.02 33.28 4.00 0.20 56.50 10.101984-85 10.10 49.39 59.49 14.08 32.50 3.00 0.15 49.73 9.761985-86 **9.76 86.58 96.34 23.01 28.45 2.00 0.23 53.69 42.651986-87 42.65 54.61 97.26 22.41 33.56 2.29 - 58.26 39.001987-88 39.00 43.38 82.38 13.45 32.24 4.00 0.61 49.69 32.081988-89 32.08 44.39 76.47 16.17 31.68 4.00 1.18 53.03 23.44
Source: BJMC.

Annex Table 3: PRODUCTION AND EXPORTS OF JUTE GOODS BY BANGLADESH: 1980/81-1989/90
Production ExportsCarpet Carpet
Year Hessian Sacking Backing Total" Hessian Sacking Backing Total"
…-------------------------------------…(000 tons)------------------------------------
1980-81 205 310 71 591 183 238 76 5011981-82 198 329 56 587 187 295 54 5371982-83 228 242 94 570 225 195 91 5141983-84 242 179 97 544 214 162 94 4751984-85 210 219 81 524 185 177 73 4431985-86 161 225 67 491 150 242 69 4941986-87 205 249 81 597 208 198 73 5331987-88 224 226 60 578 176 176 61 4741988-89 190 238 71 558 146 218 56 5081989-90 178 268 69 664 194 209 67 542
/a Total includes jute yarn and other minor jute products.
Source: FAO, Quarterly Review of Statistics.

45
Annex Table 4: BANGLADESH'S AND INDIA'S EXPORTS OF SACKING ANDTHEIR SHARES: 1972/73-1988/89 La
Banoladesh IndiaYear Quantity Share Quantity Share
('000 tons) (l) ('000 tons) (%)
1972/73 172 59.8 73 25.41973/74 209 57.2 102 27.91974/75 184 51.0 128 35.51975/76 201 68.1 63 21.21976/77 212 71.2 65 22.01977/78 245 72.6 61 18.01978/79 202 70.4 37 13.01979/80 210 68.6 44 14.21980/81 238 65.5 66 18.01981/82 295 74.7 56 14.31982/83 195 76.8 32 12.51983/84 162 71.3 15 6.511984/85 177 66.9 35 13.31985/86 242 79.9 27 8.81986/87 198 73.2 20 7.31987/88 176 68.3 7 2.51988/89 218 81.3 8 3.0
/a Shares in combined exports of Bangladesh, India and Thailand.
Source: FAO.

46
Annex Table 5: BANGLADESH'S AND INDIA'S EXPORTS OF HESSIAN AND
THEIR SHARESt 1972/73-1988/89 LA
Bangladesh India
Year Quantity Share Quantity Share
1972/73 166 39.5 254 60.5
1973/74 147 39.9 221 60.1
1974/75 139 33.3 278 66.7
1975/76 162 41.4 229 58.6
1976/77 154 40.6 225 59.4
1977/78 187 40.0 281 60.0
1978/79 170 40.1 254 59.9
1979/80 183 38.7 290 61.3
1980/81 187 43.9 239 56.1
1981/82 225 51.3 214 48.7
1982/83 214 57.5 158 42.5
1983/84 185 48.1 200 51.9
1984/85 150 46.3 174 53.7
1985/86 20'l 53.7 179 46.3
1986/87 176 50.4 173 49.6
1987/88 146 51.8 136 48.2
Lj Shares in combined exports of Bangladesh, India and Thailand.
Sourcet FAO.

Anmex Tabte 6: BAGLADESH AND INDIA JUTE GOODS EXPORT PRICES 1970-89
Countries lanatadesh IrdiaProduct Hessian B-Twill Sacks Hessian _-TwilL SacksCurrency Tata US$ Tak USS ReU Rupee USSUnits lOO YdB lOO Yds 100 589S 100o89gs 100 Yds 100 Yds 100 Begs 100 Begs
Seasons
170-71 55.3 111.4 88.8 11.8 265.1 35.11971-72 119.0 272.2 108.0 14.6 275.4 37.11972-73 107.2 13.8 262.5 33.7 100.9 13.0 258.3 33.21973-74 138.6 17.4 281.5 35.3 132.2 16.6 293.8 36.91974-75 156.8 17.7 416.6 46.9 133.2 16.6 372.1 46.4
1975-76 172.3 11.6 508.6 34.2 108.4 12.2 324.2 36.41976-77 189.7 12.3 493.3 31.9 109.2 12.0 316.1 35.61977-78 233.2 15.4 639.3 42.3 133.7 15.8 362.3 42.71978-79 305.7 20.1 771.2 50.7 162.6 20.0 426.9 52.51979-80 471.6 30.5 1.029.6 66.5 231.0 28.5 525.1 64.8
1980-81 348.8 21.3 929.4 56.9 161.0 20.1 457.0 57.01981-82 331.5 16.5 934.3 46.6 150.0 16.4 437.0 47.71982-83 416.8 17.7 1,117.3 47.4 169.0 17.3 497.0 50.8 -S1983-84 522.3 21.7 1,377.9 57.3 238.0 22.6 692.0 65.61984-85 716.8 27.5 1,834.1 70.3 353.0 28.8 1,095.0 89.5
1985-86 572.1 19.1 1,603.0 53.6 250.0 20.4 655.0 53.51986-87 513.1 16.7 1,415.2 6.2 238.0 18.5 594.0 46.21987-88 573.6 18.4 1,367.1 43.8 254.0 19.3 688.0 52.41988-89 627.0 l9.5 1,369.0 42.6 321.0 21.2 875.0 57.81989-90 651.0 19.8 1,422.0 43.2 407.0 24.0 1,116.0 65.8
Sources: Prices - FAD Intergovermnental Group on Jute. Kenaf and Allied Fibers.Exchange Rate - International Monetary Fund.

48
REFERENCES
Takamasa Akiyama, "Jute Supply Response in Bangladesh", World Bank StaffCommodity Working Paper, No.13, 1985.
BBS, Agricultural Year Book of Bangladesh, various issues.
BBS, Monthly Statistical Bulletin, various issues.
R. Gardiner, Campbell and M. Haszler, "Food Price and Supply Stabilization:National Buffer Stocks and Trade Policies", in American Journal ofAgricultural Economics, 61, 1979.
M.E.Dalton, "Dynamic Stockholding Policies for Stabilizing the Wool Market" inOuarterlv Review of Agricultural Economics 29(3), 1976.
R.L. Gustafson, Carryover Levels for Grains, US Department of AgricultureTechnical Bulletin No. 1178, 1958.
M.Hinchy and P. Simmons, "An optimal Control Approach to Stabilizing AustralianWool Prices" in The Australian Journal of Aaricultural Economics, 27(1),1983.
A.M.M. Hossain and M.A.Momen, "The Jute Marketing System in Bangladesh-AnAnalysis of Selected Area", Bureau of Agriculture Economics, BangladeshAgricultural University, 1974.
A. Kueger, M. Schiff and A. Valdes', "Measuring the Impact of Sector-SpecificEconomy-Wide Policies on Agricultural Incentives in LDCs", A paperpresented at The American Economic Association Annual Meetings, 1987.
M.K. Natin and S.A. Mahmood, "The Economics of Production arid Marketing of Juteand Tea in Bangladesh and Its Relevance to Producer Cooperation" (mimeo)BIDS, 1984.
M.K. Mujeri, The World Market for Jute: An Econometric Analvsis, UnpublishedPh.D Thesis, McMaster University, Canada, 1978.
J. Nash and V. Thomas, "Price Stabilization in Agriculture" in V. Thomas,et.al., Linkinci Macroeconomic and Agricultural Policies for Adiustmentwith Growth: The Colombian Experience (Baltimore: The Johns HopkinsUniver&ity Press), 1985.
D.M.G. Newbery and J.E. Stiglitz, The Theory of Commodity Price Stabilization,Oxford: Clarendon Press, 1981.

49
"Optimal Commodity Stock-Piling Rules" in Oxford EconomicPaDers, 34, 1982.
S.H. Rahman, "Simulation of an Econometric Model to Analyze the Impact of aBuffer stock Scheme in the Bangladesh Jute Sector", The BangladeshDevelopment Studies, BIDS, 1981.
. "Supply Response in Bangladesh Agrictlture", The BangladeshDevelopment Studies, BIDS, Vol. XIV, No. 4, December, 1986,
_______,____ 1987a "An Analysis of Seasonal Jute Price Behavior", TheBangladesh Development Studies, BIDS, Vol. XV. No. 3.
, 1987b, "Costs and Returns and An Optimal Pricing Policy for RawJute and Aus in Bangladesh, BIDS, August 1987.
P. Scandizzo, P. Hazell and J. Anderson, Risky Agricultural Markets: PriceForecastina and the Need for Intervention Policies, London: WestviewPress, 1984,
A. Siamwalla, "Approaches to Price Insurance for Farmers." In Crop Insurancefor Agricultural Development: Issues and Experience, edited by A. Huzell,C. Pomereda, and A. Valdes. Baltimore: The Johns Hopkins UniversityPress for the International Food Policy Research Institute.
M.E. Thigpen and T. Akiyama, "Prospects for the World Jute Industry", World BankStaff Commodity Working Papers, No. 14, 1986.
M.E. Thigpen, P. Marongui and S.R. Lasker, "World Demand Prospects for Jute",W7orld Bank Staff Commodity Working Papers, No. 16, 1987.
Williams, J.C. and B.D. Wright, Storaae and Commodity Markets, Cambridge:Cambridge University Press, 1991.
World Bank, Prospects of Maior Primary Commodities, Washington, D.C., 1991.

Policy Research Working Paoer Series
Contac!Itia Author Da for paper
WPS795 Economic Stagnation, Fixed Factors, William Easterly October 1991 R. Martinand Policy Thresholds 39065
WPS796 Excess Liquidity and Monetary Gerard Caprio, Jr. October 1991 W. PitayatonakarnOverhangs Patrick Honohan 37666
WPS797 Using Field Visits to Improve the Richard Heaver October 1991 0. NadoraQuality of Family Planning, Health, 81091and Nutrition Programs: A Supervisor'sManual
WPS798 Agriculture's Decline in Indonesia: Will Marlin October 1991 M. SanchezSupply or Demand Determined? Peter G. Warr 33731
WPS799 Growth in Open Economies Sergio Rebelo November 1991 R. Martin39065
WPS800 The Legal Framework for Private Cheryl W. Gray November 1991 CECSESector Development in a Transitional Rebecca J. Hanson 37188Economy : The Case of Poland Michael A. Heller
Peter lanachokovYoussef Djehane
WPS801 Unraveling the Mysteries of China's Arvind Panagariya November 1991 D. BallantyneForeign Trade Regime: A View from 37947Jiangsu Province
WPS802 Strengthening the Bank's Population Steven W. Sinding November 1991 0. NadoraWork in the Nineties 31091
WPS803 Financial Regulation: Changing the Millard Lono November 1991 W. PitayatonakarnRules of the Game Dimitri Vittas 37666
WPS804 Global Trends in Raw Materials Boum-Jong Choe November 1991 S. LipscombConsumption 33718
WPS805 Privatization in the Soviet Union: Sergei Shatalov November 1991 CECSEThe Beginnings of a Transition 37188
WPS806 Measuring Commercial Bank Dimitri Vittas November 1991 W. PitayatonakarnEfficiency: Use and Misuse of Bank 37666Operating Ratios
WPS807 Moderate Inf;ation Rudiger Dornbusch November 1991 S. MoussaStanley Fischer 33490
WPS808 The New Trade Protection: Price Ann Harrison November 1991 D. BallantyneEffects of Antidumping and 37947Countervailing Measu es in the UnitedStates

Policy Research Working Paper Series
ContactIiIi. Author fer paper
WPS809 Openness and Growth: A Timo Ann Harrison November 1991 WDR OfficeSeries, Cross-Country Analysis for 31393Developing Countries
WPS810 Poverty and Income Distribution Francois Bourguignon Novemnber 1991 D. Bailantyneduring Adjustment: Issues and Jaime de Melo 37947Evidence from the OECD Project Christian Morrisson
WPS811 Comparative Resource Allocations Peter T. Knight December 195t D. Afzalto Human Resource Development Sulaiman S. Wasty 36335
WPS812 Alternative Forms of External Stijr Claessens December 1991 S. King-WatsonFinance: A Survey 31047
WPS813 Price Stabilization for Raw Jute Takamasa Akiyama December 1991 D. Gustafsonin Bangladesh Panos Varangis 33714