Embed Size (px)
Citation preview

The Park Place Economist The Park Place Economist
Volume 23 Issue 1 Article 8
4-2015
Price Determinants of Sulfur Dioxide Market Price Determinants of Sulfur Dioxide Market
Randy N. Azuogu, '15 [email protected]
Follow this and additional works at: https://digitalcommons.iwu.edu/parkplace
Recommended Citation Azuogu, '15, Randy N. (2015) "Price Determinants of Sulfur Dioxide Market," The Park Place Economist: Vol. 23 Available at: https://digitalcommons.iwu.edu/parkplace/vol23/iss1/8
This Article is protected by copyright and/or related rights. It has been brought to you by Digital Commons @ IWU with permission from the rights-holder(s). You are free to use this material in any way that is permitted by the copyright and related rights legislation that applies to your use. For other uses you need to obtain permission from the rights-holder(s) directly, unless additional rights are indicated by a Creative Commons license in the record and/ or on the work itself. This material has been accepted for inclusion by faculty at Illinois Wesleyan University. For more information, please contact [email protected]. ©Copyright is owned by the author of this document.

Price Determinants of Sulfur Dioxide Market Price Determinants of Sulfur Dioxide Market
Abstract Abstract The exponential increase of emissions linked to industrialization released into the air has been a developing concern. Since the early 1960s the United States and other countries have begun recognizing the impacts of acid precipitation, a result of emitted sulfur dioxide reacting with water molecules in the atmosphere to produce harmful acid. Many researchers, climate policy makers, and government officials actively tried to mitigate the origins and effects of acid precipitation, but little was accomplished the U.S. Congress passed and President Carter signed the Acid Precipitation Act of 1980. This piece of legislation allocated resources from the United States Government to allow a 10 year assessment of the causes and consequences of acid precipitation with hopes of developing options for reducing known effects. Although this was a meaningful step forward, few reform proposals have successfully negotiated the trepid path from theory to implementation. A successful program must be realistic. The most conceivable idea of climate reform is not about how to stop the output of SO2, but about how to control it. The SO2 allowance market, one of the most successful climate policy instruments, was put into action in 1995. By providing economic incentives to firms with lower emissions, it effectively limited the amount of harmful sulfur dioxide that was emitted into the atmosphere while introducing fully marketable commodities—allowances—into the market. This paper focuses the factors that determines the price for these allowances and discharge permits and assesses the economic impacts of this incentive program.
This article is available in The Park Place Economist: https://digitalcommons.iwu.edu/parkplace/vol23/iss1/8

8The Park Place Economist, Volume XXIII
Price Determinants of Sulfur Dioxide Market
Randy Azuogu
I. Introduction The exponential increase of emissions linked to industrialization released into the air has been a developing concern. Since the early 1960s the United States and other countries have begun recognizing the impacts of acid precipitation, a result of emitted sulfur dioxide reacting with water molecules in the atmosphere to produce harmful acid. Many research-ers, climate policy makers, and government officials actively tried to mitigate the origins and effects of acid precipitation, but little was accomplished the U.S. Congress passed and President Carter signed the Acid Precipitation Act of 1980. This piece of legislation al-located resources from the United States Government to allow a 10 year assessment of the causes and conse-quences of acid precipitation with hopes of developing options for reducing known effects. Although this was a meaningful step forward, few reform proposals have successfully negotiated the trepid path from theory to implementation. A successful program must be realistic. The most conceivable idea of climate reform is not about how to stop the output of SO2, but about how to control it.
The SO2 allowance market, one of the most successful climate policy instruments, was put into action in 1995. By providing economic incentives to firms with lower emissions, it effectively limited the amount of harmful sulfur dioxide that was emitted into the atmosphere while introducing fully market-able commodities—allowances—into the market. This paper focuses the factors that determines the price for these allowances and discharge permits and assesses the economic impacts of this incentive program.
II. Literature Review Though there is a vast amount of research on
potentially harmful compounds emitted into the air and the economic policies that surround the manage-ment of these emissions, this paper focuses the factors that determine the price for sulfur dioxide allowances and discharge permits and assesses the economic impacts of the Acid Rain Program.
The SO2 market, like many other controlled emission markets, is a cap and trade system. In or-der to understand the true functionality of the SO2 market, Farber (2012) asserts that the cap and trade program entails, “an emissions-reduction method that sets a rigid cap on emissions of a target pollutant for a constellation of regulated entities but also leaves them significant discretion to decide how to comply. An emissions trading scheme is based on the issuance of emission allowances… Once the pollution permits have been initially allocated, they are transferable, and sale prices function as free-market equivalents of pol-lution taxes… [And] firms can reduce its emissions to profit by selling unneeded allowances to other present or prospective emitters or occasionally to non-emit-ters entering the allowances market for speculative or environmentalist purposes.” (pg. 8) The merit of the cap and trade program is within the design of the program itself, because the cap determines the total emissions reduction, while the trading process determines which sources re-duce their emissions and to what extent. Through the adoption of the cap and trade program, “the SO2 Emissions Trading program has reduced millions of tons of SO2 annually at a fraction of the expected cost” (Benkovic et al. 2001, pg 242). The prominence of this market came in 1990, “stipulating a 10 million-ton SO2 emission reduction to protect human health,

9The Park Place Economist, Volume XXIII
Azuogu
ecosystems, visibility and materials from caused by SO2 emissions and sulfate particles” (Benkovic et al. 2001, pg 243 ). This looming crisis inevitably initiat-ed the process of the SO2 emissions trading program innovation for a new way to decrease this effect by placing a “mandatory ceiling or cap on emissions at 8.95 million tons, about a 50 percent reduction from 1980 levels” (Carlson, 1998, pg 371). This allows large electricity-generating sources the authorization to emit SO2 by allocation in the form of allowances while effectively controlling the amount of SO2 in the environment. As a result, the SO2 allowances have been much “cheaper than originally expected because industry found less expensive ways to reduce emissions, saving up to one billion dollars per year in compliance costs.” (Kumar 2010, pg. 624)
Although an extensive amount of research has been done about the positive implications of the Acid Rain Program, less has been done to explain the price movements of the SO2 permit prices and how sensitive the prices are to economic variables. Though the fluctuations in permit price account for supply and demand of firms, there are many other critical indicators that play an important role as well. Burtraw and Szambelan evidence this in their research of the effectiveness of SO2 market in which they highlight explanations for price movements of permit price over time. Although they do not specify a finite number of factors they believe play the big-gest role in price determination, they underscore a myriad of valuable signals that do. Burtraw and Szambelan (2009) hypothesize that there are many distinct factors within three main measures that determine the effectiveness of the SO2 trading pro-gram. They are: environmental quality, the perfor-mance of the market, and the economic assessment (pg. 6). In the commencement of the program, “total emissions in 1995, the first year of the program, were 11.87 million tons—25 percent below 1990 levels and more than 35 percent below 1980 levels” (Bur-traw, Szambelan, 2009, pg. 7). As a result, emissions from Phase 1 were well below annual allocations of emissions allowances to those units; yielding a bank (surplus of permits) totaling 11.6 million allow-ances by the end of this phase. Henceforth, once firms had built up a bank of unused allowances, this created a vested self-interest of those banked credits, which provided an opportunity to harvest
low-cost emissions reductions. In some cases, this brought changes in operations or other innovations into practice sooner than otherwise may have oc-curred. As a result, because of the excess of unused allowances, “Phase I units reduced emissions by 57 percent, while Phase II units reduced them by 14 percent after 2000” (Burtraw, Szambelan, 2009, pg. 7). It is argued that these emission reductions lead to increased air quality and subsequent improvements in public health. This outweighed both the economic benefits from reduced emissions and the costs of the program. The performance of the market is inevitably the most important measure of the program’s suc-cess. Indicators within this measure, such as volume of trading between firms, are crucial determinants permit prices in the SO2 allowance market. Within the first three years of the The increased volatility within the market created a lot of traffic, and with the traffic came the participation of financial firms to broker the trading of the unused allowances. By 2005, market activity had increased so much that “70 percent of allowance trading taking place between economically unrelated firms was conducted by large electric companies and financial firms” (Burtraw, Szambelan, 2009, pg. 7). Burtraw and Szambelan then observed that at the beginning of the program “allowance prices were close to $150 per ton and fell to about $70 per ton by early 1996… and thereaf-ter prices rose through 2003” (Burtraw, Szambelan, 2009, pg. 9). This development and increased par-ticipation in the market derived a pivotal finding: allowance prices began to represent the marginal cost of abatement, which in turn is influenced by the cost of fuels (natural gas and coal) and abatement tech-nology. In response, the SO2 market began to reflect the marginal cost of regulation and the higher future value of banked allowances.
Their third measure of price determination, economic assessment, addresses the cost savings from the cap and trade program. One of the most cited observations from the program is that allow-ance prices are significantly lower than policy mak-ers predicted during the adoption of the program. A reason for this is because “changes in fuel markets, including the decline in the delivered cost of low-sul-fur coal and in the price of natural gas and oil in the

10The Park Place Economist, Volume XXIII
Azuogu
1990s, contributed to a decline in emissions” (Bur-traw, Szambelan, 2009, pg. 11). This effectively led to a decline in the marginal cost of reduction, which set the price for permits in the market. Furthermore, two major studies were conducted by Carlson et al. (2000) and Ellerman et al. (2000) to directly mea-sure the cost savings attributable to allowance trad-ing. They compared total costs under trading with a hypothetical regulatory policy that only capped the emissions and didn’t allow for trading. The findings for both studies are highly correlated and derived similar results that saw that cost savings under the cap and trade program attributed about 43-55 per-cent more savings than under the regulatory policy that would have only controlled the emissions cap for each facility. These findings are substantial and extremely telling because they provided strong evi-dence to back up one of original claims that policy makers hoped the system would create technological innovation.
It is believed that cost estimates have fallen over time because the trading program sparked new ways for companies to mitigate emissions at lower costs. Burtraw and Szambelan (2009) argue strongly that “ the flexibility under the trading program pro-vided an impetus for investments in related markets, such as railroads and scrubber installations, that could not have been expected to the degree to which it occurred with a less flexible regulator program in place”(pg 12). One significant impact that was born out of innovation was the concept of fuel blend-ing. Before the allowance market, the idea of fuel blending was thought to be infeasible; however, after the progression of the market, “experimentation in response to the allowance market demonstrated that the detrimental effects of blending low-sulfur coal with other coals were smaller than originally thought”(Burtraw, Szambelan, 2009, pg 13). In fact, firms began to combine mitigation efforts, and in ad-dition to the conception of fuel blending, companies began to install scrubbers to achieve emissions re-duction. Ellerman et al. (1997) estimated that about half as many scrubbers as were originally anticipated were installed during Phase I. In 1995, about 45 per-cent of emissions reductions came from SO2 scrub-bing, with the remaining 55 percent coming from switching to other fuels, such as low-sulfur coal. By 2001, during Phase II, Ellerman (2003) estimated
that the portion of emissions reductions attributable to expanded use of scrubbers only fell by 8 percent to about 37 percent.
These research efforts play pivotal roles in the comprehension of price determinants of the SO2 market. Although this paper’s model displays slightly different determinants for the price of permits, it is important to note that Burtraw and Szambelan’s three measures provide invaluable insight to price discovery for permits. As we will see in the follow-ing empirical model, efforts to observe the most important factors of permit price movements will be composed of contents from price movements in alternative fuels and substitute goods, environmental factors, and the initial allocation of allowances.
III. Theory For my theory section, I am going to incor-porate three separate theoretical frameworks that will help explain my research hypothesis and empirical model.
The first theoretical framework that I will introduce is the Theory of Price. The price theory is an economic theory that contends that the price for any specific good/service is the relationship between the forces of supply and demand. The theory of price says that the point at which the benefit gained from those who demand a good or service meets the sell-er’s marginal costs is the most optimal market price. Thus, in accordance to the SO2 market, the price at which allowance permits will be determined should be the point in which the demand for permits to emit by firms who have high marginal abatement costs is equal to the supply of permits of firms with low marginal abatement costs. In effect, larger firms who have high marginal mitigation costs due to the size of their firm will look to buy permits from smaller firms with low marginal mitigation costs and excess permits; and that equilibrium point will determine the price. More detail will be discussed further in my graphical representation below.
The second theoretical framework is the Effi-cient Market Hypothesis. This theory is important to the price theory because in order for the price theory to be effective the efficient market hypothesis theory must hold true. The Efficient Market Hypothesis is

11The Park Place Economist, Volume XXIII
Azuogu
an investment theory that states that it is impossible to beat the market because stock market efficiency causes existing share prices to always incorporate and reflect all relevant information. According to the theory, stocks always trade at their fair value on stock exchanges, making it impossible for investors to either purchase undervalued stocks or sell stocks for inflated prices. As such, it should be impossible to outperform the overall market through expert stock selection or market timing, and that the only way an investor can possibly obtain higher returns is by pur-chasing riskier investments (Investopedia, pg 1). This theory has met controversial implications, due to the evidence that some individuals do beat the market. However, it is important to note that in a highly reg-ulated system such as the SO2 market in which price is determined by the supply and demand of firms that are competing in it, firms will unintentionally reveal their marginal cost structures either by buying permits, selling them, or by banking them in order to continue efficiently meeting their business standards. The most applicable aspect of this theory to the SO2 market system is that it adds some certainty by the participants concerning the future directions of the market. According to the theory, participants will act on their correct perception of the market allowing the market to move efficiently to equilibrium. Henceforth, to put it in graphical terms, con-sider Figure 1 opposite, which incorporates the two theories of price theory and efficient market hypoth-esis. In this scenario, the profitability of the emissions trading market can best be exemplified through the market for allowance permits. In Figure 1, the sup-ply of allowance permits is capped at Q1, meaning, that is how many permits are available for alloca-tion, and thus how much pollution to be emitted. Through the intersection of the completely inelastic total supply, which is the government limit on the supply of permits, the ultimate effect is the resulting quantities. Low abatement cost polluters reduces pol-lution down from Q1 to Q2, while High abatement cost polluter reduces pollution down from Q1 to Q3. Therefore, this derives new prices for both sources and adequately derives an entirely new demand curve for permits, thus arriving at a tradable market for SO2. For MAChigh it is more costly to mitigate each additional unit of emissions, so in order to meet their production needs, they will simply adjust their
demand for permits based on the markets reactions to demand shifters. If the price for their demand of permits is less than or equal to their marginal cost of abatement then they will buy the permits from the MAClow firms because it is cheaper for them to buy permits rather than reduce emissions. Ad-ditionally, MAClow firms are more than willing to benefit from selling their permits because the price for their demand of permits is greater than or equal to their marginal cost of abatement and it will in-crease revenue for them. Therefore, MAClow firm’s costs structure to mitigate emissions is lower than the MAChigh firms and the combination of interac-tion between the firms develop the efficiency of the market. It is also important to note that Figure 1 only displays two hypothetical firms in order to make the situation more comprehensible. In the circumstance where many firms are involved and speculators enter the market for environmental reasons, the newly derived demand curves plays a much more essential role as many factors will shift the demand for permits positively or negatively.
Figure 1
The incorporation of the theory of price, efficient market hypothesis, and the graphical frame-work for the cap and trade system all play a role in the development of my hypothesis.
IV. Hypothesis On the basis of the demand and supply theories developed above, I believe there is going to be a strong positive correlation between economic indicators and substitutable good prices as well as a negative correlation between environmental factors and the inelastic supply of permits with the prices of SO2 allowances. I believe that with shifts in these de-terminants, demand for SO2 permits will be affected

12The Park Place Economist, Volume XXIII
Azuogu
and will ultimately be the deciding factor of the overall price. I hypothesize that the business cycles, the aggregate SO2 emission cap, natural gas prices, overall coal prices, drought levels, and temperature levels determine the price for SO2 allowance permits. Henceforth, I believe that increases in prices of natu-ral gas and coal will increase the demand for SO2 permits. Increases in unemployment, moisture and precipitation levels (drought index), temperature, and the SO2 cap (ceteris paribus) will decrease the demand for SO2 permits.
V. Empirical Model The data that is used in the regression is derived from a variety of sources, as described below. All relative prices are in real terms and are adjusted for inflation in terms of 2005 values using the Con-sumer Price Index for All Urban Consumers. Data frequency is monthly from August 1994 to June 2005. Graphs for the following price determinants can be found in the Appendix.
Allowance Prices: Monthly SO2 allowance prices were collected from the historical market price index of the Cantor Environmental Brokerage and are com-plied from August 1994 to June 2005.
Natural Gas Prices: Monthly Natural Gas prices are derived from the Federal Reserve Economic Data (FRED) Database and are compiled monthly from August 1994 to June 2005. The original prices are Henry Hub, LA average spot prices measured in dollars per million BTU. The prices range from $1.88 per million BTU to $11.68 per million BTU with an average of $4.58 per million BTU and are a substitute for coal in electricity generating plants. Therefore, Natural Gas prices are expected to correlate positive-ly with SO2 permit prices.
Coal Prices: The regression equation includes a US Coal Price index, CMCOALM, which provides aver-age monthly spot prices from August 1994 to June 2005. The CMCOALM index represents the coal prices in the industry as a whole. Power generating plants use a variety of types of coal, but the three most common types are Bituminous coal, Lignite coal, and Anthracite coal as provided by the U.S. En-ergy Information Administration. The significance of each type of coal is as follows: Bituminous coal is the
most common type of coal described as black coal that has a sulfur content weight range of .7%-4%. Lignite coal is often referred to as brown coal that is formed from naturally compressed heat and has a sulfur content weight of about .4%. Anthracite coal is a hard compact type of coal and is the least common type of coal used for power generating containing a sulfur content weight range of .6%-.77%. Each of these types of coal is used in coal power plants, and I assume that collectively, each will correlate positively with SO2 permit prices over time.
Unemployment Rate: The civilian unemployment rates were collected monthly from the FRED data-base and are used in this study to represent business cycles over time. The overlying assumption is that the unemployment rate will capture expansionary or contractionary periods in the economy. This will have a negative relationship with the prices of SO2 permits depending on the state of the economy.
Drought Index: The Palmer Severity Drought Index (PDSI) is a measurement of dryness based on precip-itation and temperature levels and attempts to mea-sure the duration and intensity of long-term drought inducing circulation patterns. The values of the PDSI range from -4 to +4, with -4 being extreme drought and +4 being extreme moisture. The significance of the PDSI is to capture the extent of the use of Hydro-power, which is a substitute for coal is the context that power generating plants can use H2O to gener-ate power instead of the use of coal. In months of moisture, power generating plants will use less coal and turn to water as a form of power generation. But, in months of drought, plants will have no choice but to use coal or other substitutes as a form of power generation. Therefore, in periods of increased mois-ture and precipitation, the correlation between the demand for permits and the drought index will be negative. For the accurateness of this study the PDSI values are used only for the Northeastern region, as that is where the concentration of Hydropower is used.
Temperature Index: The temperature index is an index used to survey the average temperature of the U.S. over time. The values were compiled from the National Climatic Data Center (NOAA) and are measured in Fahrenheit. The purpose of the tem-

13The Park Place Economist, Volume XXIII
Azuogu
perature index is to capture the seasonal effects of power generation. In colder months when more heat is used, I predict that it will cost more energy as op-posed to warmer months that will use less energy. This underlying assumption is based on the Annual Energy Cost report that states that consumers spend more on heating than on cooling; thus I predict that as average temperature increases, demand for SO2 prices will decrease and permit prices will be affected negatively.
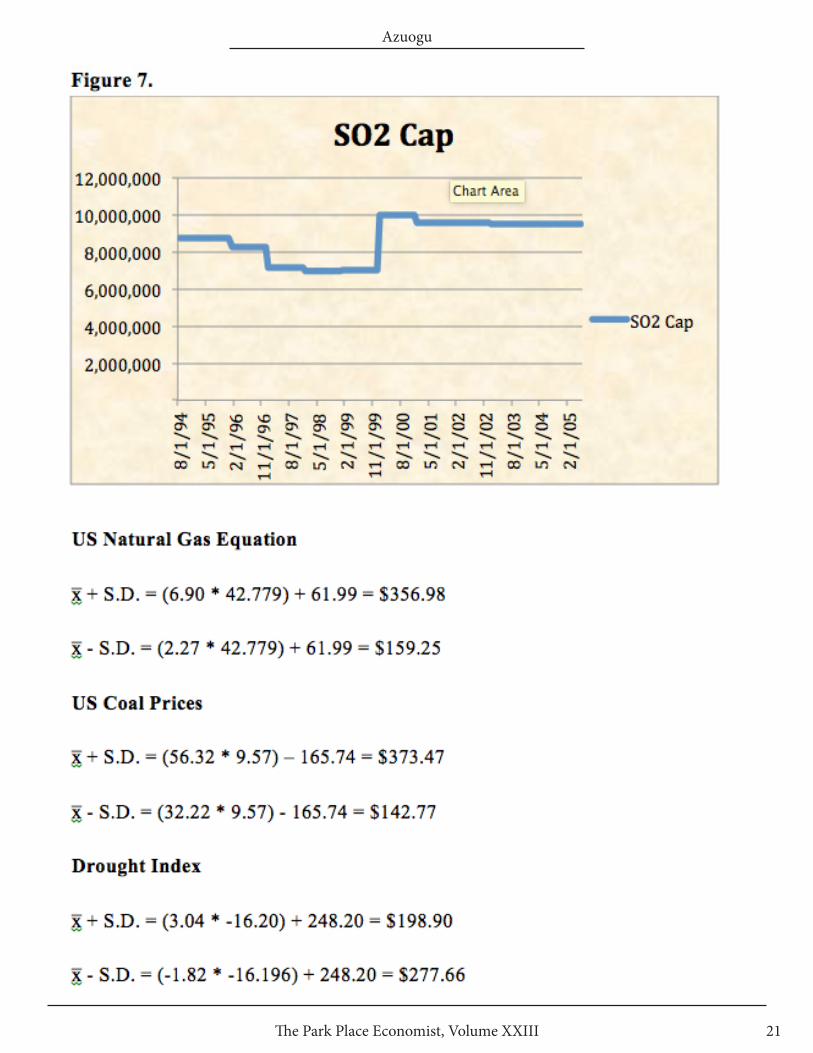
SO2 Allowance Cap: The SO2 allowance cap is the central figure for the supply of allowances. Every year, the government sets a cap on how much SO2 emissions can be emitted, and that is the amount available for supply in that specific year. The data val-ues were obtained from the Environmental Protec-tion Agency’s annual report and are defined as LOG values. Due to the fact that the amount of allowance permits do not change from month to month, the values are compiled annually and are represented as a constant value for each month in a given year. Since the allowance cap determines the supply of SO2 permits, I predict that, keeping all else constant, an increase in supply will cause the price for SO2 per-mits to fall. In order to predict price movements of SO2 permit prices over time, I will be utilizing two regres-sion analysis equations. My models are as follows:
natural gas prices, U.S. Coal Price Index, and the Drought Index were found to be significant at the 99% confidence interval. The unemployment rate, temperature index, and SO2 allowance cap were all found to be insignificant at the 90% confidence inter-val. However, except for the Temperature Index, all of the coefficients of the variables have the expected sign. The R-Squared came out to .543, indicating that the variance of the dependent variable is relatively appropriate for the statistical model. The variables that were found to have the greatest impact on the price of SO2 permits are the US natural gas prices, drought index, and the US coal price index, respec-tively. Comparatively speaking, the results suggests that a one dollar monthly increase in the price of natural gas prices raises the SO2 allowance permits price by 12.9%, a one dollar monthly increase in the price of the US coal price index raises the SO2 per-mit prices by 2.1%, and a one unit monthly increase in the drought index decreases the SO2 permit prices by 6.8%.
In Model 2, the results are ultimately the same with the exception that the dependent variable, SO2 prices, is not in logarithmic form.
Model 1 will be utilized to explain percent-age effects that the price determinants will have on the prices of SO2 allowance permits, barring their significance. Model 2 will serve its purpose to predict the average price of the SO2 permits and the effect the price determinants will have on price movements of SO2 permit prices.
VI. Results In Model 1, the results of the market deter-minants are mixed. As shown in Table 1, the U.S.
Otherwise, Table 2 below shows that US natu-ral gas prices, US coal prices, and the drought index are the only significant variables, all at the 99% confidence interval. Comparatively, the results suggest that a one dollar monthly increase in Real US natural gas prices increas-es SO2 permit prices by about 42.78 dollars, a one dollar monthly increase in Real US coal prices increases SO2 permit prices by about 9.58 dollars, and a one unit monthly increase in the drought index decreases SO2 permit

14The Park Place Economist, Volume XXIII
Azuogu
prices by about 16.20 dollars. The values derived in this section are extremely telling because they will help determine the effect to which movements in their prices affect the price sensitivity of SO2 permit prices.
In order to predict the average price of SO2 permits and to measure the price movements of SO2 permits as a result of the given price determinants, I created Table 3. Simulation Results below that shows the average price and the respective plus or minus standard deviations from the mean of the significant variables. To better understand the mathematical process, the illustration of the three equations that helped derive my values can be found in the Appen-dix.
Next, I used the mean values of each of the independent variables (from the descriptive statistics table below) and inserted them into my empirical model and multiplied them with their respective unstandardized beta coefficients to derive the average SO2 price. The average predicted SO2 price came out to $258.12. The standard deviated prices in Table 3. Simulation Results represent the amount of disper-sion from the mean and are compelling because they quantify the extent to which each variable’s varia-tion in price has on the predicted SO2 price. As US natural gas prices and US coal prices increase relative to the mean, the price of SO2 permits also increases. This is due in large part to the idea that prices for substitutes fuels increase because demand for substi-tute fuels is also increasing. As a result of increased demand, production levels in those power generating plants are also increasing. As supply of unused or un-needed permits attempts to match demand, the price of permits will inevitably increase. The drought in-dex, on the other hand, is a bit more complicated to interpret. In Table 3 Simulation Results, the drought index has the smallest effect in price variation of SO2 permits. However, that small underlying effect actu-ally derives one of the greater meanings of its total effect. In periods of time when there is increased moisture and precipitation, hydropower plants cap-ture the energy of falling water to generate electric-ity. A turbine converts the kinetic energy of falling water into mechanical energy, and then a generator converts the mechanical energy from the turbine into electrical energy. This is a much more efficient way
of generating power and it releases much less SO2 in the atmosphere. However, as already stated, this only happens in times of rainfall. Therefore, although the variable is highly significant, the effect of the drought index is a small percent change. Looking back at Table 1, we can see that as the drought index increas-es (increase in moisture and precipitation levels), this reduces SO2 prices by 6.8%. Thus, as Hydropower generating plants use more water as a more efficient way of generating power, there is no need to buy up more allowance permits, as hydropower is a more ef-ficient alternative and does not create as much emis-sions.
VII. Conclusion The Acid Rain Program is the oldest and most storied cap and trade program in U.S. history. The application of a market system within the pro-gram is proven to have positive environmental and economic effects. From my research, I found that changes in U.S. natural gas prices, U.S. coal prices, and the drought index have the largest effects on the price of SO2 allowance permits; and although my empirical model contains different variables than have been measured in the past with other research studies, I believe that there is merit to the results of my price determinants. The fact that 5 of 6 signs on the coefficients of my variables came out as expected gives confidence to continue furthering these research efforts. Nonetheless, the effect of the temperature index and the SO2 cap yielded disap-pointing results, and is a further application that should be explored deeper. Although in my initial stages I believed that temperature was going to be of great importance to capture the effect of season-able variations on production levels, I quickly found out that it was not. The SO2 cap is another variable that I believed would play a major role as it is my central supply figure in my theoretical supply and demand model for allowance permits, but it too did not produce the results I had hoped for. In extended research I suggest trying to find a way to capture the effect of both of these variables because in reality, they carry great weight in determining the prices for SO2 permits. Under the circumstances that these price determinants all have a significant effect on permit prices, a derived policy implication could be used in developing countries to reduce the industrial output of sulfur dioxide.

15The Park Place Economist, Volume XXIII
Azuogu
In an attempt to discover a way to reduce the effects of sulfuric acid in the atmosphere, a groundbreaking concept was born that provided an efficient and cost-effective way to reduce the emissions and also created an incentive for firms to participate in the process. With decreased levels of sulfuric acid in the atmosphere and with both phase I and phase II decreasing SO2 emissions by 57% and 14% respectively since 2000, the success of this program exceeding initial expectations.
ReferencesBenkovic, S. R., & Kruger, J. (2001). U.S. sulfur dioxide emissions trading program: Results and further applications. Water, Air and Soil Pollution, 130(1-4), 241-246.
Burtraw, D., & Szambelan, S. J. (2009). U.S. emis- sions trading markets for SO2 and NOx. Unpublished manuscript.from http:// search.ebscohost.com.proxy.iwu.edu/login. aspx?direct=true&db=ecn&AN=1083744& site=e ds-live&scope=site; http://www.rff. org/docu ments/RFF-DP-09-40.pdf
Carlson, C., Burtraw, D., & Palmer, K. L. (1998). Sulfur dioxide control by electric utilities: What are the gains from trade?
Efficient Market Hypothesis (EMH) Definition | Investopedia. Retrieved October 14, 2014.
Ellerman, A.D., and J.P. Montero. 1998. The Declin- ing Trend in Sulfur Dioxide Emissions: Im- plications for Allowance Prices. Journal of Environmental Economics and Manage- ment 36(1): 26–45.
Ellerman, A.D. 2003. Ex Post Evaluation of Trad- able Permits: The U.S. SO2 Cap-and-Trade Program. Cambridge, MA: Massachusetts Institute of Technology.
Farber, D. A. (2012). Pollution markets and social equity: Analyzing the fairness of cap and trade. Ecology Law Quarterly, 39(1), 1-56.
Kumar, S., & Managi, S. (2010). Sulfur dioxide allow- ances: Trading and technological progress. Ecological Economics, 69(3), 623-631.
Lackey, Robert T. and Roger L. Blair. 1997. Science, policy, and acid rain: lessons learned. Renew- able Resources Journal. 15(1): 9.13.
Theory Of Price Definition | Investopedia. Retrieved October 14, 2014.

16The Park Place Economist, Volume XXIII
Azuogu

17The Park Place Economist, Volume XXIII
Azuogu

18The Park Place Economist, Volume XXIII
Azuogu

19The Park Place Economist, Volume XXIII
Azuogu

20The Park Place Economist, Volume XXIII
Azuogu
21The Park Place Economist, Volume XXIII
Azuogu


![Chapter_07a[Sulfur Dioxide Removal]](https://img.dokumen.tips/doc/110x75/544ab51ab1af9f7c4f8b4aff/chapter07asulfur-dioxide-removal.jpg)