Embed Size (px)
Citation preview

Preventing the Milk From Spilling
The Value Impact Propositionof Real-Time Auditing
23rd Biennial Forum of Government Auditors Virtual Forum
July 29, 2020
Secretary of StateOregon Audits Division

Let’s Get Real – Session Objectives
• I audit, therefore, I qualify• Real-time performance auditing primer• Strategic considerations• The power of data analytics in the real-time toolkit• Real-time audit high impact case examples
• Real-time auditing is just auditing… but it goes to 11• Ye Olde Auditor Paradigm: To Be Proactive or Reactive, That is the Question I Ask
of Thee• Dynamic risk assessment: Right risk, right time, right plan• Get Hungry: Increasing auditor risk appetite• The incredible value potential of public assurance• None Shall Pass! Auditing standards considerations• Do or Do Not, There is No Try: Creative real-time audit reporting• A golden opportunity: real-time auditing prospects in a COVID world• A few quick real-time audit stories
Some Strategic Considerations…
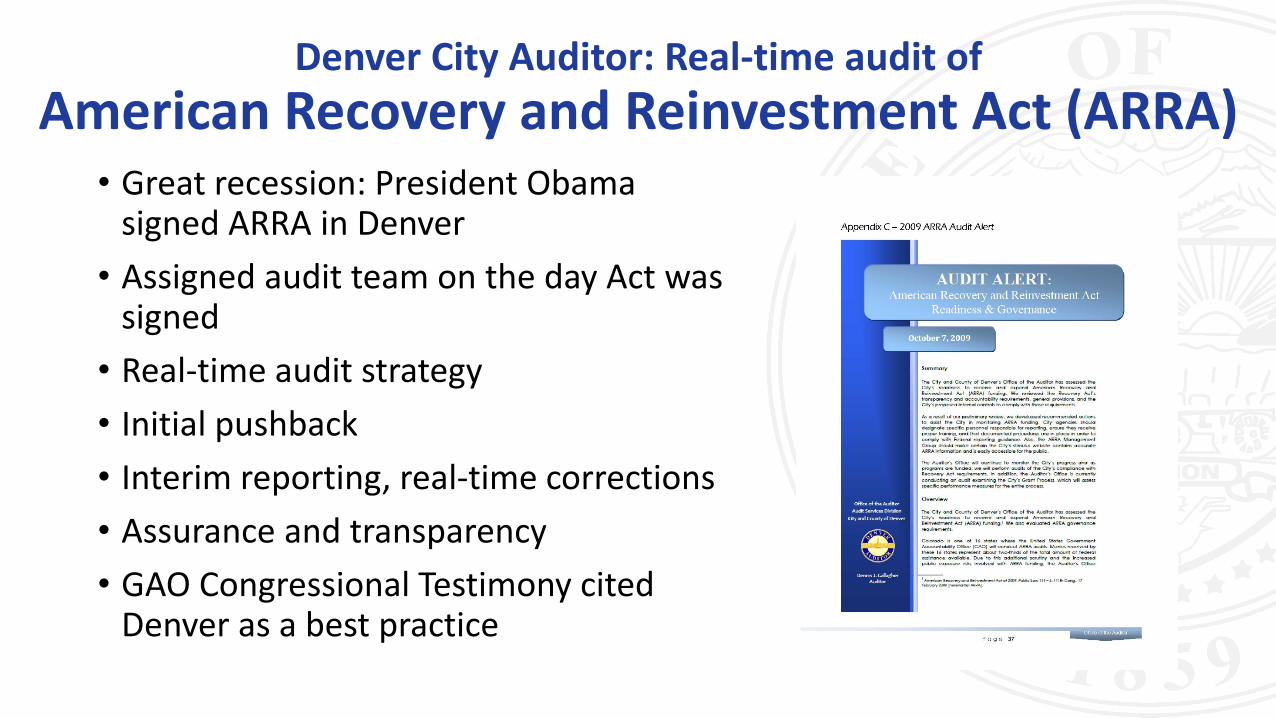
Denver City Auditor: Real-time audit ofAmerican Recovery and Reinvestment Act (ARRA)
• Great recession: President Obama signed ARRA in Denver
• Assigned audit team on the day Act was signed
• Real-time audit strategy• Initial pushback• Interim reporting, real-time corrections• Assurance and transparency• GAO Congressional Testimony cited
Denver as a best practice
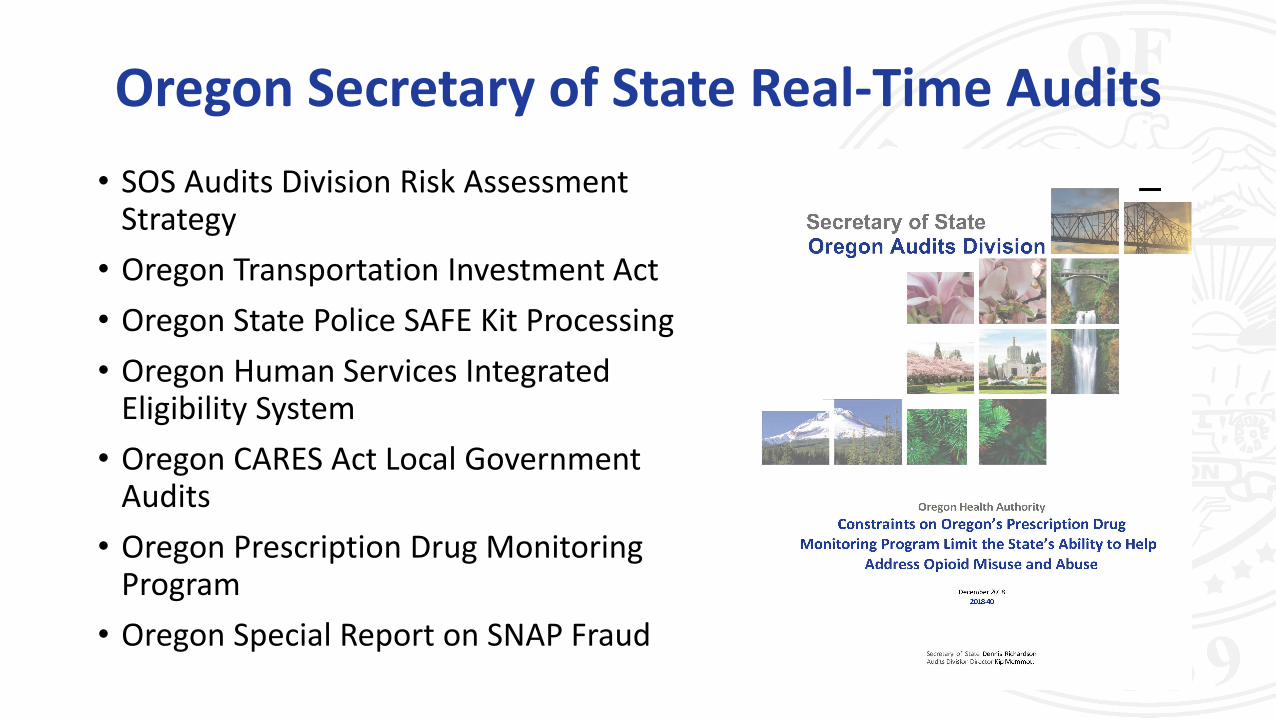
Oregon Secretary of State Real-Time Audits• SOS Audits Division Risk Assessment
Strategy• Oregon Transportation Investment Act• Oregon State Police SAFE Kit Processing• Oregon Human Services Integrated
Eligibility System• Oregon CARES Act Local Government
Audits• Oregon Prescription Drug Monitoring
Program• Oregon Special Report on SNAP Fraud
Real Time Analytics and AuditLooking toward the future
Key Benefits• Real time snapshot of risk• Uncover fraud waste and abuse• Independence and autonomy• Evaluation of management’s
monitoring• Improvements to financial
operations• Reduction in financial errors and
potential fraud
• Increased profitability• Increased ability to mitigate risks• Reduction in the cost of assessing
internal controls• Efficiencies in auditing


Fraud Scheme
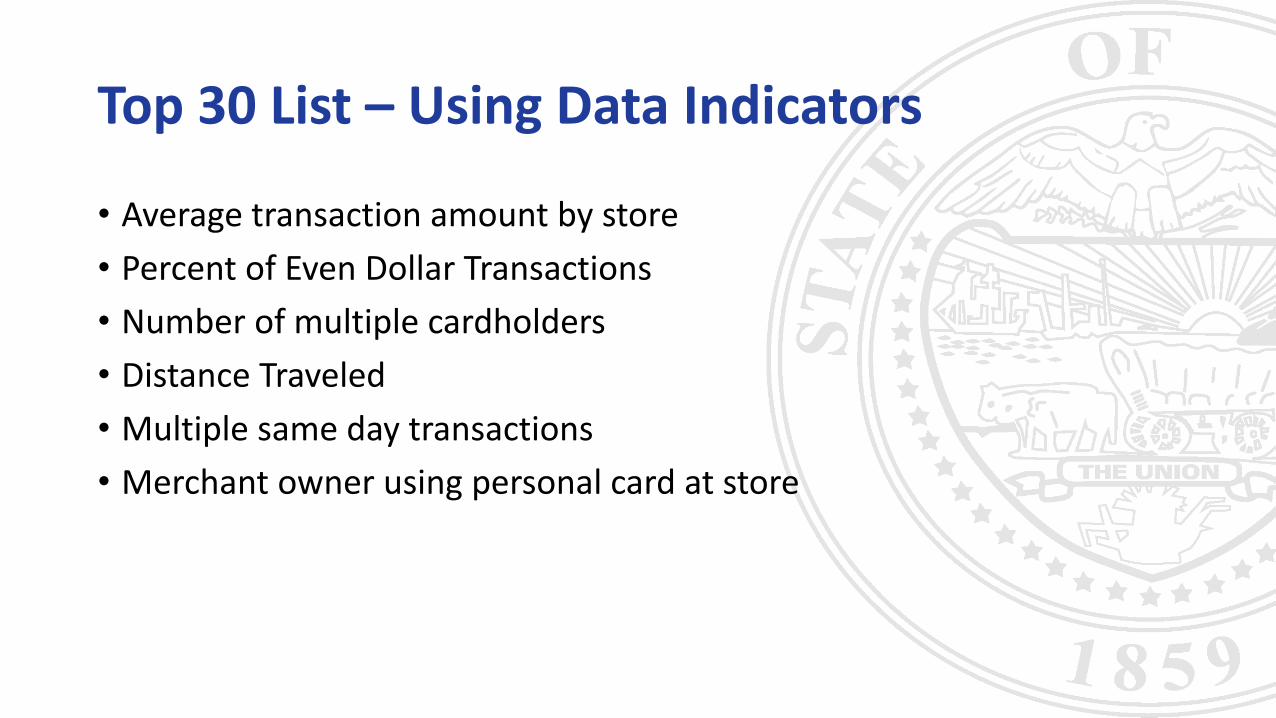
Top 30 List – Using Data Indicators
• Average transaction amount by store• Percent of Even Dollar Transactions• Number of multiple cardholders• Distance Traveled• Multiple same day transactions• Merchant owner using personal card at store
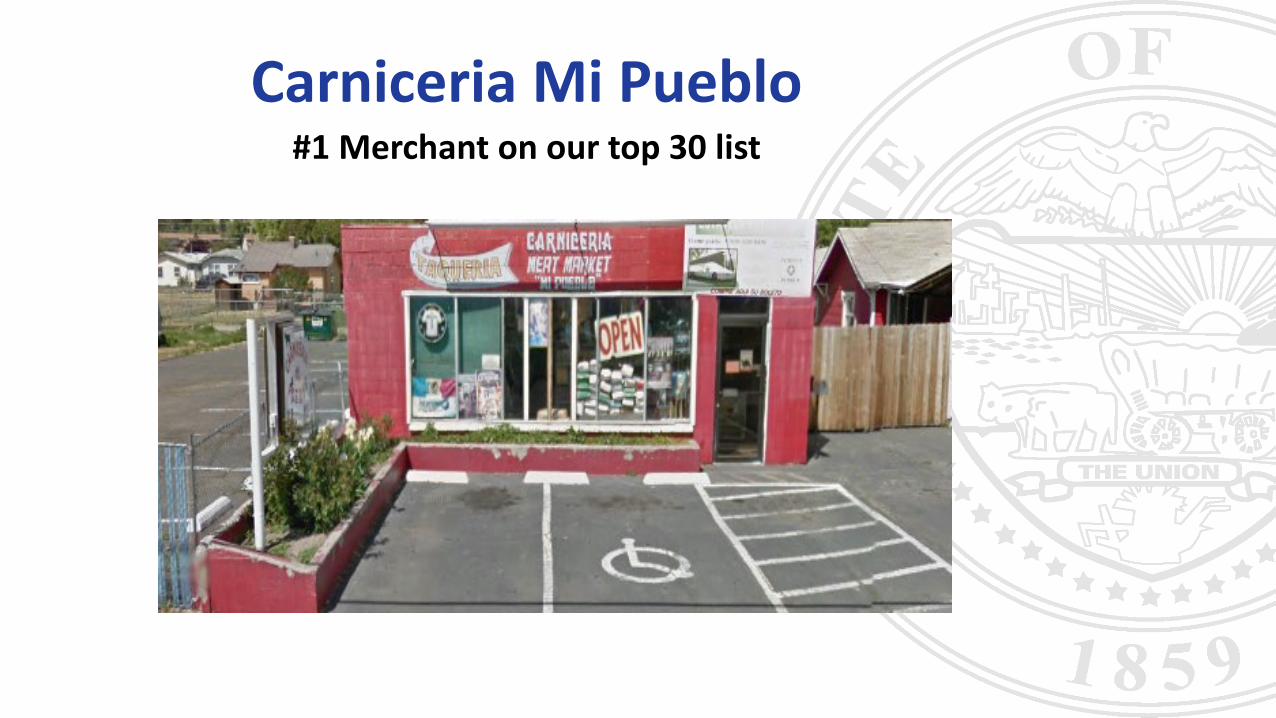
Carniceria Mi Pueblo#1 Merchant on our top 30 list
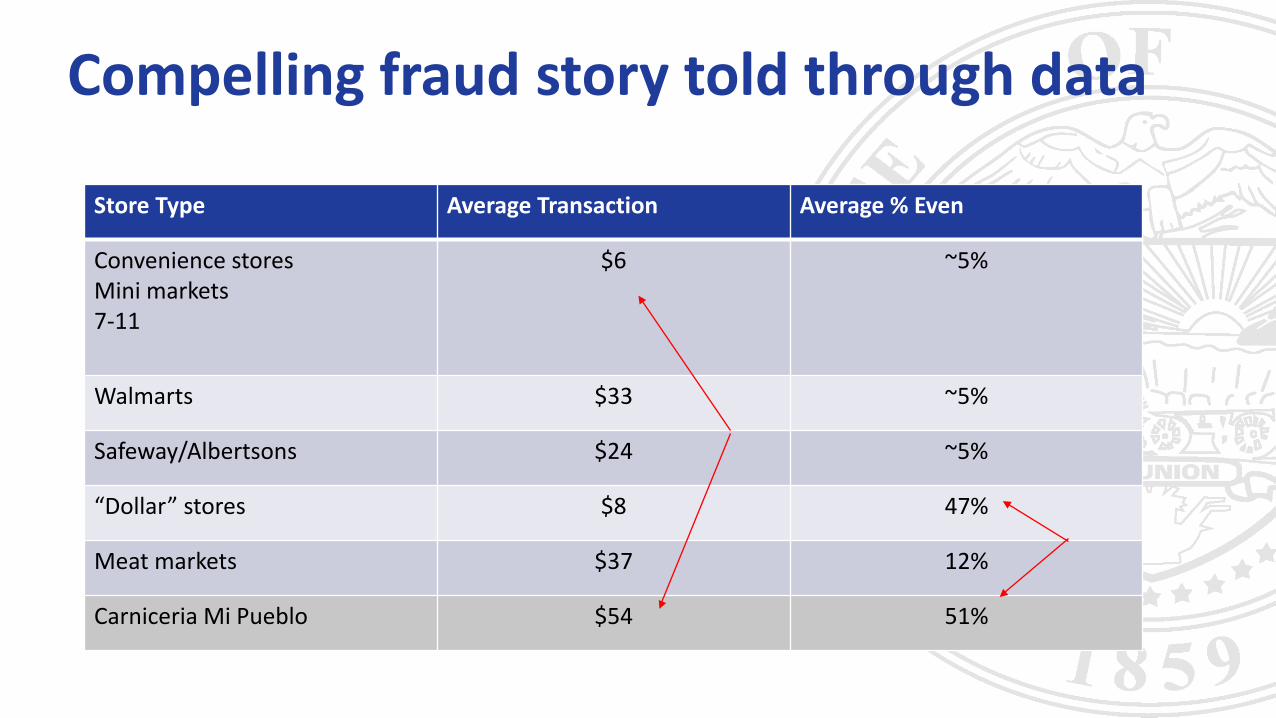
Compelling fraud story told through data
Store Type Average Transaction Average % Even
Convenience storesMini markets7-11
$6 ~5%
Walmarts $33 ~5%
Safeway/Albertsons $24 ~5%
“Dollar” stores $8 47%
Meat markets $37 12%
Carniceria Mi Pueblo $54 51%
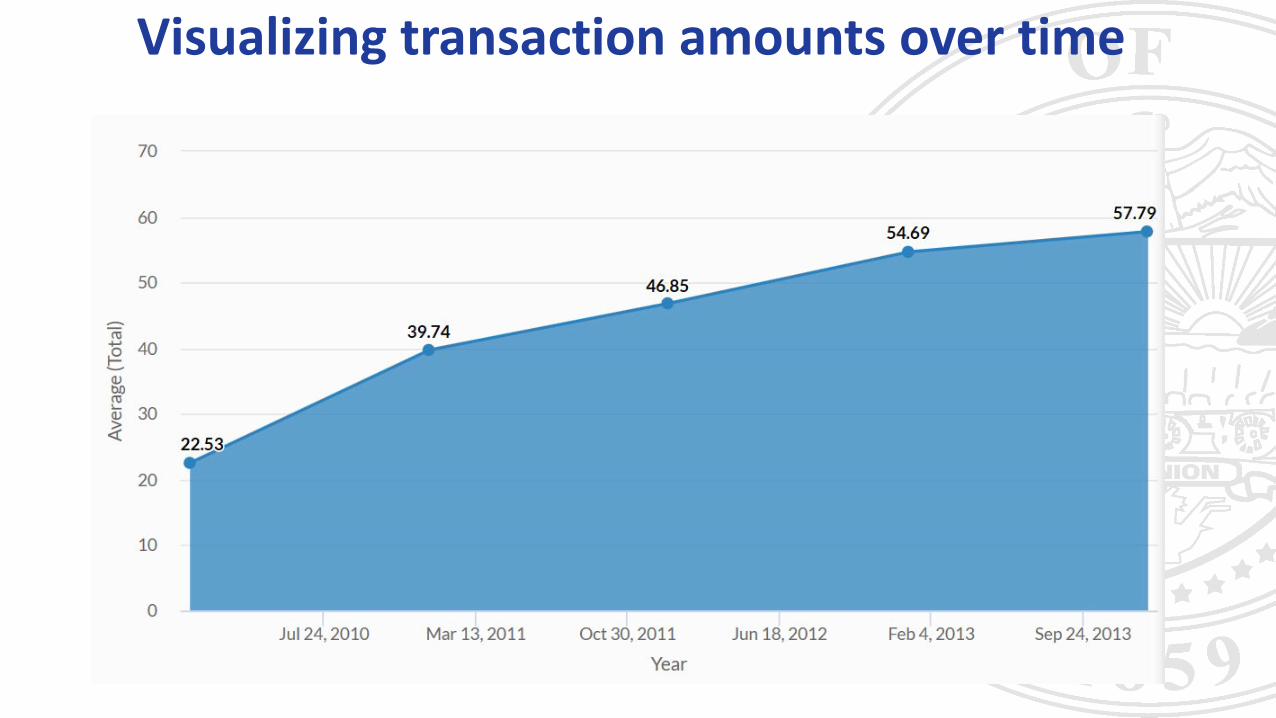
Visualizing transaction amounts over time
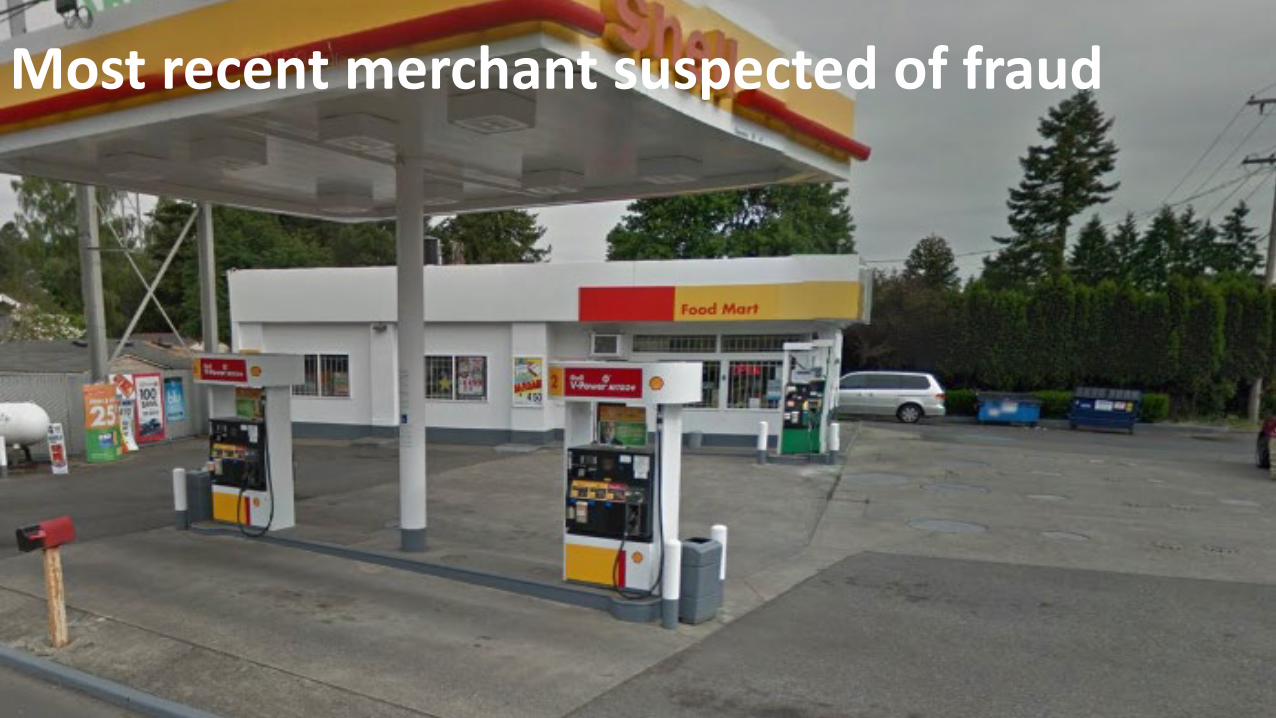
Most recent merchant suspected of fraud
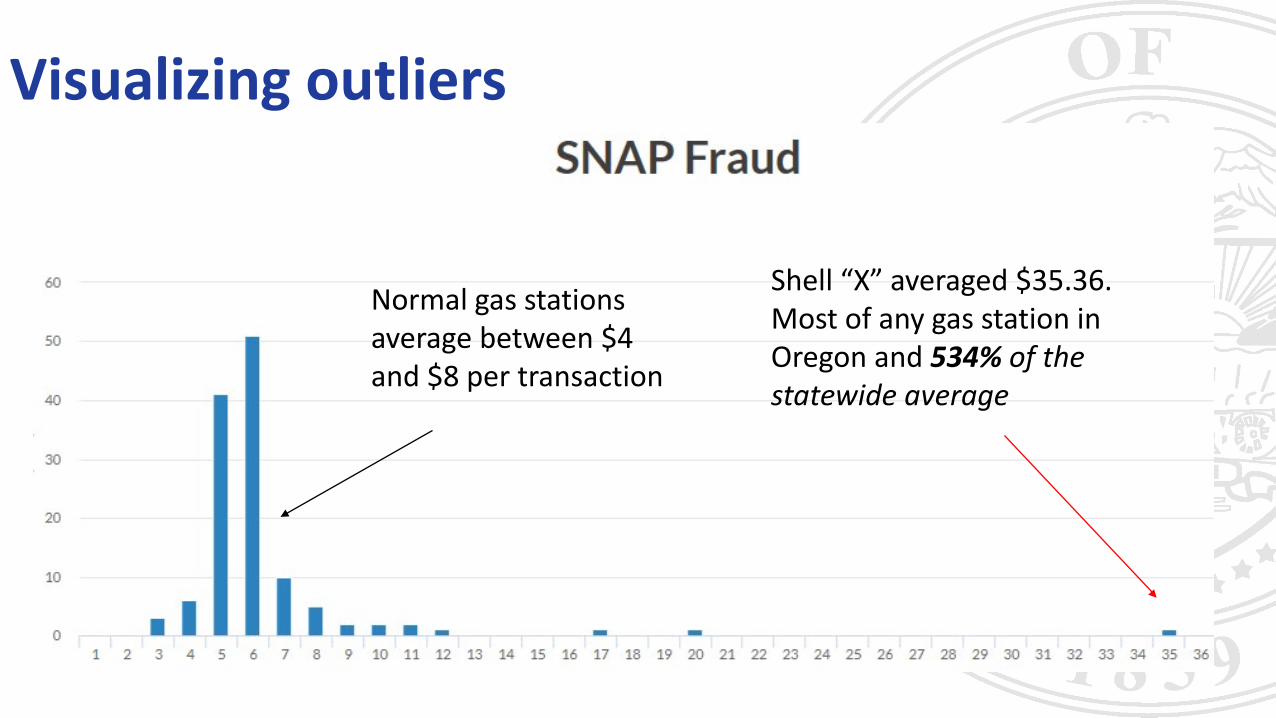
Visualizing outliers
Normal gas stations average between $4 and $8 per transaction
Shell “X” averaged $35.36. Most of any gas station in Oregon and 534% of the statewide average
Hundred dollar transactions
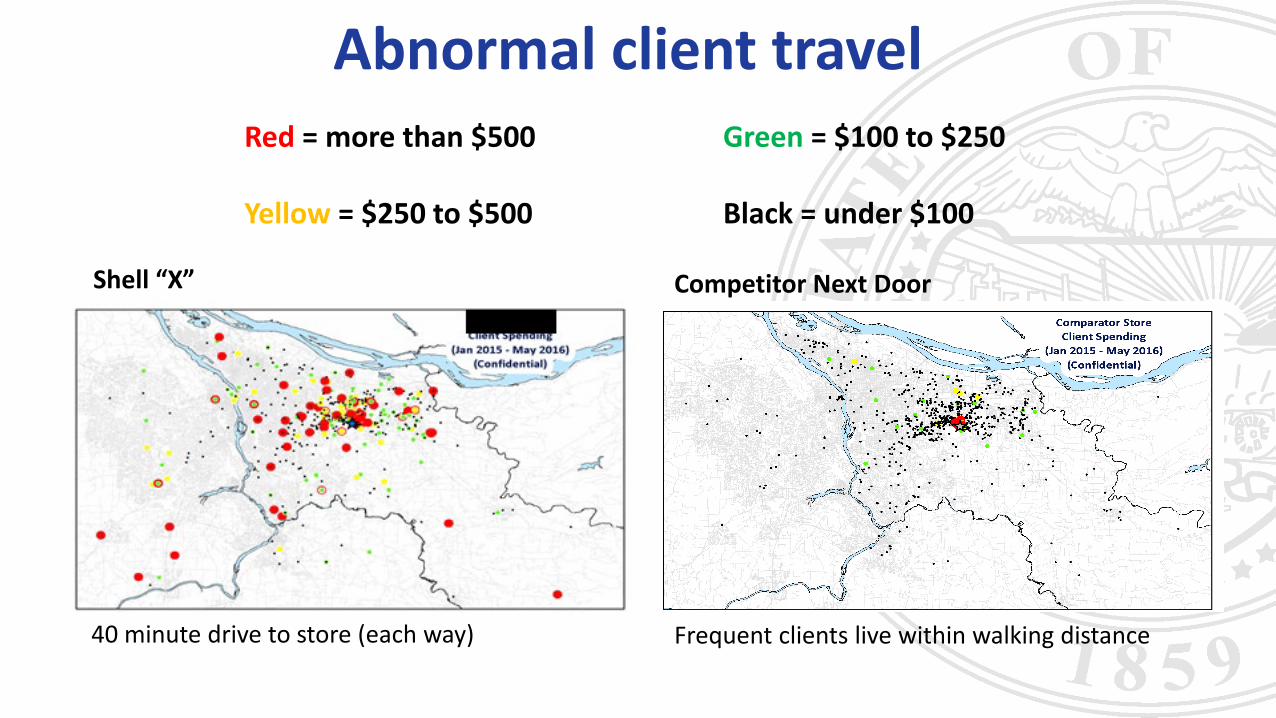
Abnormal client travel
Shell “X” Competitor Next Door
Red = more than $500 Green = $100 to $250
Yellow = $250 to $500 Black = under $100
40 minute drive to store (each way) Frequent clients live within walking distance

Results to Date
7 Merchants investigated Over 250 individuals prosecuted Mexican Drug Cartel operation
taken down Oregon received $300,000 grant to
continue developing the work FNS working with other states to
implement analytics and GIS to identify merchants/clients
Decreased fraud from other merchants
Tens of thousands in restitution paid Continuous real-time monitoring
occurring and partnering with FBI, OIG and local law enforcement

What is the Prescription Drug Monitoring Program?• Oregon’s Prescription Drug Monitoring Program (PDMP) collects
information on controlled substance prescriptions within the state• Promotes public health and safety• Improve patient care• Supports the appropriate use of prescription drugs

Opioids and Substance Abuse in Oregon
• Oregon consistently ranks high for drug misuse and abuse
• Oregon seniors and teens are significantly impacted by opioids and substance use disorders
• 6th highest percentage of teenagers with a substance use disorder
• Highest rate in the nation of seniors hospitalized for opioid-related issues
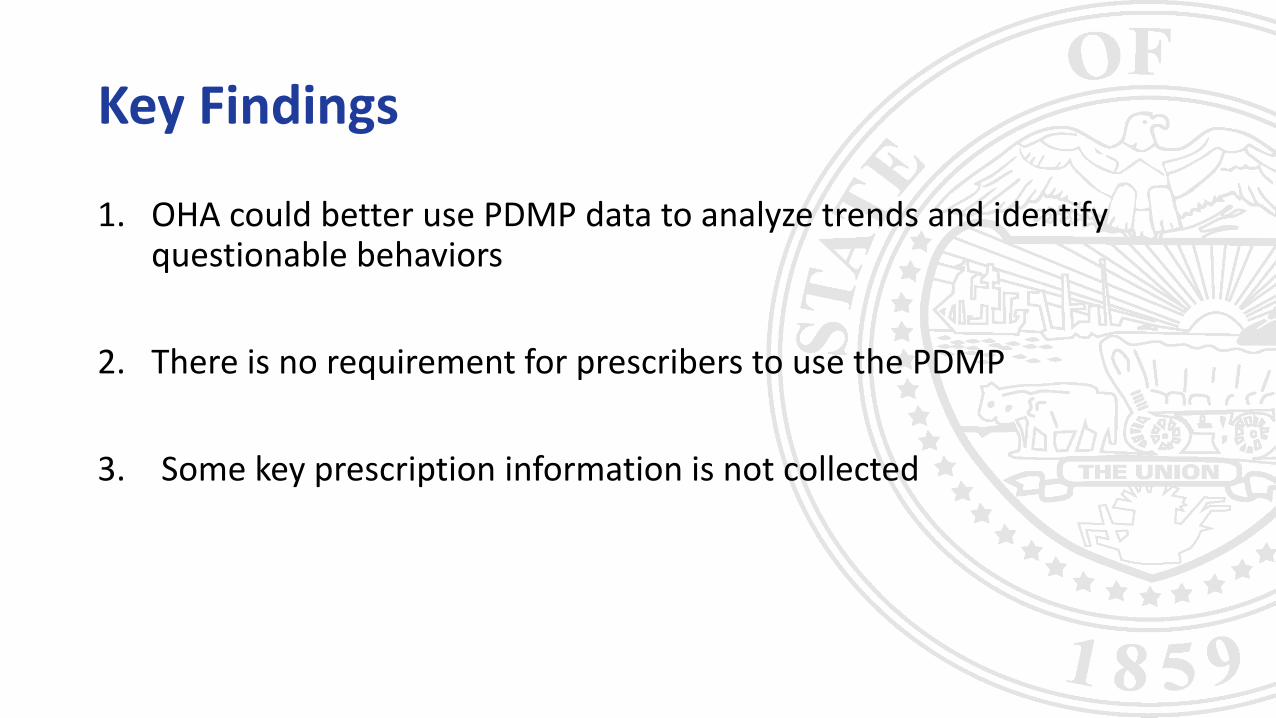
Key Findings
1. OHA could better use PDMP data to analyze trends and identify questionable behaviors
2. There is no requirement for prescribers to use the PDMP
3. Some key prescription information is not collected
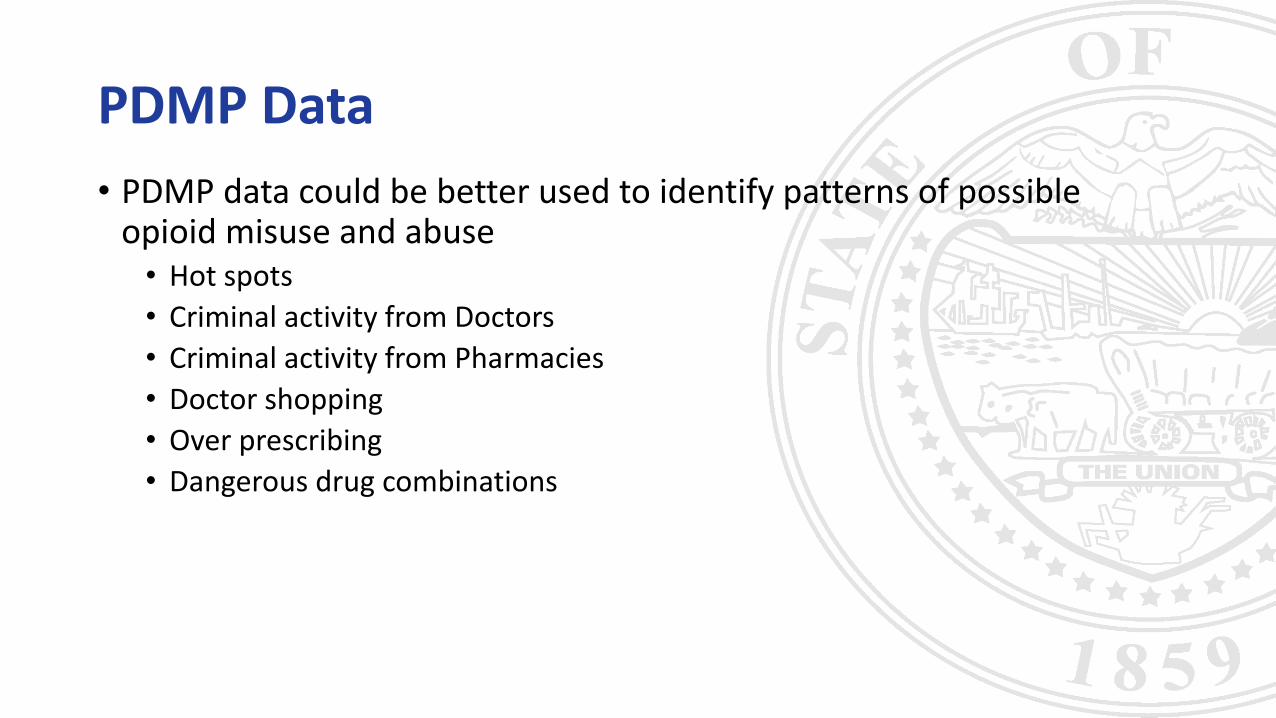
PDMP Data• PDMP data could be better used to identify patterns of possible
opioid misuse and abuse• Hot spots• Criminal activity from Doctors• Criminal activity from Pharmacies• Doctor shopping• Over prescribing• Dangerous drug combinations
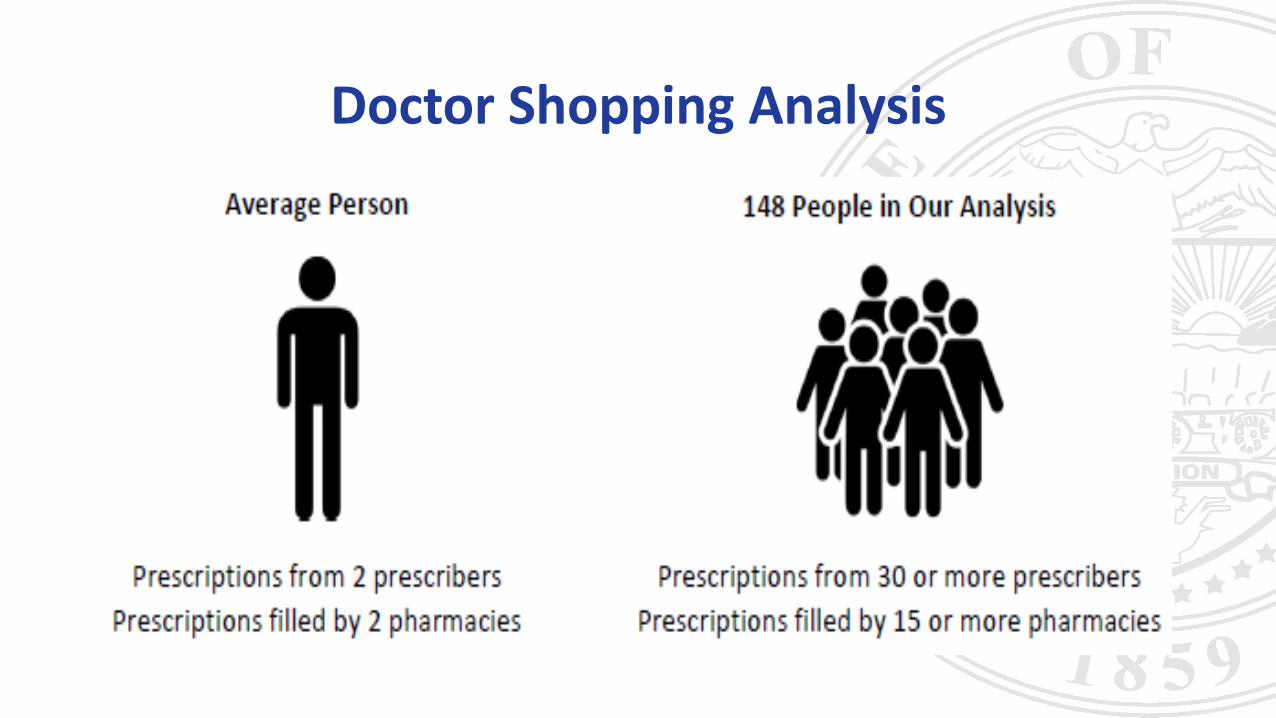
Doctor Shopping Analysis
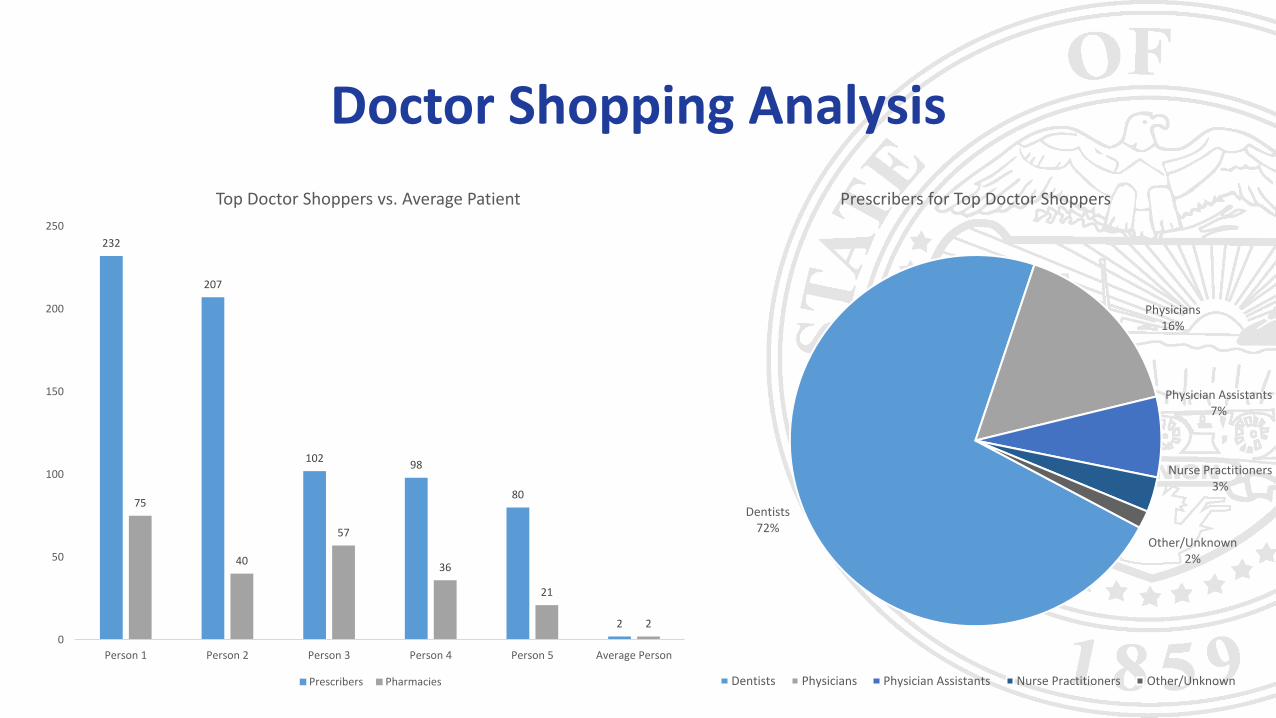
Doctor Shopping Analysis
232
207
102 98
80
2
75
40
57
36
21
20
50
100
150
200
250
Person 1 Person 2 Person 3 Person 4 Person 5 Average Person
Top Doctor Shoppers vs. Average Patient
Prescribers Pharmacies
Dentists72%
Physicians16%
Physician Assistants7%
Nurse Practitioners3%
Other/Unknown2%
Prescribers for Top Doctor Shoppers
Dentists Physicians Physician Assistants Nurse Practitioners Other/Unknown
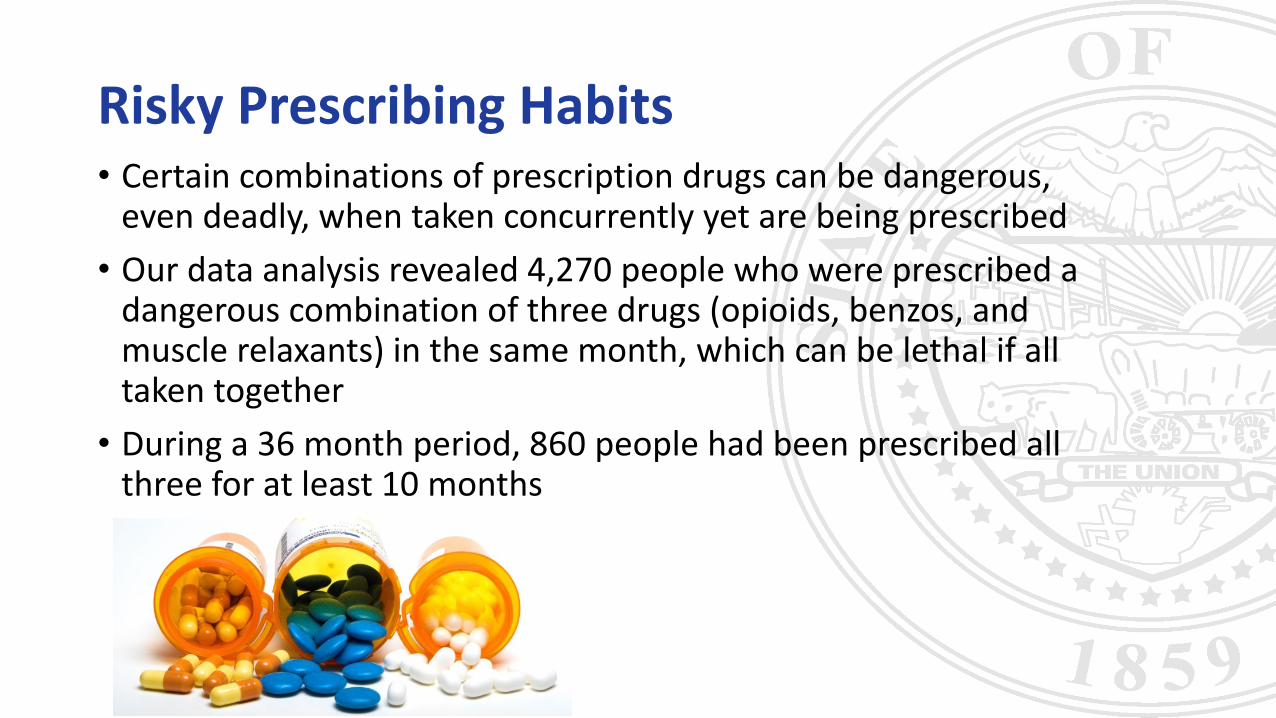
Risky Prescribing Habits• Certain combinations of prescription drugs can be dangerous,
even deadly, when taken concurrently yet are being prescribed• Our data analysis revealed 4,270 people who were prescribed a
dangerous combination of three drugs (opioids, benzos, and muscle relaxants) in the same month, which can be lethal if all taken together
• During a 36 month period, 860 people had been prescribed all three for at least 10 months
Wrapping up in Real-Time
• Offline follow-up and networking welcomed
• Thank Biennial Planning Committee for Opportunity
• Thank session attendees for your time, on and off attention during our presentation, and especially for your service to the nation
• Auditors are needed now more than ever – Let’s go get it!


![Spilling the Gears [PIQUE]](https://img.dokumen.tips/doc/110x75/577ce0591a28ab9e78b31ec5/spilling-the-gears-pique.jpg)