Embed Size (px)
Citation preview

PreVent
- Study of the energy use at
Oy Prevex Ab
Simon Kula
Bachelor’s Thesis
Environmental Engineering
Vasa 2014

BACHELOR’S THESIS
Author: Simon Kula
Degree Programme: Environmental Engineering, Vaasa
Supervisors: Mats Borg, Novia University of Applied Sciences and Kim Westerlund,
Edupower Oy Ab
Title: PreVent – Study of the energy use at Oy Prevex Ab
_________________________________________________________________________
Date 20.8.2014 Number of pages 60 Appendices 27
_________________________________________________________________________
Summary
This thesis work is an energy audit, an analysis of the energy consumption with action
suggestions and profitability calculations, for the company Oy Prevex Ab. The energy
audit follows the general principles in executing an energy audit. The scope of the work is
limited to the facilities of the company and its heating systems, electrical systems and
water consumption. The production and its machinery are excluded from the audit. One of
the key factors in the energy audit is the district heat consumption. The company has high
peaks in district heat consumption and one main target is to investigate the reasons and the
possibility to limit these peaks.
The project started with collecting the overall consumption and then splitting it into
different processes by calculating and measuring the processes. The data was analysed and
based on the analysis action suggestions were presented. The profitability of the action
suggestions was calculated. Most focus was put on district heat consuming processes
within the company. The result of the energy audit is that cost and energy can be saved
with a reasonably low investment.
In conclusion, very significant saving possibilities have been identified and if the
suggested actions are carried out, the company will save a significant amount of costs.
These actions are believed to lower the high peaks in district heat consumption. In
addition, the energy audit project itself and the result from the project woke the interest in
energy-related questions and saving energy, within the company’s staff.
_________________________________________________________________________
Language: English Key words: energy audit, energy consumption, savings potential
_________________________________________________________________________

EXAMENSARBETE
Författare: Simon Kula
Utbildningsprogram och ort: Environmental Engineering, Vasa
Handledare: Mats Borg, Novia University of Applied Sciences och Kim Westerlund,
Edupower Oy Ab
Titel: PreVent – Study of the energy use at Oy Prevex Ab
_________________________________________________________________________
Datum 20.8.2014 Sidantal 60 Bilagor 27
_________________________________________________________________________
Abstrakt
Detta lärdomsprov är en energikartläggning, en analys av energiförbrukningen med
åtgärdsförslag och lönsamhetsberäkningar, för företaget Oy Prevex Ab.
Energikartläggningen följer de allmänna direktiven för genomförandet av en
energikartläggning. Omfattningen av arbetet är begränsad till företagets byggnader,
dess uppvärmningssystem, elsystem och vattenförbrukning. Produktionen och dess
maskiner är uteslutna ur kartläggningen. En av nyckelfaktorerna i
energikartläggningen är fjärrvärmeförbrukningen. Företaget har höga pikar i
fjärrvärmeförbrukningen och ett av de huvudsakliga målen är att undersöka orsakerna
och möjligheterna att utjämna dessa pikar.
Projektet startade med att samla in data över den övergripande förbrukningen och
därefter dela upp i olika processer genom att beräkna och mäta dessa processer. Data
analyserades och baserat på denna analys presenterades åtgärdsförslag.
Lönsamheten för dessa åtgärdsförslag beräknades. Mest tyngd sattes på de
fjärrvärmeförbrukande processerna inom företaget. Resultatet av
energikartläggningen är att både kostnad och energi kan sparas med rimlig
investering.
Sammanfattande har mycket betydande sparpotential blivit identifierad och om
åtgärdsförslagen förverkligas, kommer företaget att spara betydande kostnader.
Åtgärdsförlagen bedöms också sänka pikarna i fjärrvärmeförbrukningen. Ytterligare
har själva energikartläggningsprojektet och dess resultat väckt intresse för
energirelaterade frågor och att spara energi, hos företagets anställda.
_________________________________________________________________________
Språk: Engelska Nyckelord: energikartläggning, energianvändning, sparpotential
_________________________________________________________________________

OPINNÄYTETYÖ
Tekijä: Simon Kula
Koulutusohjelma ja paikkakunta: Environmental Engineering, Vaasa
Ohjaajat: Mats Borg, Novia University of Applied Sciences ja Kim Westerlund,
Edupower Oy Ab
Nimike: PreVent – Study of the energy use at Oy Prevex Ab
_________________________________________________________________________
Päivämäärä 20.8.2014 Sivumäärä 60 Liitteet 27
_________________________________________________________________________
Tiivistelmä
Tämä opinnäytetyö on energiakartoitus, analyysi energiakulutuksesta toimenpide-
ehdotuksilla ja kannattavuuslaskelmilla, yhtiölle Oy Prevex Ab. Energiakartoitus seuraa
yleisiä ohjeita energiakartoituksen toteuttamisesta. Työn laajuus on rajoitettu yhtiön
rakennuksiin, niiden lämmitysjärjestelmiin, sähköjärjestelmiin ja veden kulutukseen.
Tuotanto ja sen konekanta ovat erotettuja kartoituksesta. Yksi avaintekijöistä
kartoituksessa on kaukolämmön kulutus. Yhtiöllä on korkeita kaukolämmön
kulutuspiikkejä ja yksi ensisijaisista tavoitteista on tutkia syyt ja mahdollisuudet
tasoittaa nämä piikit.
Projekti alkoi keräämällä kokonaisvaltaisen kulutuksen ja seuraavaksi jakamalla
prosesseja osiin laskemalla tai mittaamalla niitä. Dataa analysoitiin ja analysoinnin
perusteella esitettiin toimenpide-ehdotuksia . Ehdotettujen toimenpiteiden
kannattavuus laskettiin. Yhtiön kaukolämpöä kuluttaviin prosesseihin panostettiin
eniten. Energiakartoituksen tulos näyttää, että sekä kuluja että energiaa voidaan
säästää kohtuullisella sijoituksella.
Yhteenvetona hyvin merkittäviä säästömahdollisuuksia on tunnistettu ja jos ehdotetut
toimenpiteet toteutetaan, yhtiö tulee säästämään merkittävä määrä kustannuksia.
Toimenpideehdotukset uskotaan myös laskevan kaukolämpökulutuspiikit. Lisäksi itse
energiakartoitusprojekti ja sen tulokset ovat herättäneet kiinnostusta
energiakysymyksiin ja säästämään energiaa yhtiön työntekijöiden keskuudessa.
_________________________________________________________________________
Kieli: Englanti Avainsanat: energiakartoitus, energiankulutus, säästöpotentiaali
_________________________________________________________________________
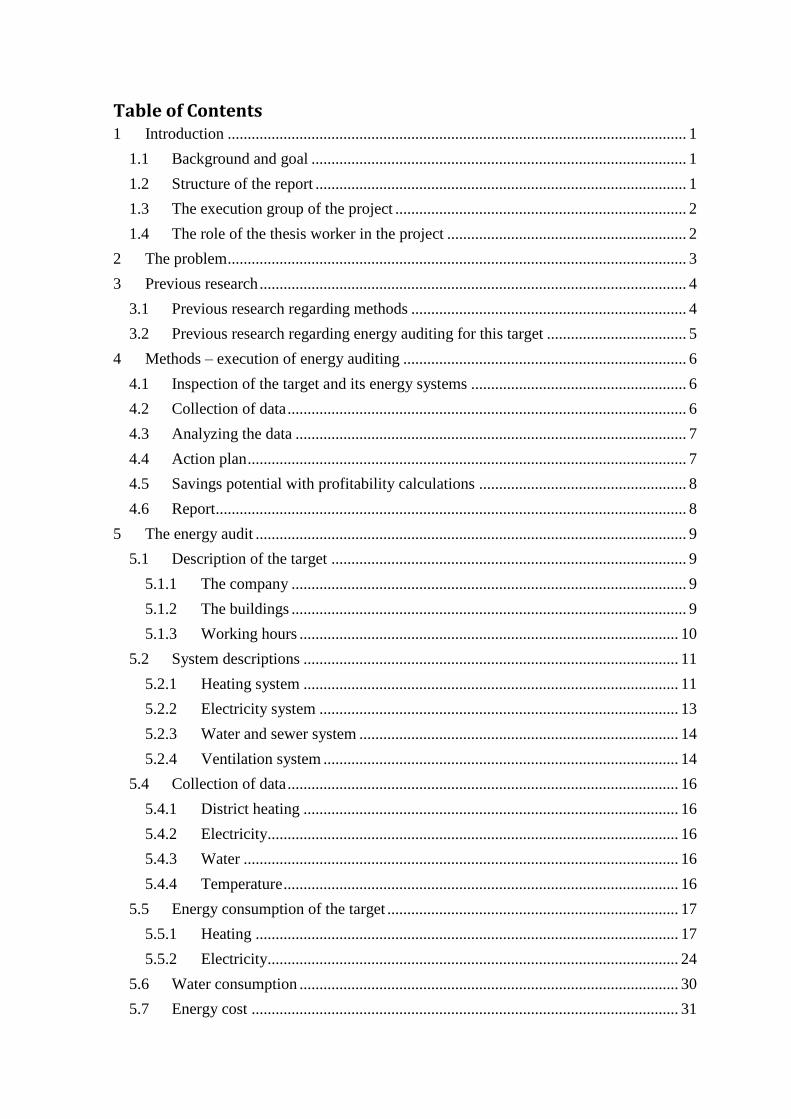
Table of Contents 1 Introduction ................................................................................................................... 1
1.1 Background and goal .............................................................................................. 1
1.2 Structure of the report ............................................................................................. 1
1.3 The execution group of the project ......................................................................... 2
1.4 The role of the thesis worker in the project ............................................................ 2
2 The problem ................................................................................................................... 3
3 Previous research ........................................................................................................... 4
3.1 Previous research regarding methods ..................................................................... 4
3.2 Previous research regarding energy auditing for this target ................................... 5
4 Methods – execution of energy auditing ....................................................................... 6
4.1 Inspection of the target and its energy systems ...................................................... 6
4.2 Collection of data .................................................................................................... 6
4.3 Analyzing the data .................................................................................................. 7
4.4 Action plan .............................................................................................................. 7
4.5 Savings potential with profitability calculations .................................................... 8
4.6 Report ...................................................................................................................... 8
5 The energy audit ............................................................................................................ 9
5.1 Description of the target ......................................................................................... 9
5.1.1 The company ................................................................................................... 9
5.1.2 The buildings ................................................................................................... 9
5.1.3 Working hours ............................................................................................... 10
5.2 System descriptions .............................................................................................. 11
5.2.1 Heating system .............................................................................................. 11
5.2.2 Electricity system .......................................................................................... 13
5.2.3 Water and sewer system ................................................................................ 14
5.2.4 Ventilation system ......................................................................................... 14
5.4 Collection of data .................................................................................................. 16
5.4.1 District heating .............................................................................................. 16
5.4.2 Electricity....................................................................................................... 16
5.4.3 Water ............................................................................................................. 16
5.4.4 Temperature ................................................................................................... 16
5.5 Energy consumption of the target ......................................................................... 17
5.5.1 Heating .......................................................................................................... 17
5.5.2 Electricity....................................................................................................... 24
5.6 Water consumption ............................................................................................... 30
5.7 Energy cost ........................................................................................................... 31

5.7.1 Heating systems ............................................................................................. 31
5.7.2 Electricity....................................................................................................... 31
5.8 Water cost ............................................................................................................. 32
5.9 Analysis and action suggestions ........................................................................... 32
5.9.1 Heating .......................................................................................................... 32
5.9.2 Electricity systems ......................................................................................... 37
5.9.3 Water system ................................................................................................. 38
5.10 Profitability calculations ................................................................................... 39
5.10.1 Savings calculations ...................................................................................... 39
5.10.2 Investment costs and profitability calculations ............................................. 52
6 Conclusion ................................................................................................................... 56
6.1 Conclusions about action suggestions .................................................................. 56
6.2 Further research .................................................................................................... 59
7 References ................................................................................................................... 60

Appendix Table of Contents
Appendix 1 - Savings potential list by sector
Appendix 2 - The monthly and annual district heat consumption data for the years 2010 -
2013
Appendix 3 - The district heat power data of the specific periods
Appendix 4 - The electricity consumption data of the 3 heat pumps
Appendix 5 - The monthly and annual electricity consumption data of the years 2011 –
2013
Appendix 6 - The water consumption for the years 2011 - 2013
Appendix 7 - The annual district heat costs for the years 2010 – 2013 and costs divided in
to billing periods
Appendix 8 - The annual and monthly electricity costs and electricity cost for the
different operations
Appendix 9 - The water consumption costs
Appendix 10 - District heat basic charge savings
Appendix 11 - Control curve
Appendix 12 - Installing a door in the warehouse in building D
Appendix 13 - Installing an air curtain at the doors in the warehouse in building D
Appendix 14 - Utilizing heat from air compressor for heating building A
Appendix 15 - Utilizing the air compressor heat for heating “slussen”
Appendix 16 - Lowering the temperature of the heat pumps
Appendix 17 - Replacing existing fluorescent lights with LED-lights in all buildings
Appendix 18 - The pilot project – replacing lights at a specific area
Appendix 19 - Installing motion sensor
Appendix 20 - Replacing existing socket boxes for car engine heating
Appendix 21 - Control curve – payback
Appendix 22 - Payback for installing a door in the warehouse in building D
Appendix 23 - Payback for installing air curtain in the warehouse in building D
Appendix 24 - Payback for replacing existing fluorescent lights in all buildings
Appendix 25 - Payback for the pilot project
Appendix 26 - Payback for installing motion sensor
Appendix 27 - Payback for replacing existing socket boxes with socket boxes with timers

1
1 Introduction
1.1 Background and goal
Oy Prevex Ab (Prevex) is a member of the KWH-Group, founded in 1955, and one of the
oldest plastic working companies in Finland. The company is a leading supplier of siphons
for kitchens and bathrooms in Europe.
Edupower Oy Ab (EduPower) is an innovative company located in the energy cluster of
Vaasa with operations in energy and company development. A big part of the operations
are export. EduPower works in cooperation with industry and higher education for
example with operational development thesis work and expert tasks in energy economics.
Prevex was contacted by EduPower in search of a thesis project. Discussions about an
energy audit took place and based on the discussions a project was offered by EduPower to
which Prevex responded positively. A kick-off meeting took place where the roles in the
project were decided. The goal of the project is to create/carry out an energy audit
including an action plan with profitability calculations. A further goal is to lower the
specific energy consumption of the company.
This energy audit follows the general principles in executing an energy audit, but is limited
to some extent. The whole energy consumption of the company is analysed and split down,
by calculating and measuring some specific energy consuming activities decided by the
customer and the executers of the energy audit. Since this is a thesis work, the frames of
the project needed to be set. Only a few of the processes in the company are taken into
consideration, most focus is put on the consumption of the facilities, achieving useful
energy savings and cost savings results. The production machinery in the company is not
taken into consideration.
1.2 Structure of the report
Chapter 2 gives further information of the project. In this chapter the problem in the project
is presented.
Chapter 3 presents previous research done in the field and also research done within the
company.
Chapter 4 presents the methods of executing an energy audit. It explains the energy audit
on a general level.
Chapter 5 presents the executed energy audit, done by the thesis worker, in detail.
Chapter 6 presents the conclusions made by the thesis worker, of the energy audit project.
Chapter 7 presents the references to this project.

2
1.3 The execution group of the project
The execution group of the project consists of the thesis worker, the contact person of the
customer and the support team of EduPower. On the customer side a great number of
persons including the contact person and others have been of tremendous help with
distributing material and otherwise supporting the thesis worker.
1.4 The role of the thesis worker in the project
The role of the thesis worker is the main executor of the project. Novia University of
Applied Sciences provides the formal advisor from their side as always.

3
2 The problem
The main problem is that at the company the peaks in district heat power exceed the power
limit set by the district heat distributor, Nykarleby Kraftverk. During discussions it was
found out that the local energy distributor has made a demand on Prevex to lower their
peak power in district heat or the basic charge will rise. Overall the energy consumption at
the company is pretty high, and therefore also the bills are high. Because of this the energy
audit project was created. The energy auditor’s job is to find out reasons why the peaks are
so high, collect the energy consumption data, like electricity, district heat and water
consumption data, analyse the consumption, make action suggestions on how to save
energy and costs and calculate the profitability of these actions.
The general problem with energy consumption in buildings is that the consumers are
unaware of or simply don’t care about their consumption. In households the consumers pay
their bills without thinking about the opportunities of saving energy and costs. Concerning
industrial buildings and their consumption, the companies prioritise other projects before
energy saving projects. The problem is that the consumers do not see the opportunities in
saving both energy and money. Even if the savings figures are put in front of them, they
still might not prioritise their investments in saving energy. Another problem concerning
company consumers is the lack of resources to put on energy savings projects.

4
3 Previous research
3.1 Previous research regarding methods
The methodology of carrying out energy audits has been developed on a national and EU
level. When the focus on energy saving and energy auditing has strengthened, the need to
standardize methods was realized. A number of different auditing models have been
developed and implemented in a multitude of audits spanning over a wide variety of
business sectors.
For example Motiva has created several models for energy auditing. Motiva has a model
for Industrial energy audit. Other models are Building Energy Inspection, Building Energy
Audit, Industrial Energy Analysis, Process Industry Energy Analysis, Power Plant Energy
Analysis, District Heating Energy Audit, Post-acceptance Audit, Follow-up Energy Audit,
and Energy Audit for the Logistic Chain. The market in energy auditing is very strong at
the moment and there are many companies who execute them due to this. On Motiva’s
web-page a list of qualified energy auditors can be found. Motiva also organizes basic and
follow-up training for energy auditors. /1/ /2/
Motiva has also listed savings potential for SME companies based on the different energy
audits done in Finland.
“SME energy use below 10 GWh/a
Between 1992-2009 altogether 539 facilities in the SME sector were audited, whose joint
annual overall energy use is over 1 770 GWh. The saving potentials of heating energy and
fuel in these facilities has on average been 24% (c 226 GWh/a), the saving potentials of
electrical energy about 8% (c 65 GWh/a) and the saving potentials of water about 12% (c
0.6 million m3).
SME energy use between 10-70 GWh/a
Between 1992-2009 altogether 201 facilities in the SME sector were audited, whose joint
annual overall energy use is over 5 000 GWh. The saving potentials of heating energy and
fuel in these facilities has on average been 21% (c 586 GWh/a), the saving potentials of
electricity about 6% (c 135 GWh/a) and the saving potentials of water about 7% (c 2.3
million m3).
SME energy use between 70-500 GWh/a
Between 1992-2009 only 33 of these facilities in the SME sector were audited. The
emphasis of the energy audits in this category of the SME sector is for the most part
clearly under 70 GWh a year concerning the facilities’ energy consumption. The saving
potentials of heating energy and fuel in these facilities has on average been 12% (c 450
GWh/a), the saving potentials of electrical energy about 4% (c 51 GWh/a) and the saving
potentials of water about 10% (c 1.5 million m3).” /3/
There is also a savings potential list by sector. The list is presented in Appendix 1.

5
3.2 Previous research regarding energy auditing for this target
Before the current project one other energy audit project has been done at Prevex. The
previous audit took place between 29.9.2006 and 30.6.2007 and was executed by WSP
Environmental Oy. During this period oil and direct electricity were used as heating
sources. The company has not taken action on most of the energy saving suggestions and
therefore some of the suggestions have been analyzed and developed in this report.

6
4 Methods – execution of energy auditing
This chapter explains the steps in an energy audit.
Energy auditing is an investigation on where, when, how and why energy is used in a
facility, to identify the opportunities to improve efficiency. The main goal of an energy
audit is to suggest energy saving actions and present their savings potential, with
profitability calculations. “An energy audit, therefore, is a detailed examination of a
facility’s energy uses and costs that generates recommendations to reduce those uses and
costs by implementing equipment and operational changes.” /4/
The execution of an energy audit is done through cooperation between field experts and the
customer. The customer appoints a contact person from among its staff to support the
energy auditor.
4.1 Inspection of the target and its energy systems
The first step in an energy audit is to perform a physical assessment of the facility and
investigate the energy systems used. The first step is getting data on building sizes, age of
the buildings and number of people living/working in the buildings. Then, perform an
inspection of the buildings’ key elements, like construction details and making an
inventory on heating and cooling systems, like what heating system is used at the company
and how the heat is distributed in the facility. What electricity system is used in the facility,
where it is bought from, who is the distributor and how is it distributed within the facility.
Who is the distributor of water and who handles the purification of the sewer water. /5/
4.2 Collection of data
The next step in an energy audit is to perform an evaluation on preliminary energy use.
This is done through examining utility data, electricity consumption, energy consumption
of heating system and water consumption. It is advisable that the energy auditor collects
and reviews at least the two past years, preferably three years, of utility data to be able to
account for seasonal variations and especially the pattern of energy consumption. The most
common method of collecting the data is to read the bills of purchased energy to get an
overview. The data from bills are often on a monthly basis, to get more specific data there
are different alternatives. If the local energy provider has online services it is also possible
to get the information from there. For example district heat and electric companies often
have online services where you can log in and get statistics of the consumption. Depending
on the service it is possible to get data on an hourly, daily, monthly or annual basis.
A further step is to investigate energy consuming activities, like lighting, ventilation,
production (in industrial buildings) which are either measured or calculated. To get exact
data on for example some operations within the building, like the amount of energy a part
of the lighting consumes, measuring is required. The data is then exported using software.
The customer should inform the energy auditor about previous energy audits if there are
any. /6/

7
4.3 Analyzing the data
After collecting the data the analysis of the energy and cost begins. From the data gotten, it
is possible to make the first conclusions. Using spreadsheets for analysing the data is very
common. The spreadsheets account for variation in time of day and season and made in
hourly, daily, monthly and annual forms, for easier analysis. The heating energy is often
compared with the outside temperature to be able to account for the seasonal changes, to
see if there are changes in energy consumption due to changes in outside temperature.
The calculated or measured consumption of the different activities within the building is
then analysed. From the calculations on the different activities it is easy to see which of
them are consuming the most energy. This analysis can also be done with measuring
devises.
From the data it is possible to make the first conclusions. With the help of diagrams it is
easy to, for example, identify the top levels of the consumption. To lower the top-levels of
the consumption can save costs. By analysing this data it is only possible to make
assumptions on which activities use the most energy.
With real-time measuring it is possible to analyse the consumption even further. By
measuring the energy of different actions within the company it is easy to find out which
activities consume more than others and which activities to focus on. /6/
4.4 Action plan
Based on the analysis different actions for saving energy are investigated. Questions like,
“what can be done to save energy?”, “how do we do it?” and “what are the best solutions?”
get answers. These actions can be from changing working routines, optimizing heating
systems to replacing old devices. The goal in an energy audit is to save energy and without
actions it is impossible to save energy. The action plan serves as a guideline for the
customer in their path to lower energy consumption. The action suggestions are prioritised
according to profitability.
Some easy non-costing actions can be to lower the indoor temperature for saving heating
costs. Regarding electricity e.g. not leaving any devices, like TVs or computers, on standby
is an easy non-costing action. Checking the running hours of the ventilation systems will
also save electricity costs.
Some small actions that have some costs are for example replacing old fridges, old
washing machines or dish washing machines, in households, with new low energy
consuming ones. Checking the condition and cleaning the ventilation systems save
electricity costs. Maintenance of the equipment or machines in industrial facilities is
important both for functional reasons and energy reasons. A well functioning machine for
example consumes less energy than a poorly functioning machine.
More expensive investments like replacing the heating systems are also often presented,
especially if the current heating system is oil heating or direct electricity. /7/

8
4.5 Savings potential with profitability calculations
Savings potentials on the different action suggestions are calculated with investment costs
and profitability calculations. There are several different profitability calculation methods,
present value, future value, equivalent annual cost, accounting rate of return, internal rate
of return and the payback method. In this report, only the payback method is used.
The payback method has two different methods:
Simple payback, which refers to the time in years required to pay back an investment. For
example an investment cost of 2000 € which saves 500 €/year has a payback time of 4
years.
Payback considering interest is the payback time for the investment cost with adding an
interest to the annual savings, present value. An example of the Payback considering
interest with 10% interest is presented in Table 1.
Table 1 Payback method considering interest
Year 0 1 2 3 4 5 6 7
Savings (€) -2000 500 500 500 500 500 500 500
Present
value (€) -2000 454 413 376 342 310 282 257
Accumulated
value (€) -2000 -1546 -1133 -757 -415 -105 177 434
The table shows that the investment cost with an interest of 10% would be paid back in the
6th
year after investing. /8/
4.6 Report
The general rule in projects is that what is not documented does not exist. The end goal is
to present the findings resulting from the inspection of the target in a report. The report
also serves as a guide for the customer in the decision making on which actions to take in
order to save energy and costs. “Any audit report should provide enough information to
allow you to make informed decisions about next steps to meet your energy savings and
financial goals” /6/

9
5 The energy audit
The current energy audit project, named PreVent, was executed during the period
10.9.2013 – 10.4.2014. Some of the data in this report is confidential, like total energy
consumption, energy prices and energy costs. The data is presented in appendices. For the
same reason the cost savings calculations are presented in appendices.
5.1 Description of the target
A description of the company, its buildings and its different systems like heating systems
and electricity systems is presented in this chapter.
5.1.1 The company
Prevex was founded, as mentioned, in 1955 and has made siphons for kitchens and
bathrooms since 1971. The company is a member of the KWH Group and is one of the
leading suppliers of siphons in Europe. They invest every year significantly in R&D and
constantly reduce the environmental impact of their products by minimizing the steps in
their production process. /9/
5.1.2 The buildings
Prevex operates in 5 buildings of which one is an office building, presented in Figure 1
with naming for all the different areas within the buildings.
Figure 1. Overview of the factory area.

10
A-building
The A-building, which is a production-hall, was built in 1974 and extended the first time in
1989 and the second time in 1994. There are also office, social and dressing rooms in the
building. The building has a small warehouse in the north end and a workshop in the south
end.
B-building
The B-building is a warehouse building and was built in 1979. The building was extended
in 2008. There is a small office section in the north end of the building and in the south end
a space for charging the forklifts.
C-building
The C-building was built in 1989 and extended in 1999. The building has an assembly area
divided into one big room, called assembly hall, and 3 small rooms, called the welding
room, the Fluid-bag room and the screw room. There is also a warehouse in this building
and a social area with a kitchen and dressing rooms.
D-building
The D-building is a combined production hall and warehouse building. There are office,
conference and dressing rooms in the building. The building was built in 1998 and
extended in 2002.
The area of the buildings
The area of the different company buildings is presented in Table 2.
Table 2. Area of the buildings.
Building A B C D Office
Area 3035 m2
3083 m2
2482 m2
4821 m2
195 m2
The total area of all the buildings is 13616 m2.
5.1.3 Working hours
The working hours in the different buildings are presented below. The workers work in
different shifts depending on what job description the worker has. There are workers who
work only during day-time, some work in two shifts, some work in three shifts and some
work in 5 shifts.
A-building
Production: Sunday 22:00 – Friday 22:00
Workshop: Monday – Friday 07:00 – 15:30

11
B-building
Warehouse: Monday – Friday 07:00 – 15:30
Office: Monday – Friday 08:00 – 16:00
C-building
Assembly-hall: Monday – Friday 06:00 – 22:00 (07:00 – 15:30)
Warehouse: Monday – Friday 07:00 – 15:30
D-building
Production: 24/7
Office workers have flexible eight hour work days.
5.2 System descriptions
The different systems used at Prevex are presented in this chapter, like heating system,
electricity system, water and sewer system and ventilation system. There are three main
heat sources used at Prevex, district heating, direct electricity and air to air heat pumps.
5.2.1 Heating system
In September 2009 Prevex was connected to the district heat system owned by Nykarleby
Kraftverk. Before the installation oil heating was used. Besides the district heat, direct
electricity and heat pumps are used, and heat from the processes is utilized to heat the
production areas. Heat from the compressor in building D is used to heat the warehouse,
while the compressors in building A only heat the room they are located in. Heat from the
cooling compressors is distributed to the exhaust air to heat buildings A and D.
District heating
The district heating plant is dimensioned for a large-scale production and distribution
under controlled forms. The plant is a multi-fuel plant and the heat is produced with solid
bio-fuel, like peat and wood chips. Heavy oil is used only during colder weather and
during maintenance of the plant. The district heat network is 7.3 km long and the plant
provides heat to 60 different customers, of which most are apartment buildings and
buildings owned by the municipality. /10/
The maximum power of the district heat at Prevex is set to 300 kW. The agreement from
Nykarleby Kraftverk’s side ends at the heat exchanger and the strainer. There is also a
consumption meter that Nykarleby Kraftverk owns. The installation of the unit, which is
owned by Prevex, was done by the company Ouman.
Direct electricity
There are electric radiators in every building, mainly located in social and office rooms.

12
Heat pumps
There are 10 heat pumps installed in both the assembly area and social area of the C-
building. Specifics about the heat pumps are listed in Table 3.
There are six Mitsubishi G-Inverter MSZ-GE35VAH heat pumps installed in the assembly
hall that are all controlled with one remote control, which means that the workers are not
supposed to control the heat pumps separately. Both the welding room and the Fluid-bag
room have one Toshiba RAS-B10GKVP-E installed. The kitchen has two Mitsubishi
Kirigamine MSZ-FD35VABH heat pumps installed.
Table 3. Information on the heat pumps
Model Unit
Mitsubishi
MSZ-
GE35VAH
Toshiba RAS-
B10GKVP-E
Mitsubishi
MSZ-
FD35VABH
Heating power kW 1.6 - 5.3 (4.0) 5.8 (max) 1.3 - 6.6 (4.0)
Outside temp range ˚C (-)25 - (+)24 (-)25 - (+)24 (-)25 - (+)24
Cooling power kW 1.1 - 4.0 (3.5) 3.5 (max) 0.8 - 4.0 (3.5)
Outside temp range ˚C (-)10 - (+)46 (+)5 - (+)43 (-)10 - (+)46
Power input heating kW 0.955 0.71 0.84
Power input cooling kW 0.865 0.55 0.835
Indoor unit dimensions mm 295 x 798 x 232 250 x 790 x 215 752 x 897 x 592
Outdoor unit dimensions mm 550 x 800 x 285 550 x 780 x 290 550 x 800 x 285
Air flow indoor unit
heating m3/h 246 - 690 632 (max) 282 - 750
Air flow indoor unit
cooling m3/h 246 - 762 565 (max) 282 - 750
Air flow outdoor unit
heating m3/h 2088
Air flow outdoor unit
cooling m3/h 2178
/11/ /12/ /13/
Distribution within the buildings
Buildings A and D are heated with district heat and excess heat from the machines.
The district heat is distributed in buildings A and D to the air supply and to circulated heat
fans through water circulated heat. During summer times the incoming air of the same
buildings is cooled. The cooling is needed because otherwise there may be condensing
issues with the tools in the machines.
During production, buildings A and D are partly heated with excess heat from the cooling
compressors as well as from the plastic moulding machines, distributed via the ventilation
system.
The heat distributed via the ventilation system is transferred via the heat recovery system.
Buildings C and B are heated with direct electricity and air to air heat pumps. During
summer times, the heat pumps cool the building.
The office building is heated with electric radiators and exhaust air heat pumps.

13
5.2.2 Electricity system
The electricity is bought from Vattenfall and distributed by Nykarleby Kraftverk.
The factory is connected to the 20 kV network. The transfer fee is divided in day/night
electricity and is based on the power. The sales tariff is set according to the price of
Nordpool Spot Finland.
Lighting
For high bay lighting the company uses fluorescent lights and floodlights. The lights are
presented in Table 4.
Fluorescent lights:
Table 4. Specifics on the lights used at the company.
Model
Specralux
(warm/cold) Airam Treston Philips
Power 58/58 W 58 W 36 W 49 W
luminous flux 5200/5000 lm - 3350 lm -
Length 1500/1500 mm 1500 mm 1200 mm 1500 mm
Flood lights:
Two types, 250 W and 400 W
The smaller fluorescent lights are not taken into consideration in this report because they
are located in office areas and the lighting investigation is limited to the factory side of the
company. The electricity consumption of the lighting has been calculated in chapter 5.4.2.
Air compressors
Compressed air is produced by three different air compressors. Two of them are located in
building A in a separate room and one is located in the warehouse of building D. The
models, their power and pressure are listed below.
Building A:
Kaeser BSD 72 (37 kW, 7-8 bar)
Kaeser AS 44 (30 kW, 7-8 bar)
Building D:
Kaeser ASD 47T (25 kW, 7-8 bar)
The Kaeser BSD 72 air compressor in building A is used the most and the Kaeser ASD
47T air compressor in building D and the Kaeser AS 44 air compressor in building A are
used as back-up compressors at times when production requires it. The compressor in

14
building D is also used to heat the warehouse and the heat from the two compressors in
building A is not utilized but distributed outside and to the cold room they are located in.
The running hours and consumption of the air compressors are calculated.
Socket boxes for heating the car engines
On the parking lot there are 33 socket boxes for heating car engines. The boxes are pretty
old and they are controlled from the electrical switchboard with timers. During inspection
the running hours were checked. The running hours for the boxes are 04:00 – 07:30, 10:00
– 18:00 and 20:00 – 22:30.
5.2.3 Water and sewer system
Prevex is connected to the water pipe system owned by Nykarleby Kraftverk. Purification
of the waste water is done by the water treatment plant in Jakobstad.
There are three meters measuring the water consumption at the company. One is located in
the office building, one in building C and one in building A. The meter in building A is
read every quarter of a year and the two other meters are read very seldom, when the
owner of the water pipe system has time to do it.
5.2.4 Ventilation system
In building A there are two air supply units, one for the production and warehouse area and
one for the workshop. The incoming air is heated by utilizing the heat produced by the
cooling compressors. For the production area there are two exhaust fans, one for the
machines and one for the building. For the workshop there is one exhaust fan. The
ventilation system for the production area is running during production when the cooling
compressors are running. The ventilation system in the workshop is running according to
the working hours.
There is one small air supply/exhaust unit in building B for the office area. The unit runs
during office hours.
In building C there are two units, one for the assembly hall, the welding room, the
Fluidbag room and the screw room and one for the social area and the kitchen. In this
building there is one supply fan and one exhaust fan for each unit. The running hours of
these units are presented in Table 5.
In the north part of building D there are two air supply units and one separate exhaust unit.
One air supply unit is for the production area and one is for the social and the office rooms.
The exhaust unit is for the production area of the building. The air is heated and cooled
with district heat. In addition to the exhaust unit there are two exhaust fans for the
machines and one exhaust fan for the social and office rooms. In the south part of the
building there are two air supply units, one for the production area and warehouse and one
for the social and office rooms. There is one exhaust fan for the production area, one for
the machines, one for the technical area, one for the transformer and one for the social and
office rooms. The ventilation system in building D is running all the time. The models and
the running hours of the units are presented in Table 5.

15
Many of the ventilation units have been renewed recently. The ventilation system in the
production and warehouse area of building A was installed in 1986 and has not been
renewed since, but the workshop ventilation system in the same building was renewed in
2013. The ventilation system in the office area in building B was installed in 2013. Before,
there was no ventilation in the office area. The system in building C was renewed in 2013.
The ventilation system in the south production area in building D was installed in 2008.
Before 2008 the ventilation system in the north end of the building was used for the whole
building. The ventilation systems all have heat recovery.
Table 5. Models and running hours of the ventilation units
Building Area Type Model Running hours
A Workshop Air supply unit
Systemair
DVCompact 20
Monday –
Friday 07:00 –
16:00
A Production Air supply unit Koja Heli-4
Sunday 21:00 –
Friday 22:00
B Office Air supply unit
Deekax DIVK
300-D
Monday –
Friday 07:00 –
16:00
C
Social rooms &
Kitchen Air supply unit
Systemair
Topvex TX-06
Monday –
Friday 05:00 –
22:00
C
Assembly hall +
3 rooms Air supply unit
Systemair
DVCompact 20
Monday –
Friday 05:00 –
22:00 half-
speed
22:00 – 05:00
D
North
production Air supply unit
Mastervent
WUDA160MJ/4-
8
Monday 0:00 –
Friday 23:59
full speed
Saturday 0:00 –
Sunday 23:59
half speed
D
Social rooms &
office rooms Air supply unit
Mastervent
UDA90SZ/4-8
06:30 – 17:00
full speed
17:00 – 06:30
half speed
D
North
production
Air exhaust
unit
Mastervent
WUDA100LJ/4-
8
Monday 0:00 –
Saturday 0:00
full speed
Saturday 0:00 –
Monday 0:00
half speed

16
5.3 Collection of data
The data was collected through reading bills and through collecting data from online
services. Both Nykarleby Kraftverk and Vattenfall have online services. To log in to
Nykarleby Kraftverk’s online service is simple. A consumption location ID and a customer
number are needed, both of which can be found on the bills. From the website it is easy to
get both electricity and district heat consumption. The site also has tables with the
consumption compared to the temperature, and the data can be exported to spreadsheets.
/14/ /15/
To log in to Vattenfall’s online-service is a bit more difficult. On the website a registration
is required. The registration was done together with the chief of staff. This website has
more detailed data on the electricity consumption than the data from Nykarleby Kraftverk,
the former including daily consumption.
Measurements were also done on three of the heat pumps in the C-building to get
electricity consumption data.
5.3.1 District heating
The district heat consumption is collected through exporting data from Nykarleby
Kraftverk’s online service and through reading bills. The cost data is collected through
reading bills. The consumption on the online service differs a bit from the consumption on
the bills. /14/
The person responsible for district heating in Nykarleby Kraftverk was contacted to collect
power reports. The data was exported to spreadsheets and provided to the thesis worker by
Nykarleby Kraftverk. /16/
5.3.2 Electricity
The electricity consumption was also collected through reading bills and exporting data
from online services. In this case data was collected from both Vattenfall’s and Nykarleby
Kraftverk’s online service. In addition Prevex has made power reports which are also used
for collecting the data. The data in Nykarleby Kraftverk’s online service is not that detailed
since they are the distributor of the electricity. More detailed data was found in Vattenfall’s
online service. /14/ /15/
5.3.3 Water
The water consumption is collected through reading bills and by reading the meters in
building C and the office building.
5.3.4 Temperature
Since both district heat and electricity (heat pumps) consumption is very much in relation
to the outside temperature, temperature data was also collected. It is collected from
Nykarleby Kraftverk’s on-line service. The monthly and annual average temperature is
presented in Table 6. /14/

17
Table 6. Monthly average temperature in ˚C for the years 2010 - 2013
2010 2011 2012 2013
Jan -14 -7 -7 -6
Feb -13 -14 -9 -4
Mar -8 -5 -1 -8
Apr 1 2 1 2
Maj 8 7 8 13
Jun 10 13 12 16
Jul 17 15 13 17
Aug 13 13 12 16
Sep 8 11 10 11
Okt 3 3 3 5
Nov -4 2 2 2
Dec -12 0 -10 0
Annual 0.8 3.3 2.8 5.3
5.4 Energy consumption of the target
In an energy audit it is recommended to present consumption data from the past three
years. In this report, data from the years 2011, 2012 and 2013 are presented, unless
otherwise mentioned. The running hours of the different processes in the company are
calculated with 251 work days/year. The number of work days per year is different from
year to year, so it was decided to use the number of work days in 2013, which was 251
days. Weekends and holidays are not calculated in the work days per year. In building D
where production is running 24/7 the number of workdays is calculated with 24 h * 365
days. It was decided to count for all the days in the year. Since the number of days when
there is no production is so few, these days are negligible.
No separate energy consumption calculations have been made for the office building,
because the target of this energy audit was set to be on the factory buildings and the energy
consuming operations within these buildings. The office building is included in the total
energy consumption of the company, including electricity and water consumption.
5.4.1 Heating systems
District heating
Despite the recommendation of presenting consumption data from the past three years it
was decided it is relevant to show data from the beginning of 2010 since installation of the
district heat took place in September 2009. The data from 2009 is excluded because there
is data only from a few months and it can therefore not be compared to the other years. The
annual consumption for the years 2010 – 2013 and the monthly consumption for the year
2013, compared with the temperature, are presented in Diagram 1 and Diagram 2. Due to
confidentiality the charts are presented without axis scale for consumption data. The
district heat consumption data per year and month for the years 2010 - 2013 is presented in
a spreadsheet in Appendix 2.

18
Diagram 1. Annual district heat consumption for the years 2010 – 2013 compared with the outside
temperature
Diagram 2. Monthly district heat consumption of the year 2013 compared with the outside temperature
0
1
2
3
4
5
6
7
0
100
200
300
400
500
600
700
800
900
2010 2011 2012 2013
˚C
Measured consumption (MWh)
Temperature
-10
-5
0
5
10
15
20
0
20
40
60
80
100
120
140
160
jan feb mar apr may jun jul aug sep oct nov dec 2013
˚C
Consumption (MWh)
Temperature

19
The annual district heat consumption compared to the temperatures in the winter months,
October – March is also presented in Diagram 3.
Diagram 3. The annual district heat consumption for the years 2010 - 2013 compared with the winter
months’ outside temperature
The more detailed information collected from Nykarleby Kraftverk shows the changes in
power on an hourly basis. Because of the large amount of data, some specific periods have
been chosen and presented in Diagram 4, Diagram 5 and Diagram 6. The power shown in
the tables are compared to the outside temperature. The data of the power is, however, not
shown because of confidentiality. The power data of the specific periods is also presented
in a spreadsheet in Appendix 3.
The different periods are chosen because of the difference in how the district heat supply
changes from very low temperature to semi-low temperature. Also a chosen period from
each year is important in the analysis phase.
0
1
2
3
4
5
6
0
100
200
300
400
500
600
700
800
900
2010 2011 2012 2013
˚C
Measured consumption (MWh)
Temperature

20
Diagram 4. District heat power compared to the outside temperature for the period Monday 14.2.2011 –
Friday 18.2.2012
Diagram 5. District heat power compared to the outside temperature for the period Saturday 3.3.2012 –
Thursday 8.3.2012
-30
-25
-20
-15
-10
-5
0
0
50
100
150
200
250
300
350
400
450
14.2.2011 15.2.2011 16.2.2011 17.2.2011 18.2.2011
˚C
-12
-10
-8
-6
-4
-2
0
0
50
100
150
200
250
300
350
3.3.2012 4.3.2012 5.3.2012 6.3.2012 7.3.2012 8.3.2012
˚C

21
Diagram 6. District heat power compared to the outside temperature for the period Wednesday 13.3.2013 –
Tuesday 19.3.2013
The warehouse in building D
The warehouse in building D is heated and is therefore an area that consumes much district
heat, because of doors being open and cold air spreading in the building when loading and
unloading trucks. The consumption for heating the warehouse after the loading and
unloading of trucks is calculated. To make the consumption, cost and profitability
calculations more understandable the consumption calculations can be found in the savings
calculations chapter.
“Slussen”
The energy consumption of heating the small area between buildings A and B is also
calculated. This calculation can be found in its savings calculation.
Heat pumps
Three of the heat pumps in the assembly hall were measured, two on the east side of the
hall and one on the west side. The locations of the heat pumps in the assembly hall are
presented in Figure 2. In the picture the left side is the north side and the heat pumps
measured are marked with a red, purple and green dot. The daily data of the measurements
are presented in Diagram 7 and the hourly data of the measurements are presented in
Diagram 8,
Diagram 9 and Diagram 10. At which dates the different pumps are measured is presented
below. Pump 1 is located on the west side of the hall and pumps 2 and 3 are located on the
-18
-16
-14
-12
-10
-8
-6
-4
-2
0
0
50
100
150
200
250
300
350
13.3.2013 14.3.2013 15.3.2013 16.3.2013 17.3.2013 18.3.2013 19.3.2013
˚C

22
east side of the hall. A one-week-long period was measured for each pump. The
consumption data of the 3 heat pumps are presented in Appendix 4.
Figure 2. The locations of the heat pumps marked with coloured dots
The measuring periods:
Heat pump 1: 7.2.2014. 12:00 – 14.2.2014. 12:00
Heat pump 2: 14.2.2014. 12:00 – 21.2.2014. 12:00
Heat pump 3: 21.2.2014. 12:00 – 28.2.2014. 12:00
Diagram 7. Daily electricity consumption of all the heat pumps for the period 7.2.2014 - 28.2.2014
0
5
10
15
20
25
30
35
7/2
/20
14
8/2
/20
14
9/2
/20
14
10
/2/2
01
4
11
/2/2
01
4
12
/2/2
01
4
13
/2/2
01
4
14
/2/2
01
4
15
/2/2
01
4
16
/2/2
01
4
17
/2/2
01
4
18
/2/2
01
4
19
/2/2
01
4
20
/2/2
01
4
21
/2/2
01
4
22
/2/2
01
4
23
/2/2
01
4
24
/2/2
01
4
25
/2/2
01
4
26
/2/2
01
4
27
/2/2
01
4
28
/2/2
01
4
kWh
Electricity consumption (kWh)

23
Diagram 8. Hourly electricity consumption of heat pump 1 for the period 7.2.2014 – 14.2.2014
Diagram 9. Hourly electricity consumption of heat pump 1 for the period 14.2.2014 – 21.2.2014
Diagram 10. Hourly electricity consumption of heat pump 1 for the period 21.2.2014 – 28.2.2014
0
0.1
0.2
0.3
0.4
0.5
0.6
kWh
Heat pump 1 consumption (kWh)
0
0.2
0.4
0.6
0.8
1
1.2
kWh
Heat pump 2 consumption (kWh)
0
0.5
1
1.5
2
kWh
Heat pump 3 consumption (kWh)

24
The total consumption of the different pumps for their respective time periods is:
Heat pump 1: 64 kWh
Heat pump 2: 121 kWh
Heat pump 3: 229 kWh
5.4.2 Electricity systems
The data is divided into monthly and annual reports presented in Diagram 11, Diagram 12
and Diagram 13. The values of the consumption are not shown due to confidentiality. For
some reason the consumption of October/2011 was missing in the daily consumption table
on Vattenfall’s online service. The monthly and annual consumption data of the years 2011
- 2013 is presented in Appendix 5. The daily data is not presented due to large amount of
data.
Consumption Consumption growth Growth %
2011: 3942 MWh
2012: 4121 MWh 179 MWh 4.5 %
2013: 3658 MWh -463 MWh -11.2 %
Diagram 11. Annual consumption of the past three years
3400
3500
3600
3700
3800
3900
4000
4100
4200
2011 2012 2013
Consumption (MWh)

25
Diagram 12. Monthly electricity consumption of the year 2013
Diagram 13. Daily electricity consumption of the years 2011-2013
0.000
50.000
100.000
150.000
200.000
250.000
300.000
350.000
400.000
jan feb mar apr may jun jul aug sep oct nov dec
2013
Consumption (MWh)
0
2000
4000
6000
8000
10000
12000
14000
16000
18000
20000
1/1/2011 1/1/2012 1/1/2013
Electricity consumption (kWh)

26
Ventilation
The electricity consumption of the motors and fans was calculated for the ventilation
system. The running hours of the ventilation systems in the different buildings were
checked by the person responsible for the facilities. The consumption calculations,
presented in Table 7, are calculated by multiplying the running hours with the power of the
fans and motors.
Table 7. The electricity consumption and the running hours of the motors and fans of the ventilation systems
Building Area
Power
(kW)
Times when
running
Running hours
full speed (h)
Running
hours half
speed (h)
Consumption
(kWh)
A Work-shop 2.2 07:00 - 16:00 2259
4970
A Production 10
Sun 21:00 - Fri
22:00 6025
60250
B Office 0.27 07:00 - 16:00 2259
610
C
Assembly hall
+ 3 rooms 2.2
05:00 - 22:00;
22:00 - 05:00 4267 1757 11320
C
Social rooms &
kitchen 2.168
05:00 - 22:00;
22:00 - 05:00 4267
9251
D
North
production 18
Mon 00:00 - Fri
24:00; Sat
00:00 - Sun
24:00 6240 2496 134784
D
North social
and office 1.07
06:30 - 17:00;
17:00 - 06:30 2730 6006 6134
D
South
production 8.62 24/7 8736
75304
D
South social
and office 2.2 24/7 8736
19219
Total
321 843
Electricity consumption calculation example:
South production
Power: 8.62 kW
Running hours:
Consumption:
The total electricity consumption for all the ventilation systems is 321.8 MWh
Lighting
For lighting, in all the buildings, fluorescent lights and some flood lights are used. The
number of the 58 W fluorescent lights and the flood lights were counted. Based on the
amount, the power and the running hours of the lights, the electricity consumption was
calculated.

27
A-building
Power:
Workshop:
Tool warehouse:
Production:
Warehouse:
Total power: 16.94 kW
Running hours:
Workshop:
Tool warehouse:
Production:
Warehouse:
Consumption:
Warehouse:
Production+warehouse:
Whole building:
B-building
Power:
Charging room:
Warehouse (north end):
Warehouse (south end):
Office:
Total power: 14.9 kW
Running hours:
Whole building:
Consumption:
Whole building:

28
C-building
Power:
Social area:
Assembly hall:
Welding room:
Fluidbag room:
Screw room:
Warehouse:
Total power: 18.64 kW
Running hours:
Assembly hall/Social:
Other areas:
Consumption:
Assembly hall/Social:
Other areas:
Whole building:
D-building
Power:
Warehouse (north end):
Production (north end):
Production (south end):
Warehouse (south end):
Total power: 24.74 kW
Running hours:
Whole building:
Consumption:
Whole building:
Total lighting consumption
The total electricity consumption for lighting in all the buildings is:

29
Air compressors
To be able to calculate the consumption of the air compressors, the efficiency and the
running hours of the air compressors had to be established. The running hours are
calculated by dividing service interval hours with the amount of hours during the period
between services. The result from the calculations is percentage in running hours.
According to information gotten from the person responsible for facilities, the efficiency of
the air compressor in building D is 50% so the other compressor’s efficiency, which is
unknown is also estimated to be 50 %. Since the Kaeser AS 44 in building A is only used
as back up for the other two and almost never operates, the consumption of this air
compressor is negligible. The other two compressors are running during production in
respective building.
The running hours and motor efficiency of the Kaeser BSD 72 and the Kaeser ASD 47T air
compressors are:
Kaeser ASD 47T
Service interval (from – to):
Running hours during the period:
Capacity factor:
Air compressor running hours:
Kaeser BSD 72
Service interval: –
Running hours during the period: –
Capacity factor: Air compressor running hours:
The annual electricity consumption of the air compressors is calculated by multiplying the
power of the motor with the annual running hours.
The annual electricity consumption of the air compressors is:
Kaeser ASD 47T
Consumption:
Kaeser BSD 72
Consumption:
30
Car engine heating
To get an idea of how many of the workers use car engine heating at the company the
number of cars connected to the socket boxes was counted for ten days. The average
number of the counted cars was then calculated and presented in Table 8. The running
hours of the boxes are regulated by a timer on the electrical switch board. The timer is set
to the hours 04:00 – 07:30, 10:00 – 18:00 and 20:00 – 22:30 and the running hours are
calculated based on these hours and the amount of cold months in a year. This is estimated
to be four months per year. In the calculations the rather conservative number of three
months per year is used to reflect the current season with a mild winter. However, for the
general case it should be realistic to use four months.
It is unknown how many cars use both heating for the car engine and for heating the cabin
of the car and therefore the power is estimated. The power of car engine heating system is
400 – 600 W and the power of the cabin heating system is 1200 – 1400 W, so the power in
this calculation was estimated to be 1000 W. The consumption is calculated by multiplying
the power with running hours and the number of cars and it is also presented in Table 8.
Table 8. The electricity consumption of car engine heating
Weekdays Weekends Total
04:00-
07:30
10:00-
15:30
15:30 -
18:00
20:00-
22:30
04:00-
07:30
10:00-
18:00
20:00-
22:30
Sockets used 4 28 4 4 3 3 3
Power (W) 1000 1000 1000 1000 1000 1000 1000
Running hours (h/a) 210 330 150 150 105 240 75
Consumption (kWh/a) 840 9306 600 600 315 720 225 12606
Consumption calculation example:
Hours/day: –
Running hours/year:
Consumption/year:
The total consumption/year for car engine heating is 12.6 MWh/year.
5.5 Water consumption
Both the consumption of the distributed water and the sewer water is presented in this
chapter. In the tables the consumption equals to both distributed water and sewer water, not
added together, since the sewer water is estimated to be the same as the water consumed.
The meter in building A
The meter in building A is read every quarter of the year, so the consumption data is
presented in both annual consumption and consumption per period, or quarter of a year.
Due to confidentiality the consumption is presented in Appendix 6. The meter measures
the water consumption in buildings A, B and D.

31
The meter in building C
This meter is read very seldom and the consumption is therefore estimated until the meter
is read. Therefore the consumption on the bills might not be accurate but the meter was
read 15.4.2014. The last time the meter was read was 3.12.2012. Due to confidentiality the
periods and the measured/estimated consumption per period are presented in Appendix 6.
The meter measures the consumption in building C.
The meter in the office building
As for the meter in building C, this meter is also very seldom read. The meter was last read
3.12.2012 by the distributor and therefore the meter was read 31.3.2014 during inspection.
The estimation of this meter was totally wrong and the distributor was notified of the real
consumption of this meter. The estimated consumption of the last period was 74% higher
than the real consumption. Due to confidentiality the periods and the measured/estimated
consumption per period are presented in Appendix 6. The meter measures the consumption
in the office building.
The total annual water consumption of the office building and building C cannot be
calculated due to the periods and when the meters have been read.
5.6 Energy cost
All the energy costs and prices are with VAT 0%, if separately not mentioned. Some of the
costs are copied from the bills and some are calculated with the electricity price, which is a
total price including spot price and distribution price. Due to confidentiality, no energy
prices or costs will be presented in the report, instead the data is presented in appendices.
The calculated costs for the different operations in the company will also be presented in
appendices. The electricity price is presented in Appendix 8 and the district heat price is
presented in Appendix 7. In the calculations the latest district heat price set by the
distributor is used and an average price for electricity is used. /17/
5.6.1 Heating systems
The annual costs and the costs divided into billing periods are presented in Appendix 7. It
can be mentioned that both the annual basic charge and the energy price have risen since
the installation of the district heat.
5.6.2 Electricity
The annual and monthly electricity costs from the past three years are presented in
Appendix 8 and show both spot price and cost, future price and cost and distribution costs.
The cost is calculated by multiplying the spot price and the future price with the electricity
consumption and adding the distribution cost. The distribution cost includes electricity
taxes.

32
Lighting
The energy cost for lighting is presented in Appendix 8. The cost is calculated by
multiplying the electricity consumption price with the electricity consumption.
Car engine heating
The energy cost for heating car engines is presented in Appendix 8.
5.7 Water cost
The basic charge and the distribution price are determined by the distributor and the price
of the sewer water is determined based on the contamination of the sewer water.
The water consumption costs are presented in Appendix 9.
5.8 Analysis and action suggestions
5.8.1 Heating
The reason for the increasing annual district heat consumption as seen in Diagram 1 is that
the company has invested in more energy efficient machines, which produce less excess
heat than before. As seen from Diagram 4, Diagram 5 and Diagram 6 the outside
temperature directly affects the district heat consumption. During colder weather the
consumption of the district heat rises significantly. Both poorly insulated buildings and the
logistic traffic in and out of the buildings by the warehouse workers are the cause of the
high consumption.
Control curve
During the time spent at the company it was noticed that during milder weather the indoor
temperature was lower than usual in the workshop in building A and during colder weather
higher indoor temperature. The temperature overall feels a bit too high inside the buildings
A and D. The regulating curve was set when the district heat was installed in year 2009 and
has not been changed since. The curve is a standard curve for most district heat systems.
The temperature of the incoming water according to the outside temperature is presented in
Table 9, where L1 is the production area in buildings A and D and L2 is the work shop in
building A. The control curves for each area are presented in Diagram 14 and Diagram 15.
The curve could be adjusted in two different ways. One way is to shift the curve by raising
the incoming water temperature of the district heat system when the outside temperature is
higher and by lowering the water temperature when the outside temperature is lower. This
is presented in Diagram 15. The second way is to parallel adjust the curve, meaning that
the temperature will be lowered. This is presented in Diagram 14. During inspection, it was
noticed that the indoor temperature in building D was 23 ˚C. The temperature could be
lowered to 20 degrees to save energy.

33
A rule of thumb is that lowering the indoor temperature 1˚C saves 5% of the energy cost.
This means that by lowering the indoor temperature 3 degrees, nearly 15% of the district
heat consumption could be saved. The savings potential for lowering the indoor
temperature has been calculated. /18/
Table 9. Incoming water temperature according to outside temperature
Outside temperature
L1 Water
temperature
L2 Water
temperature
20 20 21
0 42 41
-20 62 58
The adjusted control curves are just examples of how the curve could be adjusted, based on
advice given by the head of district heating at Nykarleby Kraftverk. An expert in the
HVAC field should be contacted for the adjustment of the curve to get the best possible
outcome. /16/
Diagram 14. Current control curve (blue line) for L1 compared with parallel adjusted control curve (red line)
0
10
20
30
40
50
60
70
20 0 -20
˚C
Outside temperature ˚C
L1 Water temperature

34
Diagram 15. Current control curve (blue line) for L1 compared with a shifted control curve (red line)
During inspection of the district heat equipment it was noticed that the outside sensor,
which measures the temperature to regulate the district heat flow, was placed in the sun.
The sensor being in the sun will affect the flow negatively. The sensor needs to be moved
to a place in the shadow of the sun.
Loading and unloading of trucks
Through analyzing the power table it is seen that on most days the peaks take place
between 08:00 – 13:00 and rise during colder weather, approximately under -10°C, above
300 kW. The cause of this was thought about and it was concluded that loading and
unloading of trucks in the heated warehouse, where the door is open during loading and
unloading, would be one reason for the high peaks. The loading and unloading usually take
place at the door in the south end of the warehouse, beginning in the morning and ending
around lunch time and happen in average 3 times a day. To save some energy a door could
be installed between the north part of the warehouse and the south end part, see Figure 1.
Overview of the factory area. This action would prevent the cold air from spreading to
the north end of the warehouse. This would also prevent the cold air from spreading to the
production area in the building, if the door to the production is opened during the time
trucks are loaded or unloaded, and improve the working environment. The savings
potential has been calculated for installing the door.
Another problem at the warehouse is when Prevex subsidiary company Nykarleby
Monteringstjänst Ab (NMT) loads and unloads their truck. This happens also several times
per day and is often done at the door in the north end of the warehouse. A solution for the
problem of heat going out the door could also be installing air curtains. This action has a
significantly higher investment cost, but the heat loss reduction is very good, up to 80 %
depending on the model, so the payback time is fairly short. /19/
0
10
20
30
40
50
60
70
20 0 -20
˚C
Outside temperature ˚C
L2 Water temperature
35
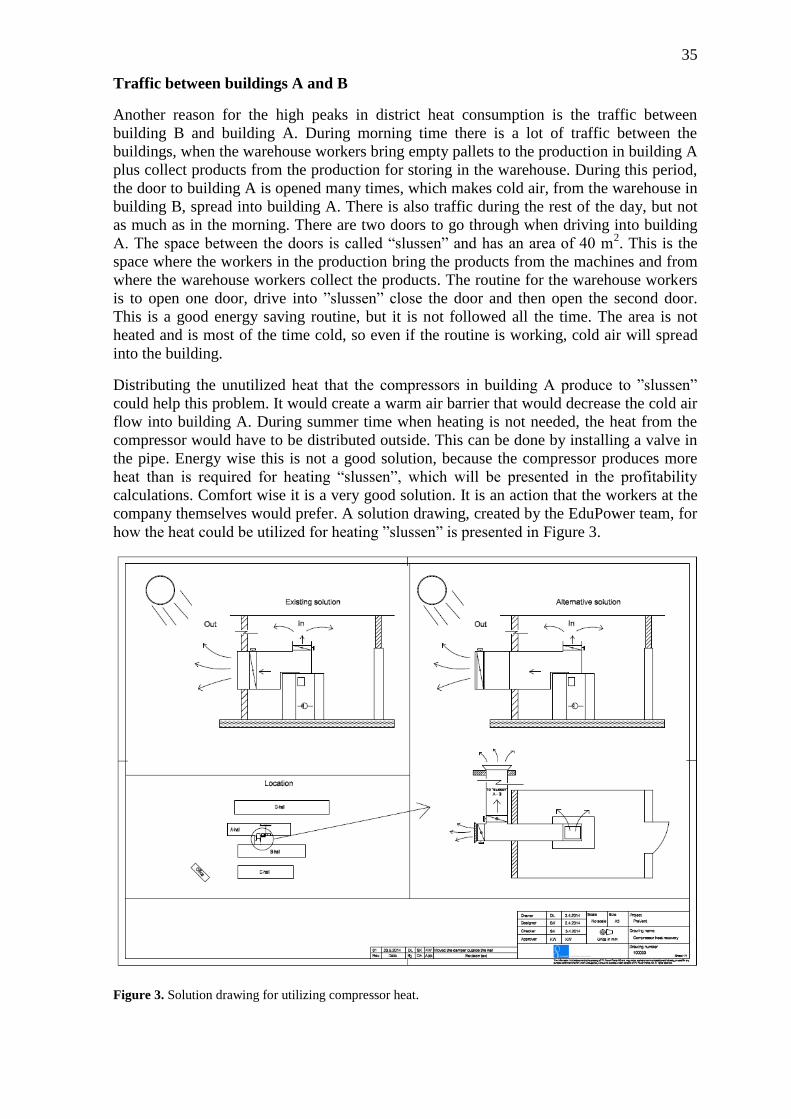
Traffic between buildings A and B
Another reason for the high peaks in district heat consumption is the traffic between
building B and building A. During morning time there is a lot of traffic between the
buildings, when the warehouse workers bring empty pallets to the production in building A
plus collect products from the production for storing in the warehouse. During this period,
the door to building A is opened many times, which makes cold air, from the warehouse in
building B, spread into building A. There is also traffic during the rest of the day, but not
as much as in the morning. There are two doors to go through when driving into building
A. The space between the doors is called “slussen” and has an area of 40 m2. This is the
space where the workers in the production bring the products from the machines and from
where the warehouse workers collect the products. The routine for the warehouse workers
is to open one door, drive into ”slussen” close the door and then open the second door.
This is a good energy saving routine, but it is not followed all the time. The area is not
heated and is most of the time cold, so even if the routine is working, cold air will spread
into the building.
Distributing the unutilized heat that the compressors in building A produce to ”slussen”
could help this problem. It would create a warm air barrier that would decrease the cold air
flow into building A. During summer time when heating is not needed, the heat from the
compressor would have to be distributed outside. This can be done by installing a valve in
the pipe. Energy wise this is not a good solution, because the compressor produces more
heat than is required for heating “slussen”, which will be presented in the profitability
calculations. Comfort wise it is a very good solution. It is an action that the workers at the
company themselves would prefer. A solution drawing, created by the EduPower team, for
how the heat could be utilized for heating ”slussen” is presented in Figure 3.
Figure 3. Solution drawing for utilizing compressor heat.

36
Utilizing the compressor heat for heating building A
Another solution for the heat produced by the air compressor could be heating the
production area of building A, and distributing it to the building the same way as for the
heat from the cooling compressor. For this action a valve would also have to be installed to
distribute the heat out of the building during summer times. This is a further energy saving
action. The excess heat recovered would directly save the equivalent amount of heating
energy. This is shown in the savings calculations.
The heat pumps in building C
As seen from Diagram 7, the heat pumps on the east side of the hall consume more
electricity than the one on the west side. During inspection it was discovered that the
temperature of the heat pumps was set to 23˚C, seen on the remote control in Picture 1.
The remote control sets the temperature for all the heat pumps. Although the temperature is
the same for all the heat pumps, the ones on the east side consume more electricity, of
which one consumes more than the other. During inspection it was also noticed that there
is a greater air flow from the heat pumps on the east side than from the ones on the west
side.
The reason for this was initially thought to be the sun shining on the west side of the
building during day time and the east side being in shadow of the sun the whole day.
An alternative reason emerged as being incorrect settings of the heat pumps. After further
investigation it was found out that the workers had taken the control and raised the
temperature of the two heat pumps on the east side.
The manager of the assembly hall is the only person who should have access to the remote
control and it needs to be for example locked away. The temperature in the hall could be
lowered at least two degrees, preferably three degrees. The work in the hall is mostly
packaging and assembling the siphons, meaning medium-hard body work, for which the
temperature recommendations are 17˚C - 21˚C, seen in Table 10. These actions would save
energy.
Picture 1. The remote control of the heat pumps showing the temperature.

37
Table 10. Temperature recommendations according to work classification.
Work classification Heat produced Temperature
recommendations
easy sitting work under 150 W 21 - 25 °C
other easy work 150 - 300 W 19 - 23 °C
medium hard work 300 - 400 W 17 - 21 °C
hard work 400 - 12 - 17 °C
/20/
5.8.2 Electricity systems
The change in electricity consumption on an annual basis, seen in Diagram 11, is because
of changes in production. The turnover in 2013 was much lower than in 2012, for example.
The seasonal changes and the weather changes also affect the electricity consumption since
two of the buildings are heated with direct electricity and electricity air to air heat pumps.
Ventilation systems
All the ventilation systems at the company are relatively new, except for the unit in the
production area in building A. Therefore the condition of the ventilation should be good.
The ventilation systems are also frequently cleaned. The running hours, however, could be
adjusted a little to save some energy. The building where the running hours could be
adjusted is building C. The other systems’ running hours are optimized as good as they can
get and there is no room for adjustment.
The current running hours of building C are:
Full speed Half speed
Assembly hall: 05.00 – 22:00 22:00 – 05:00
Social & kitchen area: 05:00 – 22:00 -
The new running hours could be:
Full speed Half speed
Assembly hall: 05:00 – 22:00 -
Social & kitchen area: 05:00 – 16:00 16:00 – 22:00
There is no need for the ventilation system to run on half speed during night time, when no
one is working in the hall. It is enough if the ventilation system starts one hour before the
morning shift starts. During night time, when fewer people are working, it is enough if the
ventilation system in the social & kitchen areas runs on half speed after 16:00 when the
rest of the workers have left for the evening.
In addition, there is over pressure in building D. This is because of a former company’s
operations in the building, when over pressure was needed. This is, however, not longer
needed and the settings of the ventilation systems should be adjusted.

38
Lighting
The large amount of lighting needed at the company consumes a lot of electricity. The type
of lighting used at the company has a short life length, are high powered but cheap. The
fluorescent lights could be replaced with LED-fluorescent lights. LED lights have a three
times longer life time, they consume much less electricity, but unfortunately they are a lot
more expensive, although the price is getting lower with time. When replacing
conventional with LED lighting, the colour and the luminous flux, measured in lumen [lm],
of the lights need to be taken into consideration. The idea of replacing the lighting was
presented to the company at an early stage of the investigation. The idea of a pilot project
to replace the lighting at a specific area in building D was suggested by Prevex. The area in
question is the area where the company has a semi-automated line for packaging of kitchen
siphons.
In some areas the lights are on although it is not necessary because of the areas being most
of the time unmanned. The routine of switching off the lights after leaving the area does
not work, so installing motion sensors would be a solution for this problem. Some of the
areas are the warehouse for the tools and both of the raw material warehouses. In the
dressing room in the south production of the building D, there is a motion sensor installed.
It works perfectly. In the heated warehouse in building D a motion sensor could be
installed also. Especially in night time and during weekends, there is very little traffic in
the warehouse. The lights need to be switched on only when the production workers
transport the products from the production to the warehouse, but now they are on all the
time.
Car heating
The running hour for heating car engines is too long. The problem is that the workers end
their shifts in very different times and that is why the timers are set the way they are. This
problem could be solved by installing new socket boxes with timers on the boxes. The
investment cost for these boxes is not that big and it would be a profitable investment.
With these boxes the running hours could be cut down to 2 hours/car, or whatever the
workers feel suitable for heating the car engine. In very cold weather, the recommendation
is 2 hours. This would save electricity for the company.
5.8.3 Water system
The company does not use exceptionally much water and the cost is low. The meters in
building C and the office building are very seldom read and therefore is the consumption
of these buildings estimated. The estimations have been very much from the reality of the
consumption and the meters could be read more often. If the company pays too much for
water consumption they will be refunded by the distributor company. Paying too much
would be prevented if the meters were read frequently, either by the distributor or the
company itself. The meter in building A is read every three months.

39
5.9 Profitability calculations
The savings calculations are separated from the investment and profitability calculations
because some of the calculations only have savings calculations due to lack of information
on investment cost. This is due to difficulties in estimating the investment cost and
difficulties in estimating the cost for the work.
5.9.1 Savings calculations
District heat basic charge
Since the district heat distributor Nykarleby Kraftverk wants to raise the power limit to
380 kW, the basic charge of the district heat will also rise. The actions will prevent the
massive leakage of cold air due to logistics, and therefore cut the peaks in district heat
consumption. Because of this, some of the savings calculations include the effect on the
basic charge.
The basic charge can only be used for one of the action suggestions, but is presented in
several to show how much the action would save with the basic charge not rising.
The basic charge is calculated with a formula taken from the Nykarleby Kraftverk’s
webpage:
Where k, a and b are constants, depending on the customer’s agreed power limit, and P is
the agreed power limit. /17/
Due to confidentiality the profitability calculations are presented in Appendix 10.
Control curve
Lowering the indoor temperature by 1˚C saves 5% of the energy consumption. Lowering
the indoor temperature from 23˚C to 20˚C = 3˚C would save nearly 15% of the district heat
consumption. The cost and cost savings calculations are presented in Appendix 11.
Installing a door in the warehouse in building D
Consumption:
To be able to calculate the energy consumption in the warehouse, due to the loading and
unloading of trucks, the amount of energy required to heat 1 m3 air 1˚C was calculated.
Knowing the volume of the warehouse the amount of energy needed to heat the whole
warehouse could then be calculated. The temperature changes in the warehouse have been
measured.
The energy demand to heat 1 m3 air 1˚C is:

40
The demand for heating 1 kg air 1˚C is 1.01 kJ, then the energy demand for heating 1 kg
air 1˚C is also 0.2778 Wh. The density of air is 1.2041 kg/m3 at 20°C, thus by multiplying
the energy for heating 1 kg air 1˚C with the density of air, the energy for heating 1 m3 air
1˚C will be:
The energy demand for heating 1 m3 air 1˚C is 3.3*10
-4 kWh.
The consumption calculations are based on heating the warehouse on average 10 degrees
with a frequency of 3 times per workday and 120 days per year, which are the cold days of
the year, meaning months that have an average temperature under 5 degrees. Heating is of
course also needed during milder weather, but not taken into consideration in these
calculations. The focus is on the coldest days, since the goal is to lower the peaks in district
heat consumption. By analysing the consumption and power tables, Diagram 1, Diagram 2
Diagram 3, Diagram 4, Diagram 5 and Diagram 6 it is seen that peaks appear only during
colder outside temperatures. Measurements on the temperature changes in the warehouse
were made, from which the average temperature change was calculated. The average
change in temperature is 10 degrees.
As mentioned earlier in the report, there is also a compressor that produces heat in the
warehouse. The power of the compressor is 25 kW. The efficiency of the compressor +
motor (“compressor package”) is 50 % and it runs 50 % of the time. The relative heat loss
from the compressor package is 1 – the efficiency of the compressor package. Thus the
heat energy is calculated by multiplying the power of the motor with (1 - the efficiency)
and the running hours:
The compressor produces 6.25 kW heat but the heat produced by the air compressor will
not be taken into account. This is because while the temperature was measured, the
compressor was producing heat and the heat is therefore negligible. But also because the
heat produced by the compressor is only enough for the base load of the warehouse,
meaning it produces as much as the amount that leaks out through the walls and therefore it
will not assist the heating when the warehouse gets cold. It still produces the same amount
of energy, which is only enough for the base load and the district heat will distribute heat
to the warehouse for heating the cold warehouse. If the measurements were done without
the utilization of the heat produced by the compressor and utilization of heat produced by
the compressor would be installed, the heat from the compressor would have to be
subtracted, because then the compressor would assist the district heat. This is presented in
the utilization of the compressor in the building A chapter.
The total volume of the warehouse is 14 833 m3 so the amount of energy required for
heating the warehouse ten degrees for 120 days and three times per day is:
If the door to the production is open during loading and unloading of trucks, which it
sometimes is, the temperature in the whole building will drop a few degrees. The
temperature was measured near the door and at the lowest the temperature was 12 degrees.
The average temperature in the north production area if the door to the production is open
during loading and unloading is estimated to be 1 degree. Under the same conditions the
estimated drop in temperature for the south production area is estimated to be 3 degrees.

41
The estimated frequency of the door being open during loading and unloading is estimated
to be one time per day.
The volume of the north production is 9866 m3 and the volume of the south end is 6960
m3. Based on these volumes the required amount of energy is calculated.
The total energy consumption for heating the production area of the building is
1234 kWh/year.
The total energy consumption for both the production areas and the warehouse is
19 155 kWh/year.
Energy cost:
The energy cost is presented in Appendix 12.
Energy consumption savings:
By installing the door only the small area in the south end would have to be heated, so the
required energy for heating the area is calculated.
The volume of this area is 6867 m3.
The energy consumption after installing a door in the warehouse is 8269 kWh/year.
Thus the energy consumption saving when installing a door is:
Energy cost savings:
The energy cost savings calculations are presented in Appendix 12.
Installing an air curtain at the doors in the warehouse in building D
Consumption:
Loading and unloading of the subsidiary company’s truck are done on average 5 times per
day during which time the estimated average temperature drop is 5 degrees. Based on this
the energy consumption for heating the warehouse 5 degrees 5 times per day is calculated.

42
The consumption for loading and unloading trucks at the south end of the warehouse is
taken from the calculations for installing a door in the warehouse, which is
19 155 kWh/year.
After unloading the truck the products are delivered into the production. This happens on
average 3 times per day. When the warehouse is cold, the cold air will spread to the
production and the average drop in temperature is 3 degrees in the south end of the
production and 1 degree in the north production. Based on this the consumption for heating
the production is calculated.
South end:
North end:
The total consumption per year for loading and unloading the trucks at both doors is:
Energy cost:
The energy consumption cost is presented in Appendix 13.
Energy consumption savings:
As mentioned before, installing an air curtain at the doors can save up to 80 % of the
energy consumption. Based on the 80% consumption reduction, the consumption savings
is calculated.
The energy consumption saving for installing air curtains is 22 232 kWh/year.
Energy cost savings:
The energy cost savings calculations are presented in Appendix 13.
Utilizing heat from air compressor for heating building A
The Keaser AS 44 (30) is only used as a back-up compressor and is hardly ever used and is
therefore neglected in these calculations. The heat produced by the Keaser BSD 72
(37 kW) is calculated based on the running hours per year of the compressor and its
efficiency. The running hours and motor efficiency of the Kaeser BSD 72 air compressors
is, as already mentioned:
Service interval: 3.6.2013 – 3.10.2013 = 2928 h
Running hours during the period: 67164 – 64284 = 2880 h
Running hours share: 2880 / 2928 = 0.98

43
Air compressor running hours: 365 work days * 24 h * 0.98 = 8585 h/year
Efficiency of the motor: 50 %
Since it is unknown how much energy is used to heat building A, the savings calculations
are calculated for the total district heat consumption. The power of the compressor motor is
37 kW, its efficiency is 50% and the running hours/year of the compressor is 5925 h. The
heat from the compressor would only be utilized during the colder months of the year,
from beginning of October until the end of April, depending on the weather. The running
hour percentage for one year is calculated so that the running hours for the colder months
can be calculated.
There are 212 days in the period October – April.
During these 212 days, the compressor operates 98 % of the hours:
The heat from the compressor would be utilized 4 986 h/year. The rest of the time of the
year, the heat would be distributed outside.
Energy savings:
By multiplying the power with the efficiency and the running hours, the heat energy
produced is calculated.
The air compressor produces 92.2 MWh/year of heat. As mentioned in the text about the
savings potential in the warehouse in building D, this heat can be directly subtracted from
the total district heat since the heat has never been utilized before. Therefore the heat
produced by the air compressor directly saves the amount of energy it produces, which is
92.2 MWh/year.
Energy cost savings:
The energy cost savings calculations are presented in Appendix 14.
Utilizing the air compressor heat for heating “slussen” between buildings A and B
Energy consumption saving
The savings calculation for heating “slussen” with heat from the compressor in building A
is done by using the same principle as in heating the warehouse in building D, that the
requirement for heating 1m3 air 1˚C is 0.33 Wh.
The primary interest here is related to the peaks in district heat consumption, and the
economic impact associated with these. Therefore the continuous heat losses are omitted.

44
“Slussen” has a volume of 175 m3. The estimated temperature to be heated is 10˚C with the
estimated frequency of 5 times per day. Based on these estimations the demand for heating
“slussen” is:
If the compressor produces 92 241 kWh/year and the heating demand for “slussen” is 439
kWh/year, the compressor heat is much more than enough to cover the demand for heating
“slussen”. Since the demand for “slussen” is small compared to the heat from the
compressor, there is still heat available for further utilization:
This means that with this action 439 kWh/year of the energy consumption is saved and 91
802 kWh/year of the heat produced by the air compressor would be considered spill-over.
To utilize all the energy produced by the air compressor, the door to the production in
building A would have to stay open when the “slussen” area is warm enough, to be able to
utilize the heat that otherwise would be unutilized, for heating the production in building
A. This means new work routines for both the production workers and the warehouse
workers.
Alternatively the rest of the compressor heat could be used directly to heat building A.
Energy cost saving
The energy cost savings calculations are presented in Appendix 15.
Lowering the temperature of the heat pumps
Lowering the indoor temperature in the assembly hall in building C would save energy.
The current temperature is 23˚C and it could be lowered to 20˚C. The general rule is that
lowering the temperature one degree saves 5 % of the energy consumption, so lowering the
temperature three degrees would save nearly 15% of the energy consumption.
The average consumption/day per heat pump during the time period when the consumption
was measured is:
Heat pump 1: 8.48 kWh/day
Heat pump 2: 16.18 kWh/day
Heat pump 3: 27.74 kWh/day
The total consumption of the different pumps for their respective time periods is:
Heat pump 1: 64.07 kWh
Heat pump 2: 121.3 kWh
Heat pump 3: 229.29 kWh
The cost for each pump for their respective time period is presented in Appendix 16.

45
The average temperature of February/2014 was 0.6˚C, which are a few degrees under the
average annual temperature in Nykarleby. To get an understanding of the annual
consumption of the heat pumps these daily average consumptions are directly multiplied
with the number of days in a year, with a 10 % reduction of the consumption because of
the difference in average temperature in February/2014 and the annual average
temperature. All the days are counted for because during summertime, the heat pumps cool
the hall.
Pump 1:
Pump 2:
Pump 3:
The cost per day and year of the different heat pumps is calculated and presented in
Appendix 16.
Energy consumption savings for the three heat pumps
If the temperature had been 20˚C instead of 23˚C during the measuring period, the
company would have saved in electricity consumption. If lowering the temperature 3
degrees reduces the energy consumption with 15%1, the energy consumption saving would
have been:
Heat pump 1:
Heat pump 2:
Heat pump 3:
On an annual level, the rough energy saving estimate on same basis as previously declared
would be:
Pump 1:
Pump 2:
Pump 3:
1 Generally 5% energy saving from 1 °C lower temperature is used as annual average. Here it is used for a
short period of the year to get a rough estimate.This period in question has a temperature close to the annual
average.

46
Energy cost savings for the three heat pumps
The energy cost savings calculations are presented in Appendix 16.
There are still seven heat pumps in the assembly hall and social areas in the building of
which the consumption has not been measured or calculated, due to lack of time and
complications with getting the device connected to the internet. It is not possible to
calculate the consumption of the rest of the heat pumps without some kind of measuring
and therefore are the savings calculated only for the ones measured. The actual savings for
lowering the temperature are not the calculated cost savings, they are even bigger.
Replacing existing fluorescent lights with LED-lights in all buildings
The power of the LED-light chosen is 25 W. The luminous flux is 2000 lm compared to
4319 lm for the current type of lighting. There is floodlight in areas requiring more light.
The question whether the LED-light is acceptable without further changes or not is beyond
the scope of this report.
To be able to calculate the energy consumption and cost savings, the consumption of the
LED-lights had to be calculated in the same way as for the current consumption. The
consumption of the current lighting, the LED-lighting and the consumption saving for the
different areas is presented in Table 11. The savings calculations are based on only
replacing the fluorescent lighting, the flood lighting will not be replaced.

47
Table 11. The consumption savings for replacing the current lighting with LED-lighting.
Current lighting LED - lighting
Building Area
Running
hours
(h)
Power
(W)
Consumption
/year (MWh)
Power
(W)
Consumption
/year (MWh)
Consumption
saving
(MWh)
A Work-shop 2259 58 12.1 25 5.2 6.9
A
Tool
warehouse 6024 58 8.4 25 3.6 4.8
A Production 6024 58 48.9 25 21.1 27.8
A
Raw
material
warehouse 6024 58 12.6 25 5.4 7.2
A Total
81.9
35.3 46.6
B
Charging
room 2259 58 2.1 25 0.9 1.2
B
Warehouse
(north) 2259 58 15.2 25 6.6 8.6
B Office 2259 58 1.8 25 0.8 1.0
B Total
19.1
8.2 10.9
C
Social
rooms 4016 58 5.6 25 2.4 3.2
C
Assembly-
hall 4016 58 22.4 25 9.6 12.7
C Warehouse 2008 58 7.9 25 3.4 4.5
C Attic 2008 58 4.0 25 1.7 2.3
C
Welding
room 2008 58 2.4 25 1.1 1.4
C
Fluidbag-
room 2008 58 2.3 25 1.0 1.3
C
Screw
room 2008 58 0.7 25 0.3 0.4
C
"Under the
roof" 2008 58 1.4 25 0.6 0.8
C Total
46.7
20.1 26.6
D
Raw
material
warehouse 8736 58 6.1 25 2.6 3.5
D
Production
(north) 8736 58 79.0 25 34.1 45.0
D
Production
(south) 8736 58 32.4 25 14.0 18.5
D Warehouse 8736 58 52.7 25 22.7 30.0
D Total
170.2
73.4 96.9
Building
s Total
318
137.1 180.9

48
Energy cost savings
The energy cost savings calculations are presented in Appendix 17.
The pilot project – replacing lights at a specific area
The pilot project is to replace the lighting at the south production in building D and the
amount of lighting being replaced is 40 pcs, making the total power of the LED-lights 1
kW compared to the current power of 2.32 kW. The running hours in building D is 8736 h.
Consumption savings
The current electricity consumption of the lighting at the area is:
Replacing lighting with LED-lights, the consumption is:
The electricity consumption saving is:
The annual energy consumption saving per year for replacing the fluorescent lights with
LED-lights at the specific area is 11.532 MWh/year.
Energy cost savings
The energy cost savings calculations are presented in Appendix 18.
Installing motion sensor
Energy savings calculation
To be able to calculate the savings potential in installing motion sensors for the lighting in
some specific areas, the electricity consumption of these areas was calculated. To be able
to calculate the consumption the number of lights needed to be counted. The light hours of
the lights were calculated and then the consumption. The consumption of the different
areas is presented in Table 12.

49
Table 12. Energy consumption and cost of the different areas.
Building Area
Light hours
(h/year)
Amount
of lights
Power
(W)
Total
power (W)
Consumption
(MWh)
D
South
warehouse 8736 48 58 2784 24.32
D
North
warehouse 8736 56 58 3248 28.38
D
Tool
warehouse 2134 10 58 580 1.24
D
Raw
material
warehouse 2134 12 58 696 1.49
A
Raw
material
warehouse 6024 36 58 2088 12.58
Tool
warehouse 2134 24 58 1392 2.97
C Attic 2134 20 58 1160 2.48
Screwroom 2134 6 58 348 0.74
Totalt
74.18
By installing motion sensors for the lighting, the light hours will decrease. The new light
hours are calculated with an estimated percentage reduction of the current light hours. The
percentage is estimated through observation of the traffic in these areas. Based on the new
light hours the new energy consumption is calculated and presented in Table 13. The
savings potential is also presented in the same

50
Table 13. The calculations are based on the lights for these areas being switched on during
the work hours of each specific area.

51
Table 13. The energy consumption savings for replacing lights at the specific areas.
Building Area New light hours (%)
New light hours
(h/year)
New consumption
(MWh)
Current consumption
(MWh)
Consumption savings (MWh)
D South
warehouse 75 % 6552 18.24 24.32 6.08
D North
warehouse 75 % 6552 21.28 28.38 7.09
D Tool
warehouse 50 % 1067 0.62 1.24 0.62
D
Raw material
warehouse 25 % 533 0.37 1.49 1.11
A
Raw material
warehouse 75 % 4518 9.43 12.58 3.15
Tool warehouse 50 % 1067 1.49 2.97 1.49
C Attic 20 % 427 0.5 2.48 1.98
Screw room 30 % 640 0.22 0.74 0.52
Total
52.15 74.18 22.04
Energy cost savings
The energy cost savings calculations are presented in Appendix 19.
Replacing existing socket boxes for car engine heating with socket boxes with timers
Savings calculation
With the current running hours the car engine heating consumption is 12.606 MWh. The
consumption and cost if boxes with timers are installed are presented in Table 14.
Table 14. The consumption and cost if socket boxes for car engine heating are installed
With timers
Timer 2 h
Sockets used 45.20
Power (W) 1000
Running hours (h) 120
Consumption (kWh) 5424

52
As mentioned before, the recommendation for heating a car engine in cold weather is 2
hours, so the running hour calculations are based on 2 hours/day for 20 days/month and 3
months/year. The amount of sockets used is based on the calculations done by the auditor.
The power of the car engine heating is an estimation based on how many cars use interior
heater in their car.
The running hours:
The consumption calculation:
The cost calculation is presented in Appendix 20.
Savings:
Consumption:
The cost saving calculation is presented in Appendix 20.
The annual energy saving for installing socket boxes with timers is: 13076 kWh/year
5.9.2 Investment costs and profitability calculations
Control curve
There are no investment costs for adjusting the control curve for district heating except for
hiring a field expert to do the job. The average expert hiring fee is around 60 €/hour and
the job is estimated to take 4-8 hours. The calculations are based on the estimate that the
job would take 8 hours. If the company has the expertise within the company, there is no
investment cost.
Cost for hiring an expert:
The total investment cost is: 480 €
If the company has the expertise to adjust the curve themselves, the payback time is 0
years and the action would save energy costs immediately.
The payback calculation is presented in Appendix 21
Installing a door in the warehouse in building D
The investment cost for installing a fast door between the south and the north part of the
warehouse is 7900 € according to information gotten from the person responsible for the
company facilities at the company. The annual service cost for the fast door is 300 €/year,
also gotten from the person responsible of the facilities.
The payback calculation is presented in Appendix 22.

53
Installing air curtains in the warehouse in building D
A price list was found on Airtecnincs webpage. The model MAX is suitable for industrial
doors and the price of these models varies from 2000 € to 10 000 €. Because it is so
uncertain how powerful an air curtain is needed at the warehouse, the most powerful and
expensive model is chosen, which costs 13 001 USD. According to today’s currency
13 001 USD is 9396.98 €. On the basis of this investment cost a simple payback was
calculated. The installation cost is not included in the calculation because of difficulties in
estimating the cost. /19/ /21/
The payback calculation is presented in Appendix 23
Utilizing the compressor heat for heating building A
Due to difficulties in estimating the cost for utilizing the heat from the compressor for
heating building A, the payback time is not calculated.
Utilizing the compressor heat for heating “slussen” between buildings A and B
Due to difficulties in estimating the cost for utilizing the heat from the compressor for
heating “slussen”, the payback time is not calculated.
Lowering the temperature of the heat pumps
For lowering the temperature of the heat pumps there is no investment cost and therefore
the payback time is zero years.
Replacing existing fluorescent lights with LED-lights in all buildings
Investment cost:
The price for the LED-fluorescent lights is taken from Lamppuexpress’s webpage. The
lights are the kinds that can be installed in the existing armature, so there is no extra cost
for installing new ones, and the price for ordering over 40 lights is 36.25 €. The amount of
fluorescent lights being replaced is 1055 pcs. The lifetime of a LED-fluorescent light is
50 000 h compared to the 15 000 h of the regular fluorescent light, meaning that the regular
fluorescent light would have to be renewed 3 times during the lifetime of a LED-light. /22/
The total investment for replacing the existing lighting with LED-lighting is 38 243.75 €.
The average running hours of the lighting in the company is 4521 h and the lifetime of the
LED-lights is 50 000 h making the lifetime in years:

54
The lifetime of the current lighting is 15 000 h making the lifetime in years:
Payback
Based on the lifetime the payback is calculated and presented in Appendix 24.
The pilot project – replacing lights at a specific area
Investment cost
The same LED-light price as for the calculation for all the buildings is also used in this
calculation. 40 lights will be replaced and the price of one LED-light is 36.25 € so the
investment cost is:
Payback
The payback calculation is presented in Appendix 25.
Installing motion sensor
Investment costs
Different motion sensors were chosen for the different areas based on the maximum power
capacity the sensors have and the total power of the different areas. The sensors are chosen
from Finnparttia’s price list on their webpage, where the price and the specifics of the
sensors are listed. The sensors chosen are presented in Table 15. /23/
Table 15. Specifications of the sensors
Model
Power
capacity (W)
Reaction
area
Reaction
distance (m) Light time Price (€/pcs)
VAHTIJUSSI 2 1000 240˚ 12 5 s - 12 min 49 €
VAHTIJUSSI 4 3600 220˚ 16 10 s - 30 min 109 €
Payback
The payback calculation is presented in Appendix 26.

55
Replacing existing socket boxes for car engine heating with socket boxes with timers
Investment calculation
The investment cost is presented in Table 16 with socket box price, cost for the installation
and the work hours for the installation. The price of the boxes is collected from
Finnparttia’s product catalogue on their webpage. The work hours were estimated by an
employee at Jeppo Kraft and are based on three boxes being installed per hour. An extra
hour is added to the work hours in case of delay. The work hour price is the price Jeppo
Kraft charges by the hour for installation work. /23/
Table 16. Investment cost for installing socket boxes with timers
Amount of boxes 33 boxes
Price for boxes 149 €
Cost/ hour for installation 32 €/h
Work hours 12 h
Total cost 5 301 €
Work hours:
11 h + 1 extra hour = 12 h
Investment cost:
The total investment cost is: 5301 €
Payback
The payback calculation is presented in Appendix 27

56
6 Conclusion
During the project it was noticed that the company had not given much thought to their
energy use. There are power reports and follow-ups on their electricity and district heat
consumption, but there are not enough resources within the company to take actions
towards saving energy. An energy audit was done in 2006, but not many of the action
suggestions in that report have been utilized.
The overall electricity consumption is very much depending on the production within the
company, during slower production years the electricity consumption is much lower. The
company is constantly investing in new energy efficient machines and the electricity
consumption will decrease due to this. The peaks in district heat consumption are the
biggest problem. According to the analysis the forklift traffic in and out of the buildings is
believed to be the reason for the peaks and the action suggestions presented in this report
will reduce the peaks. Because of this, preventing the basic charge to rise is considered a
saving for the company.
6.1 Conclusions about action suggestions
The conclusions about the action suggestions are presented in the order of profitability.
Adjusting the control curve
As mentioned about the discussions on indoor temperature being too low during milder
outside weather and too high during colder outside weather, the conclusion is that the
problem will be solved by optimising the control curve. This action has no costs unless an
expert is hired, but the company has the competence to do the adjustment themselves. The
indoor temperature overall in all the buildings is too high. Lowering the temperature might
not lower the district heat peaks, but will save energy and make the work place more
pleasant. It is not healthy to work in too high temperatures. This action will save nearly
15 % of the energy consumption and has no investment cost. Both actions are pure savings
for the company with no payback time.
Lowering the temperature on the heat pumps
The temperature on the heat pumps in the assembly hall was set to 23°C during inspection,
which is too high for the work taking place in that area. It was also noticed during the
inspection that the heat pumps on the east side consume a lot more electricity. The reason
for this was that the workers had set the heat pumps themselves and the heat pumps were
working against each other. The remote control should be hidden away so that only the
manager of the assembly hall can control the settings.
Lowering the temperature and a better control of the settings of the heat pumps are pure
savings without investment costs. Lowering the temperature 3°C will save nearly 15 % of
the energy consumption.

57
Adjusting running hours for the ventilation system
The running hours are important for the comfort of the workers and need to be thought
about carefully. There is not much room for change in the running hours in the systems
except for the systems in building C. This action saves a little money and has no
investment cost.
Otherwise the ventilation systems are in good condition. They are all relatively new except
for the one in the production area of building A, which could be considered to be replaced.
The systems are also cleaned frequently.
Utilizing the heat from air compressor in building A
Distributing the heat produced by the air compressor outside is not optimal when thinking
about saving energy. It has been thought, within the company, about taking actions against
this problem, but again the resources are not enough. Now it is known how much energy
can be saved by utilizing the heat and the decision making towards taking action against
this problem will be easier. This is the most important action in the sense of lots of heat not
being utilized. The investment cost for both actions is unknown because of difficulties in
estimating the cost of the work and the work hours, but the guess is that it is fairly high.
Still the action is very important since there is 65 000 kWh of heat that is not being
utilized.
Distributing the heat produced by the air compressor to the heat distribution system is the
best solution when looking at saving energy. The heat the compressor produces would then
be direct district heat consumption saving. The investment cost for the action might be
pretty high.
Considering energy savings, utilizing the heat for heating “slussen” is not optimal. The
energy demand for heating the small area is much smaller than the amount of heat the air
compressor produces. Routines with keeping the doors open or closed would have to be
changed with this action to be able to utilize all the heat the air compressor produces.
Heating “slussen” with the heat is more a comfort thing for the workers, since they leave
the products the machines produce in the area. A reason for the high peaks in district heat
consumption is the traffic in and out of building A. Distributing the heat to “slussen”
would also create a sort of air barrier for the cold air spreading into the building, but not
very efficiently. However, this action might even out the peaks a little. The investment cost
for the action is believed to be high.
Installing motion sensors for lighting
There are many areas in the company that are unmanned but lighting is running. By
installing motion sensors the running hours of the lighting will increase and therefore also
the energy consumption. The investment cost for the sensors is low, but the cost for
installing the motion sensors is unknown because of the difficulty in estimating the cost for
cables and work hours. Without the cost for installing the sensors the payback time is
really low. This is an action that saves much money with very little investment and effort.

58
Replacing existing socket boxes for car engine heating with socket boxes with timers
With the existing running hours the car engines are being heated too long. By installing
socket boxes with timers the workers would be able to set the running hours themselves.
The need for heating the car engine is not more than two hours. The condition of the
existing socket boxes is not that good either and it would be recommended to replace them
anyway. The investment cost and the cost for installing the new boxes are not that high and
the savings potential is fairly good. It is a good action that can be carried out with very
little effort.
Replacing existing fluorescent lighting with LED-lighting
The lighting consumes a lot of electricity and by replacing the existing fluorescent lights
with LED-lights the electricity consumption decreases considerably. The LED-lights are
expensive making the investment cost high. There is no cost for installing because the
LED-lights today can be installed in existing armatures. In addition, there is no cost for
replacing the lights because they need to be renewed sooner or later anyway, and the
replacing can be done when the existing lights break. The payback time for replacing the
lights is good. The action has a high investment but very good savings potential.
A problem with installing LED-lighting is the colour of the lighting. It might disturb
quality control camera systems and it takes some time for the workers to get used to. This
is why a pilot project was suggested for testing how the workers react to the colour.
Another problem is that the LED-lighting does not produce as much heat as regular
fluorescent lights. On the other, hand during summertime less cooling is needed with LED-
lighting, making the heat loss evened out with savings in cooling the building.
Loading and unloading of trucks
Lots of cold air spread in the warm warehouse in building D when the loading and
unloading of trucks take place. This is a big reason for the high peaks in district heat
consumption. Two actions are presented for preventing the cold air from spreading to the
building. Because of the over pressure in building D once the cold air spreads to the
production side, the cold air will also spread to building A, which is connected to building
D. It would be very important to prevent the cold from spreading in the building both for
evening out the peaks and for the comfort of the workers.
Installing an air curtain at the door where the loading and unloading take place is the most
efficient way to keep cold air and dust from spreading in the building. As mentioned before
the heat loss reduction of air curtains can be up to 80%. With this action some routines in
the loading and unloading of the subsidiary company’s truck will have to change. All
loading and unloading will have to take place at the same door, which might cause some
problems. The investment cost for installing the air curtain is pretty high, but the savings
potential being so good, the payback time is not that long. Especially when taking into
consideration the savings in basic charge. This is the best action for evening out the high
peaks in district heat consumption.

59
Installing a door between the north and the south side of the warehouse will prevent the
cold air from spreading to the whole warehouse. The north end, where the loading and
unloading of trucks takes place, still needs to be heated. The investment cost for installing
a door is relatively high. The action is not the most efficient one to lower the district heat
consumption. It will even out the peaks and therefore the basic charge savings are included
in the calculations. Without taking the basic charge saving into consideration the payback
time is very long, but by including the basic charge saving the payback time is much
shorter, but still pretty long.
6.2 Further research
Instead of utilizing the heat from the compressor in building A for heating “slussen” or the
production area, the possibility of utilizing the heat as an air curtain to prevent cold air
from spreading into the building could be researched. This is a more complicated action
but would save much energy.
Research could also be done on how to utilize the heat from the air compressor in building
D. It could also be used as an air curtain for the door in the south end of the warehouse
located next to the compressor. This would mean that the loading and unloading of the
subsidiary company’s truck could be done at this door as it is being done for now.
Research on how much heat is leaking out through the walls and roofs of the buildings
could be done. Most of the buildings are pretty old and no or very little renovating has
been done to the buildings.

60
7 References
/1/ Motiva, (2009) Teollisuussektorin energiakatselmusten ohjeistus
http://www.motiva.fi/files/2728/Teollisuus_KATohjeet_ja_mallisisallysluettelot_2
009.pdf
Retrieved: 10.3.2014
/2/ Motiva (2014)
http://www.motiva.fi/toimialueet/energiakatselmustoiminta/tem_n_tukemat_energi
akatselmukset/patevoityneet_energiakatselmoijat/teollisuuden_energiakatselmuksia
_raportoineet_yritykset
Retrieved: 10.3.2014
/3/ Motiva (2013)
http://www.motiva.fi/en/areas_of_operation/energy_auditing/mee-
supported_energy_auditing/statistical_data_from_energy_audits/saving_potentials_
in_smes
Retrieved: 10.3.2014
/4/ Corzine Jon S, Jackson Lisa P, (2006) New Jersey Department of Environmental
Protection
http://www.co.middlesex.nj.us/mcset/EnergyAuditGuide.pdf
Retrieved: 20.11.2013
/5/ Motiva, (2004) Kiinteistön energiakatselmuksen toteutus- ja raportointiohjeet
http://www.motiva.fi/files/745/kat-kiinteiston-ekatselmus.pdf
Retrieved: 11.3.2014
/6/ U.S Department of Energy (2011) A Guide to Energy Audits
http://www.pnnl.gov/main/publications/external/technical_reports/pnnl-20956.pdf
Retrieved: 6.2.2014
/7/ Hasanbeigi Ali, Price Lynn (2010) Industrial Energy
http://china.lbl.gov/sites/all/files/Industrial_Energy_Audit_Guidebook_EN.pdf
Retrieved: 27.3.2014
/8/ Wikipedia, Payback-metoden
http://sv.wikipedia.org/wiki/Payback-metoden
Retrieved: 14.3.2014
/9/ Prevex
http://www.prevex.com/Prevex
Retrieved: 25.11.2013
/10/ Nykarleby Kraftverk
http://www.nykarlebykraftverk.fi/index.php3?use=publisher&id=1169&lang=1
Retrieved: 26.11.2013
/11/ Mitsubishi Electric, Uudet GE-sarjan inventteri-ilmalämpöpumput
http://www.ilmalampopumput.fi/files/esite_mitsubishi_msz-ge25-50vah-log.pdf
Retrieved: 25.2.2014
/12/ Toshiba, Toshiba Daiseikai
http://www.ilmalampopumput.fi/files/toshiba_daiseikai.pdf
Retrieved: 25.2.2014

61
/13/ Mitsubishi Electric, Ilmalämpöpumput
http://www.ilmalampopumput.fi/files/mitsubishi-fd-mallin-esite-log.pdf
Retrieved: 25.2.2014
/14/ Nykarleby Kraftverk
http://kundweb.nkab.fi/
Retrieved: 11.9.2013
/15/ Vattenfall
https://minunsivuni.elenia.fi/main/default.asp
Retrieved: 1.10.2013
/16/ Janne Öhman, Nykarleby Kraftverk
Retrieved: 29.11.2013
/17/ Nykarleby Kraftverk
http://www.nykarlebykraftverk.fi/index.php3?use=publisher&id=1225&lang=1
Retrieved: 24.3.2014
/18/ Motiva, (2013) Sisälämpötila
http://www.motiva.fi/koti_ja_asuminen/nain_saastat_energiaa/lampo/sisalampotila
Retrieved: 5.3.2014
/19/ Airtechnics
http://www.ilmaverho.com/Teknologia/Ilmaverhojen-kayttokohteet_6/
Retrieved: 26.3.2014
/20/ Työsuojeluhallinto, (2013) Lämpöolot
http://www.tyosuojelu.fi/fi/lampoolot
Retrieved: 25.2.2014
/21/ Valuta.se
http://www.valuta.se/
Retrieved: 26.3.2014
/22/ Lamppu Express
http://www.lamppuexpress.com/philips-corepro-ledtube-1500mm-25w-840-c/
Retrieved: 7.3.2014
/23/ Finnparttia
http://www.finnparttia.fi/
Retrieved: 7.3.2014
/24/ Motiva, Sektorikohtaiset säästöpotentiaalit
http://www.motiva.fi/toimialueet/energiakatselmustoiminta/tem_n_tukemat_energi
akatselmukset/tilastotietoa_katselmuksista/sektorikohtaiset_saastopotentiaalit
Retrieved: 11.3.2014

1(1)
Appendix 1
Savings potential list by sector
The savings potential list by sector, created by Motiva. /24/
RAPORTOIDUT KOHTEET 1992-2012 (6 276 KOHDETTA)
SEKTORI KOH- SÄÄSTÖ- TMA INVES- SÄÄSTÖPOTENTIAALI
TEET POTENTIAALI TOINTI LÄMPÖ SÄHKÖ VESI
YHTEENSÄ energia kustannukset energia kustannukset kulutus kustan-
energia teho
energia teho nukset
lkm milj. €/a a milj.€ GWh/a milj. €/a milj. €/a GWh/a milj. €/a milj. €/a km³/a milj. €/a
PJ Kunta-ala 3684 23.4 4.1 97.0 474.4 12.6 1.4 98.0 5.6 2.0 845.0 1.7
PY Yksityinen palvelu 1625 24.4 1.8 44.8 411.1 11.4 0.9 161.4 9.4 1.6 570.5 1.1
TE Teollisuus alle 500 GWh 937 74.6 2.9 218.9 1 700.6 46.8 3.4 321.1 17.3 3.0 5 133.3 4.2
TE Teollisuus yli 500 GWh 9 27.0 3.7 99.3 1 256.3 16.9 0.2 249.8 7.9 1.7 6 873.5 0.2
EA Energia-ala 21 0.2 1.4 0.2 6.2 0.1 0.0 1.5 0.1 0.0 21.9 0.0
YHTEENSÄ 6 276 149.4 3.1 460.2 3 849 87.7 5.9 832 40.3 8.3 13 444 7.2

1(5)
CONFIDENTIAL Appendix 2
The monthly and annual district heat consumption data for the years 2010 - 2013

2(5)
CONFIDENTIAL Appendix 2
The monthly and annual district heat consumption data for the years 2010 - 2013

3(5)
CONFIDENTIAL Appendix 2
The monthly and annual district heat consumption data for the years 2010 - 2013

4(5)
CONFIDENTIAL Appendix 2
The monthly and annual district heat consumption data for the years 2010 - 2013

5(5)
CONFIDENTIAL Appendix 2
The monthly and annual district heat consumption data for the years 2010 - 2013

1(3)
CONFIDENTIAL Appendix 3
The district heat power data of the specific periods

2(3)
CONFIDENTIAL Appendix 3
The district heat power data of the specific periods

3(3)
CONFIDENTIAL Appendix 3
The district heat power data of the specific periods

1(3)
Appendix 4
The electricity consumption data of the 3 heat pumps
The measured consumption data of heat pump 1.
Date Hour kWh Date Hour kWh Date Hour kWh Date Hour kWh
7.2.2014 12:00:00 0.51 9.2.2014 06:00:00 0.39 11.2.2014 00:00:00 0.49 12.2.2014 18:00:00 0.25
7.2.2014 13:00:00 0.49 9.2.2014 07:00:00 0.50 11.2.2014 01:00:00 0.33 12.2.2014 19:00:00 0.25
7.2.2014 14:00:00 0.51 9.2.2014 08:00:00 0.37 11.2.2014 02:00:00 0.27 12.2.2014 20:00:00 0.30
7.2.2014 15:00:00 0.52 9.2.2014 09:00:00 0.47 11.2.2014 03:00:00 0.40 12.2.2014 21:00:00 0.45
7.2.2014 16:00:00 0.40 9.2.2014 10:00:00 0.50 11.2.2014 04:00:00 0.46 12.2.2014 22:00:00 0.36
7.2.2014 17:00:00 0.52 9.2.2014 11:00:00 0.37 11.2.2014 05:00:00 0.32 12.2.2014 23:00:00 0.50
7.2.2014 18:00:00 0.47 9.2.2014 12:00:00 0.50 11.2.2014 06:00:00 0.47 13.2.2014 00:00:00 0.43
7.2.2014 19:00:00 0.46 9.2.2014 13:00:00 0.28 11.2.2014 07:00:00 0.26 13.2.2014 01:00:00 0.49
7.2.2014 20:00:00 0.40 9.2.2014 14:00:00 0.42 11.2.2014 08:00:00 0.30 13.2.2014 02:00:00 0.38
7.2.2014 21:00:00 0.39 9.2.2014 15:00:00 0.33 11.2.2014 09:00:00 0.47 13.2.2014 03:00:00 0.53
7.2.2014 22:00:00 0.45 9.2.2014 16:00:00 0.26 11.2.2014 10:00:00 0.26 13.2.2014 04:00:00 0.40
7.2.2014 23:00:00 0.51 9.2.2014 17:00:00 0.44 11.2.2014 11:00:00 0.39 13.2.2014 05:00:00 0.53
8.2.2014 00:00:00 0.46 9.2.2014 18:00:00 0.47 11.2.2014 12:00:00 0.26 13.2.2014 06:00:00 0.35
8.2.2014 01:00:00 0.54 9.2.2014 19:00:00 0.27 11.2.2014 13:00:00 0.25 13.2.2014 07:00:00 0.41
8.2.2014 02:00:00 0.51 9.2.2014 20:00:00 0.45 11.2.2014 14:00:00 0.24 13.2.2014 08:00:00 0.39
8.2.2014 03:00:00 0.51 9.2.2014 21:00:00 0.51 11.2.2014 15:00:00 0.26 13.2.2014 09:00:00 0.26
8.2.2014 04:00:00 0.48 9.2.2014 22:00:00 0.36 11.2.2014 16:00:00 0.47 13.2.2014 10:00:00 0.41
8.2.2014 05:00:00 0.44 9.2.2014 23:00:00 0.41 11.2.2014 17:00:00 0.31 13.2.2014 11:00:00 0.38
8.2.2014 06:00:00 0.49 10.2.2014 00:00:00 0.51 11.2.2014 18:00:00 0.31 13.2.2014 12:00:00 0.26
8.2.2014 07:00:00 0.54 10.2.2014 01:00:00 0.50 11.2.2014 19:00:00 0.24 13.2.2014 13:00:00 0.25
8.2.2014 08:00:00 0.49 10.2.2014 02:00:00 0.33 11.2.2014 20:00:00 0.24 13.2.2014 14:00:00 0.26
8.2.2014 09:00:00 0.53 10.2.2014 03:00:00 0.36 11.2.2014 21:00:00 0.26 13.2.2014 15:00:00 0.25
8.2.2014 10:00:00 0.53 10.2.2014 04:00:00 0.50 11.2.2014 22:00:00 0.27 13.2.2014 16:00:00 0.24
8.2.2014 11:00:00 0.25 10.2.2014 05:00:00 0.42 11.2.2014 23:00:00 0.46 13.2.2014 17:00:00 0.26
8.2.2014 12:00:00 0.25 10.2.2014 06:00:00 0.25 12.2.2014 00:00:00 0.51 13.2.2014 18:00:00 0.30
8.2.2014 13:00:00 0.39 10.2.2014 07:00:00 0.25 12.2.2014 01:00:00 0.39 13.2.2014 19:00:00 0.46
8.2.2014 14:00:00 0.45 10.2.2014 08:00:00 0.27 12.2.2014 02:00:00 0.39 13.2.2014 20:00:00 0.40
8.2.2014 15:00:00 0.37 10.2.2014 09:00:00 0.47 12.2.2014 03:00:00 0.53 13.2.2014 21:00:00 0.38
8.2.2014 16:00:00 0.49 10.2.2014 10:00:00 0.24 12.2.2014 04:00:00 0.41 13.2.2014 22:00:00 0.49
8.2.2014 17:00:00 0.51 10.2.2014 11:00:00 0.25 12.2.2014 05:00:00 0.50 13.2.2014 23:00:00 0.45
8.2.2014 18:00:00 0.50 10.2.2014 12:00:00 0.25 12.2.2014 06:00:00 0.38 14.2.2014 00:00:00 0.45
8.2.2014 19:00:00 0.35 10.2.2014 13:00:00 0.23 12.2.2014 07:00:00 0.25 14.2.2014 01:00:00 0.48
8.2.2014 20:00:00 0.49 10.2.2014 14:00:00 0.25 12.2.2014 08:00:00 0.30 14.2.2014 02:00:00 0.39
8.2.2014 21:00:00 0.44 10.2.2014 15:00:00 0.24 12.2.2014 09:00:00 0.42 14.2.2014 03:00:00 0.52
8.2.2014 22:00:00 0.28 10.2.2014 16:00:00 0.24 12.2.2014 10:00:00 0.31 14.2.2014 04:00:00 0.49
8.2.2014 23:00:00 0.49 10.2.2014 17:00:00 0.24 12.2.2014 11:00:00 0.25 14.2.2014 05:00:00 0.49
9.2.2014 00:00:00 0.45 10.2.2014 18:00:00 0.24 12.2.2014 12:00:00 0.26 14.2.2014 06:00:00 0.47
9.2.2014 01:00:00 0.39 10.2.2014 19:00:00 0.25 12.2.2014 13:00:00 0.24 14.2.2014 07:00:00 0.33
9.2.2014 02:00:00 0.50 10.2.2014 20:00:00 0.25 12.2.2014 14:00:00 0.24 14.2.2014 08:00:00 0.29
9.2.2014 03:00:00 0.39 10.2.2014 21:00:00 0.25 12.2.2014 15:00:00 0.26 14.2.2014 09:00:00 0.49
9.2.2014 04:00:00 0.49 10.2.2014 22:00:00 0.33 12.2.2014 16:00:00 0.26 14.2.2014 10:00:00 0.25
9.2.2014 05:00:00 0.49 10.2.2014 23:00:00 0.42 12.2.2014 17:00:00 0.26 14.2.2014 11:00:00 0.24

2(3)
Appendix 4
The electricity consumption data of the 3 heat pumps
The measured consumption data of heat pump 2.
Date Hour kWh Date Hour kWh Date Hour kWh Date Hour kWh
14.2.2014 12:00:00 0.32 16.2.2014 06:00:00 0.88 18.2.2014 00:00:00 0.73 19.2.2014 18:00:00 0.55
14.2.2014 13:00:00 0.65 16.2.2014 07:00:00 0.77 18.2.2014 01:00:00 0.70 19.2.2014 19:00:00 0.51
14.2.2014 14:00:00 0.52 16.2.2014 08:00:00 0.87 18.2.2014 02:00:00 0.76 19.2.2014 20:00:00 0.59
14.2.2014 15:00:00 0.61 16.2.2014 09:00:00 0.82 18.2.2014 03:00:00 0.70 19.2.2014 21:00:00 0.58
14.2.2014 16:00:00 0.56 16.2.2014 10:00:00 0.87 18.2.2014 04:00:00 0.69 19.2.2014 22:00:00 0.61
14.2.2014 17:00:00 0.50 16.2.2014 11:00:00 0.86 18.2.2014 05:00:00 0.81 19.2.2014 23:00:00 0.82
14.2.2014 18:00:00 0.56 16.2.2014 12:00:00 0.78 18.2.2014 06:00:00 0.71 20.2.2014 00:00:00 0.77
14.2.2014 19:00:00 0.50 16.2.2014 13:00:00 0.73 18.2.2014 07:00:00 0.65 20.2.2014 01:00:00 0.95
14.2.2014 20:00:00 0.56 16.2.2014 14:00:00 0.81 18.2.2014 08:00:00 0.52 20.2.2014 02:00:00 1.02
14.2.2014 21:00:00 0.52 16.2.2014 15:00:00 0.72 18.2.2014 09:00:00 0.63 20.2.2014 03:00:00 1.02
14.2.2014 22:00:00 0.50 16.2.2014 16:00:00 0.73 18.2.2014 10:00:00 0.61 20.2.2014 04:00:00 0.88
14.2.2014 23:00:00 0.59 16.2.2014 17:00:00 0.78 18.2.2014 11:00:00 0.57 20.2.2014 05:00:00 1.01
15.2.2014 00:00:00 0.64 16.2.2014 18:00:00 0.72 18.2.2014 12:00:00 0.57 20.2.2014 06:00:00 1.12
15.2.2014 01:00:00 0.63 16.2.2014 19:00:00 0.81 18.2.2014 13:00:00 0.52 20.2.2014 07:00:00 0.99
15.2.2014 02:00:00 0.72 16.2.2014 20:00:00 0.80 18.2.2014 14:00:00 0.62 20.2.2014 08:00:00 0.87
15.2.2014 03:00:00 0.72 16.2.2014 21:00:00 0.64 18.2.2014 15:00:00 0.63 20.2.2014 09:00:00 0.94
15.2.2014 04:00:00 0.76 16.2.2014 22:00:00 0.83 18.2.2014 16:00:00 0.56 20.2.2014 10:00:00 0.94
15.2.2014 05:00:00 0.72 16.2.2014 23:00:00 0.81 18.2.2014 17:00:00 0.57 20.2.2014 11:00:00 0.89
15.2.2014 06:00:00 0.63 17.2.2014 00:00:00 0.73 18.2.2014 18:00:00 0.51 20.2.2014 12:00:00 0.89
15.2.2014 07:00:00 0.59 17.2.2014 01:00:00 0.81 18.2.2014 19:00:00 0.59 20.2.2014 13:00:00 0.88
15.2.2014 08:00:00 0.57 17.2.2014 02:00:00 0.82 18.2.2014 20:00:00 0.61 20.2.2014 14:00:00 0.78
15.2.2014 09:00:00 0.59 17.2.2014 03:00:00 0.76 18.2.2014 21:00:00 0.66 20.2.2014 15:00:00 0.75
15.2.2014 10:00:00 0.60 17.2.2014 04:00:00 0.75 18.2.2014 22:00:00 0.72 20.2.2014 16:00:00 0.66
15.2.2014 11:00:00 0.55 17.2.2014 05:00:00 0.86 18.2.2014 23:00:00 0.73 20.2.2014 17:00:00 0.65
15.2.2014 12:00:00 0.55 17.2.2014 06:00:00 0.84 19.2.2014 00:00:00 0.75 20.2.2014 18:00:00 0.60
15.2.2014 13:00:00 0.59 17.2.2014 07:00:00 0.54 19.2.2014 01:00:00 0.86 20.2.2014 19:00:00 0.57
15.2.2014 14:00:00 0.56 17.2.2014 08:00:00 0.54 19.2.2014 02:00:00 0.84 20.2.2014 20:00:00 0.59
15.2.2014 15:00:00 0.56 17.2.2014 09:00:00 0.74 19.2.2014 03:00:00 0.83 20.2.2014 21:00:00 0.60
15.2.2014 16:00:00 0.56 17.2.2014 10:00:00 0.62 19.2.2014 04:00:00 0.79 20.2.2014 22:00:00 0.58
15.2.2014 17:00:00 0.52 17.2.2014 11:00:00 0.49 19.2.2014 05:00:00 0.97 20.2.2014 23:00:00 0.81
15.2.2014 18:00:00 0.68 17.2.2014 12:00:00 0.61 19.2.2014 06:00:00 0.81 21.2.2014 00:00:00 0.81
15.2.2014 19:00:00 0.71 17.2.2014 13:00:00 0.62 19.2.2014 07:00:00 0.73 21.2.2014 01:00:00 0.97
15.2.2014 20:00:00 0.64 17.2.2014 14:00:00 0.58 19.2.2014 08:00:00 0.82 21.2.2014 02:00:00 0.89
15.2.2014 21:00:00 0.72 17.2.2014 15:00:00 0.49 19.2.2014 09:00:00 0.82 21.2.2014 03:00:00 1.02
15.2.2014 22:00:00 0.61 17.2.2014 16:00:00 0.49 19.2.2014 10:00:00 0.72 21.2.2014 04:00:00 1.09
15.2.2014 23:00:00 0.83 17.2.2014 17:00:00 0.57 19.2.2014 11:00:00 0.86 21.2.2014 05:00:00 1.05
16.2.2014 00:00:00 0.80 17.2.2014 18:00:00 0.56 19.2.2014 12:00:00 0.74 21.2.2014 06:00:00 1.01
16.2.2014 01:00:00 0.75 17.2.2014 19:00:00 0.49 19.2.2014 13:00:00 0.71 21.2.2014 07:00:00 0.94
16.2.2014 02:00:00 0.85 17.2.2014 20:00:00 0.57 19.2.2014 14:00:00 0.68 21.2.2014 08:00:00 0.95
16.2.2014 03:00:00 0.81 17.2.2014 21:00:00 0.51 19.2.2014 15:00:00 0.59 21.2.2014 09:00:00 1.02
16.2.2014 04:00:00 0.76 17.2.2014 22:00:00 0.50 19.2.2014 16:00:00 0.58 21.2.2014 10:00:00 0.93
16.2.2014 05:00:00 0.93 17.2.2014 23:00:00 0.66 19.2.2014 17:00:00 0.56 21.2.2014 11:00:00 1.04

3(3)
Appendix 4
The electricity consumption data of the 3 heat pumps
The measured consumption data of heat pump 2.
Date Hour kWh Date Hour kWh Date Hour kWh Date Hour kWh
21.2.2014 13:00:00 1.39 23.2.2014 07:00:00 1.14 25.2.2014 01:00:00 1.19 26.2.2014 19:00:00 1.17
21.2.2014 14:00:00 1.46 23.2.2014 08:00:00 1.16 25.2.2014 02:00:00 1.14 26.2.2014 20:00:00 1.18
21.2.2014 15:00:00 1.25 23.2.2014 09:00:00 1.10 25.2.2014 03:00:00 1.14 26.2.2014 21:00:00 1.17
21.2.2014 16:00:00 1.31 23.2.2014 10:00:00 1.30 25.2.2014 04:00:00 1.13 26.2.2014 22:00:00 1.26
21.2.2014 17:00:00 1.48 23.2.2014 11:00:00 1.23 25.2.2014 05:00:00 1.15 26.2.2014 23:00:00 1.24
21.2.2014 18:00:00 1.25 23.2.2014 12:00:00 1.80 25.2.2014 06:00:00 1.80 27.2.2014 00:00:00 1.37
21.2.2014 19:00:00 1.41 23.2.2014 13:00:00 1.14 25.2.2014 07:00:00 1.18 27.2.2014 01:00:00 1.31
21.2.2014 20:00:00 1.12 23.2.2014 14:00:00 1.15 25.2.2014 08:00:00 1.15 27.2.2014 02:00:00 1.42
21.2.2014 21:00:00 1.13 23.2.2014 15:00:00 1.60 25.2.2014 09:00:00 1.20 27.2.2014 03:00:00 1.30
21.2.2014 22:00:00 1.15 23.2.2014 16:00:00 1.18 25.2.2014 10:00:00 1.90 27.2.2014 04:00:00 1.26
21.2.2014 23:00:00 1.16 23.2.2014 17:00:00 1.40 25.2.2014 11:00:00 1.11 27.2.2014 05:00:00 1.24
22.2.2014 00:00:00 1.26 23.2.2014 18:00:00 1.32 25.2.2014 12:00:00 1.26 27.2.2014 06:00:00 1.39
22.2.2014 01:00:00 1.12 23.2.2014 19:00:00 1.30 25.2.2014 13:00:00 1.70 27.2.2014 07:00:00 1.18
22.2.2014 02:00:00 1.80 23.2.2014 20:00:00 1.15 25.2.2014 14:00:00 1.14 27.2.2014 08:00:00 1.30
22.2.2014 03:00:00 1.21 23.2.2014 21:00:00 1.31 25.2.2014 15:00:00 1.14 27.2.2014 09:00:00 1.22
22.2.2014 04:00:00 1.32 23.2.2014 22:00:00 1.27 25.2.2014 16:00:00 1.13 27.2.2014 10:00:00 1.16
22.2.2014 05:00:00 1.36 23.2.2014 23:00:00 1.25 25.2.2014 17:00:00 0.96 27.2.2014 11:00:00 1.23
22.2.2014 06:00:00 1.19 24.2.2014 00:00:00 1.20 25.2.2014 18:00:00 1.19 27.2.2014 12:00:00 1.12
22.2.2014 07:00:00 1.33 24.2.2014 01:00:00 1.25 25.2.2014 19:00:00 1.10 27.2.2014 13:00:00 1.29
22.2.2014 08:00:00 1.16 24.2.2014 02:00:00 1.16 25.2.2014 20:00:00 1.10 27.2.2014 14:00:00 1.17
22.2.2014 09:00:00 1.21 24.2.2014 03:00:00 1.14 25.2.2014 21:00:00 1.90 27.2.2014 15:00:00 1.21
22.2.2014 10:00:00 1.18 24.2.2014 04:00:00 1.16 25.2.2014 22:00:00 1.19 27.2.2014 16:00:00 1.11
22.2.2014 11:00:00 1.13 24.2.2014 05:00:00 1.40 25.2.2014 23:00:00 1.34 27.2.2014 17:00:00 1.13
22.2.2014 12:00:00 1.50 24.2.2014 06:00:00 1.18 26.2.2014 00:00:00 1.00 27.2.2014 18:00:00 1.22
22.2.2014 13:00:00 1.13 24.2.2014 07:00:00 1.70 26.2.2014 01:00:00 1.24 27.2.2014 19:00:00 1.14
22.2.2014 14:00:00 1.14 24.2.2014 08:00:00 1.13 26.2.2014 02:00:00 1.70 27.2.2014 20:00:00 1.23
22.2.2014 15:00:00 1.27 24.2.2014 09:00:00 1.90 26.2.2014 03:00:00 1.29 27.2.2014 21:00:00 1.80
22.2.2014 16:00:00 1.26 24.2.2014 10:00:00 1.11 26.2.2014 04:00:00 1.17 27.2.2014 22:00:00 1.11
22.2.2014 17:00:00 1.19 24.2.2014 11:00:00 1.11 26.2.2014 05:00:00 1.23 27.2.2014 23:00:00 1.19
22.2.2014 18:00:00 1.46 24.2.2014 12:00:00 1.13 26.2.2014 06:00:00 1.22 28.2.2014 00:00:00 1.18
22.2.2014 19:00:00 1.24 24.2.2014 13:00:00 1.13 26.2.2014 07:00:00 1.15 28.2.2014 01:00:00 1.24
22.2.2014 20:00:00 1.17 24.2.2014 14:00:00 1.16 26.2.2014 08:00:00 1.14 28.2.2014 02:00:00 1.12
22.2.2014 21:00:00 1.12 24.2.2014 15:00:00 1.13 26.2.2014 09:00:00 1.80 28.2.2014 03:00:00 1.19
22.2.2014 22:00:00 1.20 24.2.2014 16:00:00 1.20 26.2.2014 10:00:00 1.14 28.2.2014 04:00:00 1.21
22.2.2014 23:00:00 1.18 24.2.2014 17:00:00 0.98 26.2.2014 11:00:00 1.26 28.2.2014 05:00:00 1.21
23.2.2014 00:00:00 1.15 24.2.2014 18:00:00 1.30 26.2.2014 12:00:00 1.21 28.2.2014 06:00:00 1.70
23.2.2014 01:00:00 1.21 24.2.2014 19:00:00 0.97 26.2.2014 13:00:00 1.14 28.2.2014 07:00:00 1.20
23.2.2014 02:00:00 1.16 24.2.2014 20:00:00 1.20 26.2.2014 14:00:00 1.70 28.2.2014 08:00:00 1.23
23.2.2014 03:00:00 1.70 24.2.2014 21:00:00 0.97 26.2.2014 15:00:00 1.23 28.2.2014 09:00:00 1.10
23.2.2014 04:00:00 1.90 24.2.2014 22:00:00 1.90 26.2.2014 16:00:00 1.70 28.2.2014 10:00:00 1.50
23.2.2014 05:00:00 1.15 24.2.2014 23:00:00 1.16 26.2.2014 17:00:00 1.21 28.2.2014 11:00:00 1.17
23.2.2014 06:00:00 1.17 25.2.2014 00:00:00 1.11 26.2.2014 18:00:00 1.23 28.2.2014 12:00:00 1.90

1(4)
CONFIDENTIAL Appendix 5
The monthly and annual electricity consumption data of the years 2011 – 2013

2(4)
CONFIDENTIAL Appendix 5
The monthly and annual electricity consumption data of the years 2011 – 2013

3(4)
CONFIDENTIAL Appendix 5
The monthly and annual electricity consumption data of the years 2011 – 2013

4(4)
CONFIDENTIAL Appendix 5
The monthly and annual electricity consumption data of the years 2011 – 2013

1(2)
CONFIDENTIAL Appendix 6
The water consumption for the years 2011 – 2013

2(2)
CONFIDENTIAL Appendix 6
The water consumption for the years 2011 – 2013

1(2)
CONFIDENTIAL Appendix 7
The annual district heat costs for the years 2010 – 2013 and costs divided in to billing periods

2(2)
CONFIDENTIAL Appendix 7
The annual district heat costs for the years 2010 – 2013 and costs divided in to billing periods

1(3)
CONFIDENTIAL Appendix 8
The annual and monthly electricity costs and electricity cost for the different operations

2(3)
CONFIDENTIAL Appendix 8
The annual and monthly electricity costs and electricity cost for the different operations

3(3)
CONFIDENTIAL Appendix 8
The annual and monthly electricity costs and electricity cost for the different operations

1(2)
CONFIDENTIAL Appendix 9
The water consumption costs

2(2)
CONFIDENTIAL Appendix 9
The water consumption costs

1(1)
CONFIDENTIAL Appendix 10
District heat basic charge savings

1(1)
CONFIDENTIAL Appendix 11
Control curve

1(1)
CONFIDENTIAL Appendix 12
Installing a door in the warehouse in building D

1(1)
CONFIDENTIAL Appendix 13
Installing an air curtain at the doors in the warehouse in building D

1(1)
CONFIDENTIAL Appendix 15
Utilizing the air compressor heat for heating “slussen”

1(1)
CONFIDENTIAL Appendix 16
Lowering the temperature of the heat pumps

1(1)
CONFIDENTIAL Appendix 17
Replacing existing fluorescent lights with LED-lights in all buildings

1(1)
CONFIDENTIAL Appendix 18
The pilot project – replacing lights at a specific area

1(2)
CONFIDENTIAL Appendix 19
Installing motion sensor

2(2)
CONFIDENTIAL Appendix 19
Installing motion sensor

1(1)
CONFIDENTIAL Appendix 20
Replacing existing socket boxes for car engine heating

1(1)
CONFIDENTIAL Appendix 21
Control curve - payback

1(1)
CONFIDENTIAL Appendix 22
Payback for installing a door in the warehouse in building D

1(1)
CONFIDENTIAL Appendix 23
Payback for installing air curtain in the warehouse in building D

1(1)
CONFIDENTIAL Appendix 24
Payback for replacing existing fluorescent lights in all buildings

1(1)
CONFIDENTIAL Appendix 25
Payback for the pilot project

1(1)
CONFIDENTIAL Appendix 26
Payback for installing motion sensor

1(1)
CONFIDENTIAL Appendix 27
Payback for replacing existing socket boxes with socket boxes with timers


![oy ie ea504164]t... · 2020. 6. 25. · ie ou oy Paint by Sound ou oy oy oy oy oy ea ea ea ea ea ea ea ay ie ie Page 3 of 13 visit twinkl.com. Crayon Doodles Can you work out what](https://img.dokumen.tips/doc/110x75/5fee301fe867f27cc53e8707/oy-ie-ea-504164t-2020-6-25-ie-ou-oy-paint-by-sound-ou-oy-oy-oy-oy-oy.jpg)