Embed Size (px)
Citation preview
Global prevalence of
vitamin A deficiency in populations
at risk1995–2005
WHO Global Database on Vitamin A Deficiency
WHO Global Database on Vitamin A Deficiency
www.who.int/vmnis
For further information about the WHO Global Database on Vitamin A Deficiency,
or if you would like to provide information, please contact:
ISBN 978 92 4 159801 9
GlO
bAl pr
eVAlenc
e OF VitAm
in A D
eFicien
cy in
pOpu
lAtiOn
s At risk 1995–2005
WH
O G
LOBaL D
ataBaSe ON
vItamIN
a DefIcIeN
cy W
HO
Global prevalence of vitamin A deficiency in populations at risk
1995–2005WHO Global Database on Vitamin A Deficiency
WHO Library Cataloguing-in-Publication Data
Global prevalence of vitamin A deficiency in populations at risk 1995–2005: WHO global database on vitamin A deficiency.
1.Vitamin A deficiency – epidemiology. 2.Vitamin A deficiency – etiology. 3.Vitamin A deficiency – complications. 4.Child. 5.Eye manifestations. 6.Databases as topic. I.World Health Organization.
ISBN 978 92 4 159801 9 (NLM classification: WD 110)
© World Health Organization 2009
All rights reserved. Publications of the World Health Organization can be obtained from WHO Press, World Health Organization, 20 Avenue Appia, 1211 Geneva 27, Switzerland (tel.: +41 22 791 3264; fax: +41 22 791 4857; e-mail: [email protected]). Requests for permission to reproduce or translate WHO publications – whether for sale or for noncommercial distribution – should be addressed to WHO Press, at the above address (fax: +41 22 791 4806; e-mail: [email protected]).
The designations employed and the presentation of the material in this publication do not imply the expression of any opinion whatsoever on the part of the World Health Organization concerning the legal status of any country, territory, city or area or of its authorities, or concerning the delimitation of its frontiers or boundaries. Dotted lines on maps represent approximate border lines for which there may not yet be full agreement.
The mention of specific companies or of certain manufacturers’ products does not imply that they are endorsed or recommended by the World Health Organization in preference to others of a similar nature that are not mentioned. Errors and omissions excepted, the names of proprietary products are distinguished by initial capital letters.
All reasonable precautions have been taken by the World Health Organization to verify the information contained in this publication. However, the published material is being distributed without warranty of any kind, either expressed or implied. The responsibility for the interpretation and use of the material lies with the reader. In no event shall the World Health Organization be liable for damages arising from its use.
Cover photographs by WHO/P. Virot, L. Rogers, and T. StanleyDesigned by minimum graphicsPrinted in France
Suggested citation: WHO. Global prevalence of vitamin A deficiency in populations at risk 1995–2005. WHO Global Database on Vitamin A Deficiency. Geneva, World Health Organization, 2009.
iii
Contents
Preface viiAcknowledgements ixAbbreviations x1. Introduction 1 1.1 Vitamin A deficiency: a public health problem 1 1.1.1 Etiology 1 1.1.2 Health consequences 1 1.1.3 Assessing vitamin A status and deficiency 2 1.2 Control of vitamin A deficiency 22. Methods 4 2.1 Data sources – The WHO Global Database on Vitamin A Deficiency 4 2.2 Selection of survey data 4 2.2.1 Administrative level 4 2.2.2 Population groups 5 2.3 Defining vitamin A deficiency 5 2.3.1 Serum or plasma retinol threshold 5 2.3.2 Estimated prevalence of night blindness and biochemical vitamin A deficiency for countries with no survey data 6 2.3.3 Uncertainty of estimates 6 2.3.4 Combining national estimates 7 2.3.5 Global prevalence of vitamin A deficiency in populations at risk 7 2.3.6 Classification of vitamin A deficiency as a problem of public health significance 7 2.4 Population covered by survey data, proportion of population, and the number of individuals with vitamin A deficiency in populations at risk 8 2.4.1 Population covered 8 2.4.2 Proportion of population and the number of individuals affected in countries at risk for vitamin A deficiency 83. Results and Discussion 9 3.1 Results 9 3.1.1 Population covered 9 3.1.2 Proportion of population and number of individuals with vitamin A deficiency in populations at risk 10 3.1.3 Public health significance of vitamin A deficiency 11 3.2 Discussion 16 3.2.1 Population covered 16 3.2.2 Strengths of estimates 16 3.2.3 Proportion of population and the number of individuals with vitamin A deficiency in populations at risk 16 3.2.4 Classification of countries by degree of public health significance of vitamin A deficiency 16 3.2.5 Comparison to previous estimates 16 3.2.6 Limitations of estimates 17 3.3 Conclusions 18
COntents
GlObAl preVAlenCe Of VitAmin A DefiCienCy in pOpulAtiOns At risk 1995–2005iv
References 19
Annexes Annex 1 WHO Member States grouped by WHO region and UN region as of 2007 21 Table A1.1 WHO Member States grouped by WHO region 21 Table A1.2 WHO Member States grouped by UN region and subregion 22Annex 2 Results by UN region 24 Table A2.1 Percentage of population at risk of vitamin A deficiency covered by night blindness and serum retinol prevalence surveys (national or subnational) conducted between 1995 and 2005, by UN region 24 Table A2.2 Prevalence of night blindness and numbers of affected preschool-age children and pregnant women in countries at risk of vitamin A deficiency in each UN region 24 Table A2.3 Prevalence of serum retinol <0.70 µmol/l and numbers of affected preschool-age children and pregnant women in countries at risk of vitamin A deficiency in each UN region 25Annex 3 National estimates of vitamin A deficiency 26 Table A3.1 Country estimates of the prevalence of night blindness in preschool-age children 1995–2005 26 Table A3.2 Country estimates of the prevalence of night blindness in pregnant women 1995–2005 32 Table A3.3 Country estimates of the prevalence of serum retinol <0.70 µmol/l in preschool-age children 1995–2005 37 Table A3.4 Country estimates of the prevalence of serum retinol <0.70 µmol/l in pregnant women 1995–2005 43Annex 4 Country references 49
TablesTable 1 Classification of xerophthalmia 2Table 2 Prediction equations used to generate biochemical vitamin A deficiency estimates for countries without survey data in populations at risk of vitamin A deficiency 7Table 3 Prediction equations used to generate night blindness estimates for countries without survey data in populations at risk of vitamin A deficiency 7Table 4 Prevalence criteria for defining night blindness of public health significance 8Table 5 Prevalence cut-offs to define vitamin A deficiency in a population and its level of public health significance 8Table 6 Population residing in countries with a 2005 GDP ≥US$ 15 000 and excluded from estimations, expressed in number and percentage of the total population 9Table 7 Number of countries and percentages of population covered by night blindness and serum retinol prevalence surveys (national or subnational) conducted between 1995 and 2005, by WHO region in countries at risk of vitamin A deficiency 9Table 8 Global prevalence of night blindness and number of individuals affected in populations of countries at risk of vitamin A deficiency 1995–2005 10Table 9 Global prevalence of serum retinol concentrations <0.70 µmol/l and number of individuals affected in populations of countries at risk of vitamin A deficiency 1995–2005 10Table 10 Prevalence of night blindness and number of individuals affected among preschool-age children and pregnant women in populations of countries at risk of vitamin A deficiency 1995–2005, globally and by WHO region 10Table 11 Prevalence of serum retinol <0.70 µmol/l and number of individuals affected in preschool-age children and pregnant women in populations of countries at risk of vitamin A deficiency 1995–2005, globally and by WHO region 11Table 12 Number of countries categorized by public health significance of night blindness 1995–2005 11Table 13 Number of countries categorized by public health significance of vitamin A deficiency defined by the prevalence of serum retinol concentrations <0.70 µmol/l 1995–2005 11Table 14 Comparison of the most recent global estimates of vitamin A deficiency 17
v
FiguresFigure 1 Night blindness as a public health problem by country 1995–2005: Preschool-age children 12Figure 2 Biochemical vitamin A deficiency (retinol) as a public health problem by country 1995–2005: Preschool-age children 13Figure 3 Night blindness as a public health problem by country 1995–2005: Pregnant women 14Figure 4 Biochemical vitamin A deficiency (retinol) as a public health problem by country 1995–2005: Pregnant women 15
COntents

vii
Preface
Part of the World Health Organization’s mandate is to pro-vide information on the health status of the population at the global level. In this respect, since 1991, the Department of Nutrition for Health and Development (NHD) has been maintaining the Vitamin and Mineral Nutrition Infor-mation System (VMNIS), which includes three databases related to three micronutrient disorders of public health significance globally: iodine deficiency, iron deficiency and anaemia, and vitamin A deficiency. The objectives of VMNIS are to assess the status of the population at the global level in order to increase the awareness of the public health community and policy makers, evaluate the impact of interventions and measure progress towards the goals en-dorsed by the international community, to compare data between countries, track changes over time, and increase the capacity of countries to manage health data related to micronutrients.
WHO estimates of the global prevalence of vitamin A deficiency were first published through its Micronutrient Deficiency Information System in 1995. Since then, large programmes on vitamin A deficiency control have been implemented in several countries where vitamin A defi-ciency was a public health problem – many of these pro-grammes involved vitamin A supplementation and were strengthened by being combined with polio eradication campaigns. Additionally, vitamin A status indicators, espe-cially symptomatic reporting of night blindness and serum retinol concentrations, have been assessed in many more national surveys than reported for previous estimates. As a result, most data collected in the present report are based on reported histories of night blindness and serum retinol concentrations.
Vitamin A deficiency is one of the most important causes of preventable childhood blindness and is a major contribu-tor to morbidity and mortality from infections, especially in children and pregnant women, affecting the poorest seg-ments of populations, particularly those in low and middle income countries. The primary cause of vitamin A deficien-cy is lack of an adequate intake of vitamin A, and may be exacerbated by high rates of infection, especially diarrhoea and measles. Its consequence is most apparent during stag-
es of life of high nutritional demand (e.g. early childhood, pregnancy and lactation). A variety of interventions are be-ing used to improve the vitamin A status of populations: dietary diversification, vitamin A supplementation and for-tification.
In 1987, WHO estimated that vitamin A deficiency was endemic in 39 countries based on the ocular manifestations of xerophthalmia or deficient serum (plasma) retinol con-centrations (<0.35 µmol/l). In 1995, WHO updated these estimates and reported that vitamin A deficiency was of public health significance in 60 countries, and was likely to be a problem in an additional 13 countries. The current estimates reflect the time period between 1995 and 2005, and indicate that 45 and 122 countries have vitamin A defi-ciency of public health significance based on the prevalence of night blindness and biochemical vitamin A deficiency (serum retinol concentration <0.70 µmol/l), respectively, in preschool-age children.
In this present edition, estimates of vitamin A deficiency are provided for preschool-age children as in the previous edition, and also for pregnant women. They are based on an increasingly assessed history of night blindness and a now more widely adopted serum (plasma) retinol concentration, using a cut-off of <0.70 µmol/l (<20 µg/dl) to define defi-ciency. Despite a marked increase in submitted data, there are still numerous countries lacking national prevalence data. There is a need to inform and motivate governments and agencies to collect, and report to WHO, national and subnational data on the prevalence of deficiency and, whenever possible, vitamin A programme coverage condi-tions prevailing at the time that population assessment data were collected. At the same time, there is also a need for the development of new field methods with which to assess vi-tamin A status that are cost effective and that can take into consideration the potential influences of infection.
In this report, the prevalence of vitamin A deficiency is presented by country and by WHO regions. Because these prevalence data may be used to identify programme needs by other United Nations agencies, we have also presented the estimates classified by United Nations regions in the annexes.
prefACe
GlObAl preVAlenCe Of VitAmin A DefiCienCy in pOpulAtiOns At risk 1995–2005viii
This document is divided into three chapters. The first provides an overview of vitamin A deficiency, the second describes the criteria used to identify, revise, select, and in-terpret the findings of the surveys, and the methodology developed to generate national, regional, and global esti-mates, while the third discusses the results.
This report is written for public health officials, nutri-tionists, and researchers. We hope that readers find it useful and feel free to share any comments with us ([email protected]). We also hope that this information will contribute to our common goal to eliminate vitamin A de-ficiency as a public health problem.
ix
Acknowledgements
This report utilized data from the WHO Global Database on Vitamin A Deficiency, which is part of the WHO Vita-min and Mineral Nutrition Information System (VMNIS), developed by the Reduction of Micronutrient Malnutrition Unit in the Department of Nutrition for Health and De-velopment.
This report is the result of the hard work and collaboration of several individuals. We would especially like to thank Lisa M. Rogers, who took the lead on the development of this report, Daniel Wojdyla of the Universidad Nacional de Rosario, Argentina for performing the statistical analyses, Keith P. West Jr of Johns Hopkins Bloomberg School of Public Health for his extremely valuable scientific input on vitamin A, and Bruno de Benoist for his technical expertise in this area. Grace Rob and Ann-Beth Moller also provid-
ACknOWleDGements
ed valuable assistance in data management. Additionally, WHO wishes to thank the numerous individuals, institu-tions, governments, nongovernmental, and international organizations for providing data for the database. Without continual international collaboration in keeping the data-base up-to-date, this compilation on the global situation and trends in the prevalence of vitamin A deficiency would not have been possible. Special thanks are due to ministries of health of the WHO Member States, WHO regional of-fices, and WHO country offices.
This report was made possible by the financial support of the Micronutrient Initiative, the Government of Luxem-bourg, the Centers for Disease Control and Prevention, and Sight and Life.
x GlObAl preVAlenCe Of VitAmin A DefiCienCy in pOpulAtiOns At risk 1995–2005
Abbreviations
GDP Gross domestic productHDI Human Development Index: a composite indicator of wealth, life expectancy and education developed by
the United Nations Development Programme.MDIS Micronutrient Deficiency Information SystemPreSAC Preschool-age children PW Pregnant womenSD Standard deviationUN United NationsVAD Vitamin A deficiencyVADD Vitamin A deficiency disordersVMNIS Vitamin and Mineral Nutrition Information System WHO World Health OrganizationXN Night blindness
1
1. Introduction
1. intrODuCtiOn
1.1 Vitamin A deficiency: a public health problem
Vitamin A deficiency (VAD) is a major nutritional concern in poor societies, especially in lower income countries. Its presence as a public health problem is assessed by measuring the prevalence of deficiency in a population, represented by specific biochemical and clinical indicators of status. The main underlying cause of VAD as a public health problem is a diet that is chronically insufficient in vitamin A that can lead to lower body stores and fail to meet physiologic needs (e.g. support tissue growth, normal metabolism, resistance to infection). Deficiency of sufficient duration or severity can lead to disorders that are common in vitamin A defi-cient populations such as xerophthalmia (xeros = dryness; -ophthalmia = pertaining to the eye), the leading cause of preventable childhood blindness, anaemia, and weakened host resistance to infection, which can increase the severity of infectious diseases and risk of death. A poor diet and in-fection frequently coexist and interact in populations where VAD is widespread. In such settings, VAD can increase the severity of infection which, in turn, can reduce intake and accelerate body losses of vitamin A to exacerbate deficiency. The prevalence and severity of xerophthalmia, anaemia and the (less-measurable) “vicious cycle” between VAD and in-fection in vulnerable groups (notably young children and pregnant or lactating mothers) represent the most compel-ling consequences of VAD and underlie its significance as a public health problem around the world.
1.1.1 EtiologyVitamin A is an essential nutrient needed in small amounts for the normal functioning of the visual system, and main-tenance of cell function for growth, epithelial integrity, red blood cell production, immunity and reproduction. Essen-tial nutrients cannot be synthesized by the body and there-fore must be provided through diet. When dietary intake is chronically low, there will be insufficient vitamin A to support vision and cellular processes, leading to impaired tissue function. Low vitamin A intake during nutrition-ally demanding periods in life, such as infancy, childhood, pregnancy and lactation, greatly raises the risk of health
consequences, or vitamin A deficiency disorders (VADD).Dietary deficiency can begin early in life, with colostrum
being discarded or breastfeeding being inadequate, thereby denying infants of their first, critical source of vitamin A (1). Thereafter, into adulthood, a diet deficient in vitamin A lacks foods containing either preformed vitamin A esters, such as liver, milk, cheese, eggs or food products fortified with vitamin A or lacking its carotenoid precursors (mainly beta-carotene), such as green leaves, carrots, ripe mangos, eggs, and other orange-yellow vegetables and fruits. Where animal source or fortified foods are minimally consumed, dietary adequacy must rely heavily on foods providing beta-carotene. However, while nutritious in many ways, a diet with modest amounts of vegetables and fruits as the sole source of vitamin A may not deliver adequate amounts, based on an intestinal carotenoid-to-retinol conversion ra-tio of 12:1 (2). This ratio reflects a conversion efficiency that is about half that previously thought, leading to greater ap-preciation for why VAD may coexist in cultures that heav-ily depend on vegetables and fruits as their sole or main dietary source of vitamin A.
Usually, VAD develops in an environment of ecological, social and economical deprivation, in which a chronically deficient dietary intake of vitamin A coexists with severe infections, such as measles, and frequent infections caus-ing diarrhoea and respiratory diseases that can lower intake through depressed appetite and absorption, and deplete body stores of vitamin A through excessive metabolism and excretion (3, 4). The consequent “synergism” can result in the body’s liver stores becoming depleted and peripheral tis-sue and serum retinol concentrations decreasing to deficient levels, raising the risks of xerophthalmia, further infection, other VADD and mortality.
1.1.2 Health consequencesVitamin A deficiency impairs numerous functions and, as a result, can lead to many health consequences, to which infants, young children and pregnant women appear to be at greatest risk. Xerophthalmia is the most specific VADD, and is the leading preventable cause of blindness in children throughout the world (5). Night blindness often appears
GlObAl preVAlenCe Of VitAmin A DefiCienCy in pOpulAtiOns At risk 1995–20052
during pregnancy, a likely consequence of preexisting, marginal maternal vitamin A status superimposed by nu-tritional demands of pregnancy and intercurrent infections (6 ). Anaemia can result from VAD in children and women, likely due to multiple apparent roles of vitamin A in sup-porting iron mobilization and transport, and hematopoiesis (7). Preexisting VAD appears to worsen infection (8) and vitamin A supplementation has been shown to reduce the risk of death in 6–59 month old children by about 23–30% (9–11). Three trials from southern Asia have reported that neonatal vitamin A supplementation reduced mortality by 21% in the first six months of life (12) while two other stud-ies conducted in Africa showed no impact of this interven-tion (13, 14). One study has reported an approximate 40% reduction in maternal mortality following routine dietary supplementation with vitamin A during pregnancy (15).
1.1.3 Assessing vitamin A status and deficiencyThe main objective of assessing vitamin A status is to deter-mine the magnitude, severity and distribution of VAD in a population. Most surveys assess its prevalence in young children and, with increasing frequency, in pregnant or lac-tating women, as reported here. Although VAD is likely to be widespread following the preschool years, few data exist to reveal the extent of VAD in school-age and young ado-lescent children (16 ). Estimating the national prevalence is to be encouraged as such data aids in targeting regions for interventions, and provides baseline values for monitor-ing population trends and intervention programme impact over time.
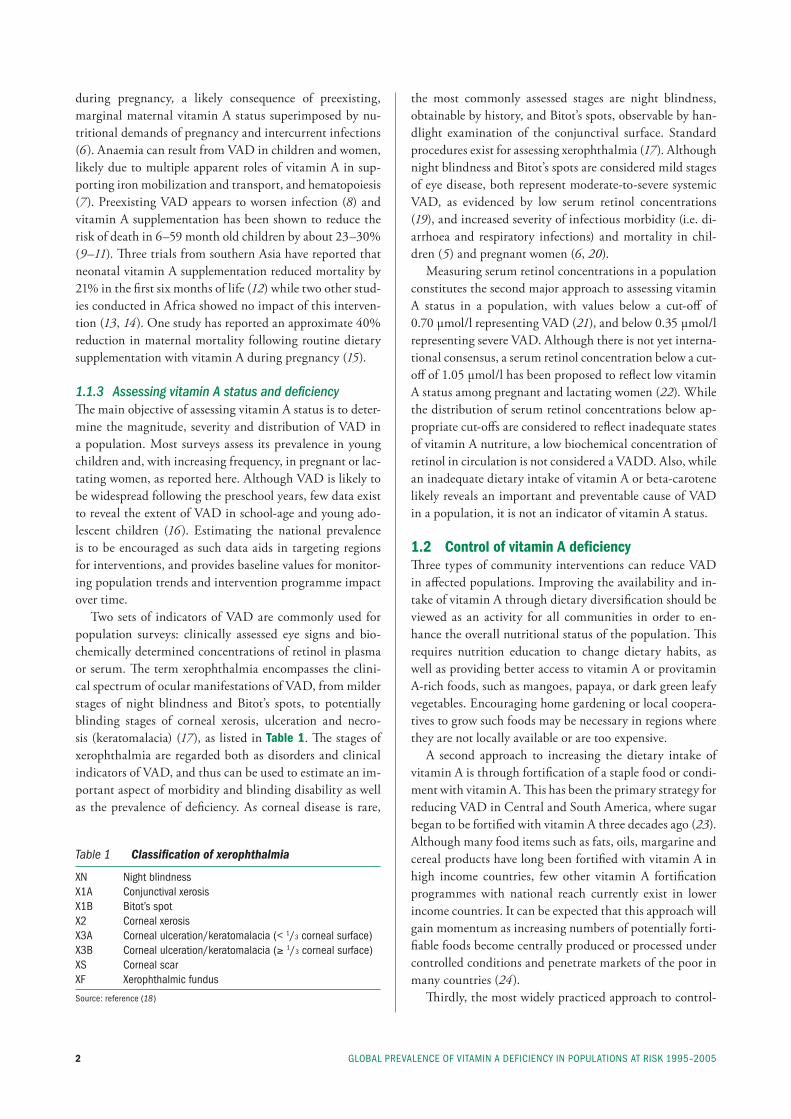
Two sets of indicators of VAD are commonly used for population surveys: clinically assessed eye signs and bio-chemically determined concentrations of retinol in plasma or serum. The term xerophthalmia encompasses the clini-cal spectrum of ocular manifestations of VAD, from milder stages of night blindness and Bitot’s spots, to potentially blinding stages of corneal xerosis, ulceration and necro-sis (keratomalacia) (17), as listed in Table 1. The stages of xerophthalmia are regarded both as disorders and clinical indicators of VAD, and thus can be used to estimate an im-portant aspect of morbidity and blinding disability as well as the prevalence of deficiency. As corneal disease is rare,
the most commonly assessed stages are night blindness, obtainable by history, and Bitot’s spots, observable by han-dlight examination of the conjunctival surface. Standard procedures exist for assessing xerophthalmia (17). Although night blindness and Bitot’s spots are considered mild stages of eye disease, both represent moderate-to-severe systemic VAD, as evidenced by low serum retinol concentrations (19), and increased severity of infectious morbidity (i.e. di-arrhoea and respiratory infections) and mortality in chil-dren (5) and pregnant women (6, 20).
Measuring serum retinol concentrations in a population constitutes the second major approach to assessing vitamin A status in a population, with values below a cut-off of 0.70 µmol/l representing VAD (21), and below 0.35 µmol/l representing severe VAD. Although there is not yet interna-tional consensus, a serum retinol concentration below a cut-off of 1.05 µmol/l has been proposed to reflect low vitamin A status among pregnant and lactating women (22). While the distribution of serum retinol concentrations below ap-propriate cut-offs are considered to reflect inadequate states of vitamin A nutriture, a low biochemical concentration of retinol in circulation is not considered a VADD. Also, while an inadequate dietary intake of vitamin A or beta-carotene likely reveals an important and preventable cause of VAD in a population, it is not an indicator of vitamin A status.
1.2 Control of vitamin A deficiencyThree types of community interventions can reduce VAD in affected populations. Improving the availability and in-take of vitamin A through dietary diversification should be viewed as an activity for all communities in order to en-hance the overall nutritional status of the population. This requires nutrition education to change dietary habits, as well as providing better access to vitamin A or provitamin A-rich foods, such as mangoes, papaya, or dark green leafy vegetables. Encouraging home gardening or local coopera-tives to grow such foods may be necessary in regions where they are not locally available or are too expensive.
A second approach to increasing the dietary intake of vitamin A is through fortification of a staple food or condi-ment with vitamin A. This has been the primary strategy for reducing VAD in Central and South America, where sugar began to be fortified with vitamin A three decades ago (23). Although many food items such as fats, oils, margarine and cereal products have long been fortified with vitamin A in high income countries, few other vitamin A fortification programmes with national reach currently exist in lower income countries. It can be expected that this approach will gain momentum as increasing numbers of potentially forti-fiable foods become centrally produced or processed under controlled conditions and penetrate markets of the poor in many countries (24).
Thirdly, the most widely practiced approach to control-
Table 1 Classification of xerophthalmia
Xn night blindnessX1A Conjunctival xerosisX1b bitot’s spotX2 Corneal xerosisX3A Corneal ulceration/keratomalacia (< 1/3 corneal surface)X3b Corneal ulceration/keratomalacia (≥ 1/3 corneal surface)Xs Corneal scarXf Xerophthalmic fundus
source: reference (18)
31. intrODuCtiOn
ling VAD in most high risk countries is the periodic deliv-ery of high-potency supplements, containing 200 000 IU of vitamin A, to preschool-age children (<5 years), with half this dose given to infants 6–11 months of age (25). In the past decade, vitamin A supplementation gained momentum as it was added to the annual Expanded Programme for Im-munization (EPI) visits, especially within the poliomyelitis eradication campaign, that has since continued as national child health week campaigns during which high-potency vitamin A is distributed twice yearly in many countries (26 ). While periodic vitamin A delivery in the community has been shown to reduce the risks of xerophthalmia (by ~90%) and mortality (by ~23–30%) in young children, the reasons for the modest and transient effect in raising popu-lation serum retinol concentrations (5), remain unclear.
Many high-risk countries have also adopted the WHO pol-icy of supplementing mothers with a 200 000 IU oral dose of vitamin A within six weeks after delivery (25) to enrich their breast milk content of vitamin A, although in practice coverage remains quite low.
These three broad approaches are largely viewed as com-plementary and should be combined, where it merits to do so, to achieve the greatest reductions in the prevalence and consequences of VAD. In addition, other public health and nutrition strategies that promote breastfeeding, use of oral rehydration therapy to treat diarrhoea, higher vaccine coverage (especially against measles), and adoption of family planning (to space the birth of children) can all be important in contributing to the control of VAD and its disorders.

4 GlObAl preVAlenCe Of VitAmin A DefiCienCy in pOpulAtiOns At risk 1995–2005
2. Methods
conducted between 1995 and 2006. Most surveys assessed nutritional status in women or preschool-age children.
2.2 Selection of survey dataThe time frame for the current estimates is 1995–2005 and survey data for WHO’s Member States were extracted from the database. Available data on both biochemical (serum/plasma retinol) and clinical (current or history of night blindness) VAD were selected for each country based on the administrative level for which the survey was representative and on the population group surveyed.
All countries with a 2005 gross domestic product (GDP) ≥US$ 15 000 were assumed to be free from VAD of a pub-lic health significance and were therefore excluded. None of these 37 countries had retinol or night blindness data reported for either preschool-age children or pregnant women.
2.2.1 Administrative levelSurveys were first selected according to the administrative level they represented. Surveys were considered as national when they were based on a nationally representative sam-ple of the population surveyed. Subnational surveys were selected only if a nationally representative survey was not available for the years 1995–2005. Subnational surveys are classified based on the population they represent: regional (multiple states), state (representative of the first adminis-trative level boundary), district (representative of the sec-ond administrative level boundary), or local surveys.
Seven surveys were included as national even though some areas within the country had been left out for security or other concerns. In one of these surveys, data available from an originally missing area was pooled with the na-tional data and weighted by the area’s general population estimate to provide a national estimate for that country. This proportion was determined by using the most recent census data. Three additional surveys were accepted as na-tional even though they were only representative of either the rural (Bangladesh, Cambodia) or urban (Cuba) popula-tions.
For the majority of countries with subnational data,
2.1 Data sources – The WHO Global Database on Vitamin A Deficiency
The current estimates are based on data available in the WHO Global Database on Vitamin A Deficiency (27); a part of the Vitamin and Mineral Nutrition Information System (VMNIS), maintained at WHO Headquarters in Geneva, Switzerland. This database compiles information on the prevalence of night blindness, other ocular signs of VAD, and blood retinol concentrations, regularly collect-ed from the scientific literature and through collaborators, including WHO regional and country offices, United Na-tions organizations, ministries of health, research and aca-demic institutions, and nongovernmental organizations. MEDLINE and WHO regional databases (African Index Medicus, Index Medicus for the WHO Eastern Mediter-ranean Region, Latin American and Caribbean Center on Health Sciences Information, Index Medicus for South-East Asia Region) were systematically searched. These resources were augmented by manual searching of arti-cles published in non-indexed medical and professional journals. Data were extracted from reports written in any language.
For inclusion in the database, a complete and original survey report providing details of the sampling method used is necessary. Serum or plasma retinol levels measured in capillary, venous, or umbilical cord blood using quan-titative methods are reported, usually together with the prevalence of VAD. Measures of clinical VAD may have included the prevalence of current night blindness (XN), history of maternal night blindness during a previous pregnancy (pXN), conjunctival xerosis (X1A), Bitot’s spot (X1B), corneal xerosis (X2), corneal ulceration/keratoma-lacia affecting <1/3 of the corneal surface (X3A) or ≥1/3 of the corneal surface (X3B), or corneal scarring (XS). Data are included in the database if they are representative of any administrative level within a country, including nationally representative data and surveys representative of a region within a country. Surveys conducted at the first or second administrative level boundary, or local surveys are also in-cluded. As of December 31, 2006, a total of 683 surveys were available in the database. Of these, 405 surveys were
5
surveys were representative of at least the first (state) level boundary. Exceptions to this were second (district) level boundary surveys used for Sao Tome and Principe, and Ghana. Most countries that used subnational surveys were represented by at least two states (first level boundaries). Exceptions to this principle were the surveys for Tajikistan and Uzbekistan, for which only one state was covered by the survey. When two or more surveys at the subnational level were available for the population group and country concerned within the acceptable time frame, the results were pooled into a single summary measure and weighted by the total population that the survey represented. The most recent population census data available between 1995 and 2005 was used for this. No local level surveys and most district level surveys were used in these estimates to reduce potential bias in the estimates.
In general, surveys with prevalence data based on a sample size of less than 100 subjects were excluded. This sample size, along with a confidence level of 95%, would result in an error ±10% if the prevalence estimate was 50% and the design effect was 1.0. If the sample size was less than 100, a larger error would result. However, a few excep-tions were made. National surveys with a sample size of less than 100, but greater than 50, were considered as nation-ally representative only when the results were being applied to a total population of less than 500 000 people (n=1 in preschool-age children), or to pregnant women (n=3) since the numbers in this group are frequently small, especially in populations with a lower rate of reproduction. One na-tional survey (Mexico) of pregnant women was excluded because the sample size was less than 50. One survey for retinol in pregnant women (Zimbabwe) and three surveys for night blindness in preschool-age children (Gambia, In-dia, Sri Lanka) did not report a sample size. In these cases, a sample size of 100 was used only to approximate variances and derive confidence intervals.
2.2.2 Population groupsTwo population groups were evaluated: preschool-age chil-dren (<5 years) and pregnant women (no age range defined). Where possible, children ≥5 years were excluded from the estimate for preschool-age children. However, there were 27 surveys with serum retinol data that used an alternative upper age limit ranging from 5 to 6 years, and one country (China) provided no disaggregated data and an upper age limit of 12 years had to be used. For night blindness, there were 17 surveys that used an alternative upper age limit ranging between 5 and 6 years, and one country (Mali) provided no disaggregated data and an upper age limit of 9 years had to be used.
Where possible, children less than 6 months of age were excluded for the estimates of biochemical VAD in pre-school-age children and children <2 years were excluded for
the estimates of night blindness in preschool-age children.For pregnant women, all ages and trimesters were in-
cluded. However, for the data on night blindness, the ma-jority of surveys were conducted by Measure Demographic and Health Surveys (DHS) and reported women’s history of night blindness during their most recent pregnancy in the previous 3–5 years that ended in a live birth. All preva-lence figures for pregnant women that were unadjusted for daytime visual problems were used. All surveys in pregnant women that provided only an adjusted value or a figure for current night blindness rather than a history of night blindness were excluded. The purpose for using unadjusted values only is that otherwise the data would imply that (a) women with daytime visual problems (presumably mostly representing myopia) would not be night blind; b) recall of daytime vision problems is 100% accurate, and (c) a posi-tive history of night blindness among women with daytime vision problems is 100% inaccurate, for which there is no clear evidence that these assumptions hold true in the present data.
2.3 Defining vitamin A deficiency2.3.1 Serum or plasma retinol thresholdThe WHO serum retinol threshold of <0.70 µmol/l was used to classify those at risk for biochemical VAD (28). For the studies that classified individuals by using the se-rum retinol threshold of <0.70 µmol/l, as recommended by WHO, the reported actual prevalence data were used without any additional calculations. When the prevalence was either not reported, or was reported for a non-WHO cut-off, the prevalence was estimated by one of the follow-ing methods in order of preference:
1. When the mean and standard deviation (SD) of the reti-nol concentration were available (n=1 for children, n=2 for pregnant women), the prevalence of serum retinol <0.70 µmol/l was calculated using these variables and as-suming that the serum retinol concentration is normally distributed. To validate this approach, the correlation between the estimated prevalence of serum retinol <0.70 µmol/l and the predicted prevalence of serum retinol <0.70 µmol/l was assessed in situations where a mean, a SD and a prevalence of serum retinol <0.70 µmol/l was provided. For the available data, which included mul-tiple points for some surveys because data were disag-gregated, the relationship between actual and predicted prevalence was plotted (n=71 for children; n=20 for preg-nant women). For the majority of studies, the two preva-lence figures were extremely close (children: R2=0.97, P <0.001; pregnant women: R2=0.91, P <0.001). On aver-age, the predicted prevalence underestimated the actual prevalence by 0.03 percentage points for children and 0.2 percentage points for pregnant women; this may be
2. metHODs
GlObAl preVAlenCe Of VitAmin A DefiCienCy in pOpulAtiOns At risk 1995–20056
taken as slightly conservative. For only two of the 71 val-ues in children, the predicted prevalence overestimated the observed prevalence of retinol <0.70 µmol/l by 10% or more. There were no cases of overestimation or under-estimation of more than 10% using the predicted equa-tion in pregnant women.
2. When the SD was not provided, but the prevalence for a non-WHO cut-off and the mean serum retinol con-centration were provided, these two figures were used to calculate the SD of the serum retinol concentration by assuming a normal distribution within the population and using the Z score. Using the proportion of values below a provided cut-off, the Z score was derived. The mean was subtracted from the provided cut-off and the resulting absolute value divided by the absolute value of the Z score. This provided an estimate of the SD in the population. Following this calculation, the mean and SD were used as above to derive the prevalence for the non-WHO cut-off. This method was used for two sur-veys in preschool-age children (Antigua and Barbuda, and Bhutan).
3. For three surveys in preschool-age children and two sur-veys in pregnant women, a mean, SD or the prevalence at the recommended threshold was not reported. However, these surveys did report a threshold (<0.87 µmol/l, or ~25 µg/dl) that was very close to the WHO recommend-ed cut-off (<0.70 µmol/l) for serum retinol. In these five cases, a SD of 0.35 µmol/l was assumed based on the literature and the prevalence of retinol <0.70 µmol/l was estimated using the reported prevalence of retinol <0.87 µmol/l and a SD of 0.35 µmol/l using the above meth-odology.
When data were provided for separate groups, such as data for children disaggregated by age, prevalence estimates were combined and weighted by sample size. If sample size information was missing from all data pooled, equal weight was given to each survey.
2.3.2 Estimated prevalence of night blindness and biochemical vitamin A deficiency for countries with no survey data
Some countries did not have any survey data that met the criteria for the estimates. Therefore, a regression model was developed using data from countries with a reported preva-lence of VAD and indicators of population health status so that the prevalence of VAD could be predicted for the countries without data. The indicators of population health status considered in the regression model include the fol-lowing:
• Human Development Index (HDI), 2002 (29)• Individual components of HDI
— Life expectancy at birth; adult literacy rate; the com-bined primary, secondary, and tertiary gross enroll-ment ratio (education); and GDP per capita (30)
• Under 5 mortality rate, 2003 (31)• Adult female mortality rate, 2003 (31)• Measles immunization coverage rates, 2003 (32)• Stunting, 20041 • Wasting, 20041
• Population growth rates (33)• Regional indicator variable• Any interaction term between the regional indicator
variable and the remaining variables
Fifteen countries (Afghanistan, Cook Islands, Democratic People’s Republic of Korea, Iraq, Kiribati, Liberia, Marshall Islands, Micronesia, Nauru, Niue, Palau, Serbia, Montene-gro, Somalia, Tuvalu) did not have an HDI; therefore, HDI was estimated with a regression model using two of the same components and one proxy indicator for educa-tion (average years of schooling in adults instead of adult literacy and gross enrollment in school) fitted to the group of countries with HDI estimates. This was used to derive and estimate HDI score for these 15 countries.
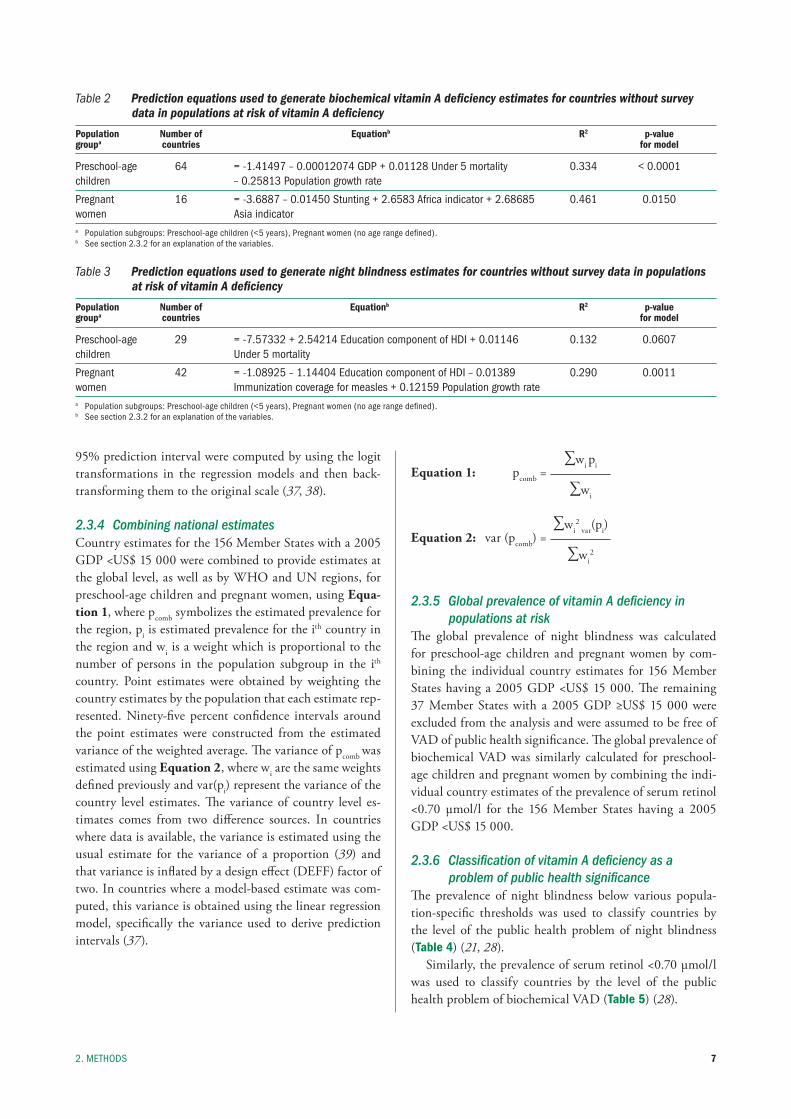
For the estimates of the prevalence of deficiency, four separate prediction equations were derived: one each for biochemical VAD in preschool-age children and pregnant women and one each for night blindness in preschool-age children and pregnant women.
The prevalence of biochemical VAD and night blindness was estimated by using the prediction equations (Tables 2 and 3) in countries where no information was available and only explanatory variables were known. In all cases, the prevalence was transformed to a logit scale to ensure non-negative predicted values.
2.3.3 Uncertainty of estimatesFor estimates based on survey data, each estimate was con-sidered to be representative of the entire country whether from a national or subnational sample, and the variance of the estimate was calculated using the logit transforma-tion. Since most surveys utilized a cluster sampling design, variance estimates were adjusted using a design effect of 2. From the point estimate of the prevalence and its variance, a 95% confidence interval was generated in logit scale and then transformed to the original scale (35, 36 ).
For regression-based estimates, a point estimate and
1 Based on analysis of 388 nationally representative studies for 139 coun-tries from the WHO Global Database on Child Growth and Malnutri-tion (http://www.who.int/nutgrowthdb/). These were used to estimate prevalence of child stunting and wasting for each country in the world according to the new WHO Child Growth Standards (34).
7
95% prediction interval were computed by using the logit transformations in the regression models and then back-transforming them to the original scale (37, 38).
2.3.4 Combining national estimatesCountry estimates for the 156 Member States with a 2005 GDP <US$ 15 000 were combined to provide estimates at the global level, as well as by WHO and UN regions, for preschool-age children and pregnant women, using Equa-tion 1, where pcomb symbolizes the estimated prevalence for the region, pi is estimated prevalence for the ith country in the region and wi is a weight which is proportional to the number of persons in the population subgroup in the ith
country. Point estimates were obtained by weighting the country estimates by the population that each estimate rep-resented. Ninety-five percent confidence intervals around the point estimates were constructed from the estimated variance of the weighted average. The variance of pcomb was estimated using Equation 2, where wi are the same weights defined previously and var(pi) represent the variance of the country level estimates. The variance of country level es-timates comes from two difference sources. In countries where data is available, the variance is estimated using the usual estimate for the variance of a proportion (39) and that variance is inflated by a design effect (DEFF) factor of two. In countries where a model-based estimate was com-puted, this variance is obtained using the linear regression model, specifically the variance used to derive prediction intervals (37).
∑wi piEquation 1: pcomb = ∑wi
∑wi2
var(pi)Equation 2: var (pcomb) = ∑wi
2
2.3.5 Global prevalence of vitamin A deficiency in populations at risk
The global prevalence of night blindness was calculated for preschool-age children and pregnant women by com-bining the individual country estimates for 156 Member States having a 2005 GDP <US$ 15 000. The remaining 37 Member States with a 2005 GDP ≥US$ 15 000 were excluded from the analysis and were assumed to be free of VAD of public health significance. The global prevalence of biochemical VAD was similarly calculated for preschool-age children and pregnant women by combining the indi-vidual country estimates of the prevalence of serum retinol <0.70 µmol/l for the 156 Member States having a 2005 GDP <US$ 15 000.
2.3.6 Classification of vitamin A deficiency as a problem of public health significance
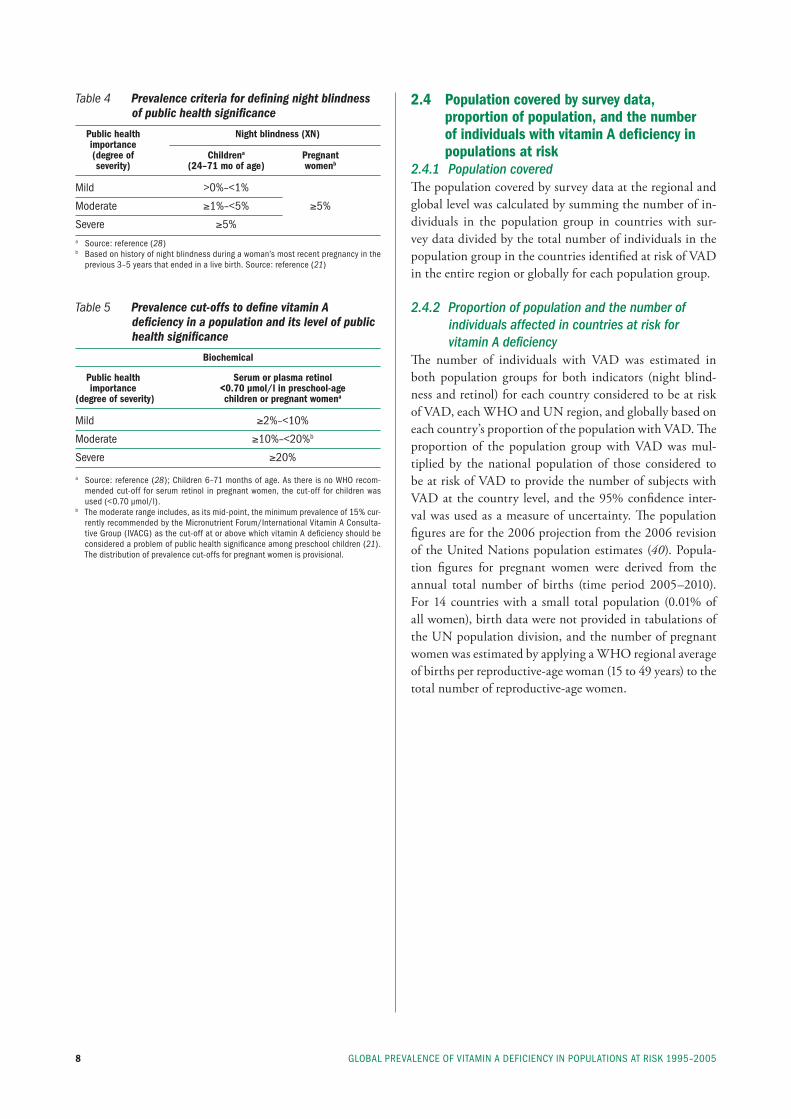
The prevalence of night blindness below various popula-tion-specific thresholds was used to classify countries by the level of the public health problem of night blindness (Table 4) (21, 28).
Similarly, the prevalence of serum retinol <0.70 µmol/l was used to classify countries by the level of the public health problem of biochemical VAD (Table 5) (28).
2. metHODs
Table 2 Prediction equations used to generate biochemical vitamin A deficiency estimates for countries without survey data in populations at risk of vitamin A deficiency
Population Number of Equationb R2 p-valuegroupa countries for model
preschool-age 64 = -1.41497 – 0.00012074 GDp + 0.01128 under 5 mortality 0.334 < 0.0001 children – 0.25813 population growth rate
pregnant 16 = -3.6887 – 0.01450 stunting + 2.6583 Africa indicator + 2.68685 0.461 0.0150 women Asia indicator a population subgroups: preschool-age children (<5 years), pregnant women (no age range defined).b see section 2.3.2 for an explanation of the variables.
Table 3 Prediction equations used to generate night blindness estimates for countries without survey data in populations at risk of vitamin A deficiency
Population Number of Equationb R2 p-valuegroupa countries for model
preschool-age 29 = -7.57332 + 2.54214 education component of HDi + 0.01146 0.132 0.0607 children under 5 mortality
pregnant 42 = -1.08925 – 1.14404 education component of HDi – 0.01389 0.290 0.0011 women immunization coverage for measles + 0.12159 population growth rate a population subgroups: preschool-age children (<5 years), pregnant women (no age range defined).b see section 2.3.2 for an explanation of the variables.
GlObAl preVAlenCe Of VitAmin A DefiCienCy in pOpulAtiOns At risk 1995–20058
2.4 Population covered by survey data, proportion of population, and the number of individuals with vitamin A deficiency in populations at risk
2.4.1 Population coveredThe population covered by survey data at the regional and global level was calculated by summing the number of in-dividuals in the population group in countries with sur-vey data divided by the total number of individuals in the population group in the countries identified at risk of VAD in the entire region or globally for each population group.
2.4.2 Proportion of population and the number of individuals affected in countries at risk for vitamin A deficiency
The number of individuals with VAD was estimated in both population groups for both indicators (night blind-ness and retinol) for each country considered to be at risk of VAD, each WHO and UN region, and globally based on each country’s proportion of the population with VAD. The proportion of the population group with VAD was mul-tiplied by the national population of those considered to be at risk of VAD to provide the number of subjects with VAD at the country level, and the 95% confidence inter-val was used as a measure of uncertainty. The population figures are for the 2006 projection from the 2006 revision of the United Nations population estimates (40). Popula-tion figures for pregnant women were derived from the annual total number of births (time period 2005–2010). For 14 countries with a small total population (0.01% of all women), birth data were not provided in tabulations of the UN population division, and the number of pregnant women was estimated by applying a WHO regional average of births per reproductive-age woman (15 to 49 years) to the total number of reproductive-age women.
Table 4 Prevalence criteria for defining night blindness of public health significance
Public health Night blindness (XN) importance (degree of Childrena Pregnant severity) (24–71 mo of age) womenb
mild >0%–<1%
moderate ≥1%–<5% ≥5%
severe ≥5% a source: reference (28)b based on history of night blindness during a woman’s most recent pregnancy in the
previous 3–5 years that ended in a live birth. source: reference (21)
Table 5 Prevalence cut-offs to define vitamin A deficiency in a population and its level of public health significance
Biochemical
Public health Serum or plasma retinol importance <0.70 µmol/l in preschool-age (degree of severity) children or pregnant womena
mild ≥2%–<10%
moderate ≥10%–<20%b
severe ≥20%
a source: reference (28); Children 6–71 months of age. As there is no WHO recom-mended cut-off for serum retinol in pregnant women, the cut-off for children was used (<0.70 µmol/l).
b the moderate range includes, as its mid-point, the minimum prevalence of 15% cur-rently recommended by the micronutrient forum/international Vitamin A Consulta-tive Group (iVACG) as the cut-off at or above which vitamin A deficiency should be considered a problem of public health significance among preschool children (21). the distribution of prevalence cut-offs for pregnant women is provisional.
9
3. Results and Discussion
proportion of preschool-age children and pregnant women covered by night blindness survey data was 54% and 55%, respectively, and by serum retinol survey data, 76% and 19%, respectively. By WHO region, the coverage varied drastically depending on the population group assessed and the indicator used. For night blindness in preschool-age children, data coverage was highest in South-East Asia (82.4%) and the Western Pacific (87.3%) and very low in Europe (1%) and nil in the Americas (0%). Survey cover-age for night blindness in pregnant women was the high-est in South-East Asia (96.8%) and the lowest in Europe
3. results AnD DisCussiOn
3.1 Results3.1.1 Population coveredOnly the 156 Member States which have a 2005 GDP <US$ 15 000 were considered to have populations at risk of VAD (Table 6). The 37 countries with a GDP ≥US$ 15 000 represent 9% and 8% of the total global preschool-age pop-ulation and pregnant women population, respectively, were assumed to be free of VAD of public health significance and were excluded from further analysis. Table 7 shows the population covered by surveys and their indicator preva-lence estimates, globally and by WHO region. Globally, the
Table 6 Population residing in countries with a 2005 GDP ≥ US$ 15 000 and excluded from estimations, expressed in number and percentage of the total population
WHO region Preschool-age childrena Pregnant women
Population (thousands) % of total population Population (thousands) % of total population
Africa (0)b 0 0 0 0Americas (3) 22 520 29 4 645 29south-east Asia (0) 0 0 0 0europe (24) 21 796 42 4 353 41eastern mediterranean (4) 679 1 150 1Western pacific (6) 9 790 8 1 871 8
Global (37) 54 786 9 11 019 8a population subgroups: preschool-age children (<5 years); pregnant women (no age range defined).b total number of countries with a 2005 GDp ≥us$ 15 000.
Table 7 Number of countries and percentage of population covered by night blindness and serum retinol prevalence surveys (national or subnational) conducted between 1995 and 2005, by WHO region in countries at risk of vitamin A deficiencya
WHO region Preschool-age childrenb Pregnant women
Night blindness Retinol Night blindness Retinol
Africa (46)c 14 (30.3)d 24 (78.8) 24 (69.8) 8 (30.9)Americas (32) 0 (0.0) 16 (49.8) 6 (14.9) 4 (0.6)south-east Asia (11) 5 (82.4) 6 (82.4) 8 (96.8) 3 (14.7)europe (29) 2 (1.0) 5 (17.8) 2 (1.3) 0 (0.0)eastern mediterranean (17) 4 (33.8) 6 (58.4) 2 (34.4) 2 (39.8)Western pacific (21) 7 (87.3) 10 (99.8) 3 (12.4) 2 (10.3)
Global (156) 32 (54.0) 67 (75.7) 45 (55.0) 19 (18.9)a excludes countries with a 2005 GDp ≥us$ 15 000.b population subgroups: preschool-age children (<5 years); pregnant women (no age range defined).c number of countries in each grouping.d percentage of population
GlObAl preVAlenCe Of VitAmin A DefiCienCy in pOpulAtiOns At risk 1995–200510
(1.3%). Survey coverage for serum retinol was the highest in the Western Pacific (99.8%) and the lowest in Europe (17.8%) for preschool-age children; however, for pregnant women, coverage was the highest in the Eastern Mediter-ranean (39.8%) and virtually nil for both Europe (0%) and the Americas (0.6%).
3.1.2 Proportion of population and number of individuals with vitamin A deficiency in populations at risk
Globally, night blindness affects 5.2 million preschool-age children (95% CI: 2.0–8.4 million) and 9.8 million
pregnant women (95% CI: 8.7–10.8 million), which corre-sponds to 0.9% and 7.8% of the population at risk of VAD, respectively (Table 8). Low serum retinol concentration (<0.70 µmol/l) affects an estimated 190 million preschool-age children (95% CI: 178–202 million) and 19.1 million pregnant women (95% CI: 9.30–29.0 million) globally. This corresponds to 33.3% of the preschool-age population and 15.3% of pregnant women in populations at risk of VAD, globally (Table 9).
WHO regional estimates indicate that the highest pro-portion of preschool-age children affected by night blind-ness, 2.0%, is in Africa, a value that is four times higher
Table 8 Global prevalence of night blindness and number of individuals affected in populations of countries at risk of vitamin A deficiency 1995–2005
Population groupa Prevalence of night blindness Population affected
Percentb 95% CI Number (million) 95% CI
preschool-age children 0.9 0.3–1.5 5.17 1.99–8.38pregnant women 7.8 7.0–8.7 9.75 8.70–10.8
a population subgroups: preschool-age children (<5 years); pregnant women (no age range defined).b numerator and denominator exclude countries with a 2005 GDp ≥us$ 15 000.
Table 9 Global prevalence of serum retinol concentrations <0.70 µmol/l and number of individuals affected in populations of countries at risk of vitamin A deficiency 1995–2005
Population groupa Prevalence of serum retinol <0.70 µmol/l Population affected
Percentb 95% CI Number (million) 95% CI
preschool-age children 33.3 31.1–35.4 190 178–202pregnant women 15.3 7.4–23.2 19.1 9.30–29.0
a population subgroups: preschool-age children (<5 years); pregnant women (no age range defined).b numerator and denominator exclude countries with a 2005 GDp ≥us$ 15 000.
Table 10 Prevalence of night blindness and number of individuals affected among preschool-age children and pregnant women in populations of countries at risk of vitamin A deficiency 1995–2005, globally and by WHO region
WHO region Preschool-age childrena Pregnant women
Prevalenceb (%) # affected (millions) Prevalence (%) # affected (millions)
Africa 2.0 2.55 9.8 3.02 (0.8–3.2)c (0.99–4.11) (8.4–11.1) (2.59–3.44)
Americas 0.6 0.36 4.4 0.50 (0.0–1.3) (0.00–0.75) (2.7–6.2) (0.30–0.70)
south-east Asia 0.5 1.01 9.9 3.84 (0.0–2.0) (0.00–3.75) (9.5–10.3) (3.69–4.00)
europe 0.8 0.24 3.5 0.22 (0.1–1.5) (0.04–0.44) (1.8–5.3) (0.11–0.33)
eastern mediterranean 1.2 0.77 7.2 1.09 (0.6–1.7) (0.41–1.12) (5.2–9.2) (0.78–1.39)
Western pacific 0.2 0.26 4.8 1.09 (0.0–0.4) (0.02–0.50) (0.9–8.6) (0.20–1.97)
Global 0.9 5.17 7.8 9.75 (0.3–1.5) (1.97–8.38) (7.0–8.7) (8.70–10.8)
a population subgroups: preschool-age children (<5 years); pregnant women (no age range defined). b numerator and denominator excludes countries with a 2005 GDp ≥us$ 15 000.c 95% Confidence intervals.
113. results AnD DisCussiOn
Table 11 Prevalence of serum retinol <0.70 µmol/l and number of individuals affected among preschool-age children and pregnant women in populations of countries at risk of vitamin A deficiency 1995–2005, globally and by WHO region
WHO region Preschool-age childrena Pregnant women
Prevalenceb (%) # affected (millions) Prevalence (%) # affected (millions)
Africa 44.4 56.4 13.5 4.18 (41.3–47.5)c (52.4–60.3) (8.9–18.2) (2.73–5.63)
Americas 15.6 8.68 2.0 0.23 (6.6–24.5) (3.70–13.7) (0.4–3.6) (0.04–0.41)
south-east Asia 49.9 91.5 17.3 6.69 (45.1–54.8) (82.6–100) (0.0–36.2) (0.00–14.0)
europe 19.7 5.81 11.6 0.72 (9.7–29.6) (2.87–8.75) (2.6–20.6) (0.16–1.29)
eastern mediterranean 20.4 13.2 16.1 2.42 (13.2–27.6) (8.54–17.9) (9.2–23.1) (1.38–3.47)
Western pacific 12.9 14.3 21.5 4.90 (12.3–13.5) (13.6–14.9) (0.0–49.2) (0.00–11.2)
Global 33.3 190 15.3 19.1 (31.1–35.4) (178–202) (7.4–23.2) (9.30–29.0)
a population subgroups: preschool-age children (<5 years); pregnant women (no age range defined).b numerator and denominator excludes countries with a 2005 GDp ≥us$ 15 000.c 95% Confidence intervals.
Table 12 Number of countries categorized by public health significance of night blindness 1995–2005a
Public health problemb Preschool-age childrenc Pregnant women
Number of countries Number of countries
none 4 90mild 107 moderate 42 66 severe 3
a excludes 37 countries with a 2005 GDp ≥us$ 15 000.b the prevalence of night blindness as a public health problem in preschool-age chil-
dren is categorized as follows: ≤0%, no public health problem; >0–<1%, mild pub-lic health problem; ≥1–<5%, moderate public health problem; ≥5%, severe public health problem. the prevalence of night blindness as a public health problem in pregnant women is categorized as ≥5% (21).
c population groups: preschool-age children (<5 years); pregnant women (no age range defined).
Table 13 Number of countries categorized by public health significance of vitamin A deficiency defined by the prevalence of serum retinol concentrations <0.70 µmol/l 1995–2005a
Public health problemb Preschool-age childrenc Pregnant women
Number of countries Number of countries
none 2 20mild 32 48moderate 49 57severe 73 31
a excludes 37 countries with a 2005 GDp ≥us$ 15 000.b the prevalence of serum retinol <0.70 µmol/l as a public health problem in both
preschool-age children and pregnant women is categorized as follows: <2%, no public health problem; ≥2–<10%, mild public health problem; ≥10–<20%, moder-ate public health problem; ≥20%, severe public health problem.
c population groups: preschool-age children (<5 years); pregnant women (no age range defined).
than estimated in South-East Asia (0.5%). This also means that Africa has the greatest number of preschool-age chil-dren affected with night blindness (2.55 million), and cor-responds to almost half of the children affected globally (Table 10). A comparable and high proportion of pregnant women affected by night blindness are in Africa (9.8%) and South-East Asia (9.9%), each of which is estimated to have over 3 million pregnant women affected, or one third of the pregnant women affected globally.
The estimates show that the Africa and South-East Asia regions also contain the highest proportions of preschool-age children with biochemical VAD, as indicated by a se-rum retinol concentration <0.70 µmol/l, with South-East Asia having the greatest number of children and pregnant women affected (Table 11).
3.1.3 Public health significance of vitamin A deficiencyThe prevalence of night blindness is of moderate to severe public health significance in 45 countries for preschool-age children and 66 countries for pregnant women (Table 12). According to current estimates, 122 countries are classified as having a moderate to severe public health problem based on biochemical VAD in preschool-age children; while 88 countries are classified as having a problem of moderate to severe public health significance with respect to biochemi-cal VAD in pregnant women (Table 13).
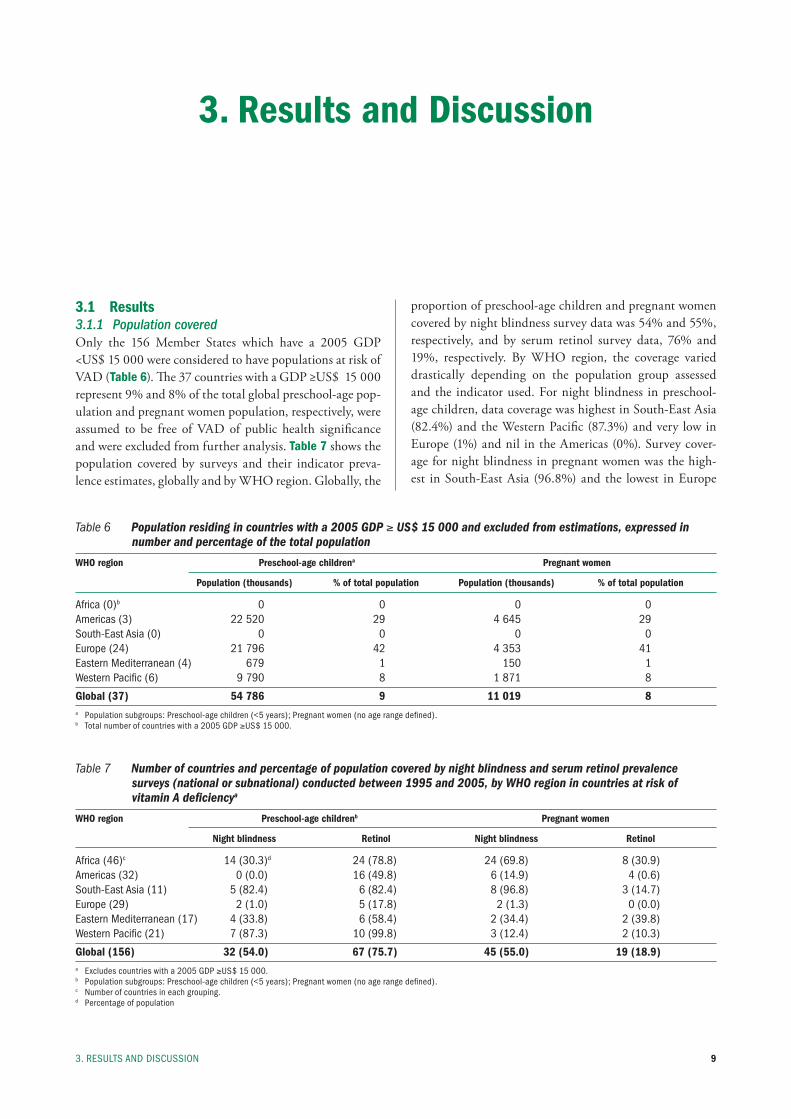
The level of the public health problem of both night blindness and biochemical VAD across countries is illus-trated by maps for preschool-age children and pregnant women in Figures 1–4.
GlObAl preVAlenCe Of VitAmin A DefiCienCy in pOpulAtiOns At risk 1995–200512
Figure 1 Night blindness as a public health problem by country 1995–2005: Preschool-age children a) Countries and areas with survey data
Category of public health significance (prevalence of night blindness)
None
Mild Mild (>0% – <1%)
Moderate (≥1% – <5%)
Severe (>5%)
No data
b) Countries and areas with survey data and regression-based estimates
Category of public health significance (prevalence of night blindness)
None
Mild Mild (>0% – <1%)
Moderate (≥1% – <5%)
Severe (>5%)
GDP ≥US$ 15 000 (countries assumed to be free of vitamin A deficiency of public health significance)
No data

13
Figure 2 Biochemical vitamin A deficiency (retinol) as a public health problem by country 1995–2005: Preschool-age children a) Countries and areas with survey data
b) Countries and areas with survey data and regression-based estimates
Category of public health significance (prevalence of serum retinol <0.70 µmol/l)
None (<2%)
Mild (≥2% – <10%)
Moderate (≥10% – <20%)
Severe (_>20%)
No data
Category of public health significance (prevalence of serum retinol <0.70 µmol/l)
None (<2%)
Mild (≥2% – <10%)
Moderate (≥10% – <20%)
Severe (≥20%)
GDP ≥US$ 15 000 (countries assumed to be free of vitamin A deficiency of public health significance)
No data
3. results AnD DisCussiOn
GlObAl preVAlenCe Of VitAmin A DefiCienCy in pOpulAtiOns At risk 1995–200514
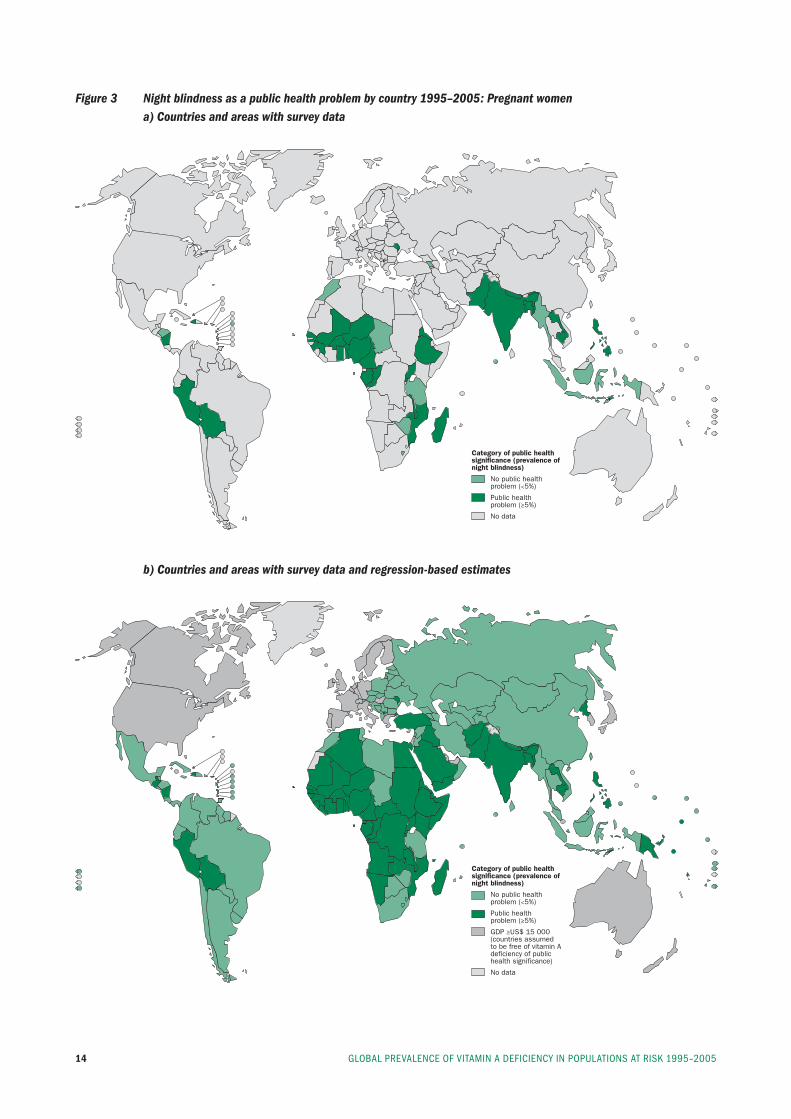
Figure 3 Night blindness as a public health problem by country 1995–2005: Pregnant women a) Countries and areas with survey data
b) Countries and areas with survey data and regression-based estimates
Category of public health significance (prevalence of night blindness)
No public health problem (<5%)
Public health problem (≥5%)
No data
Category of public health significance (prevalence of night blindness)
No public health problem (<5%)
Public health problem (≥5%)
GDP ≥US$ 15 000 (countries assumed to be free of vitamin A deficiency of public health significance)
No data
15
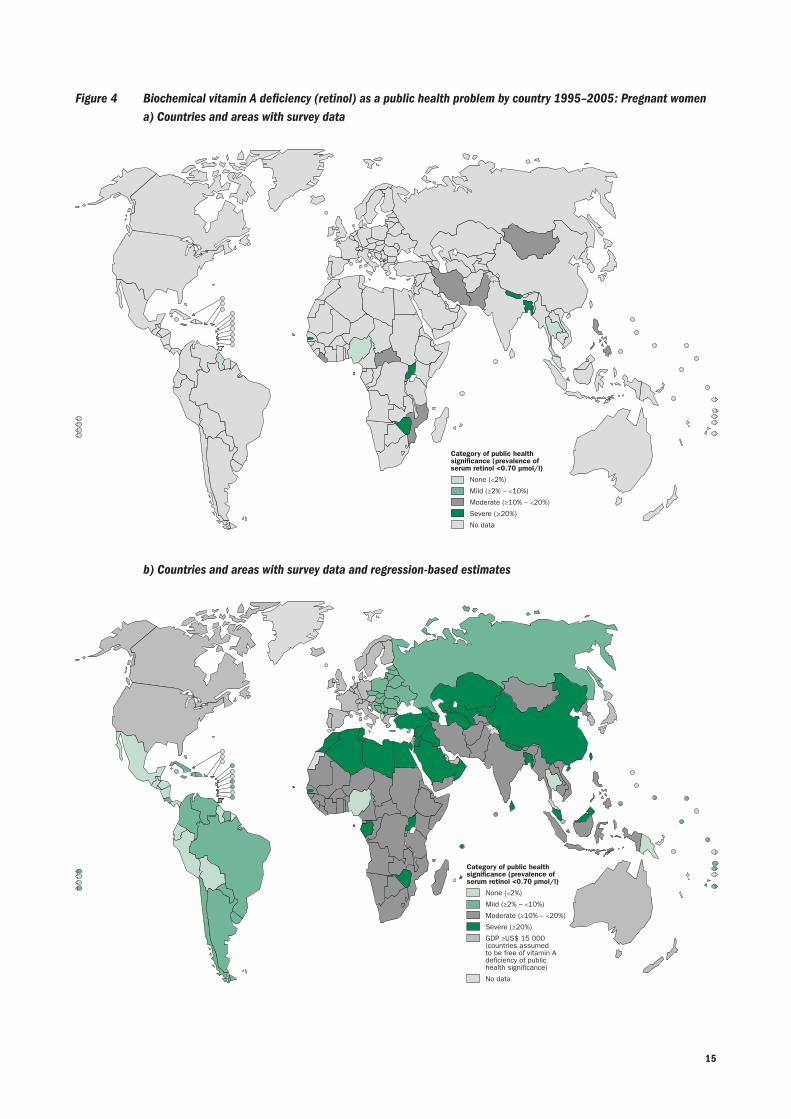
Figure 4 Biochemical vitamin A deficiency (retinol) as a public health problem by country 1995–2005: Pregnant women a) Countries and areas with survey data
b) Countries and areas with survey data and regression-based estimates
Category of public health significance (prevalence of serum retinol <0.70 µmol/l)
None (<2%)
Mild (≥2% – <10%)
Moderate (≥10% – <20%)
Severe (_>20%)
No data
Category of public health significance (prevalence of serum retinol <0.70 µmol/l)
None (<2%)
Mild (≥2% – <10%)
Moderate (≥10% – <20%)
Severe (≥20%)
GDP ≥US$ 15 000 (countries assumed to be free of vitamin A deficiency of public health significance)
No data
GlObAl preVAlenCe Of VitAmin A DefiCienCy in pOpulAtiOns At risk 1995–200516
3.2 Discussion3.2.1 Population coveredPreschool-age children and pregnant women are consid-ered to be populations most at-risk for VAD due to their increased demands for vitamin A and the potential health consequences associated with VAD during these life stages. Thus, the estimates presented here are specific to children under 5 years of age and pregnant women. This report does not address VAD as a public health problem in all other age groups due to lack of adequate data and understanding of the public health importance of VAD at other ages (a research priority). We also assume that VAD is not a pub-lic health problem for preschool-age children and pregnant women residing in the 37 countries identified as having a GDP ≥US$ 15 000, who have been excluded from this analysis and consideration.
About half of the global populations of both preschool-age children and pregnant women considered to be at risk of VAD were covered by survey data for this report. Cover-age was considerably greater (76%) for serum retinol in pre-school-age children than in pregnant women (19%) where, however, it remains low.
3.2.2 Strengths of estimatesThis report utilizes the most up-to-date data published as of December 31, 2006 for the years 1995–2005. These es-timates are based on the greatest number of VAD surveys conducted in preschool-age children and pregnant women to date. Where probabilistic, representative surveys have not been conducted in the 10 year inclusion period, survey estimates are complemented by regression-based estimates.
Use of GDP ≥US$ 15 000 to classify a country as high income and assuming that they are not at risk of VAD of public health significance is arbitrary. Although there is lit-tle survey data available in these countries to support this assumption, the exclusion is supported by a usual tendency for VAD risk to decline with rising socioeconomic status, most clearly evident in its association with xerophthalmia (41–44). A second reason for excluding higher income countries from analysis was to improve the predictability of the regression models and to help place focus on areas where VAD is likely to be of public health significance.
3.2.3 Proportion of population and the number of individuals with vitamin A deficiency in populations at risk
Approximately one third of the world’s preschool-age popu-lation is estimated to be vitamin A deficient, with just less than 1% being night blind at a given time. The WHO re-gions of Africa and South-East Asia have the highest burden of VAD, reflected by deficient concentrations of the vitamin in circulation, where 44–50% of preschool-age children are affected. Most vitamin A deficient children live in South-
East Asia, where 91.5 million preschool-age children have serum retinol concentrations <0.70 µmol/l.
The prevalence of VAD in pregnant women is likely low-er than in preschool-age children, though this may in part be attributable to a lingering lack of data in this life stage. Still, the problem is of immense proportion. Globally, approximately 15% of pregnant women are estimated to be vitamin A deficient (biochemically) and 8% are night blind, respectively. Again, the WHO regions of Africa and South-East Asia have the highest risk of deficiency and carry the majority of the burden.
3.2.4 Classification of countries by degree of public health significance of vitamin A deficiency
Vitamin A deficiency, as indicated by either night blindness or biochemical deficiency, is present in a moderate to severe degree in preschool-age children in 45 and 122 countries, respectively, out of the 193 WHO Member States. Vitamin A deficiency in pregnant women is less prevalent than in preschool-age children; however, still either night blind-ness or biochemical VAD is present as a moderate to severe problem in 66 and 88 countries, respectively. Targeting women to achieve a safe and nutritionally adequate intake of vitamin A during pregnancy could improve the health of both women and their infants.
3.2.5 Comparison to previous estimatesSeveral estimates of VAD at the global level have been con-ducted in the past for preschool-age children. However, it is difficult to meaningfully compare these estimates as the methodology used to derive them has varied considerably.
The most recent previous global estimates of VAD con-ducted by WHO were in 1995, based on both clinical (xerophthalmia) and biochemical (serum retinol concentra-tions <0.70 µmol/l) evidence of VAD (44). At that time, it was estimated that 60 countries had clinical and biochemi-cal forms of severe and moderate degrees of public health significance, and was likely to be a problem in an additional 13 countries. The current WHO global estimates of VAD presented here indicate that 45 and 122 countries have a moderate or severe public health problem of night blind-ness or biochemical VAD, respectively. In 1995, it was esti-mated that clinical VAD affected approximately 3 million and biochemical VAD affected approximately 251 million preschool-age children each year (Table 14).
Since 1995, several other groups have also generated global estimates of VAD. In 1998, alternative methodol-ogy was used for data collected between 1985 and 1995 to estimate that clinical VAD (night blindness and Bitot’s spots) affected about 3.3 million preschool children (45). These estimates suggested that that biochemical VAD (se-rum retinol concentration <0.70 µmol/l) affected about 75–140 million preschool children each year. In 2002,
173. results AnD DisCussiOn
West estimated that 127 million preschool-age children are vitamin A deficient, defined as a serum retinol concentra-tion <0.70 µmol/l or abnormal conjunctival impression cy-tology, in the developing world, of whom 4.4 million have xerophthalmia (including night blindness, Bitot’s spots, and corneal xerophthalmia) (22). These estimates showed that nearly half of the world’s children with xerophtalmia resided in South and South-East Asia, of whom over 85% live in India.
In 2004, the Micronutrient Initiative and UNICEF worked in collaboration with Tulane University to up-date their 1998 estimates of VAD for the year 2000 (46, 47). They estimated that clinical VAD (night blindness and Bitot’s spots) and biochemical VAD (serum retinol concentration <0.70 µmol/l) affected 7.0 and 219 million preschool-age children, respectively.
The first estimates of VAD in pregnant women were made by West (22) for the year 2000. He estimated that 19.8 million pregnant women in a given year have low vita-min A status (serum retinol or breast milk concentrations <1.05 µmol/l), of whom 7.2 million were deficient in vita-min A. (<0.70 µmol/l) and 6.2 million experience gesta-tional night blindness. These estimates found that nearly two-thirds of the world’s nightblind women lived in South and South-East Asia.
Although these numbers are very difficult to compare due to differences in the methodology used to produce them, considering the growth of the world’s population, there appears to be some indication that the number of preschool-age children affected by xerophthalmia may be decreasing, but that the number of preschool-age chil-dren and pregnant women with biochemical VAD, based on deficient serum concentrations of retinol, is increasing, possibly due to better methods of assessment and a wider population being assessed.
3.2.6 Limitations of estimates Estimates of the extent and severity of VAD in this report have practical limitations imposed by the absence, untimely, partially representative, or uncertain technical quality of
data. In the current situation, only 12–42% of the countries had survey data (national or subnational) that met inclusion criteria. Other countries suspected to harbour populations at risk of VAD had no population data, requiring estimates to be derived from regression models employing available cov-ariates shown to be predictive in countries with data. Also, a number of countries in specific regions had no data or very little data for one of the indicators. In this respect, modelled estimates of the prevalence of biochemical VAD should be interpreted with caution since they are based primarily on re-gression-based estimates. These figures should be considered “place holders” until measured survey data become available and should serve to emphasize the “work-in-progress” nature of this report. Although the majority of the survey data was collected in nationally representative samples, the regression-based estimates only explained 13–46% of the variation in VAD prevalence among countries with survey data.
Estimates of prevalence were based on a number of as-sumptions. All surveys were treated equally, although their methodological quality varied greatly. For example, most surveys used multi-stage cluster sampling proportionate to the population size within the country, but not all did, and in some national surveys, specific areas had to be left out due to security or accessibility issues. Furthermore for some preschool-age children, the population sampled cov-ered only a portion of the desired age range (e.g. children 12–23 months) or covered ages outside the age range. For the purpose of our analysis, these surveys were considered equal to those that covered the entire age range. However, an estimate from children equally distributed among the age ranges would be more appropriate. Additionally, it is very difficult to measure night blindness in children less than 2 years of age, but it was usually not possible to ex-clude this age group from the analysis.
Depending on the indicator and the population group, there were 1–12 countries for which subnational data were used to generate prevalence estimates in preschool-age chil-dren and pregnant women, and these data may result in an over- or under-estimation of the prevalence for those countries.
Table 14 Comparison of the most recent global estimates of vitamin A deficiency
Number affected by Number affected by serum retinol xerophthalmia (millions) <0.70 µmol/l (millions)
Reference year Preschool-age children Pregnant women Preschool-age children Pregnant women
WHO 2009 2006a 5.2 9.8 190 19.1
West 2002 (22, 49) 2001 4.4 6.2 127 7.2
uniCef/mi 2004 (45) 2000 7.0 219
mi/uniCef/tulane 1998 (44) 1995 3.3 75–140
WHO 1995 (40) 1994 2.8 251
a based on data collected between 1995 and 2005, and using population figures from 2006.
GlObAl preVAlenCe Of VitAmin A DefiCienCy in pOpulAtiOns At risk 1995–200518
A limitation of using serum (plasma) retinol concentra-tion as an indicator of vitamin A status is that it is decreased by acute and underlying chronic infections (8). The major-ity of surveys do not utilize an indicator of infection status at the time in which retinol is assessed. Concurrent data on infection status would not alter the indicator-based (i.e. serum retinol) estimates of prevalence but could influence the interpretation of survey findings with respect to cause of apparent deficiency (48).
In some cases, the prevalence of serum retinol concen-trations <0.70 µmol/l was calculated using the mean retinol concentration and assuming that retinol values were nor-mally distributed, an assumption that appears to be largely supported by existing reports of population-based serum retinol distributions. Additionally, data for night blindness during a women’s most recent birth within the previous five years that ended in a live birth was not adjusted for any day time visual problems. Therefore, we may be overestimating the true prevalence of night blindness if there is a high prev-alence of women with day time visual problems in these populations. Some initial surveys had to be excluded from analysis because they either only reported a prevalence of night blindness that was adjusted for day time visual prob-lems, and was therefore not comparable to the unadjusted estimates, or a figure was reported only for current night blindness, which did not account for trimester of the preg-nancy. Because it is expected that the prevalence of night blindness is highest towards the end of pregnancy, these figures were not comparable to the unadjusted values of a history of night blindness during a previous pregnancy.
3.3 ConclusionsThe data available for these estimates are the most repre-sentative data to date. The estimates are the most accurate reflection of the global prevalence of night blindness and biochemical VAD up until this point in time. However, some countries have conducted surveys since 2005 but were not included here due to the time frame of 1995–2005 that was established for these specific estimates. Countries with-out survey data are highly encouraged to collect data on a regular basis (every 3–5 years). Regression-based estimates are appropriate for the regional and global levels, but may not accurately reflect the situation in an individual country given the variation explained by the current models.
The maintenance of the WHO Global Database on Vitamin A Deficiency and the periodic generation of esti-mates of deficiency provide a valuable tool for tracking the global progress of eliminating VAD and the effectiveness of the current strategies for its control. Hopefully, these estimates will encourage countries to plan routine surveys which assess the prevalence of VAD and the factors that may be contributing to its development, including the in-cidence of infectious diseases. The understanding of how the prevalence of VAD and the factors related to its devel-opment vary by population subgroup, geography, level of development, and other social and economic factors will make interventions easier to select and target to the most appropriate populations.
19
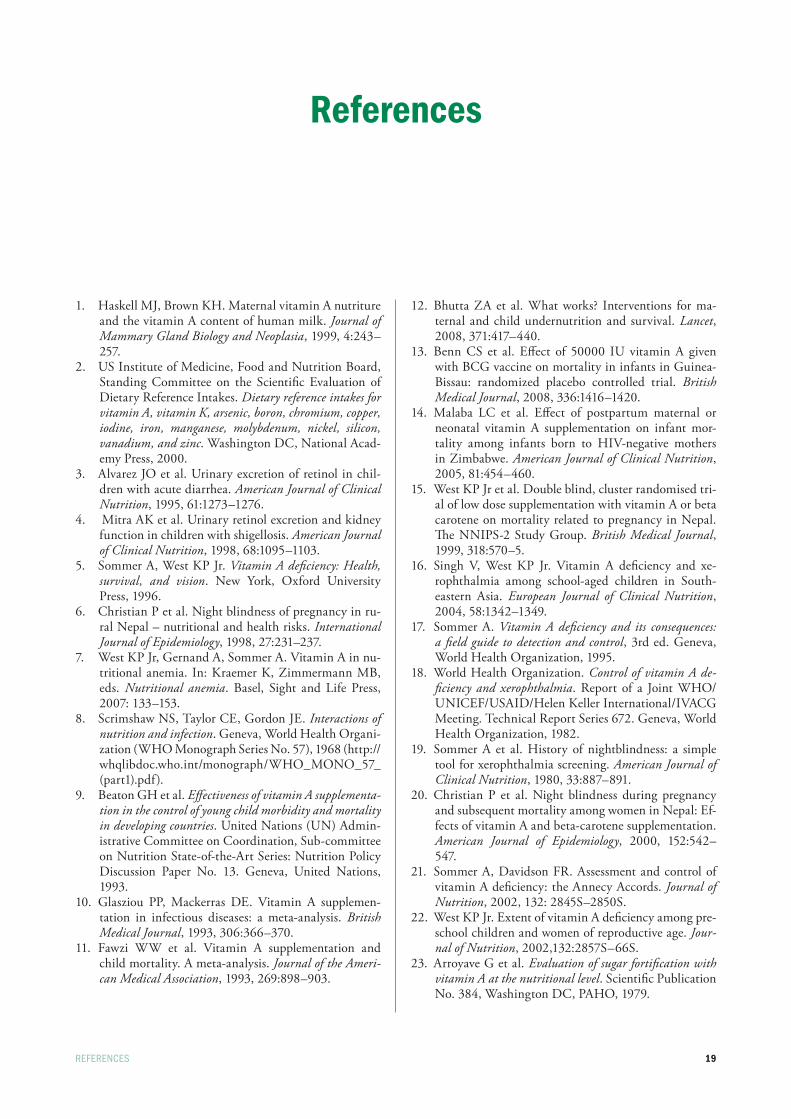
References
1. Haskell MJ, Brown KH. Maternal vitamin A nutriture and the vitamin A content of human milk. Journal of Mammary Gland Biology and Neoplasia, 1999, 4:243–257.
2. US Institute of Medicine, Food and Nutrition Board, Standing Committee on the Scientific Evaluation of Dietary Reference Intakes. Dietary reference intakes for vitamin A, vitamin K, arsenic, boron, chromium, copper, iodine, iron, manganese, molybdenum, nickel, silicon, vanadium, and zinc. Washington DC, National Acad-emy Press, 2000.
3. Alvarez JO et al. Urinary excretion of retinol in chil-dren with acute diarrhea. American Journal of Clinical Nutrition, 1995, 61:1273–1276.
4. Mitra AK et al. Urinary retinol excretion and kidney function in children with shigellosis. American Journal of Clinical Nutrition, 1998, 68:1095–1103.
5. Sommer A, West KP Jr. Vitamin A deficiency: Health, survival, and vision. New York, Oxford University Press, 1996.
6. Christian P et al. Night blindness of pregnancy in ru-ral Nepal – nutritional and health risks. International Journal of Epidemiology, 1998, 27:231–237.
7. West KP Jr, Gernand A, Sommer A. Vitamin A in nu-tritional anemia. In: Kraemer K, Zimmermann MB, eds. Nutritional anemia. Basel, Sight and Life Press, 2007: 133–153.
8. Scrimshaw NS, Taylor CE, Gordon JE. Interactions of nutrition and infection. Geneva, World Health Organi-zation (WHO Monograph Series No. 57), 1968 (http://whqlibdoc.who.int/monograph/WHO_MONO_57_(part1).pdf).
9. Beaton GH et al. Effectiveness of vitamin A supplementa-tion in the control of young child morbidity and mortality in developing countries. United Nations (UN) Admin-istrative Committee on Coordination, Sub-committee on Nutrition State-of-the-Art Series: Nutrition Policy Discussion Paper No. 13. Geneva, United Nations, 1993.
10. Glasziou PP, Mackerras DE. Vitamin A supplemen-tation in infectious diseases: a meta-analysis. British Medical Journal, 1993, 306:366–370.
11. Fawzi WW et al. Vitamin A supplementation and child mortality. A meta-analysis. Journal of the Ameri-can Medical Association, 1993, 269:898–903.
12. Bhutta ZA et al. What works? Interventions for ma-ternal and child undernutrition and survival. Lancet, 2008, 371:417–440.
13. Benn CS et al. Effect of 50000 IU vitamin A given with BCG vaccine on mortality in infants in Guinea-Bissau: randomized placebo controlled trial. British Medical Journal, 2008, 336:1416–1420.
14. Malaba LC et al. Effect of postpartum maternal or neonatal vitamin A supplementation on infant mor-tality among infants born to HIV-negative mothers in Zimbabwe. American Journal of Clinical Nutrition, 2005, 81:454–460.
15. West KP Jr et al. Double blind, cluster randomised tri-al of low dose supplementation with vitamin A or beta carotene on mortality related to pregnancy in Nepal. The NNIPS-2 Study Group. British Medical Journal, 1999, 318:570–5.
16. Singh V, West KP Jr. Vitamin A deficiency and xe-rophthalmia among school-aged children in South-eastern Asia. European Journal of Clinical Nutrition, 2004, 58:1342–1349.
17. Sommer A. Vitamin A deficiency and its consequences: a field guide to detection and control, 3rd ed. Geneva, World Health Organization, 1995.
18. World Health Organization. Control of vitamin A de-ficiency and xerophthalmia. Report of a Joint WHO/UNICEF/USAID/Helen Keller International/IVACG Meeting. Technical Report Series 672. Geneva, World Health Organization, 1982.
19. Sommer A et al. History of nightblindness: a simple tool for xerophthalmia screening. American Journal of Clinical Nutrition, 1980, 33:887–891.
20. Christian P et al. Night blindness during pregnancy and subsequent mortality among women in Nepal: Ef-fects of vitamin A and beta-carotene supplementation. American Journal of Epidemiology, 2000, 152:542–547.
21. Sommer A, Davidson FR. Assessment and control of vitamin A deficiency: the Annecy Accords. Journal of Nutrition, 2002, 132: 2845S–2850S.
22. West KP Jr. Extent of vitamin A deficiency among pre-school children and women of reproductive age. Jour-nal of Nutrition, 2002,132:2857S–66S.
23. Arroyave G et al. Evaluation of sugar fortification with vitamin A at the nutritional level. Scientific Publication No. 384, Washington DC, PAHO, 1979.
referenCes
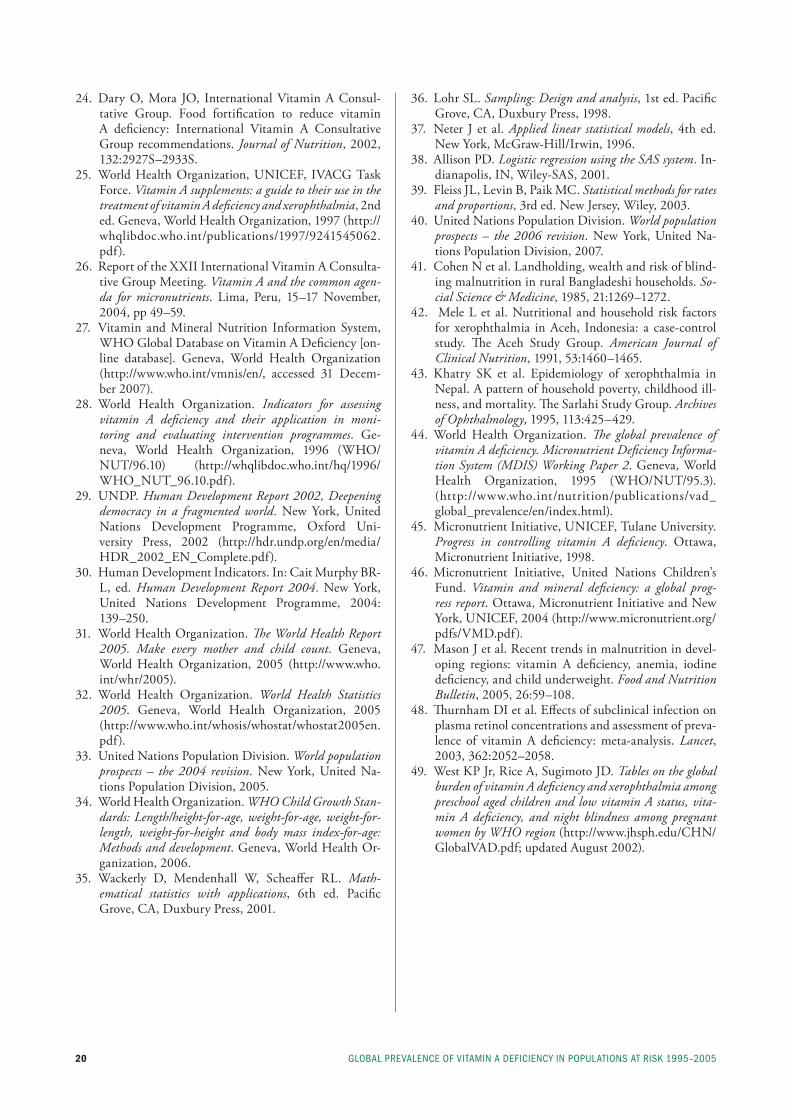
GlObAl preVAlenCe Of VitAmin A DefiCienCy in pOpulAtiOns At risk 1995–200520
24. Dary O, Mora JO, International Vitamin A Consul-tative Group. Food fortification to reduce vitamin A deficiency: International Vitamin A Consultative Group recommendations. Journal of Nutrition, 2002, 132:2927S–2933S.
25. World Health Organization, UNICEF, IVACG Task Force. Vitamin A supplements: a guide to their use in the treatment of vitamin A deficiency and xerophthalmia, 2nd ed. Geneva, World Health Organization, 1997 (http://whqlibdoc.who.int/publications/1997/9241545062.pdf).
26. Report of the XXII International Vitamin A Consulta-tive Group Meeting. Vitamin A and the common agen-da for micronutrients. Lima, Peru, 15–17 November, 2004, pp 49–59.
27. Vitamin and Mineral Nutrition Information System, WHO Global Database on Vitamin A Deficiency [on-line database]. Geneva, World Health Organization (http://www.who.int/vmnis/en/, accessed 31 Decem-ber 2007).
28. World Health Organization. Indicators for assessing vitamin A deficiency and their application in moni-toring and evaluating intervention programmes. Ge-neva, World Health Organization, 1996 (WHO/NUT/96.10) (http://whqlibdoc.who.int/hq/1996/WHO_NUT_96.10.pdf).
29. UNDP. Human Development Report 2002, Deepening democ racy in a fragmented world. New York, United Nations Development Programme, Oxford Uni-versity Press, 2002 (http://hdr.undp.org/en/media/HDR_2002_EN_Complete.pdf).
30. Human Development Indicators. In: Cait Murphy BR-L, ed. Human Development Report 2004. New York, United Nations Development Programme, 2004: 139–250.
31. World Health Organization. The World Health Report 2005. Make every mother and child count. Geneva, World Health Organization, 2005 (http://www.who.int/whr/2005).
32. World Health Organization. World Health Statistics 2005. Geneva, World Health Organization, 2005 (http://www.who.int/whosis/whostat/whostat2005en.pdf).
33. United Nations Population Division. World population prospects – the 2004 revision. New York, United Na-tions Population Division, 2005.
34. World Health Organization. WHO Child Growth Stan-dards: Length/height-for-age, weight-for-age, weight-for-length, weight-for-height and body mass index-for-age: Methods and development. Geneva, World Health Or-ganization, 2006.
35. Wackerly D, Mendenhall W, Scheaffer RL. Math-ematical statistics with applications, 6th ed. Pacific Grove, CA, Duxbury Press, 2001.
36. Lohr SL. Sampling: Design and analysis, 1st ed. Pacific Grove, CA, Duxbury Press, 1998.
37. Neter J et al. Applied linear statistical models, 4th ed. New York, McGraw-Hill/Irwin, 1996.
38. Allison PD. Logistic regression using the SAS system. In-dianapolis, IN, Wiley-SAS, 2001.
39. Fleiss JL, Levin B, Paik MC. Statistical methods for rates and proportions, 3rd ed. New Jersey, Wiley, 2003.
40. United Nations Population Division. World population prospects – the 2006 revision. New York, United Na-tions Population Division, 2007.
41. Cohen N et al. Landholding, wealth and risk of blind-ing malnutrition in rural Bangladeshi households. So-cial Science & Medicine, 1985, 21:1269–1272.
42. Mele L et al. Nutritional and household risk factors for xerophthalmia in Aceh, Indonesia: a case-control study. The Aceh Study Group. American Journal of Clinical Nutrition, 1991, 53:1460–1465.
43. Khatry SK et al. Epidemiology of xerophthalmia in Nepal. A pattern of household poverty, childhood ill-ness, and mortality. The Sarlahi Study Group. Archives of Ophthalmology, 1995, 113:425–429.
44. World Health Organization. The global prevalence of vitamin A deficiency. Micronutrient Deficiency Informa-tion System (MDIS) Working Paper 2. Geneva, World Health Organization, 1995 (WHO/NUT/95.3). (http://www.who.int/nutrition/publications/vad_global_prevalence/en/index.html).
45. Micronutrient Initiative, UNICEF, Tulane University. Progress in controlling vitamin A deficiency. Ottawa, Micronutrient Initiative, 1998.
46. Micronutrient Initiative, United Nations Children’s Fund. Vitamin and mineral deficiency: a global prog-ress report. Ottawa, Micronutrient Initiative and New York, UNICEF, 2004 (http://www.micronutrient.org/pdfs/VMD.pdf).
47. Mason J et al. Recent trends in malnutrition in devel-oping regions: vitamin A deficiency, anemia, iodine deficiency, and child underweight. Food and Nutrition Bulletin, 2005, 26:59–108.
48. Thurnham DI et al. Effects of subclinical infection on plasma retinol concentrations and assessment of preva-lence of vitamin A deficiency: meta-analysis. Lancet, 2003, 362:2052–2058.
49. West KP Jr, Rice A, Sugimoto JD. Tables on the global burden of vitamin A deficiency and xerophthalmia among preschool aged children and low vitamin A status, vita-min A deficiency, and night blindness among pregnant women by WHO region (http://www.jhsph.edu/CHN/GlobalVAD.pdf; updated August 2002).
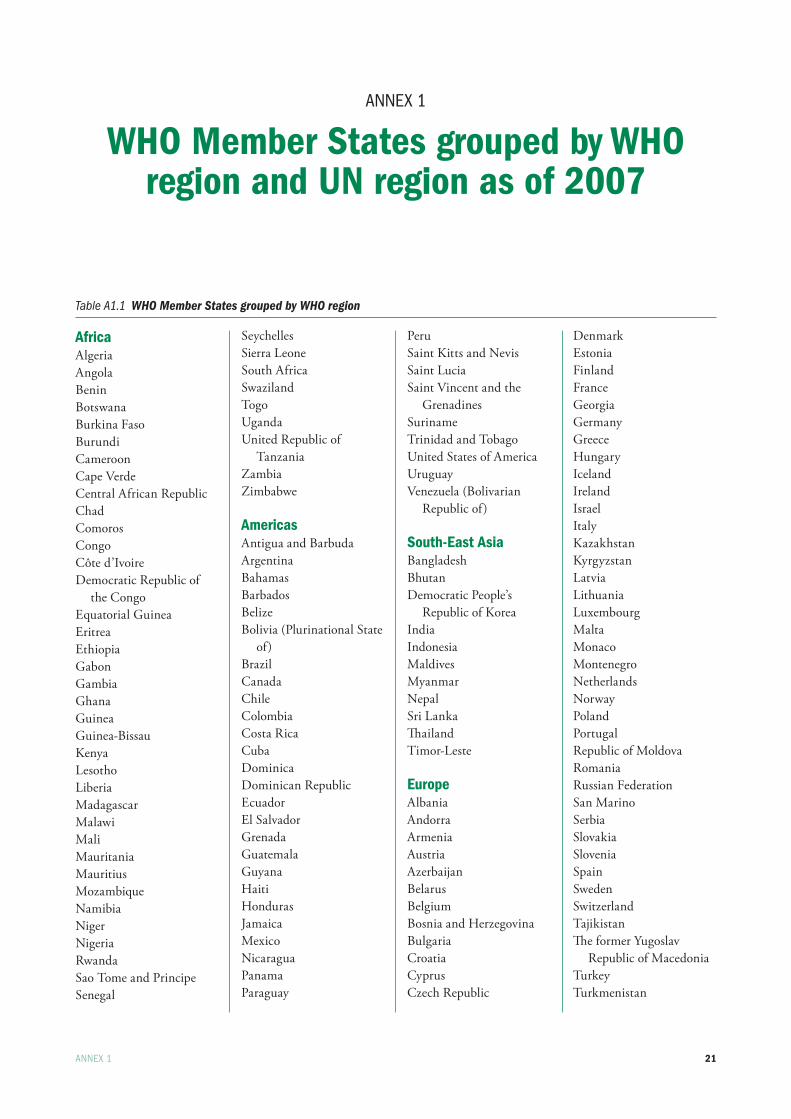
21
AnneX 1
WHO Member States grouped by WHO region and UN region as of 2007
AnneX 1
Table A1.1 WHO Member States grouped by WHO region
AfricaAlgeria Angola Benin Botswana Burkina Faso Burundi Cameroon Cape Verde Central African Republic Chad Comoros Congo Côte d’IvoireDemocratic Republic of
the Congo Equatorial Guinea Eritrea Ethiopia Gabon Gambia Ghana Guinea Guinea-Bissau Kenya LesothoLiberia MadagascarMalawi Mali Mauritania MauritiusMozambique Namibia Niger Nigeria Rwanda Sao Tome and PrincipeSenegal
Seychelles Sierra LeoneSouth Africa Swaziland Togo Uganda United Republic of
Tanzania Zambia Zimbabwe
Americas Antigua and Barbuda Argentina Bahamas Barbados Belize Bolivia (Plurinational State
of) Brazil Canada Chile ColombiaCosta Rica Cuba Dominica Dominican Republic Ecuador El Salvador Grenada Guatemala Guyana HaitiHonduras Jamaica Mexico Nicaragua Panama Paraguay
PeruSaint Kitts and Nevis Saint Lucia Saint Vincent and the
GrenadinesSuriname Trinidad and Tobago United States of America Uruguay Venezuela (Bolivarian
Republic of)
South-East AsiaBangladesh Bhutan Democratic People’s
Republic of Korea IndiaIndonesia Maldives Myanmar NepalSri Lanka ThailandTimor-Leste
EuropeAlbania AndorraArmenia Austria Azerbaijan Belarus BelgiumBosnia and Herzegovina Bulgaria Croatia CyprusCzech Republic
Denmark Estonia FinlandFrance Georgia Germany Greece Hungary Iceland Ireland Israel Italy Kazakhstan Kyrgyzstan Latvia Lithuania LuxembourgMalta Monaco MontenegroNetherlands Norway PolandPortugalRepublic of Moldova Romania Russian Federation San Marino SerbiaSlovakiaSlovenia SpainSwedenSwitzerland Tajikistan The former Yugoslav
Republic of Macedonia TurkeyTurkmenistan
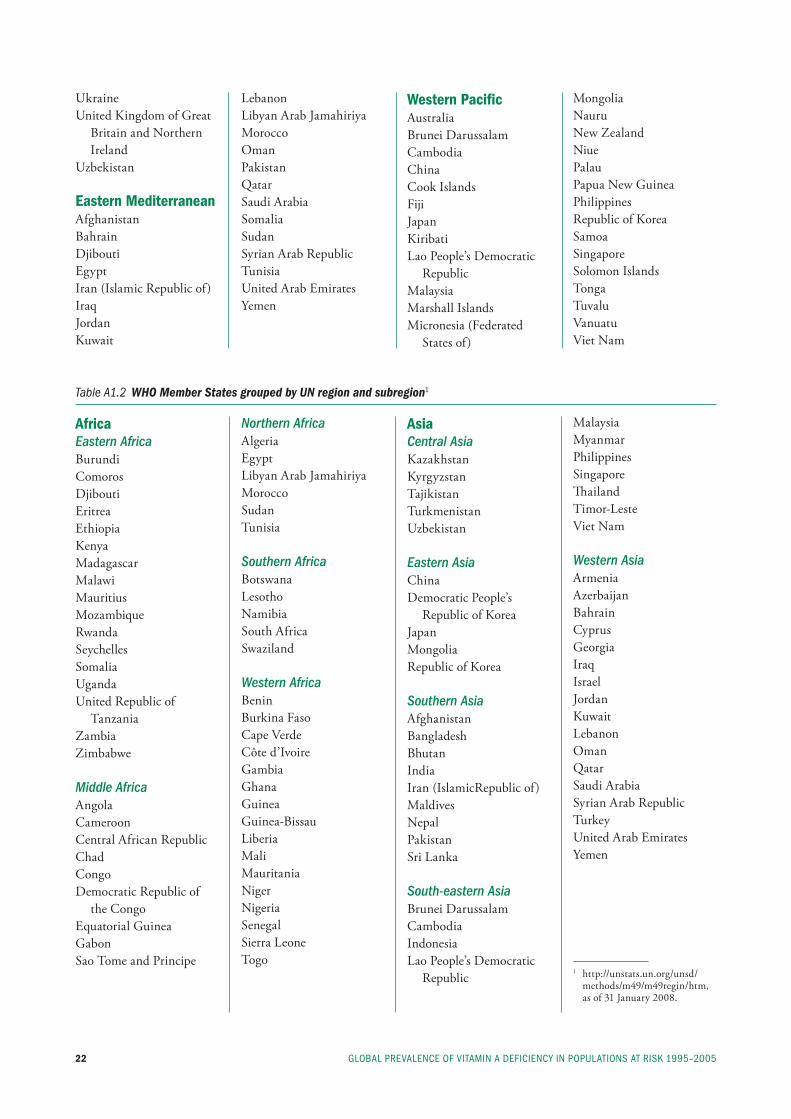
GlObAl preVAlenCe Of VitAmin A DefiCienCy in pOpulAtiOns At risk 1995–200522
Ukraine United Kingdom of Great
Britain and Northern Ireland
Uzbekistan
Eastern MediterraneanAfghanistan Bahrain Djibouti Egypt Iran (Islamic Republic of)Iraq Jordan Kuwait
Lebanon Libyan Arab Jamahiriya Morocco Oman Pakistan Qatar Saudi Arabia Somalia Sudan Syrian Arab RepublicTunisia United Arab Emirates Yemen
Western Pacific Australia Brunei Darussalam Cambodia China Cook Islands Fiji Japan Kiribati Lao People’s Democratic
RepublicMalaysia Marshall IslandsMicronesia (Federated
States of)
Mongolia NauruNew Zealand Niue Palau Papua New Guinea Philippines Republic of Korea Samoa SingaporeSolomon Islands Tonga Tuvalu Vanuatu Viet Nam
Table A1.2 WHO Member States grouped by UN region and subregion1
AfricaEastern AfricaBurundi Comoros DjiboutiEritrea Ethiopia Kenya Madagascar MalawiMauritiusMozambiqueRwanda Seychelles Somalia UgandaUnited Republic of
TanzaniaZambiaZimbabwe
Middle Africa Angola Cameroon Central African Republic Chad Congo Democratic Republic of
the Congo Equatorial Guinea Gabon Sao Tome and Principe
Northern Africa Algeria EgyptLibyan Arab Jamahiriya Morocco Sudan Tunisia
Southern Africa BotswanaLesotho Namibia South Africa Swaziland
Western Africa Benin Burkina FasoCape Verde Côte d’Ivoire GambiaGhana Guinea Guinea-Bissau Liberia Mali Mauritania Niger Nigeria Senegal Sierra Leone Togo
AsiaCentral Asia Kazakhstan Kyrgyzstan TajikistanTurkmenistanUzbekistan
Eastern Asia ChinaDemocratic People’s
Republic of KoreaJapan MongoliaRepublic of Korea
Southern Asia Afghanistan Bangladesh Bhutan IndiaIran (IslamicRepublic of)MaldivesNepal Pakistan Sri Lanka
South-eastern Asia Brunei DarussalamCambodia IndonesiaLao People’s Democratic
Republic
MalaysiaMyanmarPhilippines Singapore Thailand Timor-LesteViet Nam
Western Asia Armenia Azerbaijan Bahrain Cyprus Georgia Iraq Israel Jordan Kuwait Lebanon Oman Qatar Saudi ArabiaSyrian Arab Republic Turkey United Arab Emirates Yemen
1 http://unstats.un.org/unsd/methods/m49/m49regin/htm, as of 31 January 2008.
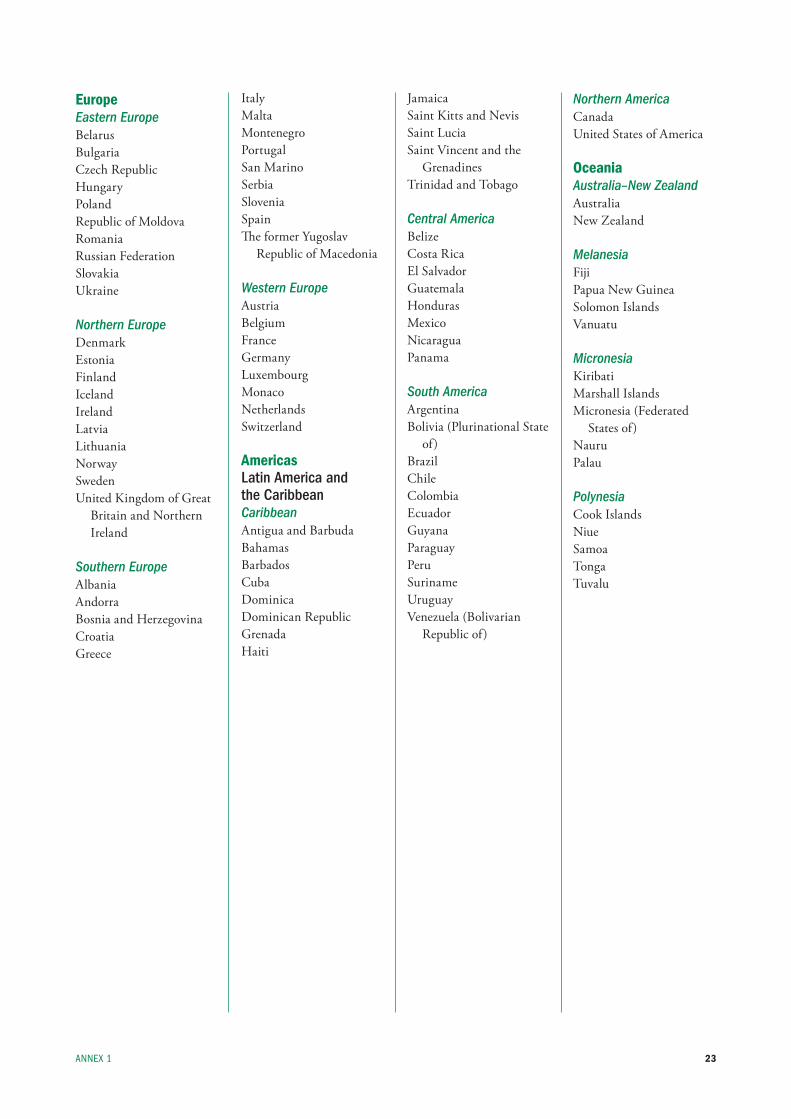
23
EuropeEastern EuropeBelarusBulgariaCzech RepublicHungaryPolandRepublic of MoldovaRomaniaRussian FederationSlovakiaUkraine
Northern EuropeDenmarkEstonia Finland Iceland Ireland Latvia Lithuania NorwaySwedenUnited Kingdom of Great
Britain and Northern Ireland
Southern Europe Albania Andorra Bosnia and Herzegovina Croatia Greece
Italy Malta MontenegroPortugal San MarinoSerbiaSlovenia Spain The former Yugoslav
Republic of Macedonia
Western Europe Austria Belgium France Germany Luxembourg Monaco Netherlands Switzerland
AmericasLatin America and the CaribbeanCaribbeanAntigua and BarbudaBahamasBarbados Cuba DominicaDominican Republic GrenadaHaiti
Jamaica Saint Kitts and NevisSaint LuciaSaint Vincent and the
Grenadines Trinidad and Tobago
Central AmericaBelize Costa Rica El Salvador Guatemala HondurasMexico Nicaragua Panama
South America Argentina Bolivia (Plurinational State
of) Brazil Chile Colombia Ecuador Guyana Paraguay Peru Suriname Uruguay Venezuela (Bolivarian
Republic of)
Northern AmericaCanadaUnited States of America
OceaniaAustralia–New ZealandAustraliaNew Zealand
Melanesia Fiji Papua New GuineaSolomon Islands Vanuatu
Micronesia KiribatiMarshall IslandsMicronesia (Federated
States of)Nauru Palau
Polynesia Cook IslandsNiueSamoaTonga Tuvalu
AnneX 1
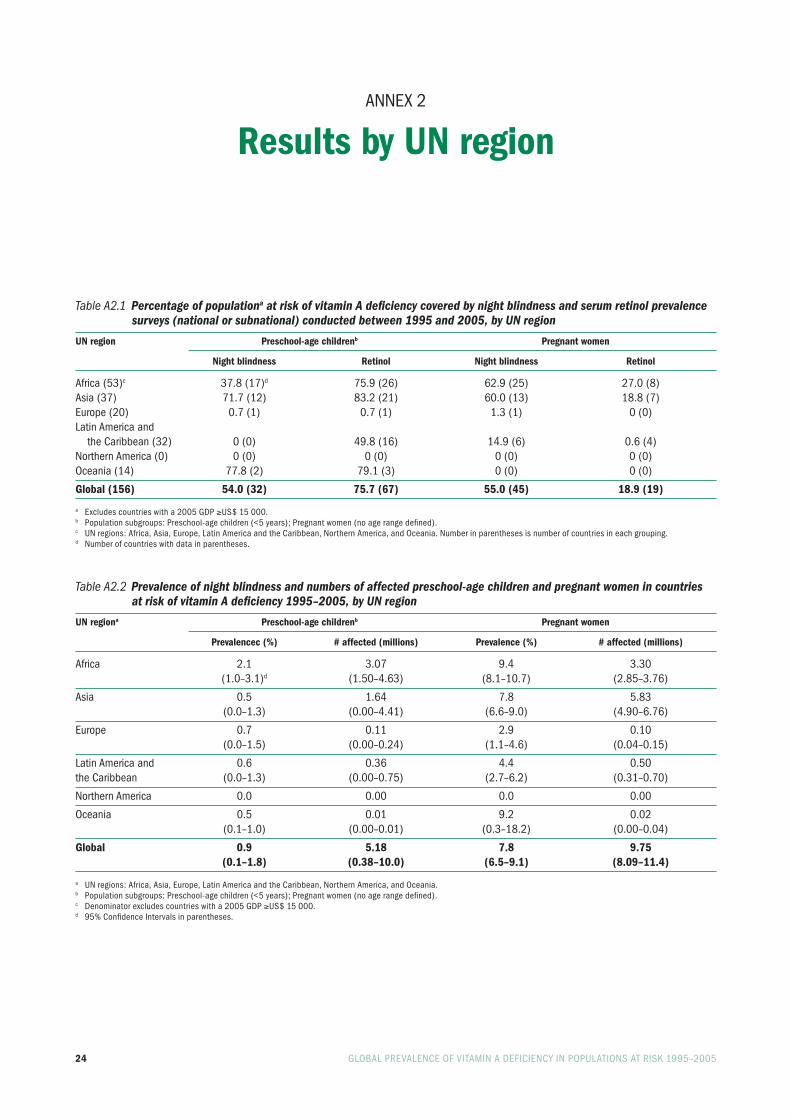
24 GlObAl preVAlenCe Of VitAmin A DefiCienCy in pOpulAtiOns At risk 1995–2005
AnneX 2
Results by UN region
Table A2.1 Percentage of populationa at risk of vitamin A deficiency covered by night blindness and serum retinol prevalence surveys (national or subnational) conducted between 1995 and 2005, by UN region
UN region Preschool-age childrenb Pregnant women
Night blindness Retinol Night blindness Retinol
Africa (53)c 37.8 (17)d 75.9 (26) 62.9 (25) 27.0 (8)Asia (37) 71.7 (12) 83.2 (21) 60.0 (13) 18.8 (7)europe (20) 0.7 (1) 0.7 (1) 1.3 (1) 0 (0)latin America and the Caribbean (32) 0 (0) 49.8 (16) 14.9 (6) 0.6 (4)northern America (0) 0 (0) 0 (0) 0 (0) 0 (0)Oceania (14) 77.8 (2) 79.1 (3) 0 (0) 0 (0)
Global (156) 54.0 (32) 75.7 (67) 55.0 (45) 18.9 (19)
a excludes countries with a 2005 GDp ≥us$ 15 000.b population subgroups: preschool-age children (<5 years); pregnant women (no age range defined).c un regions: Africa, Asia, europe, latin America and the Caribbean, northern America, and Oceania. number in parentheses is number of countries in each grouping.d number of countries with data in parentheses.
Table A2.2 Prevalence of night blindness and numbers of affected preschool-age children and pregnant women in countries at risk of vitamin A deficiency 1995–2005, by UN region
UN regiona Preschool-age childrenb Pregnant women
Prevalencec (%) # affected (millions) Prevalence (%) # affected (millions)
Africa 2.1 3.07 9.4 3.30 (1.0–3.1)d (1.50–4.63) (8.1–10.7) (2.85–3.76)
Asia 0.5 1.64 7.8 5.83 (0.0–1.3) (0.00–4.41) (6.6–9.0) (4.90–6.76)
europe 0.7 0.11 2.9 0.10 (0.0–1.5) (0.00–0.24) (1.1–4.6) (0.04–0.15)
latin America and 0.6 0.36 4.4 0.50the Caribbean (0.0–1.3) (0.00–0.75) (2.7–6.2) (0.31–0.70)
northern America 0.0 0.00 0.0 0.00
Oceania 0.5 0.01 9.2 0.02 (0.1–1.0) (0.00–0.01) (0.3–18.2) (0.00–0.04)
Global 0.9 5.18 7.8 9.75 (0.1–1.8) (0.38–10.0) (6.5–9.1) (8.09–11.4)
a un regions: Africa, Asia, europe, latin America and the Caribbean, northern America, and Oceania.b population subgroups: preschool-age children (<5 years); pregnant women (no age range defined).c Denominator excludes countries with a 2005 GDp ≥us$ 15 000.d 95% Confidence intervals in parentheses.
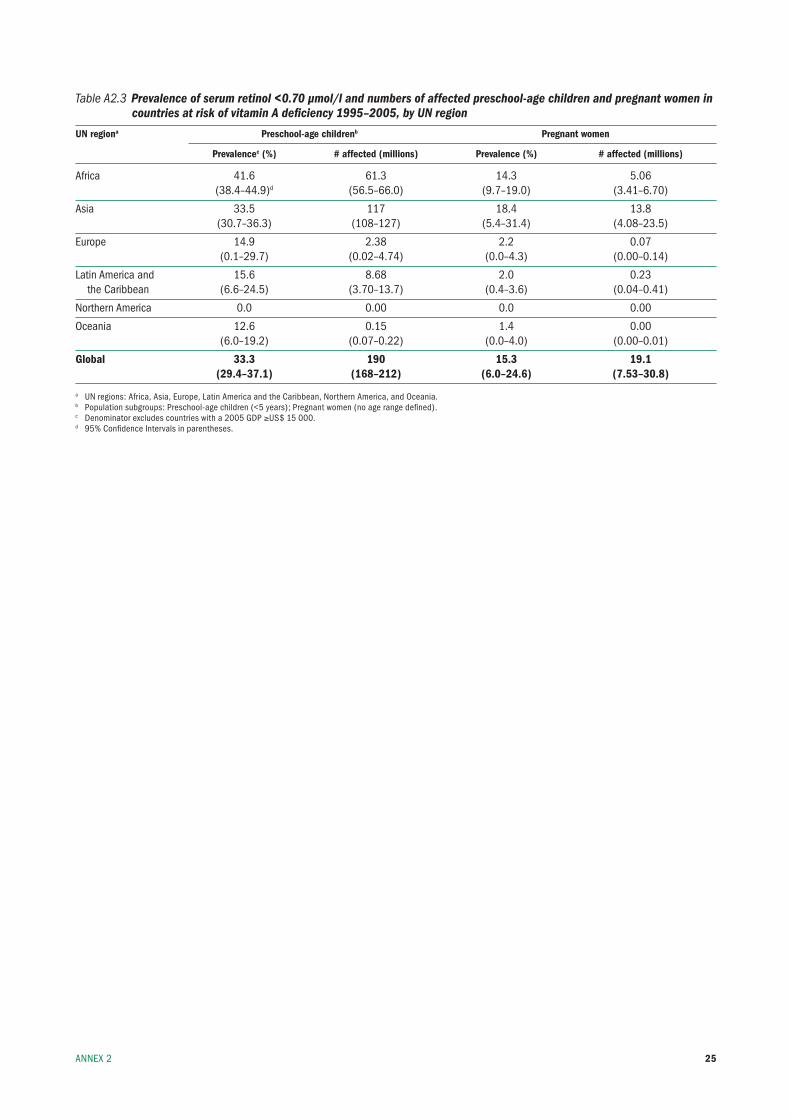
25
Table A2.3 Prevalence of serum retinol <0.70 µmol/l and numbers of affected preschool-age children and pregnant women in countries at risk of vitamin A deficiency 1995–2005, by UN region
UN regiona Preschool-age childrenb Pregnant women
Prevalencec (%) # affected (millions) Prevalence (%) # affected (millions)
Africa 41.6 61.3 14.3 5.06 (38.4–44.9)d (56.5–66.0) (9.7–19.0) (3.41–6.70)
Asia 33.5 117 18.4 13.8 (30.7–36.3) (108–127) (5.4–31.4) (4.08–23.5)
europe 14.9 2.38 2.2 0.07 (0.1–29.7) (0.02–4.74) (0.0–4.3) (0.00–0.14)
latin America and 15.6 8.68 2.0 0.23 the Caribbean (6.6–24.5) (3.70–13.7) (0.4–3.6) (0.04–0.41)
northern America 0.0 0.00 0.0 0.00
Oceania 12.6 0.15 1.4 0.00 (6.0–19.2) (0.07–0.22) (0.0–4.0) (0.00–0.01)
Global 33.3 190 15.3 19.1 (29.4–37.1) (168–212) (6.0–24.6) (7.53–30.8)
a un regions: Africa, Asia, europe, latin America and the Caribbean, northern America, and Oceania.b population subgroups: preschool-age children (<5 years); pregnant women (no age range defined).c Denominator excludes countries with a 2005 GDp ≥us$ 15 000.d 95% Confidence intervals in parentheses.
AnneX 2
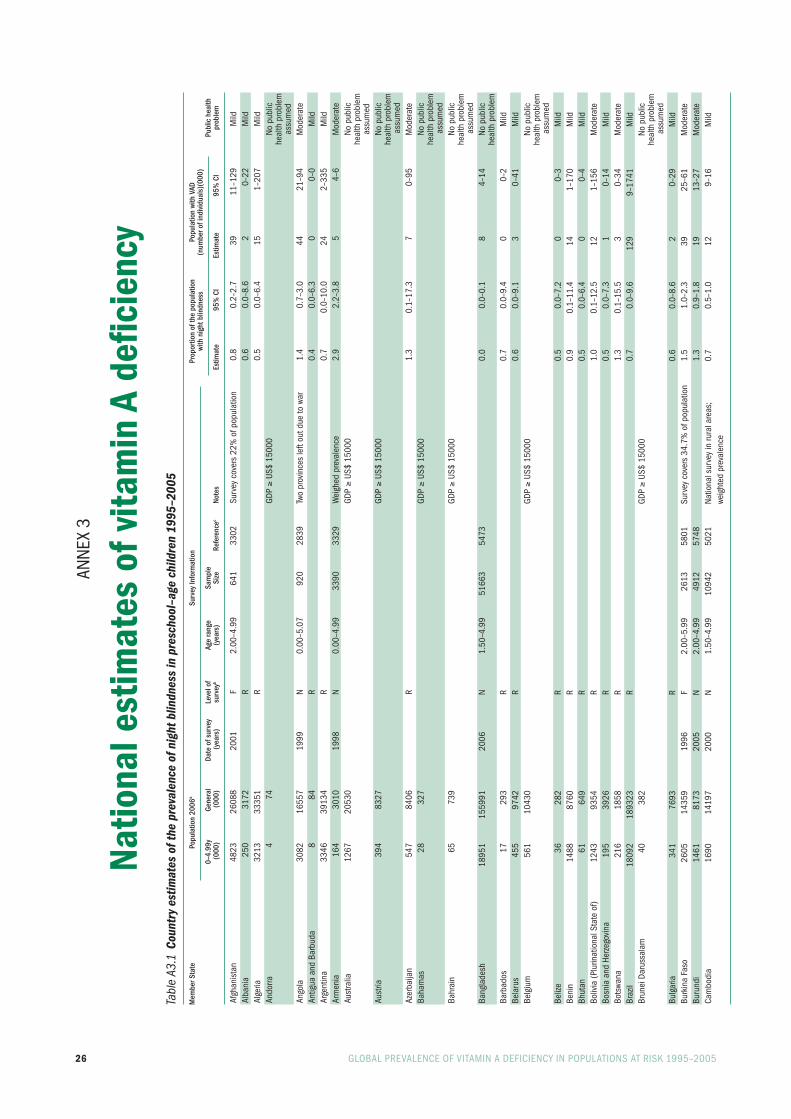
26 GlObAl preVAlenCe Of VitAmin A DefiCienCy in pOpulAtiOns At risk 1995–2005
Anne
X 3
Natio
nal e
stim
ates
of v
itam
in A
defi
cien
cyTa
ble
A3.1
Cou
ntry
est
imat
es o
f the
pre
vale
nce
of n
ight
blin
dnes
s in
pre
scho
ol–a
ge c
hild
ren
1995
–200
5
Mem
ber S
tate
Po
pula
tion
2006
a Su
rvey
Info
rmat
ion
Prop
ortio
n of
the
popu
latio
n
Popu
latio
n wi
th V
AD
with
nig
ht b
lindn
ess
(num
ber o
f ind
ivid
uals
)(00
0)
0–
4.99
y Ge
nera
l Da
te o
f sur
vey
Leve
l of
Age
rang
e Sa
mpl
e
Pu
blic
hea
lth
(000
) (0
00)
(yea
rs)
surv
eyb
(yea
rs)
Size
Re
fere
ncec
Note
s Es
timat
e 95
% C
I Es
timat
e 95
% C
I pr
oble
m
Afgh
anis
tan
4823
26
088
2001
f
2.00
–4.9
9 64
1 33
02
surv
ey c
over
s 22
% o
f pop
ulat
ion
0.8
0.2–
2.7
39
11–1
29
mild
Alba
nia
25
0 31
72
r
0.6
0.0–
8.6
2 0–
22
mild
Alge
ria
3213
33
351
r
0.5
0.0–
6.4
15
1–20
7 m
ildAn
dorra
4
74
GD
p ≥
us$
1500
0
no
pub
lic
heal
th p
robl
em
assu
med
Ango
la
3082
16
557
1999
n
0.00
–5.0
7 92
0 28
39
two
prov
ince
s le
ft ou
t due
to w
ar
1.4
0.7–
3.0
44
21–9
4 m
oder
ate
Antig
ua a
nd b
arbu
da
8 84
r
0.
4 0.
0–6.
3 0
0–0
mild
Arge
ntin
a 33
46
3913
4
r
0.
7 0.
0–10
.0
24
2–33
5 m
ildAr
men
ia
164
3010
19
98
n 0.
00–4
.99
3390
33
29
Wei
ghed
pre
vale
nce
2.9
2.2–
3.8
5 4–
6 m
oder
ate
Aust
ralia
12
67
2053
0
GDp ≥
us$
1500
0
no
pub
lic
heal
th p
robl
em
assu
med
Aust
ria
394
8327
GDp ≥
us$
1500
0
no
pub
lic
heal
th p
robl
em
ass
umed
Azer
baija
n 54
7 84
06
r
1.3
0.1–
17.3
7
0–95
m
oder
ate
baha
mas
28
32
7
GDp ≥
us$
1500
0
no
pub
lic
he
alth
pro
blem
a
ssum
edba
hrai
n 65
73
9
GDp ≥
us$
1500
0
no
pub
lic
he
alth
pro
blem
a
ssum
edba
ngla
desh
18
951
1559
91
2006
n
1.50
–4.9
9 51
663
5473
0.0
0.0–
0.1
8 4–
14
no p
ublic
heal
th p
robl
emba
rbad
os
17
293
r
0.7
0.0–
9.4
0 0–
2 m
ildbe
laru
s 45
5 97
42
r
0.6
0.0–
9.1
3 0–
41
mild
belg
ium
56
1 10
430
GD
p ≥
us$
1500
0
no
pub
lic
he
alth
pro
blem
a
ssum
edbe
lize
36
282
r
0.5
0.0–
7.2
0 0–
3 m
ildbe
nin
1488
87
60
r
0.9
0.1–
11.4
14
1–
170
mild
bhut
an
61
649
r
0.5
0.0–
6.4
0 0–
4 m
ildbo
livia
(plu
rinat
iona
l sta
te o
f) 12
43
9354
r
1.
0 0.
1–12
.5
12
1–15
6 m
oder
ate
bosn
ia a
nd H
erze
govi
na
195
3926
r
0.
5 0.
0–7.
3 1
0–14
m
ildbo
tswa
na
216
1858
r
1.
3 0.
1–15
.5
3 0–
34
mod
erat
ebr
azil
1809
2 18
9323
r
0.
7 0.
0–9.
6 12
9 9–
1741
m
ildbr
unei
Dar
ussa
lam
40
38
2
GDp ≥
us$
1500
0
no
pub
lic
he
alth
pro
blem
a
ssum
edbu
lgar
ia
341
7693
r
0.
6 0.
0–8.
6 2
0–29
m
ildbu
rkin
a fa
so
2605
14
359
1996
f
2.00
–5.9
9 26
13
5801
su
rvey
cov
ers
34.7
% o
f pop
ulat
ion
1.5
1.0–
2.3
39
25–6
1 m
oder
ate
buru
ndi
1461
81
73
2005
n
2.00
–4.9
9 49
12
5748
1.3
0.9–
1.8
19
13–2
7 m
oder
ate
Cam
bodi
a
1690
14
197
2000
n
1.50
–4.9
9 10
942
5021
na
tiona
l sur
vey
in ru
ral a
reas
; 0.
7 0.
5–1.
0 12
9–
16
mild
we
ight
ed p
reva
lenc
e
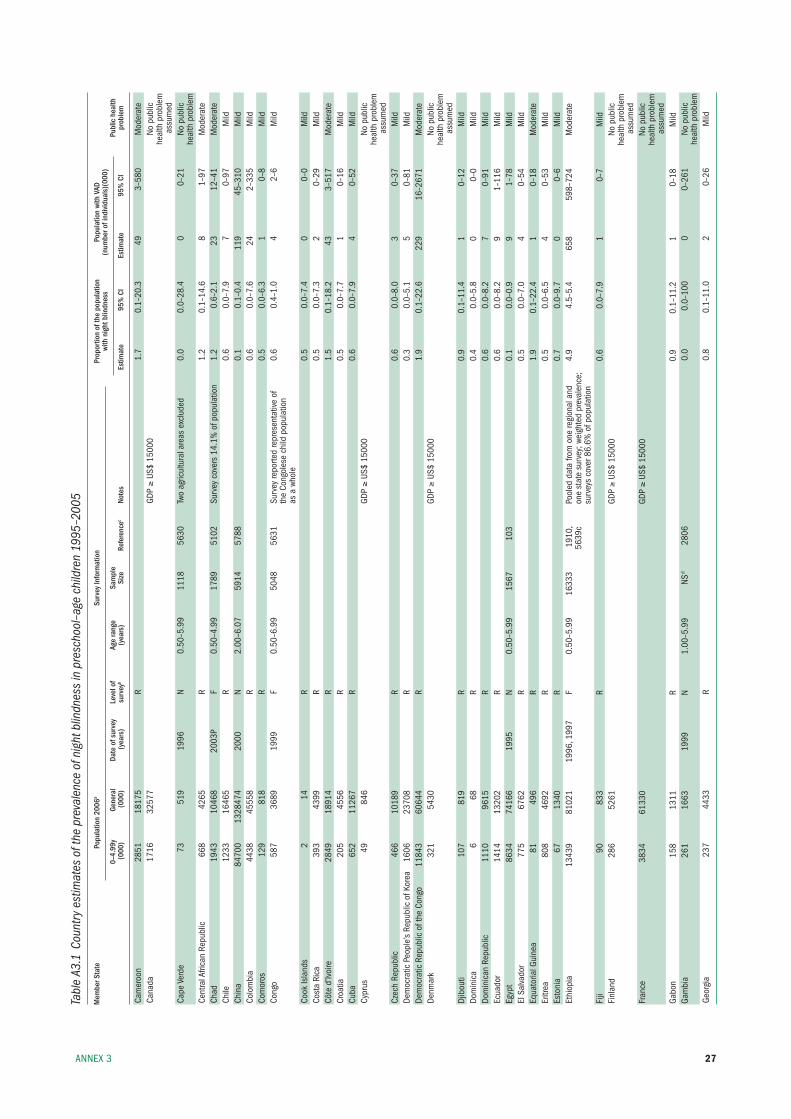
27
Tabl
e A3
.1 C
ount
ry e
stim
ates
of t
he p
reva
lenc
e of
nig
ht b
lindn
ess
in p
resc
hool
–age
chi
ldre
n 19
95–2
005
Mem
ber S
tate
Po
pula
tion
2006
a Su
rvey
Info
rmat
ion
Prop
ortio
n of
the
popu
latio
n
Popu
latio
n wi
th V
AD
with
nig
ht b
lindn
ess
(num
ber o
f ind
ivid
uals
)(00
0)
0–
4.99
y Ge
nera
l Da
te o
f sur
vey
Leve
l of
Age
rang
e Sa
mpl
e
Pu
blic
hea
lth
(000
) (0
00)
(yea
rs)
surv
eyb
(yea
rs)
Size
Re
fere
ncec
Note
s Es
timat
e 95
% C
I Es
timat
e 95
% C
I pr
oble
m
Cam
eroo
n
2851
18
175
r
1.7
0.1–
20.3
49
3–
580
mod
erat
eCa
nada
17
16
3257
7
GDp ≥
us$
1500
0
no
pub
lic
he
alth
pro
blem
a
ssum
edCa
pe V
erde
73
51
9 19
96
n 0.
50–5
.99
1118
56
30
two
agric
ultu
ral a
reas
exc
lude
d 0.
0 0.
0–28
.4
0 0–
21
no p
ublic
heal
th p
robl
emCe
ntra
l Afri
can
repu
blic
66
8 42
65
r
1.2
0.1–
14.6
8
1–97
m
oder
ate
Chad
19
43
1046
8 20
03p
f 0.
50–4
.99
1789
51
02
surv
ey c
over
s 14
.1%
of p
opul
atio
n 1.
2 0.
6–2.
1 23
12
–41
mod
erat
eCh
ile
1233
16
465
r
0.6
0.0–
7.9
7 0–
97
mild
Chin
a 84
700
1328
474
2000
n
2.00
–6.0
7 59
14
5788
0.1
0.1–
0.4
119
45–3
10
mild
Colo
mbi
a 44
38
4555
8
r
0.
6 0.
0–7.
6 24
2–
335
mild
Com
oros
12
9 81
8
r
0.
5 0.
0–6.
3 1
0–8
mild
Cong
o 58
7 36
89
1999
f
0.50
–6.9
9 50
48
5631
su
rvey
repo
rted
repr
esen
tativ
e of
0.
6 0.
4–1.
0 4
2–6
mild
th
e Co
ngol
ese
child
pop
ulat
ion
as
a w
hole
Co
ok is
land
s 2
14
r
0.5
0.0–
7.4
0 0–
0 m
ildCo
sta
rica
39
3 43
99
r
0.5
0.0–
7.3
2 0–
29
mild
Côte
d’iv
oire
28
49
1891
4
r
1.
5 0.
1–18
.2
43
3–51
7 m
oder
ate
Croa
tia
205
4556
r
0.
5 0.
0–7.
7 1
0–16
m
ildCu
ba
652
1126
7
r
0.
6 0.
0–7.
9 4
0–52
m
ildCy
prus
49
84
6
GDp ≥
us$
1500
0
no
pub
lic
he
alth
pro
blem
a
ssum
edCz
ech
repu
blic
46
6 10
189
r
0.6
0.0–
8.0
3 0–
37
mild
Dem
ocra
tic p
eopl
e’s
repu
blic
of k
orea
16
06
2370
8
r
0.
3 0.
0–5.
1 5
0–81
m
ildDe
moc
ratic
rep
ublic
of t
he C
ongo
11
843
6064
4
r
1.
9 0.
1–22
.6
229
16–2
671
mod
erat
eDe
nmar
k 32
1 54
30
GD
p ≥
us$
1500
0
no
pub
lic
he
alth
pro
blem
a
ssum
edDj
ibou
ti 10
7 81
9
r
0.
9 0.
1–11
.4
1 0–
12
mild
Dom
inic
a 6
68
r
0.4
0.0–
5.8
0 0–
0 m
ildDo
min
ican
rep
ublic
11
10
9615
r
0.
6 0.
0–8.
2 7
0–91
m
ildec
uado
r 14
14
1320
2
r
0.
6 0.
0–8.
2 9
1–11
6 m
ildeg
ypt
8634
74
166
1995
n
0.50
–5.9
9 15
67
103
0.
1 0.
0–0.
9 9
1–78
m
ildel
sal
vado
r 77
5 67
62
r
0.5
0.0–
7.0
4 0–
54
mild
equa
toria
l Gui
nea
81
496
r
1.9
0.1–
22.4
1
0–18
m
oder
ate
eritr
ea
808
4692
r
0.
5 0.
0–6.
5 4
0–53
m
ildes
toni
a 67
13
40
r
0.7
0.0–
9.7
0 0–
6 m
ildet
hiop
ia
1343
9 81
021
1996
, 199
7 f
0.50
–5.9
9 16
333
1910
, po
oled
dat
a fro
m o
ne re
gion
al a
nd
4.9
4.5–
5.4
658
598–
724
mod
erat
e
563
9c
one
stat
e su
rvey
; wei
ghte
d pr
eval
ence
;
su
rvey
s co
ver 8
6.6%
of p
opul
atio
n fi
ji 90
83
3
r
0.
6 0.
0–7.
9 1
0–7
mild
finl
and
286
5261
GDp ≥
us$
1500
0
no
pub
lic
he
alth
pro
blem
a
ssum
edfr
ance
38
34
6133
0
GDp ≥
us$
1500
0
no
pub
lic
he
alth
pro
blem
a
ssum
edGa
bon
15
8 13
11
r
0.9
0.1–
11.2
1
0–18
m
ildGa
mbi
a
261
1663
19
99
n 1.
00–5
.99
nsd
2806
0.0
0.0–
100
0 0–
261
no p
ublic
heal
th p
robl
emGe
orgi
a 23
7 44
33
r
0.8
0.1–
11.0
2
0–26
m
ild
AnneX 3
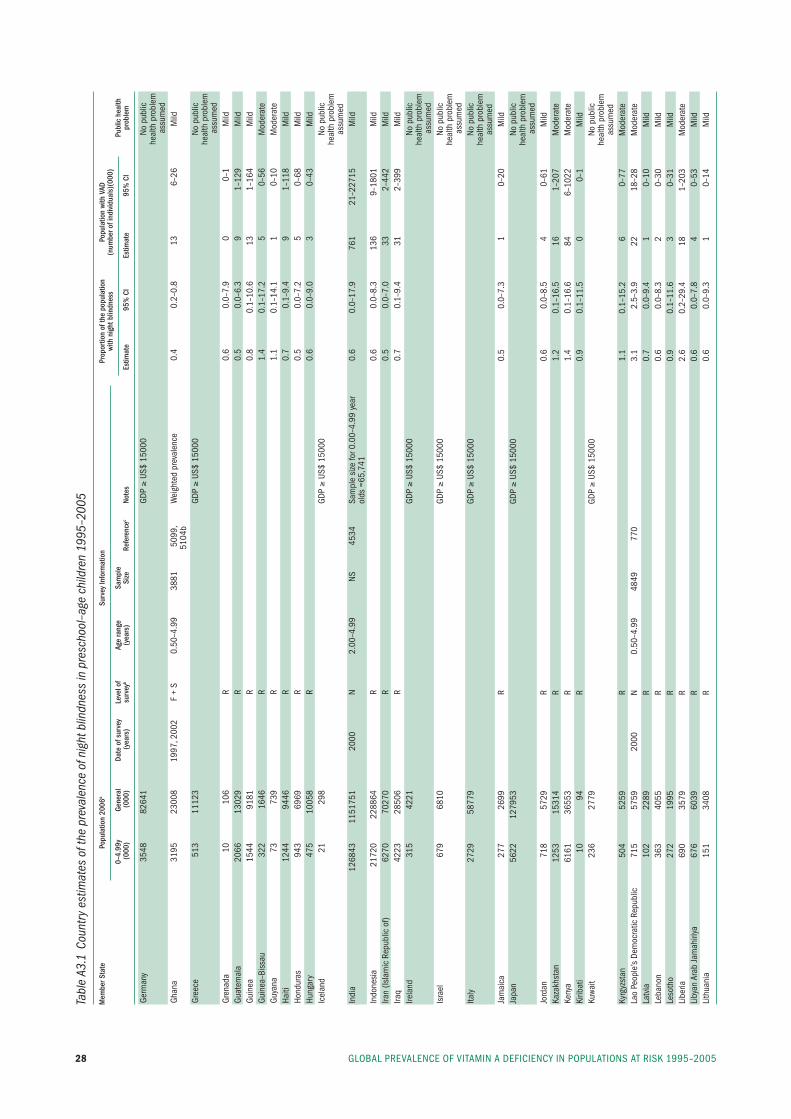
GlObAl preVAlenCe Of VitAmin A DefiCienCy in pOpulAtiOns At risk 1995–200528
Tabl
e A3
.1 C
ount
ry e
stim
ates
of t
he p
reva
lenc
e of
nig
ht b
lindn
ess
in p
resc
hool
–age
chi
ldre
n 19
95–2
005
Mem
ber S
tate
Po
pula
tion
2006
a Su
rvey
Info
rmat
ion
Prop
ortio
n of
the
popu
latio
n
Popu
latio
n wi
th V
AD
with
nig
ht b
lindn
ess
(num
ber o
f ind
ivid
uals
)(00
0)
0–
4.99
y Ge
nera
l Da
te o
f sur
vey
Leve
l of
Age
rang
e Sa
mpl
e
Pu
blic
hea
lth
(000
) (0
00)
(yea
rs)
surv
eyb
(yea
rs)
Size
Re
fere
ncec
Note
s Es
timat
e 95
% C
I Es
timat
e 95
% C
I pr
oble
m
Germ
any
3548
82
641
GD
p ≥
us$
1500
0
no
pub
lic
he
alth
pro
blem
a
ssum
edGh
ana
3195
23
008
1997
, 200
2 f
+ s
0.50
–4.9
9 38
81
5099
, W
eigh
ted
prev
alen
ce
0.4
0.2–
0.8
13
6–26
m
ild
5104
bGr
eece
51
3 11
123
GD
p ≥
us$
1500
0
no
pub
lic
he
alth
pro
blem
a
ssum
edGr
enad
a 10
10
6
r
0.
6 0.
0–7.
9 0
0–1
mild
Guat
emal
a 20
66
1302
9
r
0.
5 0.
0–6.
3 9
1–12
9 m
ildGu
inea
15
44
9181
r
0.
8 0.
1–10
.6
13
1–16
4 m
ildGu
inea
–bis
sau
322
1646
r
1.
4 0.
1–17
.2
5 0–
56
mod
erat
eGu
yana
73
73
9
r
1.
1 0.
1–14
.1
1 0–
10
mod
erat
eHa
iti
1244
94
46
r
0.7
0.1–
9.4
9 1–
118
mild
Hond
uras
94
3 69
69
r
0.5
0.0–
7.2
5 0–
68
mild
Hung
ary
475
1005
8
r
0.
6 0.
0–9.
0 3
0–43
m
ildic
elan
d 21
29
8
GDp ≥
us$
1500
0
no
pub
lic
he
alth
pro
blem
assu
med
indi
a 12
6843
11
5175
1 20
00
n 2.
00–4
.99
ns
4534
sa
mpl
e si
ze fo
r 0.0
0–4.
99 y
ear
0.6
0.0–
17.9
76
1 21
–227
15
mild
olds
=65
,741
in
done
sia
21
720
2288
64
r
0.6
0.0–
8.3
136
9–18
01
mild
iran
(isla
mic
rep
ublic
of)
6270
70
270
r
0.5
0.0–
7.0
33
2–44
2 m
ildira
q 42
23
2850
6
r
0.
7 0.
1–9.
4 31
2–
399
mild
irela
nd
315
4221
GDp ≥
us$
1500
0
no
pub
lic
he
alth
pro
blem
a
ssum
edis
rael
67
9 68
10
GD
p ≥
us$
1500
0
no
pub
lic
he
alth
pro
blem
a
ssum
edita
ly
2729
58
779
GD
p ≥
us$
1500
0
no
pub
lic
he
alth
pro
blem
assu
med
Jam
aica
27
7 26
99
r
0.5
0.0–
7.3
1 0–
20
mild
Japa
n
5622
12
7953
GDp ≥
us$
1500
0
no
pub
lic
he
alth
pro
blem
a
ssum
edJo
rdan
71
8 57
29
r
0.6
0.0–
8.5
4 0–
61
mild
kaza
khst
an
1253
15
314
r
1.2
0.1–
16.5
16
1–
207
mod
erat
eke
nya
6161
36
553
r
1.4
0.1–
16.6
84
6–
1022
m
oder
ate
kirib
ati
10
94
r
0.9
0.1–
11.5
0
0–1
mild
kuwa
it 23
6 27
79
GD
p ≥
us$
1500
0
no
pub
lic
he
alth
pro
blem
assu
med
kyrg
yzst
an
504
5259
r
1.
1 0.
1–15
.2
6 0–
77
mod
erat
ela
o pe
ople
’s De
moc
ratic
rep
ublic
71
5 57
59
2000
n
0.50
–4.9
9 48
49
770
3.
1 2.
5–3.
9 22
18
–28
mod
erat
ela
tvia
10
2 22
89
r
0.7
0.0–
9.4
1 0–
10
mild
leba
non
363
4055
r
0.
6 0.
0–8.
3 2
0–30
m
ildle
soth
o 27
2 19
95
r
0.9
0.1–
11.6
3
0–31
m
ildli
beria
69
0 35
79
r
2.6
0.2–
29.4
18
1–
203
mod
erat
eli
byan
Ara
b Ja
mah
iriya
67
6 60
39
r
0.6
0.0–
7.8
4 0–
53
mild
lith
uani
a 15
1 34
08
r
0.6
0.0–
9.3
1 0–
14
mild

29AnneX 3
Tabl
e A3
.1 C
ount
ry e
stim
ates
of t
he p
reva
lenc
e of
nig
ht b
lindn
ess
in p
resc
hool
–age
chi
ldre
n 19
95–2
005
Mem
ber S
tate
Po
pula
tion
2006
a Su
rvey
Info
rmat
ion
Prop
ortio
n of
the
popu
latio
n
Popu
latio
n wi
th V
AD
with
nig
ht b
lindn
ess
(num
ber o
f ind
ivid
uals
)(00
0)
0–
4.99
y Ge
nera
l Da
te o
f sur
vey
Leve
l of
Age
rang
e Sa
mpl
e
Pu
blic
hea
lth
(000
) (0
00)
(yea
rs)
surv
eyb
(yea
rs)
Size
Re
fere
ncec
Note
s Es
timat
e 95
% C
I Es
timat
e 95
% C
I pr
oble
m
luxe
mbo
urg
27
461
GD
p ≥
us$
1500
0
no
pub
lic
he
alth
pro
blem
assu
med
mad
agas
car
3142
19
159
2000
n
0.50
–4.9
9 58
6 50
90
1.
7 0.
7–4.
0 53
22
–126
m
oder
ate
mal
awi
2425
13
571
r
2.1
0.1–
24.3
50
3–
590
mod
erat
em
alay
sia
2758
26
114
r
0.5
0.0–
6.5
13
1–17
8 m
ildm
aldi
ves
30
300
2001
n
2.00
–4.9
9 64
0 29
87
1.
2 0.
4–3.
2 0
0–1
mod
erat
em
ali
2247
11
968
1997
f
ns–9
.99
1055
9 41
95
surv
ey c
over
s 51
.7%
of p
opul
atio
n 1.
7 1.
4–2.
1 38
31
–46
mod
erat
em
alta
20
40
5
r
0.
5 0.
0–7.
1 0
0–1
mild
mar
shal
l isl
ands
6
58
1995
n
1.00
–5.9
9 28
1 38
86
8.
5 4.
9–14
.4
1 0–
1 se
vere
mau
ritan
ia
456
3044
r
1.
2 0.
1–14
.9
6 0–
68
mod
erat
em
aurit
ius
94
1252
r
0.
5 0.
0–6.
5 0
0–6
mild
mex
ico
1044
5 10
5342
r
0.
6 0.
0–8.
3 64
4–
866
mild
mic
rone
sia
(fed
erat
ed s
tate
s of
) 14
11
1
r
0.
5 0.
0–7.
5 0
0–1
mild
mon
aco
2 33
GDp ≥
us$
1500
0
no
pub
lic
he
alth
pro
blem
assu
med
mon
golia
23
3 26
05
1999
n
0.58
–6.0
7 57
6 57
67
0.
5 0.
1–2.
5 1
0–6
mild
mon
tene
gro
38
601
r
0.6
0.0–
8.9
0 0–
3 m
ildm
oroc
co
2978
30
853
1996
n
0.50
–5.9
9 14
70
5496
se
e al
so r
efer
ence
397
1 0.
1 0.
0–1.
0 3
0–29
m
ildm
ozam
biqu
e 36
70
2097
1
r
1.
0 0.
1–12
.1
36
3–44
4 m
oder
ate
mya
nmar
41
46
4837
9
r
1.
1 0.
1–13
.5
45
3–55
8 m
oder
ate
nam
ibia
24
8 20
47
r
0.8
0.1–
10.3
2
0–25
m
ildna
uru
1 10
r
0.
6 0.
0–8.
0 0
0–0
mild
nepa
l 36
26
2764
1 19
98
n 1.
00–4
.99
1530
7 10
83
0.
3 0.
2–0.
4 10
6–
15
mild
neth
erla
nds
987
1637
9
GDp ≥
us$
1500
0
no
pub
lic
he
alth
pro
blem
a
ssum
edne
w Ze
alan
d 28
4 41
40
GD
p ≥
us$
1500
0
no
pub
lic
he
alth
pro
blem
a
ssum
edni
cara
gua
671
5532
r
0.
5 0.
0–6.
8 3
0–46
m
ildni
ger
2713
13
737
2000
n
2.00
–4.9
9 30
04
3392
2.1
1.5–
3.0
57
40–8
0 m
oder
ate
nige
ria
2450
3 14
4720
r
2.
2 0.
1–25
.3
534
36–6
193
mod
erat
eni
ue
0 2
r
0.6
0.0–
8.3
0 0–
0 m
ildno
rway
28
4 46
69
GD
p ≥
us$
1500
0
no
pub
lic
he
alth
pro
blem
a
ssum
edOm
an
269
2546
r
0.
4 0.
0–5.
2 1
0–14
m
ildpa
kist
an
1901
2 16
0943
r
0.
5 0.
0–6.
6 88
6–
1256
m
ildpa
lau
2 20
r
0.
6 0.
0–7.
9 0
0–0
mild
pana
ma
344
3288
r
0.
6 0.
0–8.
2 2
0–28
m
ildpa
pua
new
Gui
nea
898
6202
19
98p
f 0.
50–5
.99
1020
41
40
surv
ey c
over
s 22
.4%
of p
opul
atio
n 0.
5 0.
1–1.
7 4
1–15
m
ildpa
ragu
ay
731
6016
r
0.
6 0.
0–8.
4 5
0–61
m
ildpe
ru
2815
27
589
r
0.7
0.0–
9.0
19
1–25
4 m
ildph
ilipp
ines
11
027
8626
4
r
0.
7 0.
1–10
.0
82
6–11
02
mild
pola
nd
1765
38
140
r
0.6
0.0–
9.2
11
1–16
2 m
ildpo
rtuga
l 55
7 10
579
GD
p ≥
us$
1500
0
no
pub
lic
he
alth
pro
blem
a
ssum
ed
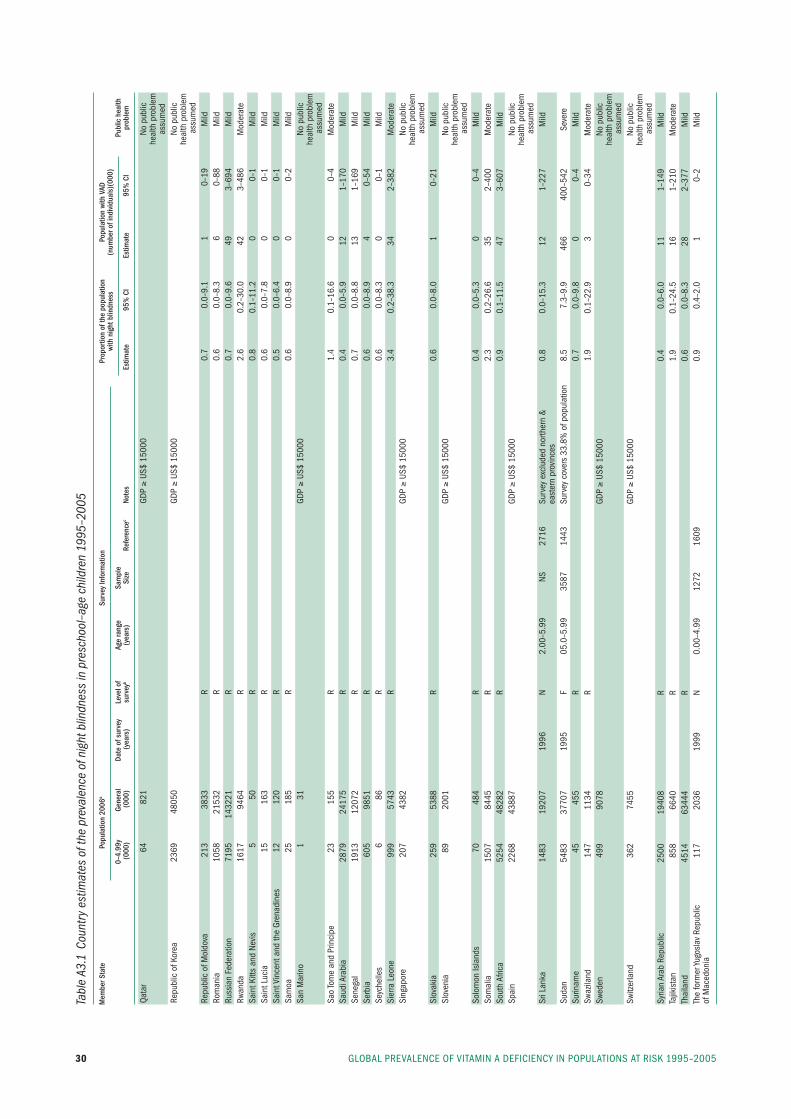
GlObAl preVAlenCe Of VitAmin A DefiCienCy in pOpulAtiOns At risk 1995–200530
Tabl
e A3
.1 C
ount
ry e
stim
ates
of t
he p
reva
lenc
e of
nig
ht b
lindn
ess
in p
resc
hool
–age
chi
ldre
n 19
95–2
005
Mem
ber S
tate
Po
pula
tion
2006
a Su
rvey
Info
rmat
ion
Prop
ortio
n of
the
popu
latio
n
Popu
latio
n wi
th V
AD
with
nig
ht b
lindn
ess
(num
ber o
f ind
ivid
uals
)(00
0)
0–
4.99
y Ge
nera
l Da
te o
f sur
vey
Leve
l of
Age
rang
e Sa
mpl
e
Pu
blic
hea
lth
(000
) (0
00)
(yea
rs)
surv
eyb
(yea
rs)
Size
Re
fere
ncec
Note
s Es
timat
e 95
% C
I Es
timat
e 95
% C
I pr
oble
m
Qata
r 64
82
1
GDp ≥
us$
1500
0
no
pub
lic
he
alth
pro
blem
assu
med
repu
blic
of k
orea
23
69
4805
0
GDp ≥
us$
1500
0
no
pub
lic
he
alth
pro
blem
a
ssum
edre
publ
ic o
f mol
dova
21
3 38
33
r
0.7
0.0–
9.1
1 0–
19
mild
rom
ania
10
58
2153
2
r
0.
6 0.
0–8.
3 6
0–88
m
ildru
ssia
n fe
dera
tion
7195
14
3221
r
0.
7 0.
0–9.
6 49
3–
694
mild
rwan
da
1617
94
64
r
2.6
0.2–
30.0
42
3–
486
mod
erat
esa
int k
itts
and
nevi
s 5
50
r
0.8
0.1–
11.2
0
0–1
mild
sain
t luc
ia
15
163
r
0.6
0.0–
7.8
0 0–
1 m
ildsa
int V
ince
nt a
nd th
e Gr
enad
ines
12
12
0
r
0.
5 0.
0–6.
4 0
0–1
mild
sam
oa
25
185
r
0.6
0.0–
8.9
0 0–
2 m
ildsa
n m
arin
o 1
31
GD
p ≥
us$
1500
0
no
pub
lic
he
alth
pro
blem
a
ssum
edsa
o to
me
and
prin
cipe
23
15
5
r
1.
4 0.
1–16
.6
0 0–
4 m
oder
ate
saud
i Ara
bia
2879
24
175
r
0.4
0.0–
5.9
12
1–17
0 m
ildse
nega
l 19
13
1207
2
r
0.
7 0.
0–8.
8 13
1–
169
mild
serb
ia
605
9851
r
0.
6 0.
0–8.
9 4
0–54
m
ildse
yche
lles
6 86
r
0.
6 0.
0–8.
3 0
0–1
mild
sier
ra l
eone
99
9 57
43
r
3.4
0.2–
38.3
34
2–
382
mod
erat
esi
ngap
ore
207
4382
GDp ≥
us$
1500
0
no
pub
lic
he
alth
pro
blem
a
ssum
edsl
ovak
ia
259
5388
r
0.
6 0.
0–8.
0 1
0–21
m
ildsl
oven
ia
89
2001
GDp ≥
us$
1500
0
no
pub
lic
he
alth
pro
blem
a
ssum
edso
lom
on is
land
s 70
48
4
r
0.
4 0.
0–5.
3 0
0–4
mild
som
alia
15
07
8445
r
2.
3 0.
2–26
.6
35
2–40
0 m
oder
ate
sout
h Af
rica
5254
48
282
r
0.9
0.1–
11.5
47
3–
607
mild
spai
n 22
68
4388
7
GDp ≥
us$
1500
0
no
pub
lic
he
alth
pro
blem
a
ssum
edsr
i lan
ka
1483
19
207
1996
n
2.00
–5.9
9 ns
27
16
surv
ey e
xclu
ded
north
ern
&
0.8
0.0–
15.3
12
1–
227
mild
east
ern
prov
ince
s su
dan
5483
37
707
1995
f
05.0
–5.9
9 35
87
1443
su
rvey
cov
ers
33.8
% o
f pop
ulat
ion
8.5
7.3–
9.9
466
400–
542
seve
resu
rinam
e 45
45
5
r
0.
7 0.
0–9.
8 0
0–4
mild
swaz
iland
14
7 11
34
r
1.9
0.1–
22.9
3
0–34
m
oder
ate
swed
en
499
9078
GDp ≥
us$
1500
0
no
pub
lic
he
alth
pro
blem
a
ssum
edsw
itzer
land
36
2 74
55
GD
p ≥
us$
1500
0
no
pub
lic
he
alth
pro
blem
a
ssum
edsy
rian
Arab
rep
ublic
25
00
1940
8
r
0.
4 0.
0–6.
0 11
1–
149
mild
tajik
ista
n
858
6640
r
1.
9 0.
1–24
.5
16
1–21
0 m
oder
ate
thai
land
45
14
6344
4
r
0.
6 0.
0–8.
3 28
2–
377
mild
the
form
er yu
gosl
av r
epub
lic
117
2036
19
99
n 0.
00–4
.99
1272
16
09
0.
9 0.
4–2.
0 1
0–2
mild
of m
aced
onia
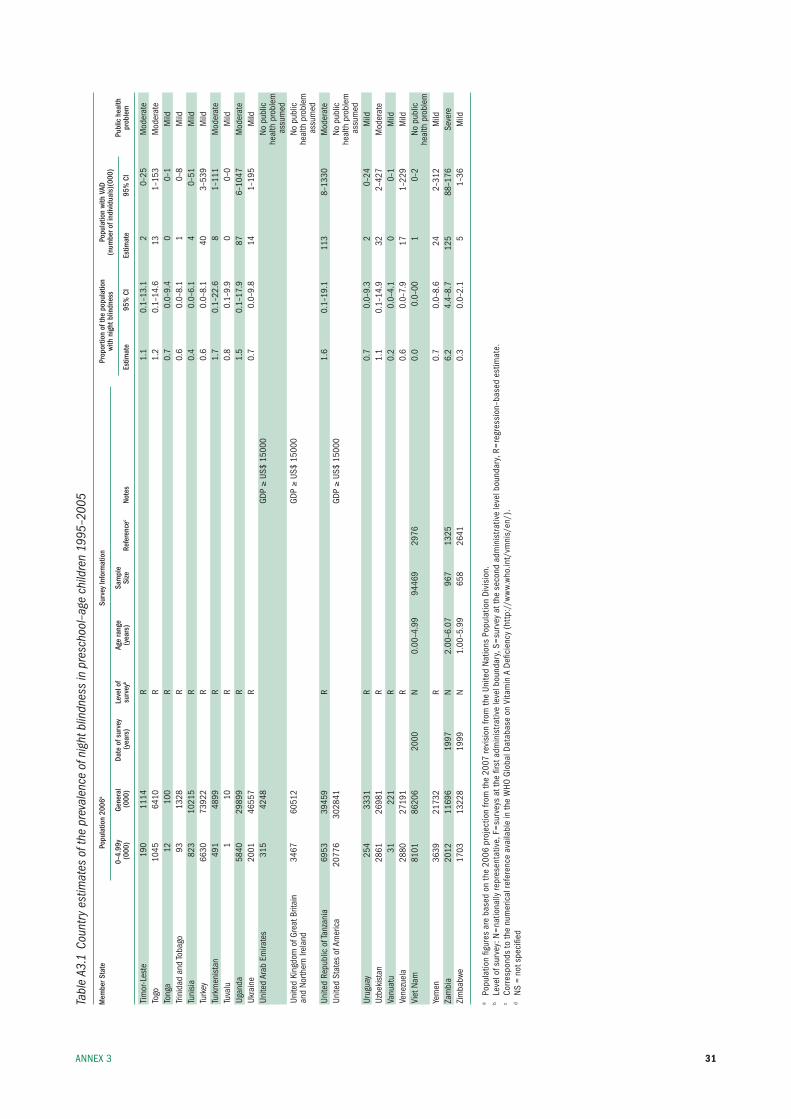
31AnneX 3
Tabl
e A3
.1 C
ount
ry e
stim
ates
of t
he p
reva
lenc
e of
nig
ht b
lindn
ess
in p
resc
hool
–age
chi
ldre
n 19
95–2
005
Mem
ber S
tate
Po
pula
tion
2006
a Su
rvey
Info
rmat
ion
Prop
ortio
n of
the
popu
latio
n
Popu
latio
n wi
th V
AD
with
nig
ht b
lindn
ess
(num
ber o
f ind
ivid
uals
)(00
0)
0–
4.99
y Ge
nera
l Da
te o
f sur
vey
Leve
l of
Age
rang
e Sa
mpl
e
Pu
blic
hea
lth
(000
) (0
00)
(yea
rs)
surv
eyb
(yea
rs)
Size
Re
fere
ncec
Note
s Es
timat
e 95
% C
I Es
timat
e 95
% C
I pr
oble
m
tim
or-l
este
19
0 11
14
r
1.1
0.1–
13.1
2
0–25
m
oder
ate
togo
10
45
6410
r
1.
2 0.
1–14
.6
13
1–15
3 m
oder
ate
tong
a 12
10
0
r
0.
7 0.
0–9.
4 0
0–1
mild
trini
dad
and
toba
go
93
1328
r
0.
6 0.
0–8.
1 1
0–8
mild
tuni
sia
823
1021
5
r
0.
4 0.
0–6.
1 4
0–51
m
ildtu
rkey
66
30
7392
2
r
0.
6 0.
0–8.
1 40
3–
539
mild
turk
men
ista
n 49
1 48
99
r
1.7
0.1–
22.6
8
1–11
1 m
oder
ate
tuva
lu
1 10
r
0.
8 0.
1–9.
9 0
0–0
mild
ugan
da
5840
29
899
r
1.5
0.1–
17.9
87
6–
1047
m
oder
ate
ukra
ine
2001
46
557
r
0.7
0.0–
9.8
14
1–19
5 m
ildun
ited
Arab
em
irate
s 31
5 42
48
GD
p ≥
us$
1500
0
no
pub
lic
he
alth
pro
blem
a
ssum
edun
ited
king
dom
of G
reat
brit
ain
34
67
6051
2
GDp ≥
us$
1500
0
no
pub
lican
d no
rther
n ire
land
he
alth
pro
blem
a
ssum
edun
ited
repu
blic
of t
anza
nia
6953
39
459
r
1.6
0.1–
19.1
11
3 8–
1330
m
oder
ate
unite
d st
ates
of A
mer
ica
2077
6 30
2841
GDp ≥
us$
1500
0
no
pub
lic
he
alth
pro
blem
a
ssum
edur
ugua
y 25
4 33
31
r
0.7
0.0–
9.3
2 0–
24
mild
uzbe
kist
an
2861
26
981
r
1.1
0.1–
14.9
32
2–
427
mod
erat
eVa
nuat
u 31
22
1
r
0.
2 0.
0–4.
1 0
0–1
mild
Vene
zuel
a 28
80
2719
1
r
0.
6 0.
0–7.
9 17
1–
229
mild
Viet
nam
81
01
8620
6 20
00
n 0.
00–4
.99
9446
9 29
76
0.
0 0.
0–00
1
0–2
no p
ublic
heal
th p
robl
emye
men
36
39
2173
2
r
0.
7 0.
0–8.
6 24
2–
312
mild
Zam
bia
20
12
1169
6 19
97
n 2.
00–6
.07
967
1325
6.2
4.4–
8.7
125
88–1
76
seve
reZi
mba
bwe
1703
13
228
1999
n
1.00
–5.9
9 65
8 26
41
0.
3 0.
0–2.
1 5
1–36
m
ild
a po
pula
tion
figur
es a
re b
ased
on
the
2006
pro
ject
ion
from
the
2007
revi
sion
from
the
unite
d n
atio
ns p
opul
atio
n D
ivis
ion.
b le
vel o
f sur
vey:
n=
natio
nally
repr
esen
tativ
e, f
=su
rvey
s at
the
first
adm
inis
trat
ive
leve
l bou
ndar
y, s
=su
rvey
at t
he s
econ
d ad
min
istr
ativ
e le
vel b
ound
ary,
r=
regr
essi
on–b
ased
est
imat
e.c
Corr
espo
nds
to th
e nu
mer
ical
refe
renc
e av
aila
ble
in th
e W
HO G
loba
l Dat
abas
e on
Vita
min
A D
efici
ency
(ht
tp:/
/ww
w.w
ho.in
t/vm
nis/
en/)
.d
ns
= no
t spe
cifie
d
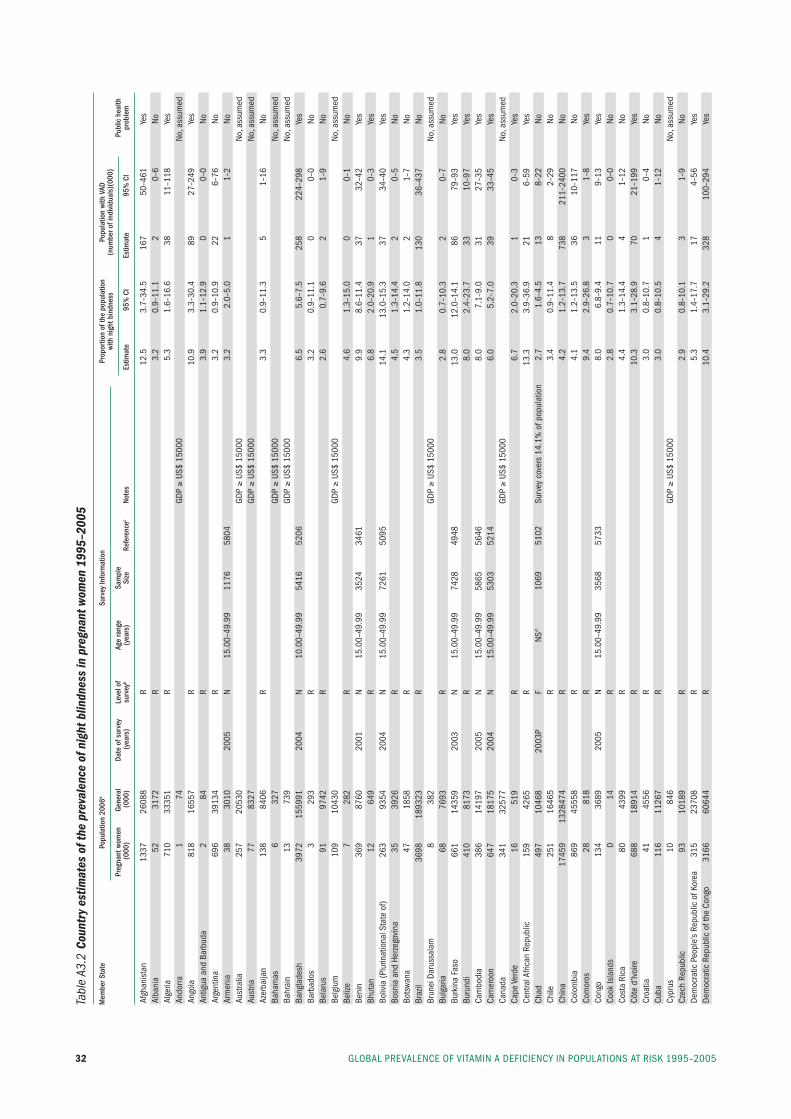
GlObAl preVAlenCe Of VitAmin A DefiCienCy in pOpulAtiOns At risk 1995–200532
Tabl
e A3
.2 C
ount
ry e
stim
ates
of t
he p
reva
lenc
e of
nig
ht b
lindn
ess
in p
regn
ant w
omen
199
5–20
05
Mem
ber S
tate
Po
pula
tion
2006
a Su
rvey
Info
rmat
ion
Prop
ortio
n of
the
popu
latio
n
Popu
latio
n wi
th V
AD
with
nig
ht b
indn
ess
(num
ber o
f ind
ivid
uals
)(00
0)
Pr
egna
nt w
omen
Ge
nera
l Da
te o
f sur
vey
Leve
l of
Age
rang
e Sa
mpl
e
Pu
blic
hea
lth
(000
) (0
00)
(yea
rs)
surv
eyb
(yea
rs)
Size
Re
fere
ncec
Note
s Es
timat
e 95
% C
I Es
timat
e 95
% C
I pr
oble
m
Afgh
anis
tan
1337
26
088
r
12.5
3.
7–34
.5
167
50–4
61
yes
Alba
nia
52
31
72
r
3.2
0.9–
11.1
2
0–6
noAl
geria
71
0 33
351
r
5.3
1.6–
16.6
38
11
–118
ye
sAn
dorra
1
74
GD
p ≥
us$
1500
0
no
, ass
umed
Ango
la
818
1655
7
r
10
.9
3.3–
30.4
89
27
–249
ye
sAn
tigua
and
bar
buda
2
84
r
3.9
1.1–
12.9
0
0–0
noAr
gent
ina
696
3913
4
r
3.
2 0.
9–10
.9
22
6–76
no
Arm
enia
38
30
10
2005
n
15.0
0–49
.99
1176
58
04
3.
2 2.
0–5.
0 1
1–2
noAu
stra
lia
257
2053
0
GDp ≥
us$
1500
0
no
, ass
umed
Aust
ria
77
8327
GDp ≥
us$
1500
0
no
, ass
umed
Azer
baija
n 13
8 84
06
r
3.3
0.9–
11.3
5
1–16
no
baha
mas
6
327
GD
p ≥
us$
1500
0
no
, ass
umed
bahr
ain
13
739
GD
p ≥
us$
1500
0
no
, ass
umed
bang
lade
sh
3972
15
5991
20
04
n 10
.00–
49.9
9 54
16
5206
6.5
5.6–
7.5
258
224–
298
yes
barb
ados
3
293
r
3.2
0.9–
11.1
0
0–0
nobe
laru
s 91
97
42
r
2.6
0.7–
9.6
2 1–
9 no
belg
ium
10
9 10
430
GD
p ≥
us$
1500
0
no
, ass
umed
beliz
e 7
282
r
4.6
1.3–
15.0
0
0–1
nobe
nin
369
8760
20
01
n 15
.00–
49.9
9 35
24
3461
9.9
8.6–
11.4
37
32
–42
yes
bhut
an
12
649
r
6.8
2.0–
20.9
1
0–3
yes
boliv
ia (p
lurin
atio
nal s
tate
of)
263
9354
20
04
n 15
.00–
49.9
9 72
61
5095
14.1
13
.0–1
5.3
37
34–4
0 ye
sbo
snia
and
Her
zego
vina
35
39
26
r
4.5
1.3–
14.4
2
0–5
nobo
tswa
na
47
1858
r
4.
3 1.
2–14
.0
2 1–
7 no
braz
il 36
98
1893
23
r
3.5
1.0–
11.8
13
0 36
–437
no
brun
ei D
arus
sala
m
8 38
2
GDp ≥
us$
1500
0
no
, ass
umed
bulg
aria
68
76
93
r
2.8
0.7–
10.3
2
0–7
nobu
rkin
a fa
so
661
1435
9 20
03
n 15
.00–
49.9
9 74
28
4948
13.0
12
.0–1
4.1
86
79–9
3 ye
sbu
rund
i 41
0 81
73
r
8.0
2.4–
23.7
33
10
–97
yes
Cam
bodi
a
386
1419
7 20
05
n 15
.00–
49.9
9 58
65
5646
8.0
7.1–
9.0
31
27–3
5 ye
sCa
mer
oon
64
7 18
175
2004
n
15.0
0–49
.99
5303
52
14
6.
0 5.
2–7.
0 39
33
–45
yes
Cana
da
341
3257
7
GDp ≥
us$
1500
0
no
, ass
umed
Cape
Ver
de
16
519
r
6.7
2.0–
20.3
1
0–3
yes
Cent
ral A
frica
n re
publ
ic
159
4265
r
13
.3
3.9–
36.9
21
6–
59
yes
Chad
49
7 10
468
2003
p f
nsd
1069
51
02
surv
ey c
over
s 14
.1%
of p
opul
atio
n 2.
7 1.
6–4.
5 13
8–
22
noCh
ile
251
1646
5
r
3.
4 0.
9–11
.4
8 2–
29
noCh
ina
1745
9 13
2847
4
r
4.
2 1.
2–13
.7
738
211–
2400
no
Colo
mbi
a 86
9 45
558
r
4.1
1.2–
13.5
36
10
–117
no
Com
oros
28
81
8
r
9.
4 2.
9–26
.8
3 1–
8 ye
sCo
ngo
134
3689
20
05
n 15
.00–
49.9
9 35
68
5733
8.0
6.8–
9.4
11
9–13
ye
sCo
ok is
land
s 0
14
r
2.8
0.7–
10.7
0
0–0
noCo
sta
rica
80
43
99
r
4.4
1.3–
14.4
4
1–12
no
Côte
d’iv
oire
68
8 18
914
r
10.3
3.
1–28
.9
70
21–1
99
yes
Croa
tia
41
4556
r
3.
0 0.
8–10
.7
1 0–
4 no
Cuba
11
6 11
267
r
3.0
0.8–
10.5
4
1–12
no
Cypr
us
10
846
GD
p ≥
us$
1500
0
no
, ass
umed
Czec
h re
publ
ic
93
1018
9
r
2.
9 0.
8–10
.1
3 1–
9 no
Dem
ocra
tic p
eopl
e’s
repu
blic
of k
orea
31
5 23
708
r
5.3
1.4–
17.7
17
4–
56
yes
Dem
ocra
tic r
epub
lic o
f the
Con
go
3166
60
644
r
10.4
3.
1–29
.2
328
100–
294
yes
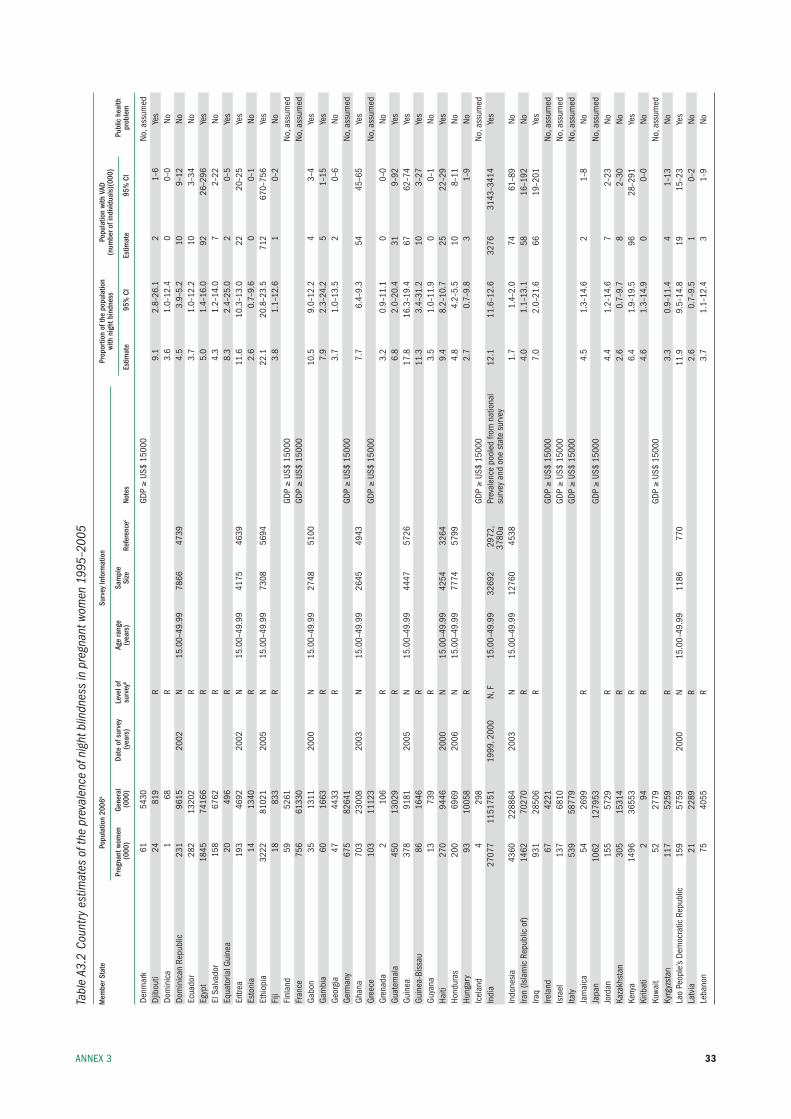
33AnneX 3
Tabl
e A3
.2 C
ount
ry e
stim
ates
of t
he p
reva
lenc
e of
nig
ht b
lindn
ess
in p
regn
ant w
omen
199
5–20
05
Mem
ber S
tate
Po
pula
tion
2006
a Su
rvey
Info
rmat
ion
Prop
ortio
n of
the
popu
latio
n
Popu
latio
n wi
th V
AD
with
nig
ht b
indn
ess
(num
ber o
f ind
ivid
uals
)(00
0)
Pr
egna
nt w
omen
Ge
nera
l Da
te o
f sur
vey
Leve
l of
Age
rang
e Sa
mpl
e
Pu
blic
hea
lth
(000
) (0
00)
(yea
rs)
surv
eyb
(yea
rs)
Size
Re
fere
ncec
Note
s Es
timat
e 95
% C
I Es
timat
e 95
% C
I pr
oble
m
Denm
ark
61
5430
GDp ≥
us$
1500
0
no
, ass
umed
Djib
outi
24
819
r
9.1
2.8–
26.1
2
1–6
yes
Dom
inic
a 1
68
r
3.6
1.0–
12.4
0
0–0
noDo
min
ican
rep
ublic
23
1 96
15
2002
n
15.0
0–49
.99
7866
47
39
4.
5 3.
9–5.
2 10
9–
12
noec
uado
r 28
2 13
202
r
3.7
1.0–
12.2
10
3–
34
noeg
ypt
1845
74
166
r
5.0
1.4–
16.0
92
26
–296
ye
sel
sal
vado
r 15
8 67
62
r
4.3
1.2–
14.0
7
2–22
no
equa
toria
l Gui
nea
20
496
r
8.3
2.4–
25.0
2
0–5
yes
eritr
ea
193
4692
20
02
n 15
.00–
49.9
9 41
75
4639
11.6
10
.3–1
3.0
22
20–2
5 ye
ses
toni
a 14
13
40
r
2.6
0.7–
9.6
0 0–
1 no
ethi
opia
32
22
8102
1 20
05
n 15
.00–
49.9
9 73
08
5694
22.1
20
.8–2
3.5
712
670–
756
yes
fiji
18
833
r
3.8
1.1–
12.6
1
0–2
nofi
nlan
d 59
52
61
GD
p ≥
us$
1500
0
no
, ass
umed
fran
ce
756
6133
0
GDp ≥
us$
1500
0
no
, ass
umed
Gabo
n
35
1311
20
00
n 15
.00–
49.9
9 27
48
5100
10.5
9.
0–12
.2
4 3–
4 ye
sGa
mbi
a
60
1663
r
7.
9 2.
3–24
.2
5 1–
15
yes
Geor
gia
47
4433
r
3.
7 1.
0–13
.5
2 0–
6 no
Germ
any
675
8264
1
GDp ≥
us$
1500
0
no
, ass
umed
Ghan
a 70
3 23
008
2003
n
15.0
0–49
.99
2645
49
43
7.
7 6.
4–9.
3 54
45
–65
yes
Gree
ce
103
1112
3
GDp ≥
us$
1500
0
no
, ass
umed
Gren
ada
2 10
6
r
3.
2 0.
9–11
.1
0 0–
0 no
Guat
emal
a 45
0 13
029
r
6.8
2.0–
20.4
31
9–
92
yes
Guin
ea
378
9181
20
05
n 15
.00–
49.9
9 44
47
5726
17.8
16
.3–1
9.4
67
62–7
4 ye
sGu
inea
-bis
sau
86
1646
r
11
.3
3.4–
31.2
10
3–
27
yes
Guya
na
13
739
r
3.5
1.0–
11.9
0
0–1
noHa
iti
270
9446
20
00
n 15
.00–
49.9
9 42
54
3264
9.4
8.2–
10.7
25
22
–29
yes
Hond
uras
20
0 69
69
2006
n
15.0
0–49
.99
7774
57
99
4.
8 4.
2–5.
5 10
8–
11
noHu
ngar
y 93
10
058
r
2.7
0.7–
9.8
3 1–
9 no
icel
and
4 29
8
GDp ≥
us$
1500
0
no
, ass
umed
indi
a 27
077
1151
751
1999
, 200
0 n,
f
15.0
0–49
.99
3269
2 29
72,
prev
alen
ce p
oole
d fro
m n
atio
nal
12.1
11
.6–1
2.6
3276
31
43–3
414
yes
37
80a
surv
ey a
nd o
ne s
tate
sur
vey
indo
nesi
a
4360
22
8864
20
03
n 15
.00–
49.9
9 12
760
4538
1.7
1.4–
2.0
74
61–8
9 no
iran
(isla
mic
rep
ublic
of)
1462
70
270
r
4.0
1.1–
13.1
58
16
–192
no
iraq
931
2850
6
r
7.
0 2.
0–21
.6
66
19–2
01
yes
irela
nd
67
4221
GDp ≥
us$
1500
0
no
, ass
umed
isra
el
137
6810
GDp ≥
us$
1500
0
no
, ass
umed
italy
53
9 58
779
GD
p ≥
us$
1500
0
no
, ass
umed
Jam
aica
54
26
99
r
4.5
1.3–
14.6
2
1–8
noJa
pan
10
62
1279
53
GD
p ≥
us$
1500
0
no
, ass
umed
Jord
an
155
5729
r
4.
4 1.
2–14
.6
7 2–
23
noka
zakh
stan
30
5 15
314
r
2.6
0.7–
9.7
8 2–
30
noke
nya
1496
36
553
r
6.4
1.9–
19.5
96
28
–291
ye
ski
ribat
i 2
94
r
4.6
1.3–
14.9
0
0–0
noku
wait
52
2779
GDp ≥
us$
1500
0
no
, ass
umed
kyrg
yzst
an
117
5259
r
3.
3 0.
9–11
.4
4 1–
13
nola
o pe
ople
’s De
moc
ratic
rep
ublic
15
9 57
59
2000
n
15.0
0–49
.99
1186
77
0
11.9
9.
5–14
.8
19
15–2
3 ye
sla
tvia
21
22
89
r
2.6
0.7–
9.5
1 0–
2 no
leba
non
75
4055
r
3.
7 1.
1–12
.4
3 1–
9 no
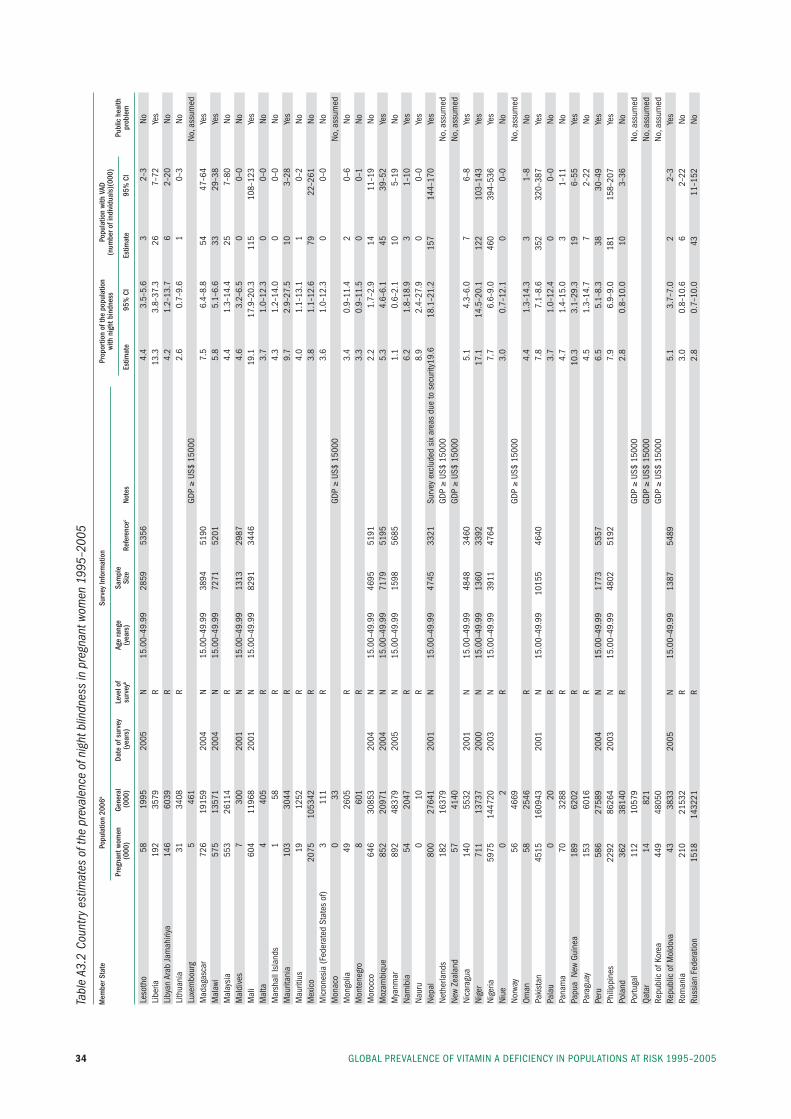
GlObAl preVAlenCe Of VitAmin A DefiCienCy in pOpulAtiOns At risk 1995–200534
Tabl
e A3
.2 C
ount
ry e
stim
ates
of t
he p
reva
lenc
e of
nig
ht b
lindn
ess
in p
regn
ant w
omen
199
5–20
05
Mem
ber S
tate
Po
pula
tion
2006
a Su
rvey
Info
rmat
ion
Prop
ortio
n of
the
popu
latio
n
Popu
latio
n wi
th V
AD
with
nig
ht b
indn
ess
(num
ber o
f ind
ivid
uals
)(00
0)
Pr
egna
nt w
omen
Ge
nera
l Da
te o
f sur
vey
Leve
l of
Age
rang
e Sa
mpl
e
Pu
blic
hea
lth
(000
) (0
00)
(yea
rs)
surv
eyb
(yea
rs)
Size
Re
fere
ncec
Note
s Es
timat
e 95
% C
I Es
timat
e 95
% C
I pr
oble
m
leso
tho
58
1995
20
05
n 15
.00–
49.9
9 28
59
5356
4.4
3.5–
5.6
3 2–
3 no
libe
ria
192
3579
r
13
.3
3.8–
37.3
26
7–
72
yes
liby
an A
rab
Jam
ahiri
ya
146
6039
r
4.
2 1.
2–13
.7
6 2–
20
noli
thua
nia
31
3408
r
2.
6 0.
7–9.
6 1
0–3
nolu
xem
bour
g 5
461
GD
p ≥
us$
1500
0
no
, ass
umed
mad
agas
car
726
1915
9 20
04
n 15
.00–
49.9
9 38
94
5190
7.5
6.4–
8.8
54
47–6
4 ye
sm
alaw
i 57
5 13
571
2004
n
15.0
0–49
.99
7271
52
01
5.
8 5.
1–6.
6 33
29
–38
yes
mal
aysi
a 55
3 26
114
r
4.4
1.3–
14.4
25
7–
80
nom
aldi
ves
7 30
0 20
01
n 15
.00–
49.9
9 13
13
2987
4.6
3.2–
6.5
0 0–
0 no
mal
i 60
4 11
968
2001
n
15.0
0–49
.99
8291
34
46
19
.1
17.9
–20.
3 11
5 10
8–12
3 ye
sm
alta
4
405
r
3.7
1.0–
12.3
0
0–0
nom
arsh
all i
slan
ds
1 58
r
4.
3 1.
2–14
.0
0 0–
0 no
mau
ritan
ia
103
3044
r
9.
7 2.
9–27
.5
10
3–28
ye
sm
aurit
ius
19
1252
r
4.
0 1.
1–13
.1
1 0–
2 no
mex
ico
2075
10
5342
r
3.
8 1.
1–12
.6
79
22–2
61
nom
icro
nesi
a (f
eder
ated
sta
tes
of)
3 11
1
r
3.
6 1.
0–12
.3
0 0–
0 no
mon
aco
0 33
GDp ≥
us$
1500
0
no
, ass
umed
mon
golia
49
26
05
r
3.4
0.9–
11.4
2
0–6
nom
onte
negr
o 8
601
r
3.3
0.9–
11.5
0
0–1
nom
oroc
co
646
3085
3 20
04
n 15
.00–
49.9
9 46
95
5191
2.2
1.7–
2.9
14
11–1
9 no
moz
ambi
que
852
2097
1 20
04
n 15
.00–
49.9
9 71
79
5195
5.3
4.6–
6.1
45
39–5
2 ye
sm
yanm
ar
892
4837
9 20
05
n 15
.00–
49.9
9 15
98
5685
1.1
0.6–
2.1
10
5–19
no
nam
ibia
54
20
47
r
6.2
1.8–
18.9
3
1–10
ye
sna
uru
0 10
r
8.
9 2.
4–27
.9
0 0–
0 ye
sne
pal
800
2764
1 20
01
n 15
.00–
49.9
9 47
45
3321
su
rvey
exc
lude
d si
x ar
eas
due
to s
ecur
ity 19
.6
18.1
–21.
2 15
7 14
4–17
0 ye
sne
ther
land
s 18
2 16
379
GD
p ≥
us$
1500
0
no
, ass
umed
new
Zeal
and
57
4140
GDp ≥
us$
1500
0
no
, ass
umed
nica
ragu
a 14
0 55
32
2001
n
15.0
0–49
.99
4848
34
60
5.
1 4.
3–6.
0 7
6–8
yes
nige
r 71
1 13
737
2000
n
15.0
0–49
.99
1360
33
92
17
.1
14.5
–20.
1 12
2 10
3–14
3 ye
sni
geria
59
75
1447
20
2003
n
15.0
0–49
.99
3911
47
64
7.
7 6.
6–9.
0 46
0 39
4–53
6 ye
sni
ue
0 2
r
3.0
0.7–
12.1
0
0–0
nono
rway
56
46
69
GD
p ≥
us$
1500
0
no
, ass
umed
Oman
58
25
46
r
4.4
1.3–
14.3
3
1–8
nopa
kist
an
4515
16
0943
20
01
n 15
.00–
49.9
9 10
155
4640
7.8
7.1–
8.6
352
320–
387
yes
pala
u 0
20
r
3.7
1.0–
12.4
0
0–0
nopa
nam
a 70
32
88
r
4.7
1.4–
15.0
3
1–11
no
papu
a n
ew G
uine
a 18
9 62
02
r
10.3
3.
1–29
.3
19
6–55
ye
spa
ragu
ay
153
6016
r
4.
5 1.
3–14
.7
7 2–
22
nope
ru
586
2758
9 20
04
n 15
.00–
49.9
9 17
73
5357
6.5
5.1–
8.3
38
30–4
9 ye
sph
ilipp
ines
22
92
8626
4 20
03
n 15
.00–
49.9
9 48
02
5192
7.9
6.9–
9.0
181
158–
207
yes
pola
nd
362
3814
0
r
2.
8 0.
8–10
.0
10
3–36
no
portu
gal
112
1057
9
GDp ≥
us$
1500
0
no
, ass
umed
Qata
r 14
82
1
GDp ≥
us$
1500
0
no
, ass
umed
repu
blic
of k
orea
44
9 48
050
GD
p ≥
us$
1500
0
no
, ass
umed
repu
blic
of m
oldo
va
43
3833
20
05
n 15
.00–
49.9
9 13
87
5489
5.1
3.7–
7.0
2 2–
3 ye
sro
man
ia
210
2153
2
r
3.
0 0.
8–10
.6
6 2–
22
noru
ssia
n fe
dera
tion
1518
14
3221
r
2.
8 0.
7–10
.0
43
11–1
52
no
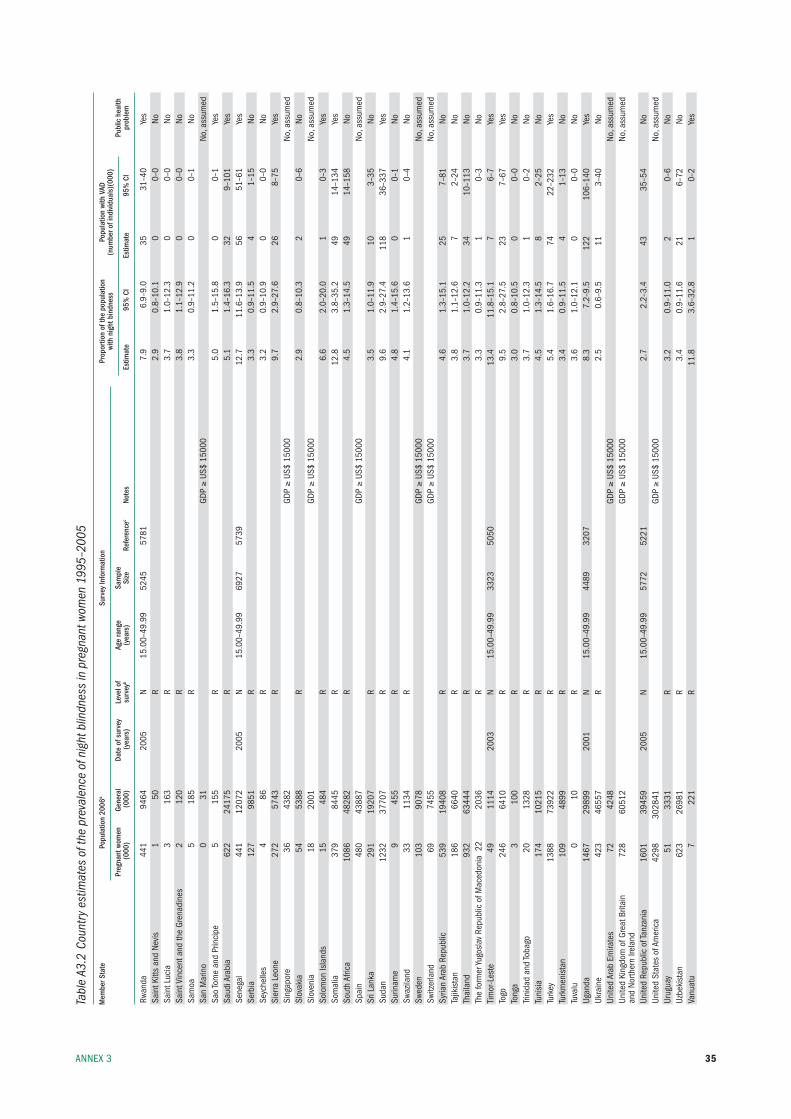
35AnneX 3
Tabl
e A3
.2 C
ount
ry e
stim
ates
of t
he p
reva
lenc
e of
nig
ht b
lindn
ess
in p
regn
ant w
omen
199
5–20
05
Mem
ber S
tate
Po
pula
tion
2006
a Su
rvey
Info
rmat
ion
Prop
ortio
n of
the
popu
latio
n
Popu
latio
n wi
th V
AD
with
nig
ht b
indn
ess
(num
ber o
f ind
ivid
uals
)(00
0)
Pr
egna
nt w
omen
Ge
nera
l Da
te o
f sur
vey
Leve
l of
Age
rang
e Sa
mpl
e
Pu
blic
hea
lth
(000
) (0
00)
(yea
rs)
surv
eyb
(yea
rs)
Size
Re
fere
ncec
Note
s Es
timat
e 95
% C
I Es
timat
e 95
% C
I pr
oble
m
rwan
da
441
9464
20
05
n 15
.00–
49.9
9 52
45
5781
7.9
6.9–
9.0
35
31–4
0 ye
ssa
int k
itts
and
nevi
s 1
50
r
2.9
0.8–
10.1
0
0–0
nosa
int l
ucia
3
163
r
3.7
1.0–
12.3
0
0–0
nosa
int V
ince
nt a
nd th
e Gr
enad
ines
2
120
r
3.8
1.1–
12.9
0
0–0
nosa
moa
5
185
r
3.3
0.9–
11.2
0
0–1
nosa
n m
arin
o 0
31
GD
p ≥
us$
1500
0
no
, ass
umed
sao
tom
e an
d pr
inci
pe
5 15
5
r
5.
0 1.
5–15
.8
0 0–
1 ye
ssa
udi A
rabi
a 62
2 24
175
r
5.1
1.4–
16.3
32
9–
101
yes
sene
gal
441
1207
2 20
05
n 15
.00–
49.9
9 69
27
5739
12.7
11
.6–1
3.9
56
51–6
1 ye
sse
rbia
12
7 98
51
r
3.3
0.9–
11.5
4
1–15
no
seyc
helle
s 4
86
r
3.2
0.9–
10.9
0
0–0
nosi
erra
leo
ne
272
5743
r
9.
7 2.
9–27
.6
26
8–75
ye
ssi
ngap
ore
36
4382
GDp ≥
us$
1500
0
no
, ass
umed
slov
akia
54
53
88
r
2.9
0.8–
10.3
2
0–6
nosl
oven
ia
18
2001
GDp ≥
us$
1500
0
no
, ass
umed
solo
mon
isla
nds
15
484
r
6.6
2.0–
20.0
1
0–3
yes
som
alia
37
9 84
45
r
12.8
3.
8–35
.2
49
14–1
34
yes
sout
h Af
rica
1086
48
282
r
4.5
1.3–
14.5
49
14
–158
no
spai
n 48
0 43
887
GD
p ≥
us$
1500
0
no
, ass
umed
sri l
anka
29
1 19
207
r
3.5
1.0–
11.9
10
3–
35
nosu
dan
1232
37
707
r
9.6
2.9–
27.4
11
8 36
–337
ye
ssu
rinam
e 9
455
r
4.8
1.4–
15.6
0
0–1
nosw
azila
nd
33
1134
r
4.
1 1.
2–13
.6
1 0–
4 no
swed
en
103
9078
GDp ≥
us$
1500
0
no
, ass
umed
switz
erla
nd
69
7455
GDp ≥
us$
1500
0
no
, ass
umed
syria
n Ar
ab r
epub
lic
539
1940
8
r
4.
6 1.
3–15
.1
25
7–81
no
tajik
ista
n
186
6640
r
3.
8 1.
1–12
.6
7 2–
24
noth
aila
nd
932
6344
4
r
3.
7 1.
0–12
.2
34
10–1
13
noth
e fo
rmer
yugo
slav
rep
ublic
of m
aced
onia
22
2036
r
3.
3 0.
9–11
.3
1 0–
3 no
tim
or-l
este
49
11
14
2003
n
15.0
0–49
.99
3323
50
50
13
.4
11.8
–15.
1 7
6–7
yes
togo
24
6 64
10
r
9.5
2.8–
27.5
23
7–
67
yes
tong
a 3
100
r
3.0
0.8–
10.5
0
0–0
notri
nida
d an
d to
bago
20
13
28
r
3.7
1.0–
12.3
1
0–2
notu
nisi
a 17
4 10
215
r
4.5
1.3–
14.5
8
2–25
no
turk
ey
1388
73
922
r
5.4
1.6–
16.7
74
22
–232
ye
stu
rkm
enis
tan
109
4899
r
3.
4 0.
9–11
.5
4 1–
13
notu
valu
0
10
r
3.6
1.0–
12.1
0
0–0
noug
anda
14
67
2989
9 20
01
n 15
.00–
49.9
9 44
89
3207
8.3
7.2–
9.5
122
106–
140
yes
ukra
ine
423
4655
7
r
2.
5 0.
6–9.
5 11
3–
40
noun
ited
Arab
em
irate
s 72
42
48
GD
p ≥
us$
1500
0
no
, ass
umed
unite
d ki
ngdo
m o
f Gre
at b
ritai
n
728
6051
2
GDp ≥
us$
1500
0
no
, ass
umed
and
north
ern
irela
nd
unite
d re
publ
ic o
f tan
zani
a 16
01
3945
9 20
05
n 15
.00–
49.9
9 57
72
5221
2.7
2.2–
3.4
43
35–5
4 no
unite
d st
ates
of A
mer
ica
4298
30
2841
GDp ≥
us$
1500
0
no
, ass
umed
urug
uay
51
3331
r
3.
2 0.
9–11
.0
2 0–
6 no
uzbe
kist
an
623
2698
1
r
3.
4 0.
9–11
.6
21
6–72
no
Vanu
atu
7 22
1
r
11
.8
3.6–
32.8
1
0–2
yes
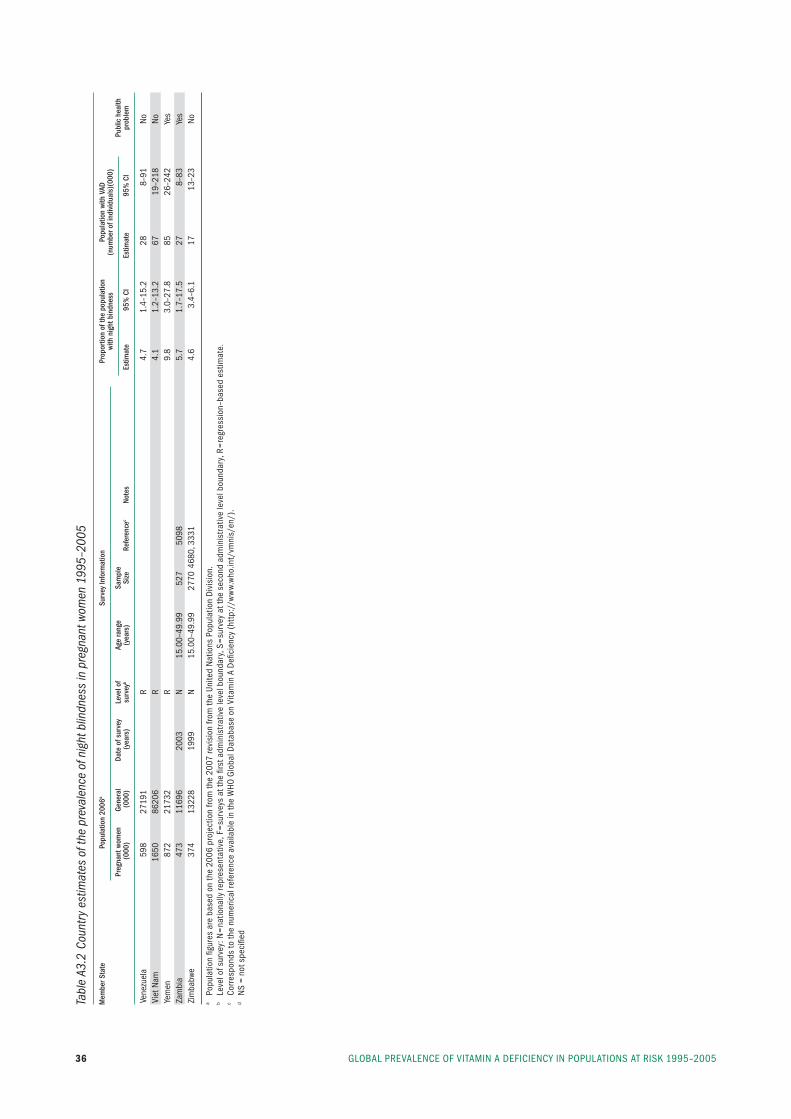
GlObAl preVAlenCe Of VitAmin A DefiCienCy in pOpulAtiOns At risk 1995–200536
Tabl
e A3
.2 C
ount
ry e
stim
ates
of t
he p
reva
lenc
e of
nig
ht b
lindn
ess
in p
regn
ant w
omen
199
5–20
05
Mem
ber S
tate
Po
pula
tion
2006
a Su
rvey
Info
rmat
ion
Prop
ortio
n of
the
popu
latio
n
Popu
latio
n wi
th V
AD
with
nig
ht b
indn
ess
(num
ber o
f ind
ivid
uals
)(00
0)
Pr
egna
nt w
omen
Ge
nera
l Da
te o
f sur
vey
Leve
l of
Age
rang
e Sa
mpl
e
Pu
blic
hea
lth
(000
) (0
00)
(yea
rs)
surv
eyb
(yea
rs)
Size
Re
fere
ncec
Note
s Es
timat
e 95
% C
I Es
timat
e 95
% C
I pr
oble
m
Vene
zuel
a 59
8 27
191
r
4.7
1.4–
15.2
28
8–
91
noVi
et n
am
1650
86
206
r
4.1
1.2–
13.2
67
19
–218
no
yem
en
872
2173
2
r
9.
8 3.
0–27
.8
85
26–2
42
yes
Zam
bia
47
3 11
696
2003
n
15.0
0–49
.99
527
5098
5.7
1.7–
17.5
27
8–
83
yes
Zim
babw
e 37
4 13
228
1999
n
15.0
0–49
.99
2770
468
0, 3
331
4.
6 3.
4–6.
1 17
13
–23
no
a po
pula
tion
figur
es a
re b
ased
on
the
2006
pro
ject
ion
from
the
2007
revi
sion
from
the
unite
d n
atio
ns p
opul
atio
n D
ivis
ion.
b le
vel o
f sur
vey:
n=
natio
nally
repr
esen
tativ
e, f
=su
rvey
s at
the
first
adm
inis
trat
ive
leve
l bou
ndar
y, s
=su
rvey
at t
he s
econ
d ad
min
istr
ativ
e le
vel b
ound
ary,
r=
regr
essi
on–b
ased
est
imat
e.c
Corr
espo
nds
to th
e nu
mer
ical
refe
renc
e av
aila
ble
in th
e W
HO G
loba
l Dat
abas
e on
Vita
min
A D
efici
ency
(ht
tp:/
/ww
w.w
ho.in
t/vm
nis/
en/)
.d
ns
= no
t spe
cifie
d
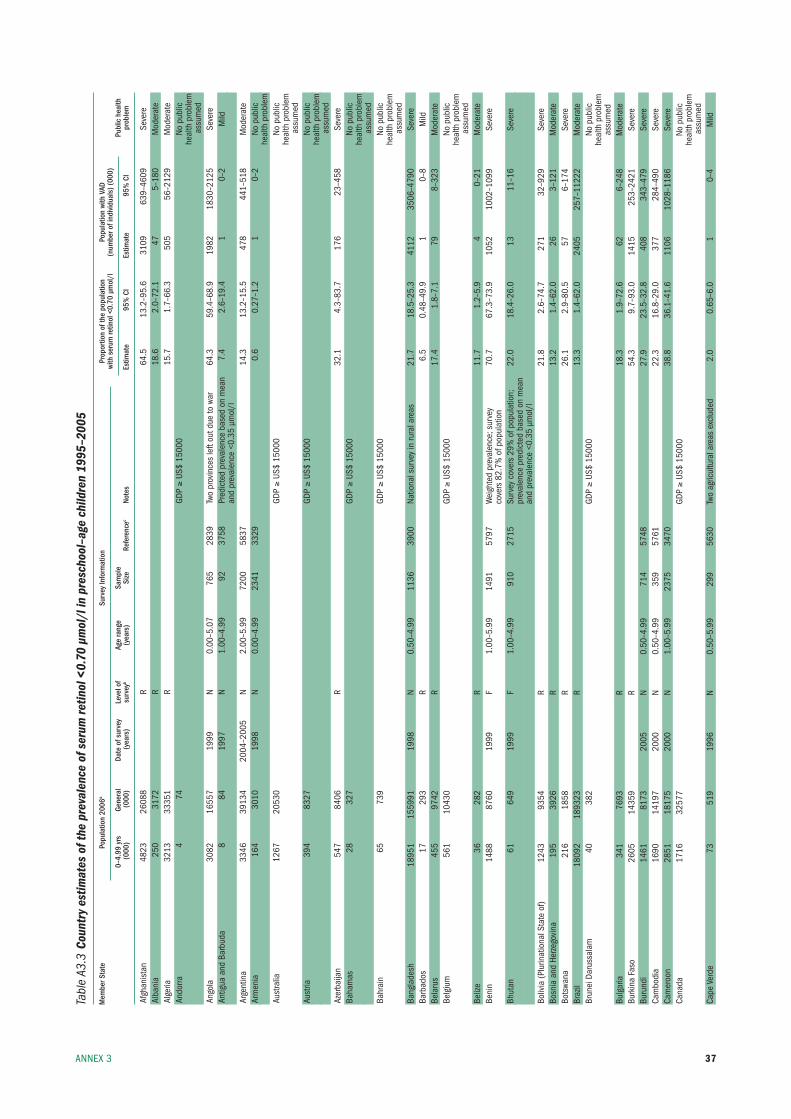
37AnneX 3
Tabl
e A3
.3 C
ount
ry e
stim
ates
of t
he p
reva
lenc
e of
ser
um re
tinol
<0.
70 µ
mol
/l in
pre
scho
ol–a
ge c
hild
ren
1995
–200
5
Mem
ber S
tate
Po
pula
tion
2006
a Su
rvey
Info
rmat
ion
Prop
ortio
n of
the
popu
latio
n
Popu
latio
n wi
th V
AD
with
ser
um re
tinol
<0.
70 µ
mol
/l
(num
ber o
f ind
ivid
uals
) (00
0)
0–
4.99
yrs
Ge
nera
l Da
te o
f sur
vey
Leve
l of
Age
rang
e Sa
mpl
e
Pu
blic
hea
lth
(000
) (0
00)
(yea
rs)
surv
eyb
(yea
rs)
Size
Re
fere
ncec
Note
s Es
timat
e 95
% C
I Es
timat
e 95
% C
I pr
oble
m
Afgh
anis
tan
4823
26
088
r
64.5
13
.2–9
5.6
3109
63
9–46
09
seve
reAl
bani
a
250
3172
r
18
.6
2.0–
72.1
47
5–
180
mod
erat
eAl
geria
32
13
3335
1
r
15
.7
1.7–
66.3
50
5 56
–212
9 m
oder
ate
Ando
rra
4 74
GDp ≥
us$
1500
0
no
pub
lic
he
alth
pro
blem
a
ssum
edAn
gola
30
82
1655
7 19
99
n 0.
00–5
.07
765
2839
tw
o pr
ovin
ces
left
out d
ue to
war
64
.3
59.4
–68.
9 19
82
1830
–212
5 se
vere
Antig
ua a
nd b
arbu
da
8 84
19
97
n 1.
00–4
.99
92
3758
pr
edic
ted
prev
alen
ce b
ased
on
mea
n
7.4
2.6–
19.4
1
0–2
mild
and
prev
alen
ce <
0.35
µm
ol/l
Ar
gent
ina
3346
39
134
2004
–200
5 n
2.00
–5.9
9 72
00
5837
14.3
13
.2–1
5.5
478
441–
518
mod
erat
eAr
men
ia
164
3010
19
98
n 0.
00–4
.99
2341
33
29
0.
6 0.
27–1
.2
1 0–
2 no
pub
lic
he
alth
pro
blem
Aust
ralia
12
67
2053
0
GDp ≥
us$
1500
0
no
pub
lic
he
alth
pro
blem
a
ssum
edAu
stria
39
4 83
27
GD
p ≥
us$
1500
0
no
pub
lic
he
alth
pro
blem
a
ssum
edAz
erba
ijan
547
8406
r
32
.1
4.3–
83.7
17
6 23
–458
se
vere
baha
mas
28
32
7
GDp ≥
us$
1500
0
no
pub
lic
he
alth
pro
blem
a
ssum
edba
hrai
n 65
73
9
GDp ≥
us$
1500
0
no
pub
lic
he
alth
pro
blem
a
ssum
edba
ngla
desh
18
951
1559
91
1998
n
0.50
–4.9
9 11
36
3900
na
tiona
l sur
vey
in ru
ral a
reas
21
.7
18.5
–25.
3 41
12
3506
–479
0 se
vere
barb
ados
17
29
3
r
6.
5 0.
48–4
9.9
1 0–
8 m
ildbe
laru
s 45
5 97
42
r
17.4
1.
8–7.
1 79
8–
323
mod
erat
ebe
lgiu
m
561
1043
0
GDp ≥
us$
1500
0
no
pub
lic
he
alth
pro
blem
a
ssum
edbe
lize
36
282
r
11.7
1.
2–5.
9 4
0–21
m
oder
ate
beni
n 14
88
8760
19
99
f 1.
00–5
.99
1491
57
97
Wei
ghte
d pr
eval
ence
; sur
vey
70
.7
67.3
–73.
9 10
52
1002
–109
9 se
vere
cove
rs 8
2.7%
of p
opul
atio
n bh
utan
61
64
9 19
99
f 1.
00–4
.99
910
2715
su
rvey
cov
ers
29%
of p
opul
atio
n;
22.0
18
.4–2
6.0
13
11–1
6 se
vere
prev
alen
ce p
redi
cted
bas
ed o
n m
ean
and
prev
alen
ce <
0.35
µm
ol/l
bo
livia
(plu
rinat
iona
l sta
te o
f) 12
43
9354
r
21
.8
2.6–
74.7
27
1 32
–929
se
vere
bosn
ia a
nd H
erze
govi
na
195
3926
r
13
.2
1.4–
62.0
26
3–
121
mod
erat
ebo
tswa
na
216
1858
r
26
.1
2.9–
80.5
57
6–
174
seve
rebr
azil
1809
2 18
9323
r
13
.3
1.4–
62.0
24
05
257–
1122
2 m
oder
ate
brun
ei D
arus
sala
m
40
382
GD
p ≥
us$
1500
0
no
pub
lic
he
alth
pro
blem
as
sum
edbu
lgar
ia
341
7693
r
18
.3
1.9–
72.6
62
6–
248
mod
erat
ebu
rkin
a fa
so
2605
14
359
r
54.3
9.
7–93
.0
1415
25
3–24
21
seve
rebu
rund
i 14
61
8173
20
05
n 0.
50–4
.99
714
5748
27.9
23
.5–3
2.8
408
343–
479
seve
reCa
mbo
dia
16
90
1419
7 20
00
n 0.
50–4
.99
359
5761
22.3
16
.8–2
9.0
377
284–
490
seve
reCa
mer
oon
28
51
1817
5 20
00
n 1.
00–5
.99
2375
34
70
38
.8
36.1
–41.
6 11
06
1028
–118
6 se
vere
Cana
da
1716
32
577
GD
p ≥
us$
1500
0
no
pub
lic
he
alth
pro
blem
a
ssum
edCa
pe V
erde
73
51
9 19
96
n 0.
50–5
.99
299
5630
tw
o ag
ricul
tura
l are
as e
xclu
ded
2.0
0.65
–6.0
1
0–4
mild
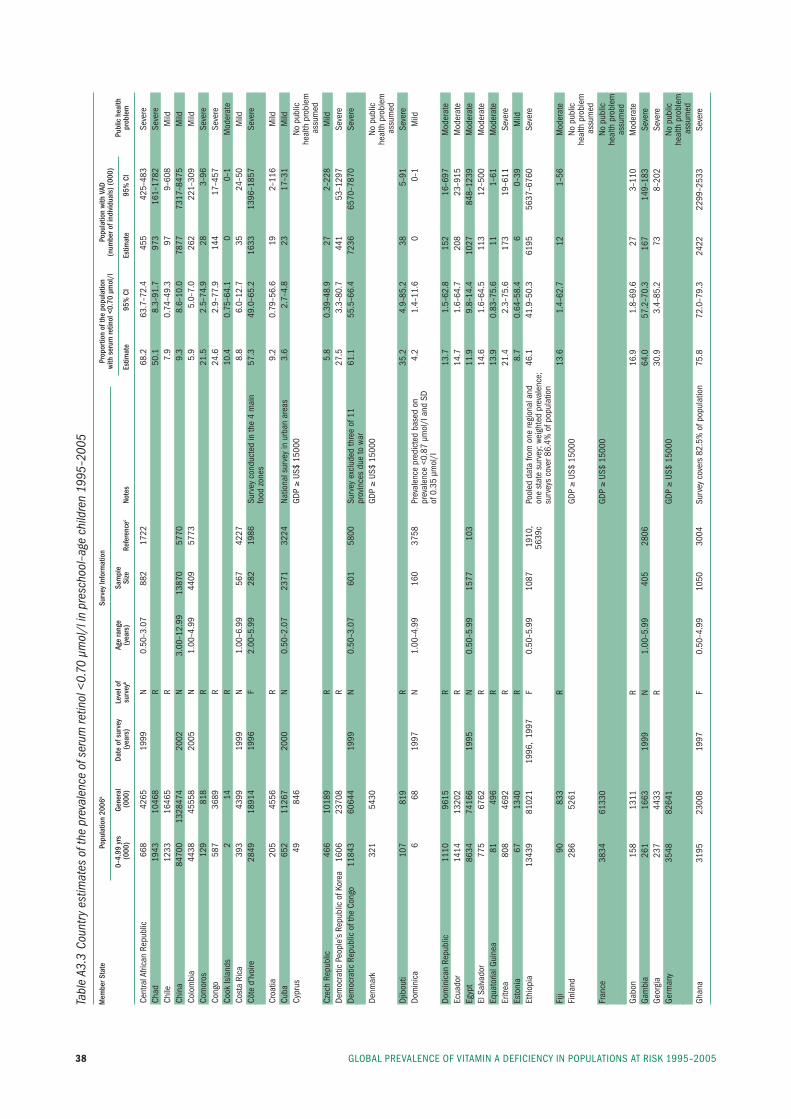
GlObAl preVAlenCe Of VitAmin A DefiCienCy in pOpulAtiOns At risk 1995–200538
Tabl
e A3
.3 C
ount
ry e
stim
ates
of t
he p
reva
lenc
e of
ser
um re
tinol
<0.
70 µ
mol
/l in
pre
scho
ol–a
ge c
hild
ren
1995
–200
5
Mem
ber S
tate
Po
pula
tion
2006
a Su
rvey
Info
rmat
ion
Prop
ortio
n of
the
popu
latio
n
Popu
latio
n wi
th V
AD
with
ser
um re
tinol
<0.
70 µ
mol
/l
(num
ber o
f ind
ivid
uals
) (00
0)
0–
4.99
yrs
Ge
nera
l Da
te o
f sur
vey
Leve
l of
Age
rang
e Sa
mpl
e
Pu
blic
hea
lth
(000
) (0
00)
(yea
rs)
surv
eyb
(yea
rs)
Size
Re
fere
ncec
Note
s Es
timat
e 95
% C
I Es
timat
e 95
% C
I pr
oble
m
Cent
ral A
frica
n re
publ
ic
668
4265
19
99
n 0.
50–3
.07
882
1722
68.2
63
.7–7
2.4
455
425–
483
seve
reCh
ad
1943
10
468
r
50.1
8.
3–91
.7
973
161–
1782
se
vere
Chile
12
33
1646
5
r
7.
9 0.
74–4
9.3
97
9–60
8 m
ildCh
ina
8470
0 13
2847
4 20
02
n 3.
00–1
2.99
13
870
5770
9.3
8.6–
10.0
78
77
7317
–847
5 m
ildCo
lom
bia
4438
45
558
2005
n
1.00
–4.9
9 44
09
5773
5.9
5.0–
7.0
262
221–
309
mild
Com
oros
12
9 81
8
r
21
.5
2.5–
74.9
28
3–
96
seve
reCo
ngo
587
3689
r
24
.6
2.9–
77.9
14
4 17
–457
se
vere
Cook
isla
nds
2 14
r
10
.4
0.75
–64.
1 0
0–1
mod
erat
eCo
sta
rica
39
3 43
99
1999
n
1.00
–6.9
9 56
7 42
27
8.
8 6.
0–12
.7
35
24–5
0 m
ildCô
te d
’ivoi
re
2849
18
914
1996
f
2.00
–5.9
9 28
2 19
86
surv
ey c
ondu
cted
in th
e 4
mai
n
57.3
49
.0–6
5.2
1633
13
96–1
857
seve
re
fo
od z
ones
Cr
oatia
20
5 45
56
r
9.2
0.79
–56.
6 19
2–
116
mild
Cuba
65
2 11
267
2000
n
0.50
–2.0
7 23
71
3224
na
tiona
l sur
vey
in u
rban
are
as
3.6
2.7–
4.8
23
17–3
1 m
ildCy
prus
49
84
6
GDp ≥
us$
1500
0
no
pub
lic
he
alth
pro
blem
a
ssum
edCz
ech
repu
blic
46
6 10
189
r
5.8
0.39
–48.
9 27
2–
228
mild
Dem
ocra
tic p
eopl
e’s
repu
blic
of k
orea
16
06
2370
8
r
27
.5
3.3–
80.7
44
1 53
–129
7 se
vere
Dem
ocra
tic r
epub
lic o
f the
Con
go
1184
3 60
644
1999
n
0.50
–3.0
7 60
1 58
00
surv
ey e
xclu
ded
thre
e of
11
61
.1
55.5
–66.
4 72
36
6570
–787
0 se
vere
prov
ince
s du
e to
war
De
nmar
k 32
1 54
30
GD
p ≥
us$
1500
0
no
pub
lic
he
alth
pro
blem
a
ssum
edDj
ibou
ti 10
7 81
9
r
35
.2
4.9–
85.2
38
5–
91
seve
reDo
min
ica
6 68
19
97
n 1.
00–4
.99
160
3758
pr
eval
ence
pre
dict
ed b
ased
on
4.
2 1.
4–11
.6
0 0–
1 m
ild
pr
eval
ence
<0.
87 µ
mol
/l a
nd s
D
of
0.3
5 µm
ol/l
Do
min
ican
rep
ublic
11
10
9615
r
13
.7
1.5–
62.8
15
2 16
–697
m
oder
ate
ecua
dor
1414
13
202
r
14.7
1.
6–64
.7
208
23–9
15
mod
erat
eeg
ypt
8634
74
166
1995
n
0.50
–5.9
9 15
77
103
11
.9
9.8–
14.4
10
27
848–
1239
m
oder
ate
el s
alva
dor
775
6762
r
14
.6
1.6–
64.5
11
3 12
–500
m
oder
ate
equa
toria
l Gui
nea
81
496
r
13.9
0.
83–7
5.6
11
1–61
m
oder
ate
eritr
ea
808
4692
r
21
.4
2.3–
75.6
17
3 19
–611
se
vere
esto
nia
67
1340
r
8.
7 0.
64–5
8.4
6 0–
39
mild
ethi
opia
13
439
8102
1 19
96,
1997
f
0.50
–5.9
9 10
87
1910
,
pool
ed d
ata
from
one
regi
onal
and
46
.1
41.9
–50.
3 61
95
5637
–676
0 se
vere
56
39c
one
stat
e su
rvey
; wei
ghte
d pr
eval
ence
;
su
rvey
s co
ver 8
6.4%
of p
opul
atio
n fi
ji 90
83
3
r
13
.6
1.4–
62.7
12
1–
56
mod
erat
efi
nlan
d 28
6 52
61
GD
p ≥
us$
1500
0
no
pub
lic
he
alth
pro
blem
a
ssum
edfr
ance
38
34
6133
0
GDp ≥
us$
1500
0
no
pub
lic
he
alth
pro
blem
assu
med
Gabo
n
158
1311
r
16
.9
1.8–
69.6
27
3–
110
mod
erat
eGa
mbi
a
261
1663
19
99
n 1.
00–5
.99
405
2806
64.0
57
.2–7
0.3
167
149–
183
seve
reGe
orgi
a 23
7 44
33
r
30.9
3.
4–85
.2
73
8–20
2 se
vere
Germ
any
3548
82
641
GD
p ≥
us$
1500
0
no
pub
lic
he
alth
pro
blem
a
ssum
edGh
ana
3195
23
008
1997
f
0.50
–4.9
9 10
50
3004
su
rvey
cov
ers
82.5
% o
f pop
ulat
ion
75.8
72
.0–7
9.3
2422
22
99–2
533
seve
re
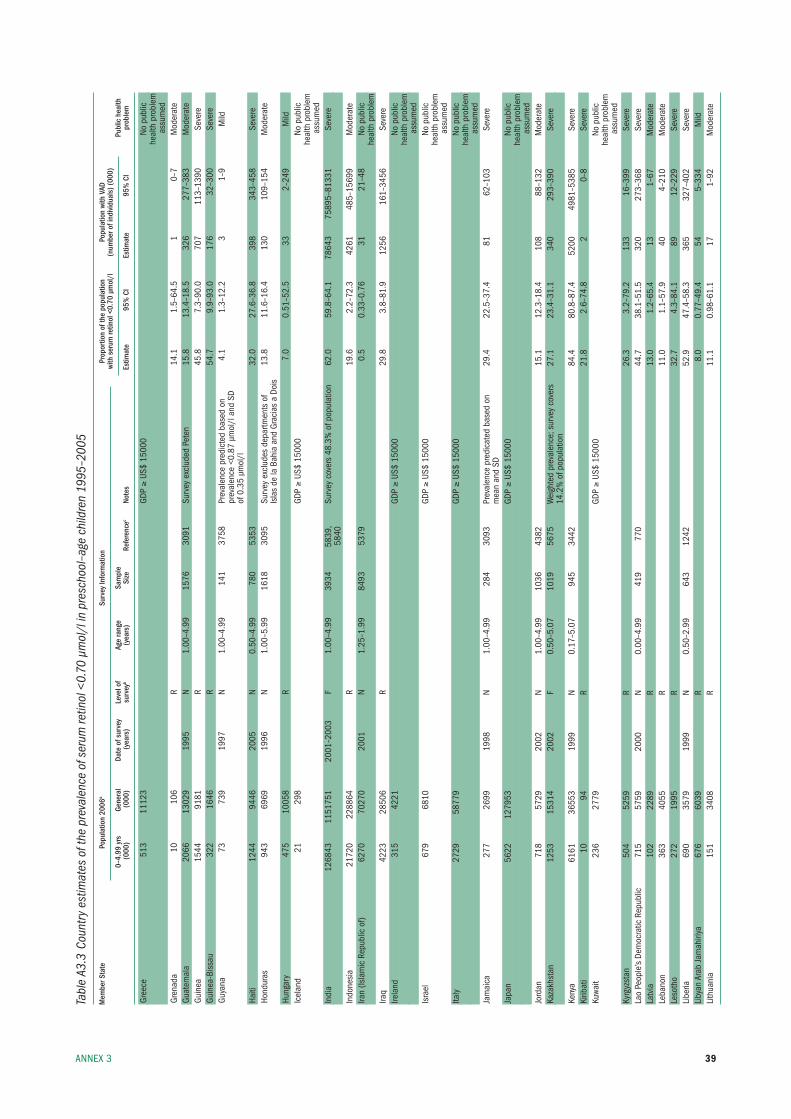
39AnneX 3
Tabl
e A3
.3 C
ount
ry e
stim
ates
of t
he p
reva
lenc
e of
ser
um re
tinol
<0.
70 µ
mol
/l in
pre
scho
ol–a
ge c
hild
ren
1995
–200
5
Mem
ber S
tate
Po
pula
tion
2006
a Su
rvey
Info
rmat
ion
Prop
ortio
n of
the
popu
latio
n
Popu
latio
n wi
th V
AD
with
ser
um re
tinol
<0.
70 µ
mol
/l
(num
ber o
f ind
ivid
uals
) (00
0)
0–
4.99
yrs
Ge
nera
l Da
te o
f sur
vey
Leve
l of
Age
rang
e Sa
mpl
e
Pu
blic
hea
lth
(000
) (0
00)
(yea
rs)
surv
eyb
(yea
rs)
Size
Re
fere
ncec
Note
s Es
timat
e 95
% C
I Es
timat
e 95
% C
I pr
oble
m
Gree
ce
513
1112
3
GDp ≥
us$
1500
0
no
pub
lic
he
alth
pro
blem
a
ssum
edGr
enad
a 10
10
6
r
14
.1
1.5–
64.5
1
0–7
mod
erat
eGu
atem
ala
2066
13
029
1995
n
1.00
–4.9
9 15
76
3091
su
rvey
exc
lude
d pe
ten
15.8
13
.4–1
8.5
326
277–
383
mod
erat
eGu
inea
15
44
9181
r
45
.8
7.3–
90.0
70
7 11
3–13
90
seve
reGu
inea
-bis
sau
322
1646
r
54
.7
9.9–
93.0
17
6 32
–300
se
vere
Guya
na
73
739
1997
n
1.00
–4.9
9 14
1 37
58
prev
alen
ce p
redi
cted
bas
ed o
n
4.1
1.3–
12.2
3
1–9
mild
prev
alen
ce <
0.87
µm
ol/l
and
sD
of 0
.35
µmol
/l
Haiti
12
44
9446
20
05
n 0.
50–4
.99
780
5353
32.0
27
.6–3
6.8
398
343–
458
seve
reHo
ndur
as
943
6969
19
96
n 1.
00–5
.99
1618
30
95
surv
ey e
xclu
des
depa
rtmen
ts o
f 13
.8
11.6
–16.
4 13
0 10
9–15
4 m
oder
ate
isla
s de
la b
ahia
and
Gra
cias
a D
ois
Hung
ary
475
1005
8
r
7.
0 0.
51–5
2.5
33
2–24
9 m
ildic
elan
d 21
29
8
GDp ≥
us$
1500
0
no
pub
lic
he
alth
pro
blem
a
ssum
edin
dia
1268
43
1151
751
2001
–200
3 f
1.00
–4.9
9 39
34
5839
, su
rvey
cov
ers
48.3
% o
f pop
ulat
ion
62.0
59
.8–6
4.1
7864
3 75
895–
8133
1 se
vere
58
40in
done
sia
21
720
2288
64
r
19.6
2.
2–72
.3
4261
48
5–15
699
mod
erat
eira
n (is
lam
ic r
epub
lic o
f) 62
70
7027
0 20
01
n 1.
25–1
.99
8493
53
79
0.
5 0.
33–0
.76
31
21–4
8 no
pub
lic
he
alth
pro
blem
ira
q 42
23
2850
6
r
29
.8
3.8–
81.9
12
56
161–
3456
se
vere
irela
nd
315
4221
GDp ≥
us$
1500
0
no
pub
lic
he
alth
pro
blem
a
ssum
edis
rael
67
9 68
10
GD
p ≥
us$
1500
0
no
pub
lic
he
alth
pro
blem
a
ssum
edita
ly
2729
58
779
GD
p ≥
us$
1500
0
no
pub
lic
he
alth
pro
blem
a
ssum
edJa
mai
ca
277
2699
19
98
n 1.
00–4
.99
284
3093
pr
eval
ence
pre
dica
ted
base
d on
29
.4
22.5
–37.
4 81
62
–103
se
vere
mea
n an
d sD
Ja
pan
56
22
1279
53
GD
p ≥
us$
1500
0
no
pub
lic
he
alth
pro
blem
a
ssum
edJo
rdan
71
8 57
29
2002
n
1.00
–4.9
9 10
36
4382
15.1
12
.3–1
8.4
108
88–1
32
mod
erat
eka
zakh
stan
12
53
1531
4 20
02
f 0.
50–5
.07
1019
56
75
Wei
ghte
d pr
eval
ence
; sur
vey
cove
rs
27.1
23
.4–3
1.1
340
293–
390
seve
re
14
.2%
of p
opul
atio
n ke
nya
6161
36
553
1999
n
0.17
–5.0
7 94
5 34
42
84
.4
80.8
–87.
4 52
00
4981
–538
5 se
vere
kirib
ati
10
94
r
21.8
2.
6–74
.8
2 0–
8 se
vere
kuwa
it 23
6 27
79
GD
p ≥
us$
1500
0
no
pub
lic
he
alth
pro
blem
a
ssum
edky
rgyz
stan
50
4 52
59
r
26.3
3.
2–79
.2
133
16–3
99
seve
rela
o pe
ople
’s De
moc
ratic
rep
ublic
71
5 57
59
2000
n
0.00
–4.9
9 41
9 77
0
44.7
38
.1–5
1.5
320
273–
368
seve
rela
tvia
10
2 22
89
r
13.0
1.
2–65
.4
13
1–67
m
oder
ate
leba
non
363
4055
r
11
.0
1.1–
57.9
40
4–
210
mod
erat
ele
soth
o 27
2 19
95
r
32.7
4.
3–84
.1
89
12–2
29
seve
reli
beria
69
0 35
79
1999
n
0.50
–2.9
9 64
3 12
42
52
.9
47.4
–58.
3 36
5 32
7–40
2 se
vere
liby
an A
rab
Jam
ahiri
ya
676
6039
r
8.
0 0.
77–4
9.4
54
5–33
4 m
ildli
thua
nia
151
3408
r
11
.1
0.98
–61.
1 17
1–
92
mod
erat
e
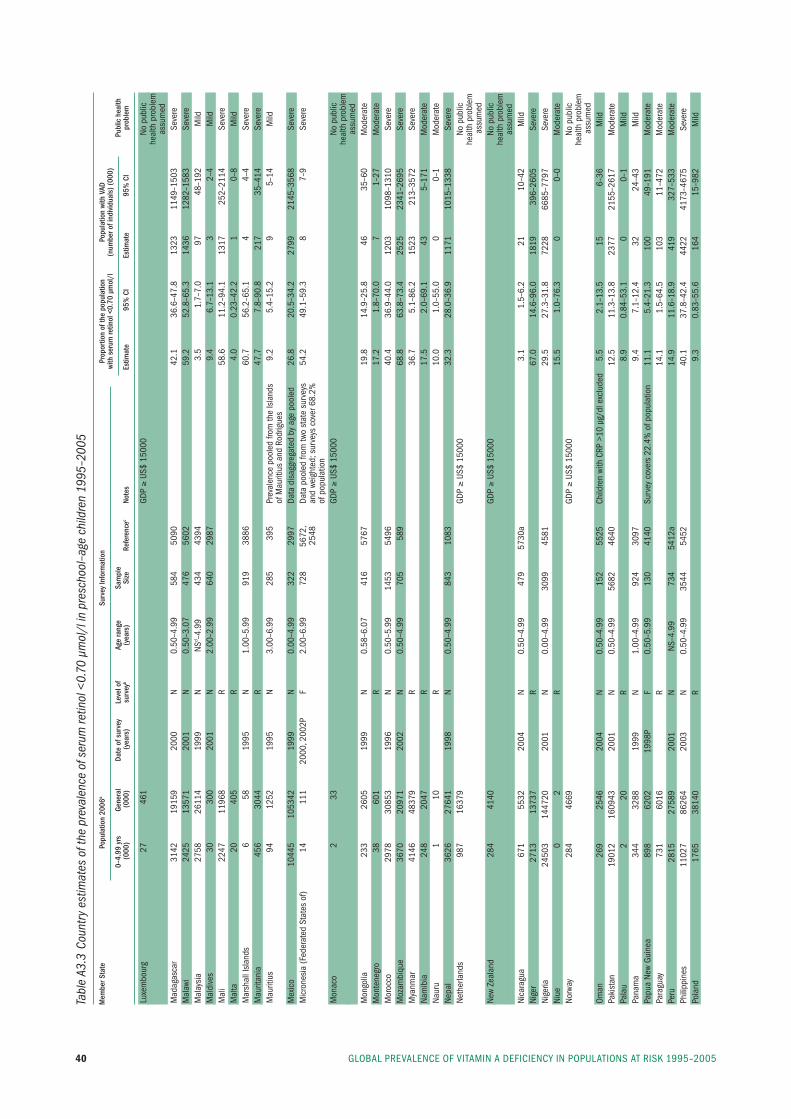
GlObAl preVAlenCe Of VitAmin A DefiCienCy in pOpulAtiOns At risk 1995–200540
Tabl
e A3
.3 C
ount
ry e
stim
ates
of t
he p
reva
lenc
e of
ser
um re
tinol
<0.
70 µ
mol
/l in
pre
scho
ol–a
ge c
hild
ren
1995
–200
5
Mem
ber S
tate
Po
pula
tion
2006
a Su
rvey
Info
rmat
ion
Prop
ortio
n of
the
popu
latio
n
Popu
latio
n wi
th V
AD
with
ser
um re
tinol
<0.
70 µ
mol
/l
(num
ber o
f ind
ivid
uals
) (00
0)
0–
4.99
yrs
Ge
nera
l Da
te o
f sur
vey
Leve
l of
Age
rang
e Sa
mpl
e
Pu
blic
hea
lth
(000
) (0
00)
(yea
rs)
surv
eyb
(yea
rs)
Size
Re
fere
ncec
Note
s Es
timat
e 95
% C
I Es
timat
e 95
% C
I pr
oble
m
luxe
mbo
urg
27
461
GD
p ≥
us$
1500
0
no
pub
lic
he
alth
pro
blem
assu
med
mad
agas
car
3142
19
159
2000
n
0.50
–4.9
9 58
4 50
90
42
.1
36.6
–47.
8 13
23
1149
–150
3 se
vere
mal
awi
2425
13
571
2001
n
0.50
–3.0
7 47
6 56
02
59
.2
52.8
–65.
3 14
36
1282
–158
3 se
vere
mal
aysi
a 27
58
2611
4 19
99
n ns
d –4.
99
434
4394
3.5
1.7–
7.0
97
48–1
92
mild
mal
dive
s 30
30
0 20
01
n
2.00
–2.9
9 64
0 29
87
9.
4 6.
7–13
.1
3 2–
4 m
ildm
ali
2247
11
968
r
58.6
11
.2–9
4.1
1317
25
2–21
14
seve
rem
alta
20
40
5
r
4.
0 0.
23–4
2.2
1 0–
8 m
ildm
arsh
all i
slan
ds
6 58
19
95
n 1.
00–5
.99
919
3886
60.7
56
.2–6
5.1
4 4–
4 se
vere
mau
ritan
ia
456
3044
r
47
.7
7.8–
90.8
21
7 35
–414
se
vere
mau
ritiu
s 94
12
52
1995
n
3.00
–6.9
9 28
5 39
5 pr
eval
ence
poo
led
from
the
isla
nds
9.
2 5.
4–15
.2
9 5–
14
mild
of m
aurit
ius
and
rodr
igue
s m
exic
o 10
445
1053
42
1999
n
0.00
–4.9
9 32
2 29
97
Data
dis
aggr
egat
ed b
y ag
e po
oled
26
.8
20.5
–34.
2 27
99
2145
–356
8 se
vere
mic
rone
sia
(fed
erat
ed s
tate
s of
) 14
11
1 20
00, 2
002p
f
2.00
–6.9
9 72
8 56
72,
Data
poo
led
from
two
stat
e su
rvey
s
54.2
49
.1–5
9.3
8 7–
9 se
vere
25
48
and
weig
hted
; sur
veys
cov
er 6
8.2%
of
pop
ulat
ion
mon
aco
2 33
GDp ≥
us$
1500
0
no
pub
lic
he
alth
pro
blem
assu
med
mon
golia
23
3 26
05
1999
n
0.58
–6.0
7 41
6 57
67
19
.8
14.9
–25.
8 46
35
–60
mod
erat
em
onte
negr
o 38
60
1
r
17
.2
1.8–
70.0
7
1–27
m
oder
ate
mor
occo
29
78
3085
3 19
96
n 0.
50–5
.99
1453
54
96
40
.4
36.9
–44.
0 12
03
1098
–131
0 se
vere
moz
ambi
que
3670
20
971
2002
n
0.50
–4.9
9 70
5 58
9
68.8
63
.8–7
3.4
2525
23
41–2
695
seve
rem
yanm
ar
4146
48
379
r
36.7
5.
1–86
.2
1523
21
3–35
72
seve
rena
mib
ia
248
2047
r
17
.5
2.0–
69.1
43
5–
171
mod
erat
ena
uru
1 10
r
10
.0
1.0–
55.0
0
0–1
mod
erat
ene
pal
3626
27
641
1998
n
0.50
–4.9
9 84
3 10
83
32
.3
28.0
–36.
9 11
71
1015
–133
8 se
vere
neth
erla
nds
987
1637
9
GDp ≥
us$
1500
0
no
pub
lic
he
alth
pro
blem
a
ssum
edne
w Ze
alan
d 28
4 41
40
GD
p ≥
us$
1500
0
no
pub
lic
he
alth
pro
blem
assu
med
nica
ragu
a 67
1 55
32
2004
n
0.50
–4.9
9 47
9 57
30a
3.
1 1.
5–6.
2 21
10
–42
mild
nige
r 27
13
1373
7
r
67
.0
14.6
–96.
0 18
19
396–
2605
se
vere
nige
ria
2450
3 14
4720
20
01
n 0.
00–4
.99
3099
45
81
29
.5
27.3
–31.
8 72
28
6685
–779
7 se
vere
niue
0
2
r
15
.5
1.0–
76.3
0
0–0
mod
erat
eno
rway
28
4 46
69
GD
p ≥
us$
1500
0
no
pub
lic
he
alth
pro
blem
a
ssum
edOm
an
269
2546
20
04
n 0.
50–4
.99
152
5525
Ch
ildre
n wi
th C
rp >
10 µ
g/dl
exc
lude
d 5.
5 2.
1–13
.5
15
6–36
m
ildpa
kist
an
1901
2 16
0943
20
01
n 0.
50–4
.99
5682
46
40
12
.5
11.3
–13.
8 23
77
2155
–261
7 m
oder
ate
pala
u 2
20
r
8.9
0.84
–53.
1 0
0–1
mild
pana
ma
344
3288
19
99
n 1.
00–4
.99
924
3097
9.4
7.1–
12.4
32
24
–43
mild
papu
a ne
w Gu
inea
89
8 62
02
1998
p f
0.50
–5.9
9 13
0 41
40
surv
ey c
over
s 22
.4%
of p
opul
atio
n 11
.1
5.4–
21.3
10
0 49
–191
m
oder
ate
para
guay
73
1 60
16
r
14.1
1.
5–64
.5
103
11–4
72
mod
erat
epe
ru
2815
27
589
2001
n
ns–4
.99
734
5412
a
14.9
11
.6–1
8.9
419
327–
533
mod
erat
eph
ilipp
ines
11
027
8626
4 20
03
n 0.
50–4
.99
3544
54
52
40
.1
37.8
–42.
4 44
22
4173
–467
5 se
vere
pola
nd
1765
38
140
r
9.3
0.83
–55.
6 16
4 15
–982
m
ild
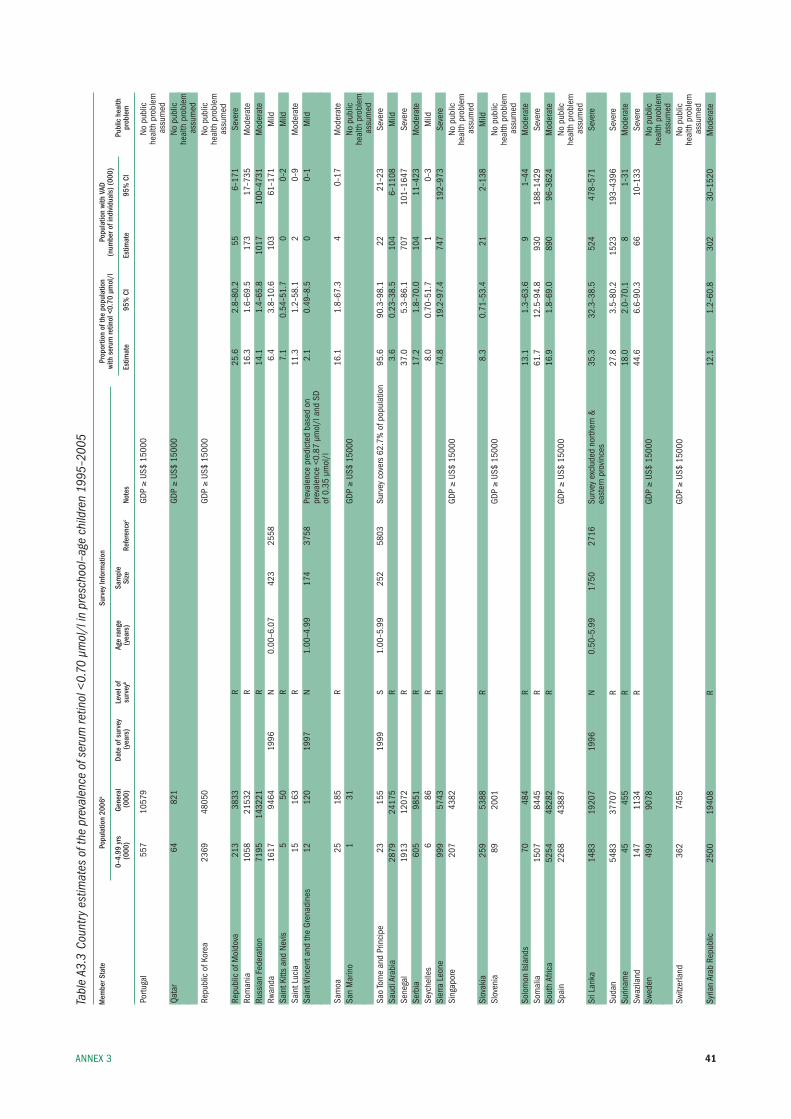
41AnneX 3
Tabl
e A3
.3 C
ount
ry e
stim
ates
of t
he p
reva
lenc
e of
ser
um re
tinol
<0.
70 µ
mol
/l in
pre
scho
ol–a
ge c
hild
ren
1995
–200
5
Mem
ber S
tate
Po
pula
tion
2006
a Su
rvey
Info
rmat
ion
Prop
ortio
n of
the
popu
latio
n
Popu
latio
n wi
th V
AD
with
ser
um re
tinol
<0.
70 µ
mol
/l
(num
ber o
f ind
ivid
uals
) (00
0)
0–
4.99
yrs
Ge
nera
l Da
te o
f sur
vey
Leve
l of
Age
rang
e Sa
mpl
e
Pu
blic
hea
lth
(000
) (0
00)
(yea
rs)
surv
eyb
(yea
rs)
Size
Re
fere
ncec
Note
s Es
timat
e 95
% C
I Es
timat
e 95
% C
I pr
oble
m
portu
gal
557
1057
9
GDp ≥
us$
1500
0
no
pub
lic
he
alth
pro
blem
a
ssum
edQa
tar
64
821
GD
p ≥
us$
1500
0
no
pub
lic
he
alth
pro
blem
a
ssum
edre
publ
ic o
f kor
ea
2369
48
050
GD
p ≥
us$
1500
0
no
pub
lic
he
alth
pro
blem
assu
med
repu
blic
of m
oldo
va
213
3833
r
25
.6
2.8–
80.2
55
6–
171
seve
rero
man
ia
1058
21
532
r
16.3
1.
6–69
.5
173
17–7
35
mod
erat
eru
ssia
n fe
dera
tion
7195
14
3221
r
14
.1
1.4–
65.8
10
17
100–
4731
m
oder
ate
rwan
da
1617
94
64
1996
n
0.00
–6.0
7 42
3 25
58
6.
4 3.
8–10
.6
103
61–1
71
mild
sain
t kitt
s an
d ne
vis
5 50
r
7.
1 0.
54–5
1.7
0 0–
2 m
ildsa
int l
ucia
15
16
3
r
11
.3
1.2–
58.1
2
0–9
mod
erat
esa
int V
ince
nt a
nd th
e Gr
enad
ines
12
12
0 19
97
n 1.
00–4
.99
174
3758
pr
eval
ence
pre
dict
ed b
ased
on
2.
1 0.
49–8
.5
0 0–
1 m
ild
pr
eval
ence
<0.
87 µ
mol
/l a
nd s
D
of
0.3
5 µm
ol/l
sa
moa
25
18
5
r
16
.1
1.8–
67.3
4
0–17
m
oder
ate
san
mar
ino
1 31
GDp ≥
us$
1500
0
no
pub
lic
he
alth
pro
blem
a
ssum
edsa
o to
me
and
prin
cipe
23
15
5 19
99
s 1.
00–5
.99
252
5803
su
rvey
cov
ers
62.7
% o
f pop
ulat
ion
95.6
90
.3–9
8.1
22
21–2
3 se
vere
saud
i Ara
bia
2879
24
175
r
3.6
0.23
–38.
5 10
4 6–
1108
m
ildse
nega
l 19
13
1207
2
r
37
.0
5.3–
86.1
70
7 10
1–16
47
seve
rese
rbia
60
5 98
51
r
17.2
1.
8–70
.0
104
11–4
23
mod
erat
ese
yche
lles
6 86
r
8.
0 0.
70–5
1.7
1 0–
3 m
ildsi
erra
leo
ne
999
5743
r
74
.8
19.2
–97.
4 74
7 19
2–97
3 se
vere
sing
apor
e 20
7 43
82
GD
p ≥
us$
1500
0
no
pub
lic
he
alth
pro
blem
a
ssum
edsl
ovak
ia
259
5388
r
8.
3 0.
71–5
3.4
21
2–13
8 m
ildsl
oven
ia
89
2001
GDp ≥
us$
1500
0
no
pub
lic
he
alth
pro
blem
a
ssum
edso
lom
on is
land
s 70
48
4
r
13
.1
1.3–
63.6
9
1–44
m
oder
ate
som
alia
15
07
8445
r
61
.7
12.5
–94.
8 93
0 18
8–14
29
seve
reso
uth
Afric
a 52
54
4828
2
r
16
.9
1.8–
69.0
89
0 96
–362
4 m
oder
ate
spai
n 22
68
4388
7
GDp ≥
us$
1500
0
no
pub
lic
he
alth
pro
blem
a
ssum
edsr
i lan
ka
1483
19
207
1996
n
0.50
–5.9
9 17
50
2716
su
rvey
exc
lude
d no
rther
n &
35
.3
32.3
–38.
5 52
4 47
8–57
1 se
vere
east
ern
prov
ince
s su
dan
5483
37
707
r
27.8
3.
5–80
.2
1523
19
3–43
96
seve
resu
rinam
e 45
45
5
r
18
.0
2.0–
70.1
8
1–31
m
oder
ate
swaz
iland
14
7 11
34
r
44.6
6.
6–90
.3
66
10–1
33
seve
resw
eden
49
9 90
78
GD
p ≥
us$
1500
0
no
pub
lic
he
alth
pro
blem
a
ssum
edsw
itzer
land
36
2 74
55
GD
p ≥
us$
1500
0
no
pub
lic
he
alth
pro
blem
a
ssum
edsy
rian
Arab
rep
ublic
25
00
1940
8
r
12
.1
1.2–
60.8
30
2 30
–152
0 m
oder
ate
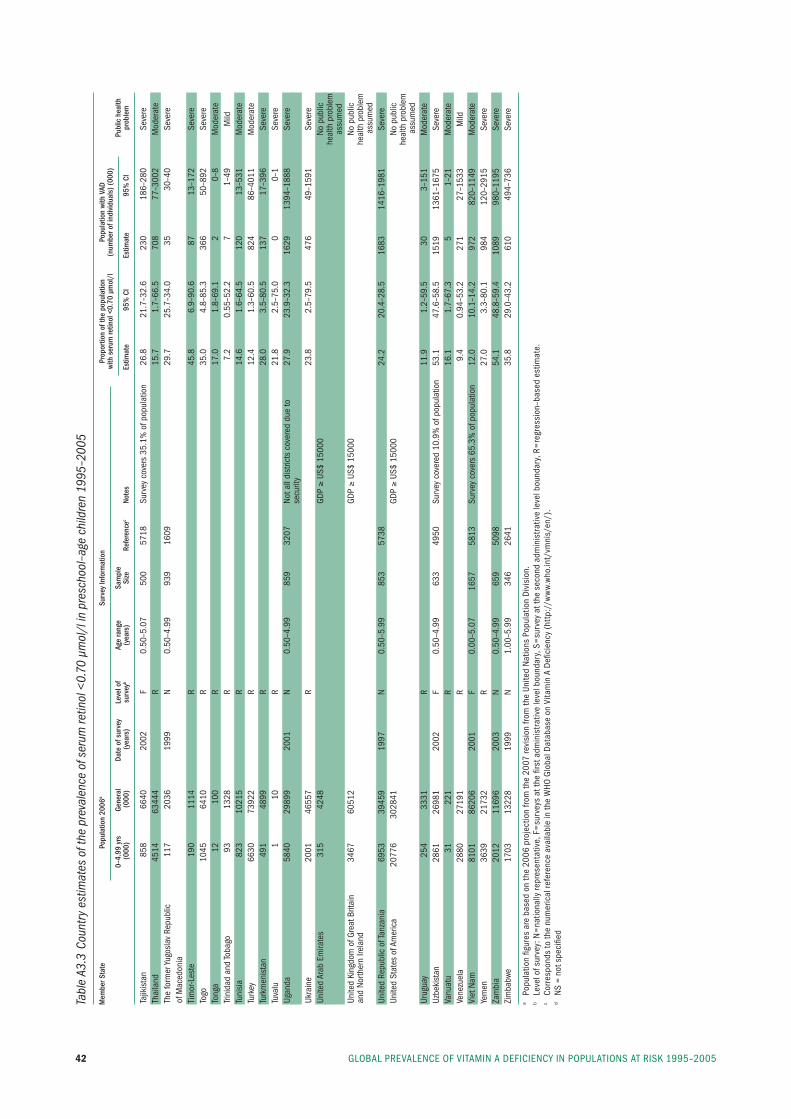
GlObAl preVAlenCe Of VitAmin A DefiCienCy in pOpulAtiOns At risk 1995–200542
Tabl
e A3
.3 C
ount
ry e
stim
ates
of t
he p
reva
lenc
e of
ser
um re
tinol
<0.
70 µ
mol
/l in
pre
scho
ol–a
ge c
hild
ren
1995
–200
5
Mem
ber S
tate
Po
pula
tion
2006
a Su
rvey
Info
rmat
ion
Prop
ortio
n of
the
popu
latio
n
Popu
latio
n wi
th V
AD
with
ser
um re
tinol
<0.
70 µ
mol
/l
(num
ber o
f ind
ivid
uals
) (00
0)
0–
4.99
yrs
Ge
nera
l Da
te o
f sur
vey
Leve
l of
Age
rang
e Sa
mpl
e
Pu
blic
hea
lth
(000
) (0
00)
(yea
rs)
surv
eyb
(yea
rs)
Size
Re
fere
ncec
Note
s Es
timat
e 95
% C
I Es
timat
e 95
% C
I pr
oble
m
tajik
ista
n
858
6640
20
02
f 0.
50–5
.07
500
5718
su
rvey
cov
ers
35.1
% o
f pop
ulat
ion
26.8
21
.7–3
2.6
230
186–
280
seve
reth
aila
nd
4514
63
444
r
15.7
1.
7–66
.5
708
77–3
002
mod
erat
eth
e fo
rmer
yugo
slav
rep
ublic
11
7 20
36
1999
n
0.50
–4.9
9 93
9 16
09
29
.7
25.7
–34.
0 35
30
–40
seve
reof
mac
edon
ia
tim
or-l
este
19
0 11
14
r
45.8
6.
9–90
.6
87
13–1
72
seve
reto
go
1045
64
10
r
35.0
4.
8–85
.3
366
50–8
92
seve
reto
nga
12
100
r
17.0
1.
8–69
.1
2 0–
8 m
oder
ate
trini
dad
and
toba
go
93
1328
r
7.
2 0.
55–5
2.2
7 1–
49
mild
tuni
sia
823
1021
5
r
14
.6
1.6–
64.5
12
0 13
–531
m
oder
ate
turk
ey
6630
73
922
r
12.4
1.
3–60
.5
824
86–4
011
mod
erat
etu
rkm
enis
tan
491
4899
r
28
.0
3.5–
80.5
13
7 17
–396
se
vere
tuva
lu
1 10
r
21
.8
2.5–
75.0
0
0–1
seve
reug
anda
58
40
2989
9 20
01
n 0.
50–4
.99
859
3207
no
t all
dist
ricts
cov
ered
due
to
27.9
23
.9–3
2.3
1629
13
94–1
888
seve
re
se
curit
y uk
rain
e 20
01
4655
7
r
23
.8
2.5–
79.5
47
6 49
–159
1 se
vere
unite
d Ar
ab e
mira
tes
315
4248
GDp ≥
us$
1500
0
no
pub
lic
he
alth
pro
blem
as
sum
edun
ited
king
dom
of G
reat
brit
ain
34
67
6051
2
GDp ≥
us$
1500
0
no
pub
lican
d no
rther
n ire
land
he
alth
pro
blem
a
ssum
edun
ited
repu
blic
of t
anza
nia
6953
39
459
1997
n
0.50
–5.9
9 85
3 57
38
24
.2
20.4
–28.
5 16
83
1416
–198
1 se
vere
unite
d st
ates
of A
mer
ica
2077
6 30
2841
GDp ≥
us$
1500
0
no
pub
lic
he
alth
pro
blem
a
ssum
edur
ugua
y 25
4 33
31
r
11.9
1.
2–59
.5
30
3–15
1 m
oder
ate
uzbe
kist
an
2861
26
981
2002
f
0.50
–4.9
9 63
3 49
50
surv
ey c
over
ed 1
0.9%
of p
opul
atio
n 53
.1
47.6
–58.
5 15
19
1361
–167
5 se
vere
Vanu
atu
31
221
r
16.1
1.
7–67
.3
5 1–
21
mod
erat
eVe
nezu
ela
2880
27
191
r
9.4
0.94
–53.
2 27
1 27
–153
3 m
ildVi
et n
am
8101
86
206
2001
f
0.00
–5.0
7 16
57
5813
su
rvey
cov
ers
65.3
% o
f pop
ulat
ion
12.0
10
.1–1
4.2
972
820–
1149
m
oder
ate
yem
en
3639
21
732
r
27.0
3.
3–80
.1
984
120–
2915
se
vere
Zam
bia
20
12
1169
6 20
03
n 0.
50–4
.99
659
5098
54.1
48
.8–5
9.4
1089
98
0–11
95
seve
reZi
mba
bwe
1703
13
228
1999
n
1.00
–5.9
9 34
6 26
41
35
.8
29.0
–43.
2 61
0 49
4–73
6 se
vere
a po
pula
tion
figur
es a
re b
ased
on
the
2006
pro
ject
ion
from
the
2007
revi
sion
from
the
unite
d n
atio
ns p
opul
atio
n D
ivis
ion.
b le
vel o
f sur
vey:
n=
natio
nally
repr
esen
tativ
e, f
=su
rvey
s at
the
first
adm
inis
trat
ive
leve
l bou
ndar
y, s
=su
rvey
at t
he s
econ
d ad
min
istr
ativ
e le
vel b
ound
ary,
r=
regr
essi
on–b
ased
est
imat
e.
c Co
rres
pond
s to
the
num
eric
al re
fere
nce
avai
labl
e in
the
WHO
Glo
bal D
atab
ase
on V
itam
in A
Defi
cien
cy (
http
://w
ww.
who
.int/
vmni
s/en
/).
d n
s =
not s
peci
fied
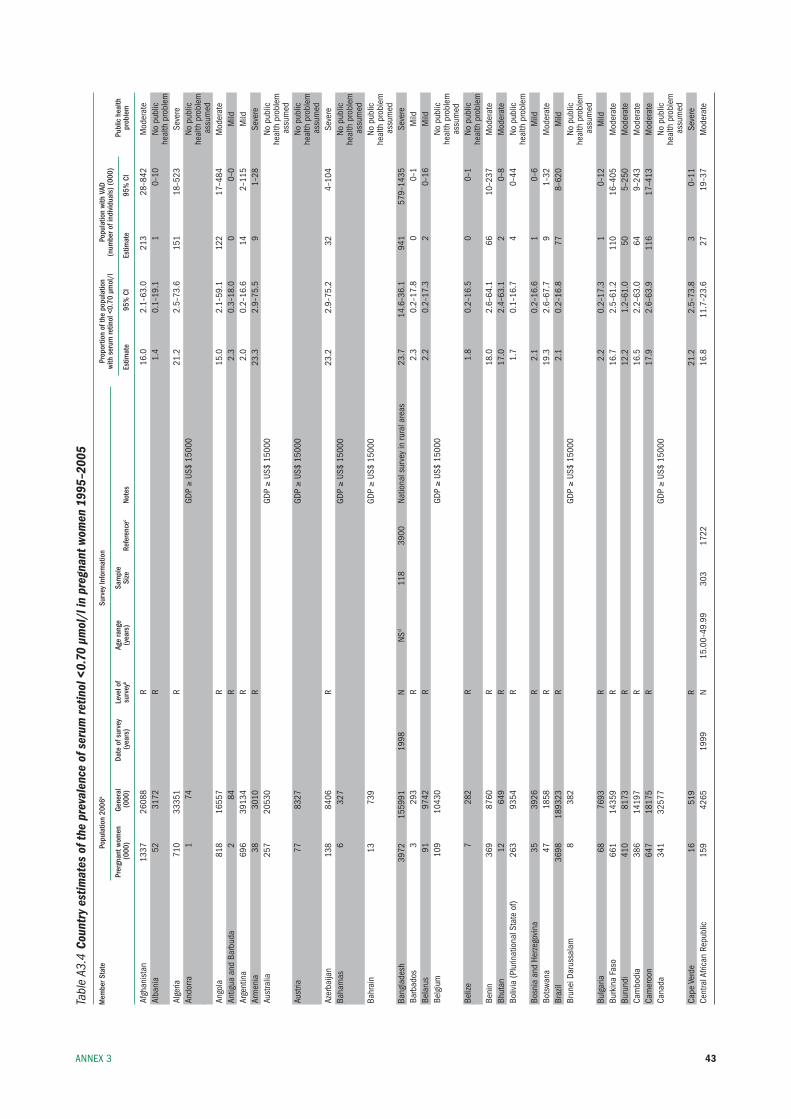
43AnneX 3
Tabl
e A3
.4 C
ount
ry e
stim
ates
of t
he p
reva
lenc
e of
ser
um re
tinol
<0.
70 µ
mol
/l in
pre
gnan
t wom
en 1
995–
2005
Mem
ber S
tate
Po
pula
tion
2006
a Su
rvey
Info
rmat
ion
Prop
ortio
n of
the
popu
latio
n
Popu
latio
n wi
th V
AD
with
ser
um re
tinol
<0.
70 µ
mol
/l
(num
ber o
f ind
ivid
uals
) (00
0)
Pr
ergn
ant w
omen
Ge
nera
l Da
te o
f sur
vey
Leve
l of
Age
rang
e Sa
mpl
e
Pu
blic
hea
lth
(000
) (0
00)
(yea
rs)
surv
eyb
(yea
rs)
Size
Re
fere
ncec
Note
s Es
timat
e 95
% C
I Es
timat
e 95
% C
I pr
oble
m
Afgh
anis
tan
1337
26
088
r
16.0
2.
1–63
.0
213
28–8
42
mod
erat
eAl
bani
a
52
3172
r
1.
4 0.
1–19
.1
1 0–
10
no p
ublic
he
alth
pro
blem
Alge
ria
710
3335
1
r
21
.2
2.5–
73.6
15
1 18
–523
se
vere
Ando
rra
1 74
GDp ≥
us$
1500
0
no
pub
lic
he
alth
pro
blem
a
ssum
edAn
gola
81
8 16
557
r
15.0
2.
1–59
.1
122
17–4
84
mod
erat
eAn
tigua
and
bar
buda
2
84
r
2.3
0.3–
18.0
0
0–0
mild
Arge
ntin
a 69
6 39
134
r
2.0
0.2–
16.6
14
2–
115
mild
Arm
enia
38
30
10
r
23.3
2.
9–75
.5
9 1–
28
seve
reAu
stra
lia
257
2053
0
GDp ≥
us$
1500
0
no
pub
lic
he
alth
pro
blem
a
ssum
edAu
stria
77
83
27
GD
p ≥
us$
1500
0
no
pub
lic
he
alth
pro
blem
a
ssum
edAz
erba
ijan
138
8406
r
23
.2
2.9–
75.2
32
4–
104
seve
reba
ham
as
6 32
7
GDp ≥
us$
1500
0
no
pub
lic
he
alth
pro
blem
a
ssum
edba
hrai
n 13
73
9
GDp ≥
us$
1500
0
no
pub
lic
he
alth
pro
blem
a
ssum
edba
ngla
desh
39
72
1559
91
1998
n
nsd
118
3900
na
tiona
l sur
vey
in ru
ral a
reas
23
.7
14.6
–36.
1 94
1 57
9–14
35
seve
reba
rbad
os
3 29
3
r
2.
3 0.
2–17
.8
0 0–
1 m
ildbe
laru
s 91
97
42
r
2.2
0.2–
17.3
2
0–16
m
ildbe
lgiu
m
109
1043
0
GDp ≥
us$
1500
0
no
pub
lic
he
alth
pro
blem
assu
med
beliz
e 7
282
r
1.8
0.2–
16.5
0
0–1
no p
ublic
heal
th p
robl
embe
nin
369
8760
r
18
.0
2.6–
64.1
66
10
–237
m
oder
ate
bhut
an
12
649
r
17.0
2.
4–63
.1
2 0–
8 m
oder
ate
boliv
ia (p
lurin
atio
nal s
tate
of)
263
9354
r
1.
7 0.
1–16
.7
4 0–
44
no p
ublic
heal
th p
robl
embo
snia
and
Her
zego
vina
35
39
26
r
2.1
0.2–
16.6
1
0–6
mild
bots
wana
47
18
58
r
19.3
2.
6–67
.7
9 1–
32
mod
erat
ebr
azil
3698
18
9323
r
2.
1 0.
2–16
.8
77
8–62
0 m
ildbr
unei
Dar
ussa
lam
8
382
GD
p ≥
us$
1500
0
no
pub
lic
he
alth
pro
blem
a
ssum
edbu
lgar
ia
68
7693
r
2.
2 0.
2–17
.3
1 0–
12
mild
burk
ina
faso
66
1 14
359
r
16.7
2.
5–61
.2
110
16–4
05
mod
erat
ebu
rund
i 41
0 81
73
r
12.2
1.
2–61
.0
50
5–25
0 m
oder
ate
Cam
bodi
a
386
1419
7
r
16
.5
2.2–
63.0
64
9–
243
mod
erat
eCa
mer
oon
64
7 18
175
r
17.9
2.
6–63
.9
116
17–4
13
mod
erat
eCa
nada
34
1 32
577
GD
p ≥
us$
1500
0
no
pub
lic
he
alth
pro
blem
a
ssum
edCa
pe V
erde
16
51
9
r
21
.2
2.5–
73.8
3
0–11
se
vere
Cent
ral A
frica
n re
publ
ic
159
4265
19
99
n 15
.00–
49.9
9 30
3 17
22
16
.8
11.7
–23.
6 27
19
–37
mod
erat
e
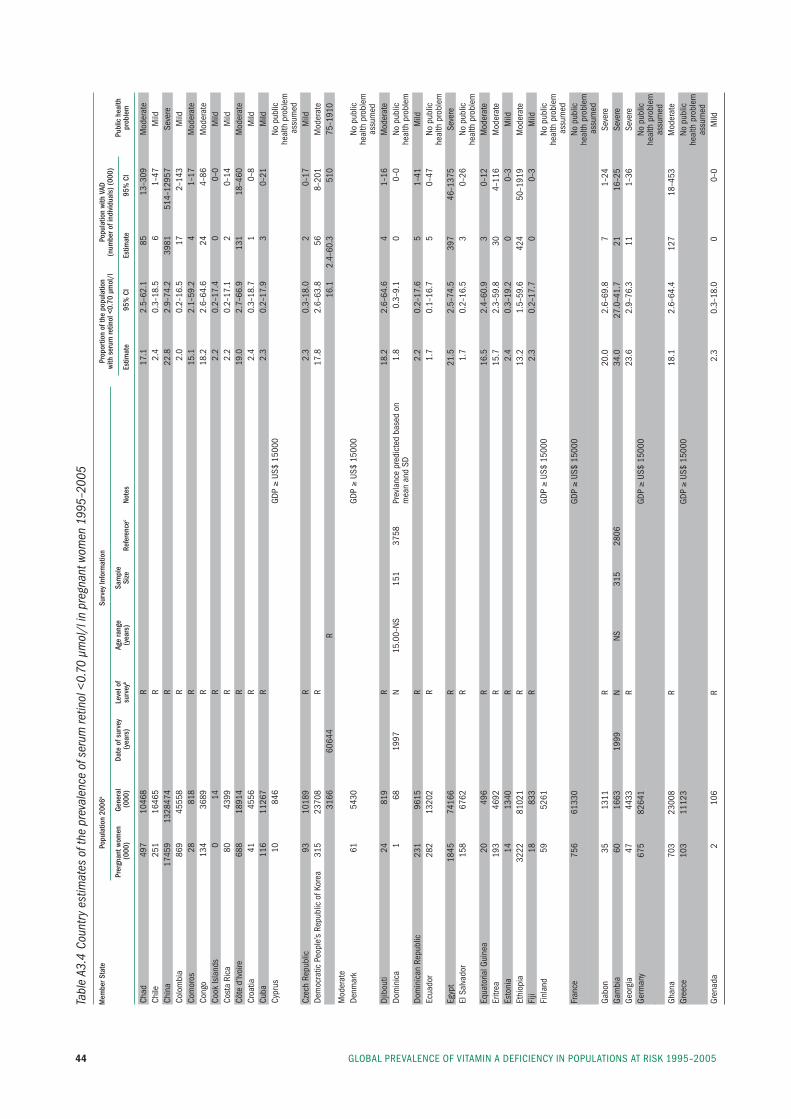
GlObAl preVAlenCe Of VitAmin A DefiCienCy in pOpulAtiOns At risk 1995–200544
Tabl
e A3
.4 C
ount
ry e
stim
ates
of t
he p
reva
lenc
e of
ser
um re
tinol
<0.
70 µ
mol
/l in
pre
gnan
t wom
en 1
995–
2005
Mem
ber S
tate
Po
pula
tion
2006
a Su
rvey
Info
rmat
ion
Prop
ortio
n of
the
popu
latio
n
Popu
latio
n wi
th V
AD
with
ser
um re
tinol
<0.
70 µ
mol
/l
(num
ber o
f ind
ivid
uals
) (00
0)
Pr
ergn
ant w
omen
Ge
nera
l Da
te o
f sur
vey
Leve
l of
Age
rang
e Sa
mpl
e
Pu
blic
hea
lth
(000
) (0
00)
(yea
rs)
surv
eyb
(yea
rs)
Size
Re
fere
ncec
Note
s Es
timat
e 95
% C
I Es
timat
e 95
% C
I pr
oble
m
Chad
49
7 10
468
r
17.1
2.
5–62
.1
85
13–3
09
mod
erat
eCh
ile
251
1646
5
r
2.
4 0.
3–18
.5
6 1–
47
mild
Chin
a 17
459
1328
474
r
22.8
2.
9–74
.2
3981
51
4–12
957
seve
reCo
lom
bia
869
4555
8
r
2.
0 0.
2–16
.5
17
2–14
3 m
ildCo
mor
os
28
818
r
15.1
2.
1–59
.2
4 1–
17
mod
erat
eCo
ngo
134
3689
r
18
.2
2.6–
64.6
24
4–
86
mod
erat
eCo
ok is
land
s 0
14
r
2.2
0.2–
17.4
0
0–0
mild
Cost
a ri
ca
80
4399
r
2.
2 0.
2–17
.1
2 0–
14
mild
Côte
d’iv
oire
68
8 18
914
r
19.0
2.
7–66
.9
131
18–4
60
mod
erat
eCr
oatia
41
45
56
r
2.4
0.3–
18.7
1
0–8
mild
Cuba
11
6 11
267
r
2.3
0.2–
17.9
3
0–21
m
ildCy
prus
10
84
6
GDp ≥
us$
1500
0
no
pub
lic
he
alth
pro
blem
a
ssum
edCz
ech
repu
blic
93
10
189
r
2.3
0.3–
18.0
2
0–17
m
ildDe
moc
ratic
peo
ple’
s re
publ
ic o
f kor
ea
315
2370
8
r
17
.8
2.6–
63.8
56
8–
201
mod
erat
e
31
66
6064
4
r
16
.1
2.4–
60.3
51
0 75
–191
0 m
oder
ate
Denm
ark
61
5430
GDp ≥
us$
1500
0
no
pub
lic
he
alth
pro
blem
assu
med
Djib
outi
24
819
r
18.2
2.
6–64
.6
4 1–
16
mod
erat
eDo
min
ica
1 68
19
97
n 15
.00–
ns
151
3758
pr
evla
nce
pred
icte
d ba
sed
on
1.8
0.3–
9.1
0 0–
0 no
pub
lic
m
ean
and
sD
heal
th p
robl
emDo
min
ican
rep
ublic
23
1 96
15
r
2.2
0.2–
17.6
5
1–41
m
ildec
uado
r 28
2 13
202
r
1.7
0.1–
16.7
5
0–47
no
pub
lic
he
alth
pro
blem
egyp
t 18
45
7416
6
r
21
.5
2.5–
74.5
39
7 46
–137
5 se
vere
el s
alva
dor
158
6762
r
1.
7 0.
2–16
.5
3 0–
26
no p
ublic
heal
th p
robl
emeq
uato
rial G
uine
a 20
49
6
r
16
.5
2.4–
60.9
3
0–12
m
oder
ate
eritr
ea
193
4692
r
15
.7
2.3–
59.8
30
4–
116
mod
erat
ees
toni
a 14
13
40
r
2.4
0.3–
19.2
0
0–3
mild
ethi
opia
32
22
8102
1
r
13
.2
1.5–
59.6
42
4 50
–191
9 m
oder
ate
fiji
18
833
r
2.3
0.2–
17.7
0
0–3
mild
finl
and
59
5261
GDp ≥
us$
1500
0
no
pub
lic
he
alth
pro
blem
a
ssum
edfr
ance
75
6 61
330
GD
p ≥
us$
1500
0
no
pub
lic
he
alth
pro
blem
a
ssum
edGa
bon
35
13
11
r
20.0
2.
6–69
.8
7 1–
24
seve
reGa
mbi
a
60
1663
19
99
n ns
31
5 28
06
34
.0
27.0
–41.
7 21
16
–25
seve
reGe
orgi
a 47
44
33
r
23.6
2.
9–76
.3
11
1–36
se
vere
Germ
any
675
8264
1
GDp ≥
us$
1500
0
no
pub
lic
he
alth
pro
blem
assu
med
Ghan
a 70
3 23
008
r
18.1
2.
6–64
.4
127
18–4
53
mod
erat
eGr
eece
10
3 11
123
GD
p ≥
us$
1500
0
no
pub
lic
he
alth
pro
blem
assu
med
Gren
ada
2 10
6
r
2.
3 0.
3–18
.0
0 0–
0 m
ild
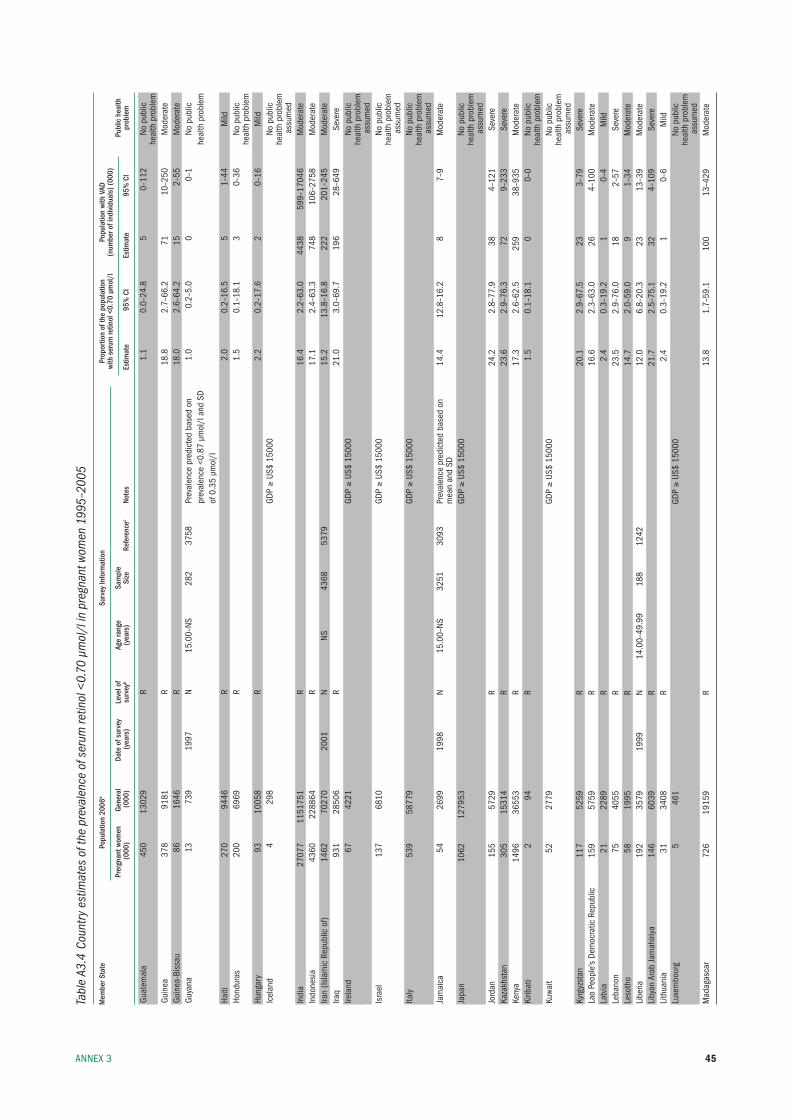
45AnneX 3
Tabl
e A3
.4 C
ount
ry e
stim
ates
of t
he p
reva
lenc
e of
ser
um re
tinol
<0.
70 µ
mol
/l in
pre
gnan
t wom
en 1
995–
2005
Mem
ber S
tate
Po
pula
tion
2006
a Su
rvey
Info
rmat
ion
Prop
ortio
n of
the
popu
latio
n
Popu
latio
n wi
th V
AD
with
ser
um re
tinol
<0.
70 µ
mol
/l
(num
ber o
f ind
ivid
uals
) (00
0)
Pr
ergn
ant w
omen
Ge
nera
l Da
te o
f sur
vey
Leve
l of
Age
rang
e Sa
mpl
e
Pu
blic
hea
lth
(000
) (0
00)
(yea
rs)
surv
eyb
(yea
rs)
Size
Re
fere
ncec
Note
s Es
timat
e 95
% C
I Es
timat
e 95
% C
I pr
oble
m
Guat
emal
a 45
0 13
029
r
1.1
0.0–
24.8
5
0–11
2 no
pub
lic
he
alth
pro
blem
Guin
ea
378
9181
r
18
.8
2.7–
66.2
71
10
–250
m
oder
ate
Guin
ea-b
issa
u 86
16
46
r
18.0
2.
6–64
.2
15
2–55
m
oder
ate
Guya
na
13
739
1997
n
15.0
0–ns
28
2 37
58
prev
alen
ce p
redi
cted
bas
ed o
n
1.0
0.2–
5.0
0 0–
1 no
pub
lic
pr
eval
ence
<0.
87 µ
mol
/l a
nd s
D
heal
th p
robl
em
of
0.3
5 µm
ol/l
Ha
iti
270
9446
r
2.
0 0.
2–16
.5
5 1–
44
mild
Hond
uras
20
0 69
69
r
1.5
0.1–
18.1
3
0–36
no
pub
lic
he
alth
pro
blem
Hung
ary
93
1005
8
r
2.
2 0.
2–17
.6
2 0–
16
mild
icel
and
4 29
8
GDp ≥
us$
1500
0
no
pub
lic
he
alth
pro
blem
a
ssum
edin
dia
2707
7 11
5175
1
r
16
.4
2.2–
63.0
44
38
599–
1704
6 m
oder
ate
indo
nesi
a
4360
22
8864
r
17
.1
2.4–
63.3
74
8 10
6–27
58
mod
erat
eira
n (is
lam
ic r
epub
lic o
f) 14
62
7027
0 20
01
n ns
43
68
5379
15.2
13
.8–1
6.8
222
201–
245
mod
erat
eira
q 93
1 28
506
r
21.0
3.
0–69
.7
196
28–6
49
seve
reire
land
67
42
21
GD
p ≥
us$
1500
0
no
pub
lic
he
alth
pro
blem
a
ssum
edis
rael
13
7 68
10
GD
p ≥
us$
1500
0
no
pub
lic
he
alth
pro
blem
a
ssum
edita
ly
539
5877
9
GDp ≥
us$
1500
0
no
pub
lic
he
alth
pro
blem
a
ssum
edJa
mai
ca
54
2699
19
98
n 15
.00–
ns
3251
30
93
prev
alen
ce p
redi
cted
bas
ed o
n
14.4
12
.8–1
6.2
8 7–
9 m
oder
ate
mea
n an
d sD
Ja
pan
10
62
1279
53
GD
p ≥
us$
1500
0
no
pub
lic
he
alth
pro
blem
a
ssum
edJo
rdan
15
5 57
29
r
24.2
2.
8–77
.9
38
4–12
1 se
vere
kaza
khst
an
305
1531
4
r
23
.6
2.9–
76.3
72
9–
233
seve
reke
nya
1496
36
553
r
17.3
2.
6–62
.5
259
38–9
35
mod
erat
eki
ribat
i 2
94
r
1.5
0.1–
18.1
0
0–0
no p
ublic
heal
th p
robl
emku
wait
52
2779
GDp ≥
us$
1500
0
no
pub
lic
he
alth
pro
blem
a
ssum
edky
rgyz
stan
11
7 52
59
r
20.1
2.
9–67
.5
23
3–79
se
vere
lao
peop
le’s
Dem
ocra
tic r
epub
lic
159
5759
r
16
.6
2.3–
63.0
26
4–
100
mod
erat
ela
tvia
21
22
89
r
2.4
0.3–
19.2
1
0–4
mild
leba
non
75
4055
r
23
.5
2.9–
76.0
18
2–
57
seve
rele
soth
o 58
19
95
r
14.7
2.
0–59
.0
9 1–
34
mod
erat
eli
beria
19
2 35
79
1999
n
14.0
0–49
.99
188
1242
12.0
6.
8–20
.3
23
13–3
9 m
oder
ate
liby
an A
rab
Jam
ahiri
ya
146
6039
r
21
.7
2.5–
75.1
32
4–
109
seve
reli
thua
nia
31
3408
r
2.
4 0.
3–19
.2
1 0–
6 m
ildlu
xem
bour
g 5
461
GD
p ≥
us$
1500
0
no
pub
lic
he
alth
pro
blem
a
ssum
edm
adag
asca
r 72
6 19
159
r
13.8
1.
7–59
.1
100
13–4
29
mod
erat
e
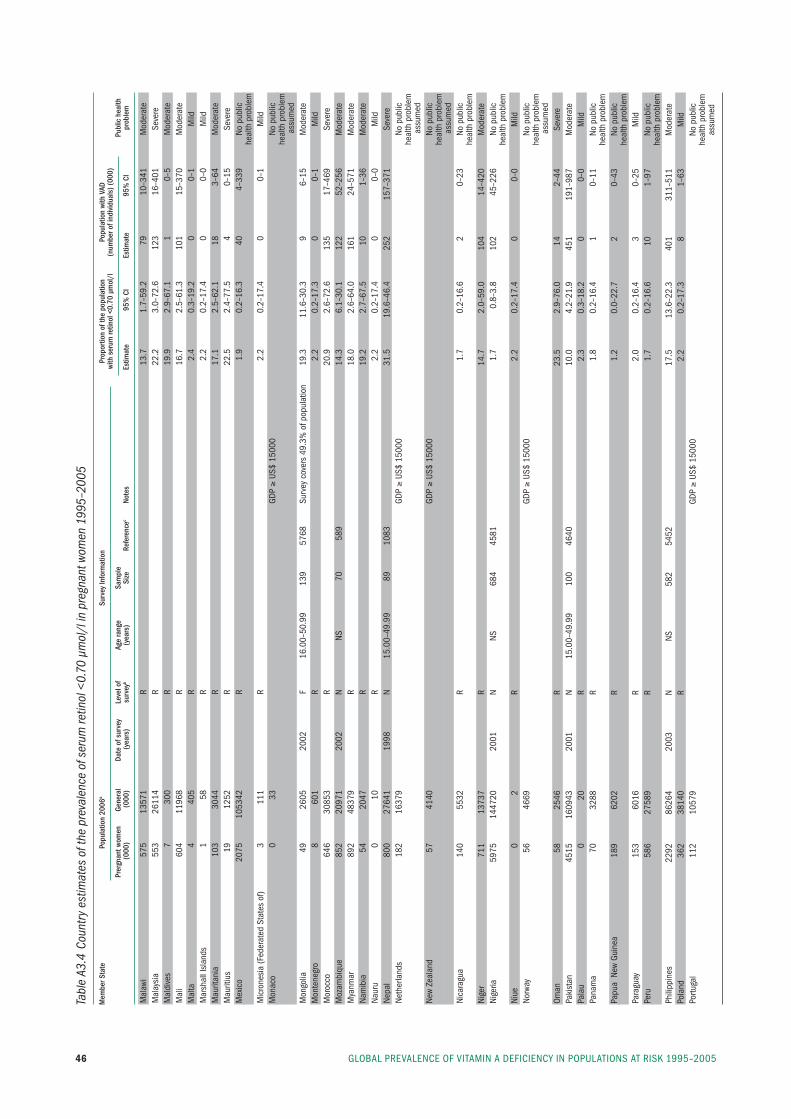
GlObAl preVAlenCe Of VitAmin A DefiCienCy in pOpulAtiOns At risk 1995–200546
Tabl
e A3
.4 C
ount
ry e
stim
ates
of t
he p
reva
lenc
e of
ser
um re
tinol
<0.
70 µ
mol
/l in
pre
gnan
t wom
en 1
995–
2005
Mem
ber S
tate
Po
pula
tion
2006
a Su
rvey
Info
rmat
ion
Prop
ortio
n of
the
popu
latio
n
Popu
latio
n wi
th V
AD
with
ser
um re
tinol
<0.
70 µ
mol
/l
(num
ber o
f ind
ivid
uals
) (00
0)
Pr
ergn
ant w
omen
Ge
nera
l Da
te o
f sur
vey
Leve
l of
Age
rang
e Sa
mpl
e
Pu
blic
hea
lth
(000
) (0
00)
(yea
rs)
surv
eyb
(yea
rs)
Size
Re
fere
ncec
Note
s Es
timat
e 95
% C
I Es
timat
e 95
% C
I pr
oble
m
mal
awi
575
1357
1
r
13
.7
1.7–
59.2
79
10
–341
m
oder
ate
mal
aysi
a 55
3 26
114
r
22.2
3.
0–72
.6
123
16–4
01
seve
rem
aldi
ves
7 30
0
r
19
.9
2.9–
67.1
1
0–5
mod
erat
em
ali
604
1196
8
r
16
.7
2.5–
61.3
10
1 15
–370
m
oder
ate
mal
ta
4 40
5
r
2.
4 0.
3–19
.2
0 0–
1 m
ildm
arsh
all i
slan
ds
1 58
r
2.
2 0.
2–17
.4
0 0–
0 m
ildm
aurit
ania
10
3 30
44
r
17.1
2.
5–62
.1
18
3–64
m
oder
ate
mau
ritiu
s 19
12
52
r
22.5
2.
4–77
.5
4 0–
15
seve
rem
exic
o 20
75
1053
42
r
1.9
0.2–
16.3
40
4–
339
no p
ublic
heal
th p
robl
emm
icro
nesi
a (f
eder
ated
sta
tes
of)
3 11
1
r
2.
2 0.
2–17
.4
0 0–
1 m
ildm
onac
o 0
33
GD
p ≥
us$
1500
0
no
pub
lic
he
alth
pro
blem
a
ssum
edm
ongo
lia
49
2605
20
02
f 16
.00–
50.9
9 13
9 57
68
surv
ey c
over
s 49
.3%
of p
opul
atio
n 19
.3
11.6
–30.
3 9
6–15
m
oder
ate
mon
tene
gro
8 60
1
r
2.
2 0.
2–17
.3
0 0–
1 m
ildm
oroc
co
646
3085
3
r
20
.9
2.6–
72.6
13
5 17
–469
se
vere
moz
ambi
que
852
2097
1 20
02
n ns
70
58
9
14.3
6.
1–30
.1
122
52–2
56
mod
erat
em
yanm
ar
892
4837
9
r
18
.0
2.6–
64.0
16
1 24
–571
m
oder
ate
nam
ibia
54
20
47
r
19.2
2.
7–67
.5
10
1–36
m
oder
ate
naur
u 0
10
r
2.2
0.2–
17.4
0
0–0
mild
nepa
l 80
0 27
641
1998
n
15.0
0–49
.99
89
1083
31.5
19
.6–4
6.4
252
157–
371
seve
rene
ther
land
s 18
2 16
379
GD
p ≥
us$
1500
0
no
pub
lic
he
alth
pro
blem
a
ssum
edne
w Ze
alan
d 57
41
40
GD
p ≥
us$
1500
0
no
pub
lic
he
alth
pro
blem
a
ssum
edni
cara
gua
140
5532
r
1.
7 0.
2–16
.6
2 0–
23
no p
ublic
heal
th p
robl
emni
ger
711
1373
7
r
14
.7
2.0–
59.0
10
4 14
–420
m
oder
ate
nige
ria
5975
14
4720
20
01
n ns
68
4 45
81
1.
7 0.
8–3.
8 10
2 45
–226
no
pub
lic
he
alth
pro
blem
niue
0
2
r
2.
2 0.
2–17
.4
0 0–
0 m
ildno
rway
56
46
69
GD
p ≥
us$
1500
0
no
pub
lic
he
alth
pro
blem
a
ssum
edOm
an
58
2546
r
23
.5
2.9–
76.0
14
2–
44
seve
repa
kist
an
4515
16
0943
20
01
n 15
.00–
49.9
9 10
0 46
40
10
.0
4.2–
21.9
45
1 19
1–98
7 m
oder
ate
pala
u 0
20
r
2.3
0.3–
18.2
0
0–0
mild
pana
ma
70
3288
r
1.
8 0.
2–16
.4
1 0–
11
no p
ublic
heal
th p
robl
empa
pua
new
Gui
nea
189
6202
r
1.
2 0.
0–22
.7
2 0–
43
no p
ublic
heal
th p
robl
empa
ragu
ay
153
6016
r
2.
0 0.
2–16
.4
3 0–
25
mild
peru
58
6 27
589
r
1.7
0.2–
16.6
10
1–
97
no p
ublic
heal
th p
robl
emph
ilipp
ines
22
92
8626
4 20
03
n ns
58
2 54
52
17
.5
13.6
–22.
3 40
1 31
1–51
1 m
oder
ate
pola
nd
362
3814
0
r
2.
2 0.
2–17
.3
8 1–
63
mild
portu
gal
112
1057
9
GDp ≥
us$
1500
0
no
pub
lic
he
alth
pro
blem
assu
med
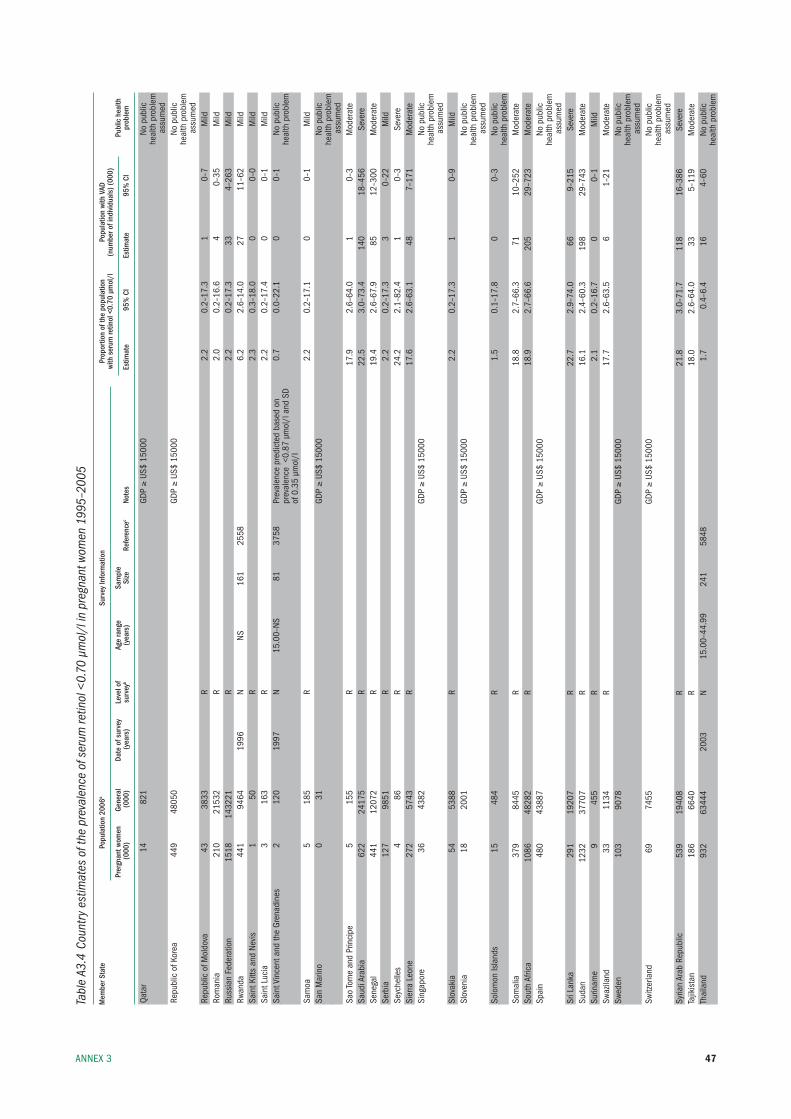
47AnneX 3
Tabl
e A3
.4 C
ount
ry e
stim
ates
of t
he p
reva
lenc
e of
ser
um re
tinol
<0.
70 µ
mol
/l in
pre
gnan
t wom
en 1
995–
2005
Mem
ber S
tate
Po
pula
tion
2006
a Su
rvey
Info
rmat
ion
Prop
ortio
n of
the
popu
latio
n
Popu
latio
n wi
th V
AD
with
ser
um re
tinol
<0.
70 µ
mol
/l
(num
ber o
f ind
ivid
uals
) (00
0)
Pr
ergn
ant w
omen
Ge
nera
l Da
te o
f sur
vey
Leve
l of
Age
rang
e Sa
mpl
e
Pu
blic
hea
lth
(000
) (0
00)
(yea
rs)
surv
eyb
(yea
rs)
Size
Re
fere
ncec
Note
s Es
timat
e 95
% C
I Es
timat
e 95
% C
I pr
oble
m
Qata
r 14
82
1
GDp ≥
us$
1500
0
no
pub
lic
he
alth
pro
blem
a
ssum
edre
publ
ic o
f kor
ea
449
4805
0
GDp ≥
us$
1500
0
no
pub
lic
he
alth
pro
blem
a
ssum
edre
publ
ic o
f mol
dova
43
38
33
r
2.2
0.2–
17.3
1
0–7
mild
rom
ania
21
0 21
532
r
2.0
0.2–
16.6
4
0–35
m
ildru
ssia
n fe
dera
tion
1518
14
3221
r
2.
2 0.
2–17
.3
33
4–26
3 m
ildrw
anda
44
1 94
64
1996
n
ns
161
2558
6.2
2.6–
14.0
27
11
–62
mild
sain
t kitt
s an
d ne
vis
1 50
r
2.
3 0.
3–18
.0
0 0–
0 m
ildsa
int l
ucia
3
163
r
2.2
0.2–
17.4
0
0–1
mild
sain
t Vin
cent
and
the
Gren
adin
es
2 12
0 19
97
n 15
.00–
ns
81
3758
pr
eval
ence
pre
dict
ed b
ased
on
0.
7 0.
0–22
.1
0 0–
1 no
pub
lic
pr
eval
ence
<0.
87 µ
mol
/l a
nd s
D
he
alth
pro
blem
of
0.3
5 µm
ol/l
sa
moa
5
185
r
2.2
0.2–
17.1
0
0–1
mild
san
mar
ino
0 31
GDp ≥
us$
1500
0
no
pub
lic
he
alth
pro
blem
a
ssum
edsa
o to
me
and
prin
cipe
5
155
r
17.9
2.
6–64
.0
1 0–
3 m
oder
ate
saud
i Ara
bia
622
2417
5
r
22
.5
3.0–
73.4
14
0 18
–456
se
vere
sene
gal
441
1207
2
r
19
.4
2.6–
67.9
85
12
–300
m
oder
ate
serb
ia
127
9851
r
2.
2 0.
2–17
.3
3 0–
22
mild
seyc
helle
s 4
86
r
24.2
2.
1–82
.4
1 0–
3 se
vere
sier
ra l
eone
27
2 57
43
r
17.6
2.
6–63
.1
48
7–17
1 m
oder
ate
sing
apor
e 36
43
82
GD
p ≥
us$
1500
0
no
pub
lic
he
alth
pro
blem
a
ssum
edsl
ovak
ia
54
5388
r
2.
2 0.
2–17
.3
1 0–
9 m
ildsl
oven
ia
18
2001
GDp ≥
us$
1500
0
no
pub
lic
he
alth
pro
blem
a
ssum
edso
lom
on is
land
s 15
48
4
r
1.
5 0.
1–17
.8
0 0–
3 no
pub
lic
he
alth
pro
blem
som
alia
37
9 84
45
r
18.8
2.
7–66
.3
71
10–2
52
mod
erat
eso
uth
Afric
a 10
86
4828
2
r
18
.9
2.7–
66.6
20
5 29
–723
m
oder
ate
spai
n 48
0 43
887
GD
p ≥
us$
1500
0
no
pub
lic
he
alth
pro
blem
a
ssum
edsr
i lan
ka
291
1920
7
r
22
.7
2.9–
74.0
66
9–
215
seve
resu
dan
1232
37
707
r
16.1
2.
4–60
.3
198
29–7
43
mod
erat
esu
rinam
e 9
455
r
2.1
0.2–
16.7
0
0–1
mild
swaz
iland
33
11
34
r
17.7
2.
6–63
.5
6 1–
21
mod
erat
esw
eden
10
3 90
78
GD
p ≥
us$
1500
0
no
pub
lic
he
alth
pro
blem
a
ssum
edsw
itzer
land
69
74
55
GD
p ≥
us$
1500
0
no
pub
lic
he
alth
pro
blem
a
ssum
edsy
rian
Arab
rep
ublic
53
9 19
408
r
21.8
3.
0–71
.7
118
16–3
86
seve
reta
jikis
tan
18
6 66
40
r
18.0
2.
6–64
.0
33
5–11
9 m
oder
ate
thai
land
93
2 63
444
2003
n
15.0
0–44
.99
241
5848
1.7
0.4–
6.4
16
4–60
no
pub
lic
he
alth
pro
blem
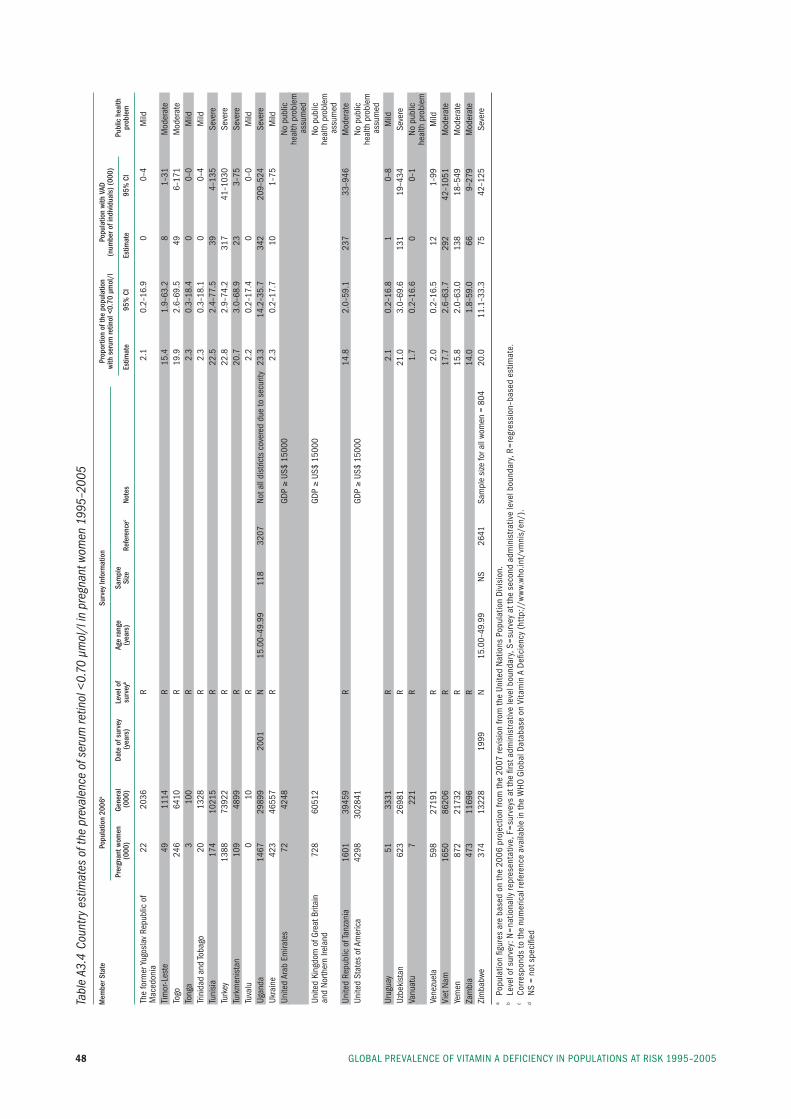
GlObAl preVAlenCe Of VitAmin A DefiCienCy in pOpulAtiOns At risk 1995–200548
Tabl
e A3
.4 C
ount
ry e
stim
ates
of t
he p
reva
lenc
e of
ser
um re
tinol
<0.
70 µ
mol
/l in
pre
gnan
t wom
en 1
995–
2005
Mem
ber S
tate
Po
pula
tion
2006
a Su
rvey
Info
rmat
ion
Prop
ortio
n of
the
popu
latio
n
Popu
latio
n wi
th V
AD
with
ser
um re
tinol
<0.
70 µ
mol
/l
(num
ber o
f ind
ivid
uals
) (00
0)
Pr
ergn
ant w
omen
Ge
nera
l Da
te o
f sur
vey
Leve
l of
Age
rang
e Sa
mpl
e
Pu
blic
hea
lth
(000
) (0
00)
(yea
rs)
surv
eyb
(yea
rs)
Size
Re
fere
ncec
Note
s Es
timat
e 95
% C
I Es
timat
e 95
% C
I pr
oble
m
the
form
er yu
gosl
av r
epub
lic o
f 22
20
36
r
2.1
0.2–
16.9
0
0–4
mild
mac
edon
ia
tim
or-l
este
49
11
14
r
15.4
1.
9–63
.2
8 1–
31
mod
erat
eto
go
246
6410
r
19
.9
2.6–
69.5
49
6–
171
mod
erat
eto
nga
3 10
0
r
2.
3 0.
3–18
.4
0 0–
0 m
ildtri
nida
d an
d to
bago
20
13
28
r
2.3
0.3–
18.1
0
0–4
mild
tuni
sia
174
1021
5
r
22
.5
2.4–
77.5
39
4–
135
seve
retu
rkey
13
88
7392
2
r
22
.8
2.9–
74.2
31
7 41
–103
0 se
vere
turk
men
ista
n 10
9 48
99
r
20.7
3.
0–68
.9
23
3–75
se
vere
tuva
lu
0 10
r
2.
2 0.
2–17
.4
0 0–
0 m
ildug
anda
14
67
2989
9 20
01
n 15
.00–
49.9
9 11
8 32
07
not a
ll di
stric
ts c
over
ed d
ue to
sec
urity
23
.3
14.2
–35.
7 34
2 20
9–52
4 se
vere
ukra
ine
423
4655
7
r
2.
3 0.
2–17
.7
10
1–75
m
ildun
ited
Arab
em
irate
s 72
42
48
GD
p ≥
us$
1500
0
no
pub
lic
he
alth
pro
blem
a
ssum
edun
ited
king
dom
of G
reat
brit
ain
72
8 60
512
GD
p ≥
us$
1500
0
no
pub
lican
d no
rther
n ire
land
he
alth
pro
blem
a
ssum
edun
ited
repu
blic
of t
anza
nia
1601
39
459
r
14.8
2.
0–59
.1
237
33–9
46
mod
erat
eun
ited
stat
es o
f Am
eric
a 42
98
3028
41
GD
p ≥
us$
1500
0
no
pub
lic
he
alth
pro
blem
a
ssum
edur
ugua
y 51
33
31
r
2.1
0.2–
16.8
1
0–8
mild
uzbe
kist
an
623
2698
1
r
21
.0
3.0–
69.6
13
1 19
–434
se
vere
Vanu
atu
7 22
1
r
1.
7 0.
2–16
.6
0 0–
1 no
pub
lic
he
alth
pro
blem
Vene
zuel
a 59
8 27
191
r
2.0
0.2–
16.5
12
1–
99
mild
Viet
nam
16
50
8620
6
r
17
.7
2.6–
63.7
29
2 42
–105
1 m
oder
ate
yem
en
872
2173
2
r
15
.8
2.0–
63.0
13
8 18
–549
m
oder
ate
Zam
bia
47
3 11
696
r
14.0
1.
8–59
.0
66
9–27
9 m
oder
ate
Zim
babw
e 37
4 13
228
1999
n
15.0
0–49
.99
ns
2641
sa
mpl
e si
ze fo
r all
wom
en =
804
20
.0
11.1
–33.
3 75
42
–125
se
vere
a po
pula
tion
figur
es a
re b
ased
on
the
2006
pro
ject
ion
from
the
2007
revi
sion
from
the
unite
d n
atio
ns p
opul
atio
n D
ivis
ion.
b
leve
l of s
urve
y: n
=na
tiona
lly re
pres
enta
tive,
f=
surv
eys
at th
e fir
st a
dmin
istr
ativ
e le
vel b
ound
ary,
s=
surv
ey a
t the
sec
ond
adm
inis
trat
ive
leve
l bou
ndar
y, r
=re
gres
sion
–bas
ed e
stim
ate.
c
Corr
espo
nds
to th
e nu
mer
ical
refe
renc
e av
aila
ble
in th
e W
HO G
loba
l Dat
abas
e on
Vita
min
A D
efici
ency
(ht
tp:/
/ww
w.w
ho.in
t/vm
nis/
en/)
.
d n
s =
not s
peci
fied
49
AnneX 4
Country references
AfghanistanAfghanistan MICS2 Steering Committee et al. 2000 Afghanistan Multiple Indicator Cluster Survey (MICS2), Vol. 1: Situation Analysis of Children and Women in the East of Afghanistan. United Nations Children’s Fund, 2001. Ref 3302.
AngolaMinistry of Health et al. Assessing vitamin A and iron de-ficiency anaemia, nutritional anaemia among children aged 0–60 months in the Republic of Angola [technical report]. Ministry of Health, 2000. Ref 2839.
Antigua and BarbudaMicronutrient Working Group. Iron and vitamin A status in five Caribbean countries. Cajanus, 2002, 35 (1): 4–34. Ref 3758.
ArgentinaMinisterio de Salud, Plan Federal de Salud. Encuesta Na-cional de Nutrición y Salud (ENNyS) [Nacional Nutrition and Health Survey]. Ministerio de Salud, Argentina, 2007. Ref 5837.
ArmeniaBranca F, Napoletano A, Coclite D, Rossi L. The health and nutritional status of children and women in Armenia. Rome, National Institute of Nutrition, 1988. Ref 3329.
National Statistical Service, et al. Armenia Demographic and Health Survey 2005. Calverton, MD, ORC Macro, 2006. Ref 5804.
BangladeshInstitute of Public Health Nutrition. Vitamin A status throughout the lifecycle in rural Bangladesh: National Vita-min A Survey 1997–98. Dhaka, Helen Keller International, 1999. Ref 3900.
Institute of Public Health. Bangladesh in Facts and Figures: 2005 Annual Report of the Nutritional Surveillance Project. Dhaka, Helen Keller International, 2006. Ref 5473.
AnneX 4
National Institute of Population Research and Training (NIPORT), et al. Bangladesh Demographic and Health Sur-vey 2004. Calverton, MD, ORC Macro, 2005. Ref 5206.
BeninInstitut National de la Statistique et de l’Analyse Économique et al. Enquête Démographique et de Santé au Bénin, 2001. Calverton, MD, Institut National de la Sta-tistique et de l’Analyse Économique et ORC Macro, 2002. Ref 3461.
République du Benin, Ministère de la Sante Publique, Di-rection de la Sante Familiale, UNICEF, USAID. Enquête Nationale sur la Carence en Vitamine A et la Disponibilité en Sel Iode dans les Ménages. Rapport de l’Enquête Familiale. 2000. Ref 5797.
BhutanPem N, Gyeltshen K, Tenzin N. Report of a survey for vita-min A deficiency in children under Five and pregnant women in Bhutan. Bhutan Ministry of Health, 2000. Ref 2715.
Bolivia (Plurinational State of)Gutiérrez Sardán M et al. Bolivia Encuesta Nacional de De-mografía y Salud 2003 [Bolivia National Demographic and Health Survey 2003]. La Paz, Ministerio de Salud y De-portes, Instituto Nacional de Estadística, 2004. Ref 5095.
Burkina FasoInstitut National de la Statistique et de la Démographie [Burkina Faso] et al. Burkina Faso Enquête Démographique et de Santé 2003 [Burkina Faso Demographic and Health Survey 2003]. Calverton, MD, ORC Macro, 2004. Ref 4948.
Projet de Développement Santé et Nutrition. Enquête Épidémiologique sur les Carences en Micronutriments dans 15 Provinces. Centre National Pour la Nutrition, Ministère de la Santé, Burkina Faso, 1997. Ref 5801.
BurundiRapport de l’Enquête Nationale de Nutrition de la Popula-tion, 2005. Ministère de la Santé Publique, République du Burundi, 2006. Ref 5748.

GlObAl preVAlenCe Of VitAmin A DefiCienCy in pOpulAtiOns At risk 1995–200550
CambodiaHix J, Rasca P, Morgan J, Denna S, Panagides D, Tam M, Shankar AH. Validation of a rapid enzyme immunoassay for the quantitation of retinol-binding protein to assess vitamin A status within populations. European Journal of Clinical Nutrition, 2006, 60(1):1299–1303. Ref 5761.
Semba RD, de Pee S, Panagides D, Poly O, Bloem MW. Risk factors for xerophthalmia among mothers and their children and for mother–child pairs with xerophthalmia in Cambodia. Archives of Ophthalmology, 2004, 122(4):517–523. Ref 5021.
National Institute of Public Health, National Institute of Statistics, MEASURE DHS ORC Macro. Cambodia De-mographic and Health Survey 2005. Calverton, MD, ORC Macro, 2006. Ref 5646.
CameroonInstitut National de la Statistique et al. Enquête Démo-graphique et de Santé: Cameroon 2004. [Demographic Health Survey: Cameroon 2004]. Calverton, MD, ORC Macro, 2005. Ref 5214.
Ministère de la Santé Publique, UNICEF-Cameroun. En-quête Nationale sur la Carence en Vitamine A et I’Anémie au Cameroun, 2000. 2001. Ref 3470.
Cape VerdeMinistério da Saúde e Promoção Social, Fundo das Nações Unidas para a Infância. Caracterização Deficiência de Vi-tamina “A” e da Anemia em Crianças Pré-escolares de Cabo Verde, 1997. Ref 5630.
Central African RepublicMinistere Delegue a l’Economie au Plan et a la Coopera-tion Internationale et al. Enquête nationale sur l’avitaminose A, la carence en fer et la consommation du sel iode. Repub-lique Centrafricaine, 2000. Ref 1722.
ChadMildon A. Vitamin A Add-On Program – Final Survey and Program Report, December 2005. World Vision Canada, 2005. Ref 5102.
ChinaJingxiong J, Toschke AM, von Kries R, Koletzko B, Liang-ming L. Vitamin A status among children in China. Public Health Nutrition, 2006, 9(8):955–960. Ref 5788.
ColombiaNational Survey on the Nutritional Situation (ENSIN), Co-lombia 2005, Protocol – Executive Summary. Bogota, Insti-tuto Colombia de Bienestar Familiar, 2005. Ref 5773.
Congo (The)Samba C, Tchibindat F, Houze P, Gourmel B, Malvy D. Prevalence of infant Vitamin A deficiency and undernutri-tion in the Republic of Congo. Acta Tropica, 97(3):270–83, 2006. Ref 5631.
Centre National de la Statistique et des Études Économiques (CNSEE), et al. Enquête Démographique et de Santé du Con-go. [Demographic Health Survey of Congo, 2005]. Calverton, MD, ORC Macro, 2006. Ref 5733.
Costa RicaCarvajal Fernandez D, Alfaro Calvo T, Monge-Rojas R. Deficiencia de vitamina A en niños preescolares: un prob-lema re-emergente en Costa Rica? [Vitamin A deficiency among preschool children: a re-emerging problem in Cos-ta Rica?]. Archivos Latinoamericanos de Nutrición, 2003, 53(3):267–270. Ref 4227.
Côte d’IvoireAsobayire FS. Development of a food fortification strategy to combat iron deficiency in the Ivory Coast [dissertation]. Zurich, Swiss Federal Institute of Technology, 2000. Ref 1986.
CubaMatos CM, Rodríguez GP, Gutiérrez PM, Jiménez EA, Ramos Mesa MA. Estado nutricional de la vitamina A en niños Cubanos de 6 a 24 meses de edad. Revista Cubana de Alimentación y Nutrición, 2002, 16(2):95–104. Ref 3224.
Democratic Republic of the CongoMinistère de la Santé Publique. Importance de la carence en vitamine A en Republique Democratique du Congo, 2000. Ref 5800.
DominicaMicronutrient Working Group. Iron and vitamin A status in five Caribbean countries. Cajanus, 2002, 35 (1):4–34. Ref 3758.
Dominican RepublicAchécar MM, Ramírez N, Polanco JJ, Ochoa LH, Lere-bours G, Garcia B. República Dominicana; Encuesta de-mográfica y de salud (ENDESA 2002). Calverton, MD, ORC Macro, 2002. Ref 4739.
EgyptNutrition Institute. National Survey for Assessment of Vita-min “A” Status in Egypt. United Nations Children’s Fund, Cairo, Egypt, 1995. Ref 103.
51
EritreaNational Statistics and Evaluation Office, et al. Demo-graphic and Health Survey, Eritrea 2002. Calverton, MD, ORC Macro, 2003. Ref 4639.
EthiopiaHaidar J, Demissie T. Malnutrition and xerophthalmia in rural communities of Ethiopia. East African Medical Jour-nal, 1999, 76(10):590–593. Ref 1910.MacDonald C. World Vision Ethiopia MICAH Program – Final Evaluation Report. World Vision Canada, 2006. Ref 5639c.Central Statistical Agency, et al. Ethiopia Demographic and Health Survey, 2005. Calverton, MD, ORC Macro, 2006. Ref 5694.
GabonMinistère de la Planification de la Programmation du Développement et de l’Aménagement du Territoire, et al. Enquête Démographique de Santé Gabon 2000 [Demo-graphic and Health Survey Gabon 2000]. Calverton, MD, ORC Macro, 2001. Ref 5100.
GambiaBah A et al. Nationwide survey on the prevalence of vitamin A and iron deficiency in women and children in the Gambia. Banjul, National Nutrition Agency, 2001. Ref 2806.
GhanaGhana Statistical Service (GSS) et al. Ghana Demographic and Health Survey 2003. Calverton, MD, ORC Macro, 2004. Ref 4943.
Quarshie K, Amoaful E. Proceedings of the workshop on dis-semination of findings of vitamin A and anaemia prevalence surveys. Accra, Ghana, 1998. Ref 3004.
David P. Evaluating the Vitamin A Supplementation Pro-gramme in Northern Ghana: Has it Contributed to Improved Child Survival? The Micronutrient Initiative, 2003. Ref 5099.
MICAH Ghana Follow-Up Survey Report. World Vision Ghana, 2000. Ref 5104b.
GuatemalaEncuesta Nacional de Micronutrientes. Guatemala City, Ministerio de Salud Publica y Asistencia Social, 1996. Ref 3091.
GuineaDirection Nationale de la Statistique (DNS) (Guinée). Enquête Démographique et de Santé Guinée 2005 [Demo-graphic and Health Survey Guinea 2005]. Calverton, MD, ORC Macro, 2006. Ref 5726.
GuyanaMicronutrient Working Group. Iron and vitamin A status in five Caribbean countries. Cajanus, 2002, 35 (1): 4–34. Ref 3758.
HaitiRépublique d’Haïti et al. Enquête Mortalité, Morbidité et Utilisation des Services EMMUS-III Haïti 2000. Répub-lique d’Haïti, 2001. Ref 3264.
Ministère de la Sante Publique et de la Population et al. En-quête sur la prévalence de la carence en vitamine A et de la dé-ficience end iode end Haïti. L’institut Haitien de l’Enfance, 2005. Ref 5353.
HondurasMinisterio de Salud Pública et al. Encuesta Nacional de Micronutrientes Honduras, 1996. Tegucigalpa, Secretaria de Salud, Ministerio de Salud Pública, 1997. Ref 3095.
Secretaría de Salud [Honduras], Instituto Nacional de Es-tadística (INE), Macro International. Encuesta Nacional de Salud y Demografía 2005–2006. Calverton, MD, ORC Macro, 2006. Ref 5799.
IndiaDepartment of Women & Child Development, UNICEF. Multiple Indicator Survey – 2000 (MICS – 2000) India [summary report]. UNICEF, 2001. Ref 4534.
International Institute for Population Sciences et al. Na-tional Family Health Survey (NFHS-2), 1998–1999: India. Mumbai, International Institute for Population Sciences, 2000. Ref 2972.
International Institute for Population Sciences et al. Na-tional Family Health Survey (NFHS-2), India, 1998–1999, Northeastern States: Arunachal Pradesh, Manipur, Megha-laya, Mizoram, Nagaland and Tripura. Mumbai, Interna-tional Institute for Population Sciences, 2002. Ref 3780a.
National Nutrition Monitoring Bureau. NNMB Techni-cal Report No. 22: Prevalence of Micronutrient Deficiencies. Hyderabad, National Institute of Nutrition, Indian Coun-cil of Medical Research, 2003. Ref 5839.
National Institute of Nutrition et al. Annual Report 2005–2006. Hyderabad, Indian Council of Medical Research, 2006. Ref 5840.
IndonesiaStatistics [Indonesia], National Family Planning Coordi-nating Board, Ministry of Health, ORC Marco. Indonesia Demographic and Health Survey 2002–2003. Calverton, MD, ORC Macro, 2003. Ref 4538.
AnneX 3
GlObAl preVAlenCe Of VitAmin A DefiCienCy in pOpulAtiOns At risk 1995–200552
Iran (Islamic Republic of)Medical University et al. An Investigation of Under-nutrition in Iran Year 1380 (2001). Islamic Republic of Iran, Minis-try of Health and Medical Education, 2006. Ref 5379.
JamaicaWHO/PAHO et al. Micronutrient study report: an assess-ment of the vitamin A, E, beta-carotene, and iron status in Jamaica. Kingston, WHO, Pan American Health Or-ganization, Caribbean Food and Nutrition Institute, 1998 (PAHO/CFNI/98.J1). Ref 3093.
JordanMinistry of Health Jordan et al. National baseline survey on iron deficiency anemia and vitamin A deficiency. Amman, Ministry of Health, 2002. Ref 4382.
KazakhstanKazakh Academy of Nutrition, et al. Estimation of vitamin A deficiency prevalence in Kazakhstan. UNICEF [Central Asian Republics and Kazakhstan], 2002. Ref 5675.
KenyaMwaniki DL et al. Anaemia and status of iron, vitamin A and zinc in Kenya. The 1999 National Survey. Nairobi, Min-istry of Health, 2002. Ref 3442.
Lao People’s Democratic RepublicMinistry of Health, Lao People’s Democratic Republic. Re-port on national health survey: health status of the People of LAO PDR. Vientiane, Ministry of Health, 2001. Ref 770.
LesothoMinistry of Health and Social Welfare et al. Lesotho De-mographic and Health Survey 2004. Calverton, MD, ORC Macro, 2005. Ref 5356.
LiberiaMulder-Sibanda M et al. National Micronutrient Survey. A national prevalence study on vitamin A deficiency, iron de-ficiency anemia, iodine deficiency. Monrovia, Ministry of Health and Social Welfare, Family Health Division, Unit-ed Nations Children’s Fund, 1999. Ref 1242.
MadagascarInstitut National de la Statistique et al. Enquête Démo-graphique et de Santé de Madagascar 2003–2004. Calver-ton, MD, ORC Macro, 2005. Ref 5190.
Berthine R. Enquête sur la Carence en Vitamine A Chez les Femmes et les Enfants et Enquête sur l’Anemie Chez les Ecoliers de 6 à 14 Ans, Madagascar 2000. Most Project, USAID, 2001. Ref 5090.
MalawiNational Statistical Office et al. Malawi Demographic and Health Survey 2004. Calverton, MD, ORC Macro, 2005. Ref 5201.
Ministry of Health, UNICEF. Malawi Micronutrient Sur-vey 2001. Ministry of Health, Lilongwe, Malawi, 2003. Ref 5602.
MalaysiaMinistry of Health. A study of malnutrition in under five children in Malaysia. Kuala Lumpur, Ministry of Health, 1999. Ref 4394.
MaldivesMinister of Health, Republic of Maldives. Multiple Indica-tor Cluster Survey (MICS 2), Maldives. Malé, Ministry of Health, 2001. Ref 2987.
MaliSchemann J, Malvy D, Sacko D, Traore L. Trachoma and vi-tamin A deficiency. Lancet, 2001, 357(9269):1676. Ref 4195.
Cellule de Planification et de Statistique du Ministère de la Santé (CPS/MS), Direction Nationale de la Statistique et de l’Informatique (DNSI). Enquête Démographique et de Santé au Mali 2001. [Mali: Demographic and Health Sur-vey 2001]. Calverton, MD, ORC Macro, 2002. Ref 3446.
Marshall IslandsPalafox NA, Gamble MV, Dancheck B, Ricks MO, Briand K, Semba RD. Vitamin A deficiency, iron deficiency, and anemia among preschool children in the Republic of the Mar-shall Islands. Nutrition, 2003, 19(5):405–408. Ref 3886.
MauritiusMinistry of Health Mauritius. A survey of nutrition in Mau-ritius and Rodrigues (1995). Port Louis, Ministry of Health, 1995. Ref 395.
MexicoEncuesta Nacional de Nutrición 1999. Mexico City, Insti-tuto Nacional de Salud Publica, 1999. Ref 2997.
Micronesia (Federated States of)Kim D, Sowell A. Vitamin A deficiency among children and caregivers in Chuuk State, Federated States of Micronesia. Atlanta, Centers for Disease Control and Prevention, 2002. Ref 5672.
Socorro P, Gonzaga C. Results of vitamin A, anemia and blood lead survey among 2–4 year old children and reproduc-tive-aged women in Yap proper and Kosrae State, Federated States of Micronesia. Atlanta, Centers for Disease Control and Prevention, 2000. Ref 2548.
53
MongoliaErdenechimeg E. Physiologic and hygienic assessment of vi-tamin A deficiency in children, Mongolia. Mongolia. Public Health Institute, 2000. Ref 5767.
Amardulam N, Erdenechimeg E, Burmaa B, Batdelger SH, Zina P. Vitamin A deficiency in Mongolia and results of “A” vitaminization. Moscow, First International Congress on School Hygine, May 12, 2004. Ref 5768.
MoroccoNasri I, El Bouhali B, Aguenaou H, Mokhtar N. Vitamin A deficiency among Moroccan women and children. Afri-can Health Sciences, 2004, 4:3–8. Ref 5496.
Ministère de la Santé, ORC Macro, Projet PAPFAM. En-quête sur la Population et la Santé Familiale 2003–04. ORC Macro, 2005. Ref 5191.
MozambiqueMinistério da Saúde et al. Inquérito nacional seovre a de-ficiência de vitamina A, prevalência de anemia e malária em crianças dos 6–59 meses e respectivas mães. Maputo, Instituto Nacional de Saúde, 2003. Ref 589.
Instituto Nacional de Estatística, Ministério da Saúde. Moçambique: Inquérito Demográphifico e de Saúde 2003 [Mozambique: Demographic and Health Survey 2003]. Calverton, MD, ORC Macro, 2005. Ref 5195.
MyanmarZin MM. Report on National Survey of Micronutrients, 2004–2005. Myanmar, Ministry of Health, 2005. Ref 5685.
NepalMinistry of Health Nepal et al. Nepal Micronutrient Status Survey 1998. Kathmandu, Ministry of Health, 1999. Ref 1083.
Ministry of Health, New ERA, ORC Macro. Nepal De-mographic and Health Survey 2001. Calverton, MD, ORC Macro, 2001. Ref 3321.
NicaraguaGurdián M, Kontorovsky I, Alvarado E, Ramírez SA, Hernández R. Sistema integrado de vigilancia de interven-ciones nutricionales (SIVIN), 2004 [Integrated system of monitoring nutrition interventions (SIVIN), 2004]. Mana-gua, Ministerio de Salud, 2005. Ref 5730a.
Instituto Nacional de Estadísticas y Censos, Ministerio de Salud. Encuesta Nicaragüense de Demografía y Salud 2001 [Demographic Health Survey Nicaragua 2001]. Calverton, MD, ORC Macro, 2002. Ref 3460.
NigerRépublique du Niger, et al. Enquête à Indicateurs Multiples de la Fin de la Décennie (MICS). United Nations Children’s Fund, 2000. Ref 3392.
NigeriaInternational Institute of Tropical Agriculture (IITA), US-AID, UNICEF, USDA. Nigeria Food Consumption and Nutrition Survey 2001–2003 [summary]. International In-stitute of Tropical Agriculture, 2004. Ref 4581.
Ajose OA, Adelekan DA, Ajewole EO. Vitamin A status of pregnant Nigerian women: relationship to dietary habits and morbidity. Nutrition and Health, 2004, 17(4):325–333. Ref 4764.
OmanMinistry of Health of the Sultanate of Oman, UNICEF Muscat, World Health Organization-Eastern Mediterra-nean Regional Office. National Micronutrient Status and Fortified Food Coverage Survey, Oman, 2004. Department of Nutrition, Ministry of Health the Sultanate of Oman, 2006. Ref 5525.
PakistanPakistan Institute of Development Economics et al. Na-tional Nutrition Survey 2001–2002. Islamabad, Govern-ment of Pakistan, Planning Commission, 2003. Ref 4640.
PanamaMinisterio de Salud, et al. Encuesta nacional de vitamina A y anemia por deficiencia de hierro [National survey of vitamin A and iron deficiency anemia]. Panama City, Ministerio de Salud, 2000. Ref 3097.
Papua New GuineaFriesen H, Verma N, Lagani W, Billson F, Saweri W, Earl J. Vitamin A status of children in different provinces in Papua New Guinea. In: Abstracts of the 34th Annual Symposium of the Medical Society of Papua New Guinea; 1998 Sept 7–11. Port Moresby, Papua New Guinea Medical Society, 1998. Ref 4140.
PeruInstituto Nacional de Salud, Centro Nacional de Aliment-ación y Nutrición, Dirección Ejecutiva de Vigilancia Ali-mentaria y Nutricional. Informe nacional de deficiencia de vitamina A en niños menores de 5 años y mujeres en edad fértil 1997–2001. Lima, Ministerio de Salud, 2001. Ref 5412a.
Céspedes R, Dácila E, Fort A, Ulloa L, Castro Z. Perú En-cuesta Demográfica y de Salud Familiar ENDES Continua 2004; Informe principal. Calverton, MD, ORC Macro, 2005. Ref 5357.
AnneX 3
GlObAl preVAlenCe Of VitAmin A DefiCienCy in pOpulAtiOns At risk 1995–200554
PhilippinesPedro MRA, Cerdena CM, Molano WL, Constantine A, Perlas LA, Palafox EF, Patalan L, Chavez M, Madriaga J, Castillo E, Barba CVC. Sixth National Survey 2003. Ma-nila, Food and Nutrition Research Institute, Department of Science and Technology, 2006. Ref 5452.
National Statistics Office, ORC Macro. Philippines: Na-tional Demographic and Health Survey 2003. Calverton, MD, ORC Macro, 2004. Ref 5192.
Republic of MoldovaMoldova Ministry of Health and Social Protection, et al. Moldova Demographic and Health Survey 2005: Preliminary Report. Chisinau, Moldova Ministry of Health and Social Protection, 2005. Ref 5489.
RwandaMinistère de la Santé et al. National Nutrition Survey of Women and Children in Rwanda in 1996 [final report]. Ki-gali, Ministère de la Santé, 1997. Ref 2558.
Institut National de la Statistique du Rwanda (INSR), et al. Rwanda Demographic and Health Survey 2005. Calverton, MD, ORC Macro, 2006. Ref 5781.
St. Vincent and the GrenadinesMicronutrient Working Group. Iron and vitamin A status in five Caribbean countries. Cajanus, 2002, 35 (1): 4–34. Ref 3758.
Sao Tome and PríncipeCarvalho A, Sousa L, Costa P, Neto O. Relatório do Estudo Sobre a Carência de Micronutrientes. Republica Democráti-ca de São Tome e Príncipe, 2000. Ref 5803.
SenegalSalif N, Ayad M. Enquête Démographique et de Santé au Sénégal 2005. Calverton, MD, ORC Macro, 2006. Ref 5739.
Sri LankaMinistry of Health and Indigenous Medicine, Medical Research Institute. Vitamin A deficiency status of children in Sri Lanka 1995/1996 [survey report]. Dehiwela, Ministry of Health and Indigenous Medicine, 1998. Ref 2716.
SudanFederal Ministry of Health et al. Comprehensive Nutrition Survey. Khartoum, Federal Ministry of Health, National Nutrition Department, 1997. Ref 1443.
TajikistanAvgonov ZT, Gaibov AG, Tazhibaev ShS, Khairov KhS. [Prevalence of vitamin deficiency in Tajik children] Voprosy Pitaniia, 2005, 74(4):14–16. Ref 5718.
The former Yugoslav Republic of MacedoniaBranca F et al. Multiple indicator cluster survey in FYR Mac-edonia with micronutrient component. Rome, National In-stitute of Nutrition, 2000. Ref 1609.
ThailandNutrition Division, Department of Health, Ministry of Public Health. The 5th National Nutrition Survey of Thai-land, 2003. Thailand, 2003. Ref 5848.
Timor-LesteMinistry of Health Timor-Leste et al. Timor Leste 2003 Demographic and Health Survey. Newcastle, Australia, Min-istry of Health/University of Newcastle, 2003. Ref 5050.
UgandaUganda Bureau of Statistics (UBOS) et al. Uganda Demo-graphic and Health Survey 2000–2001. Calverton, MD, ORC Macro, 2001. Ref 3207.
United Republic of TanzaniaNational Bureau of Statistics (NBS) Tanzania et al. Tan-zania Demographic and Health Survey 2004–05. Dar es Salaam, National Bureau of Statistics, ORC Macro, 2005. Ref 5221.
Ballart A, Mugyabyso JKL, Ruhiye DRM, Ndossi GD, Basheke MM. The National Vitamin A Deficiency Control Programme. A Preliminary Report on the National Vitamin A Survey 1997. Dar es Salaam, Tanzania Food and Nutrition Centre, 1998 (TFNC Report No: 1880). Ref 5738.
UzbekistanAnalytical and Information Center et al. Uzbekistan Health Examination Survey 2002. Calverton, MD, Analytical and Information Center, State Department of Statistics, ORC Macro, 2004. Ref 4950.
Viet NamKhan NC, Ninh NX, Nhien NV, Khoi HH, West CE, Hautvast JGAJ. Sub clinical vitamin A deficiency and anemia among Vietnamese children less than five years of age. Asia Pacific Journal of Clinical Nutrition, 2007, 16(1): 152–157. Ref 5813.
National Institute of Nutrition General Statistical Of-fice. 2000 Vietnam-Child and Mother Nutrition Situation. Hanoi, Medical Publishing House, 2001. Ref 2976.
55
ZambiaLuo C, Mwela CM. National survey on vitamin A deficiency in Zambia: a random cluster study for children (0–5 years) and mothers attending national immunization days in August 1997. Lusaka, National Food and Nutrition Commission, 1997. Ref 1325.
Micronutrient Operational Strategies and Technologies (MOST) et al. Report of the national survey to evaluate the impact of vitamin A interventions in Zambia, July and November 2003. Zambia, Micronutrient Operational Strat-egies and Technologies, United States Agency for Inter-national Development (USAID) Micronutrient Program, 2003. Ref 5098.
ZimbabweMinistry of Health and Child Welfare, Nutrition Unit. Zimbabwe National Micronutrient Survey: 1999. Harare, Ministry of Health and Child Welfare, 2001. Ref 2641.
Central Statistical Office, Macro International Inc. Zimba-bwe Demographic and Health Survey 1999. Calverton, MD, ORC Macro, 2000. Ref 4680.
Measure DHS+. Micronutrient Update. Calverton, MD, ORC Macro, 2002. Ref 3331.

Global prevalence of
vitamin A deficiency in populations
at risk1995–2005
WHO Global Database on Vitamin A Deficiency
WHO Global Database on Vitamin A Deficiency
www.who.int/vmnis
For further information about the WHO Global Database on Vitamin A Deficiency,
or if you would like to provide information, please contact:
ISBN 978 92 4 159801 9
GlO
bAl pr
eVAlenc
e OF VitAm
in A D
eFicien
cy in
pOpu
lAtiOn
s At risk 1995–2005
WH
O G
LOBaL D
ataBaSe ON
vItamIN
a DefIcIeN
cy W
HO