Embed Size (px)
Citation preview

Presenting Survey Data and Results"
Professor Ron Fricker"Naval Postgraduate School"
Monterey, California"
2/15/13 1
Reading Assignment:"None"

Goals for this Lecture"
• Discuss a bit about how to display survey data and results in a briefing"– How to structure slides"– What to include"– Displaying margins of error"
• Learn about a couple of useful new plots"• Discuss how to calculate response rates and
possible issues"
2/15/13 2

A Bit About Briefing Survey Results"
• When briefing survey results:"– DON’T just present the data question-by-question
in the order asked in the survey – boring!"– DO tell a story"
• Focus on the questions that"– Answer the survey objective"– Give results interesting to the “client”"
» Sometimes it’s the outliers or tails…"• Order the presentation of results so that it’s
logical and interesting to the listener"
2/15/13 3

A Good Briefing Outline"
• Survey objective(s)"• Outline of the survey instrument"
– Perhaps a brief discussion of design development "• Fielding methods and details"
– Response rate(s)"• Comparison of sample to population ""
– Demonstrate how representative (or not) sample is"• Results (see next slide)"• Conclusions & discussion"
2/15/13 4

Displaying Survey Results"
• For results slides, use a small number of standardized formats"– Put the “take away” summary in slide header"– Give actual survey question verbiage and number
who answered the question"• When giving percentages, show the n as well,
and vice versa"• As appropriate, display uncertainty due to
sampling (i.e., the margin of error)"– Use actual quotes (e.g., from open-ended
questions) to reinforce graphs and plots"
2/15/13 5

Almost 50% of DL Students (313 of 633) Agree Library Critical to Their Studies"
6
n=95" n=218" n=196" n=86" n=27"0"
5"
10"
15"
20"
25"
30"
35"
40"
45"
Strongly Agree" Agree" Neutral" Disagree" Strongly Disagree"
Percent!
“How much do you agree or disagree with the following statement: ���‘Library research is a critical part of my NPS Distance Learning Studies.’ ”
• “I believe that the NPS library is an essential tool that should always be available to DL students.”"
• “The NPS Library is a valuable resource. Not every class requires need for use, however, some do.”"
• “I have used the NPS Library for a good deal of my day job work as well. It has provided me an easy avenue to periodicals and journals that are often difficult to get access to through local research streams.”"
2/15/13
n=95" n=218" n=196" n=86" n=27"0"
5"
10"
15"
20"
25"
30"
35"
40"
45"
Strongly Agree" Agree" Neutral" Disagree" Strongly Disagree"
Percent!
Program! Percent!
SE (Nuclear) – Electrical (n=3)" 100"
SE (Nuclear) – Mechanical (n=1)" 100"
Systems Analysis (n=27)" 42"
Cost Estimating and Analysis (n=12)" 27"
Electronic Sys. Engineering (n=47)" 23"
MSES (n=47)" 23"
EMBA (mil & civ) (n=148)" 21"
Systems Engineering (n=230)" 16"
Program Management (n=68)" 10"
Systems Eng. Management (n=31)" 3"
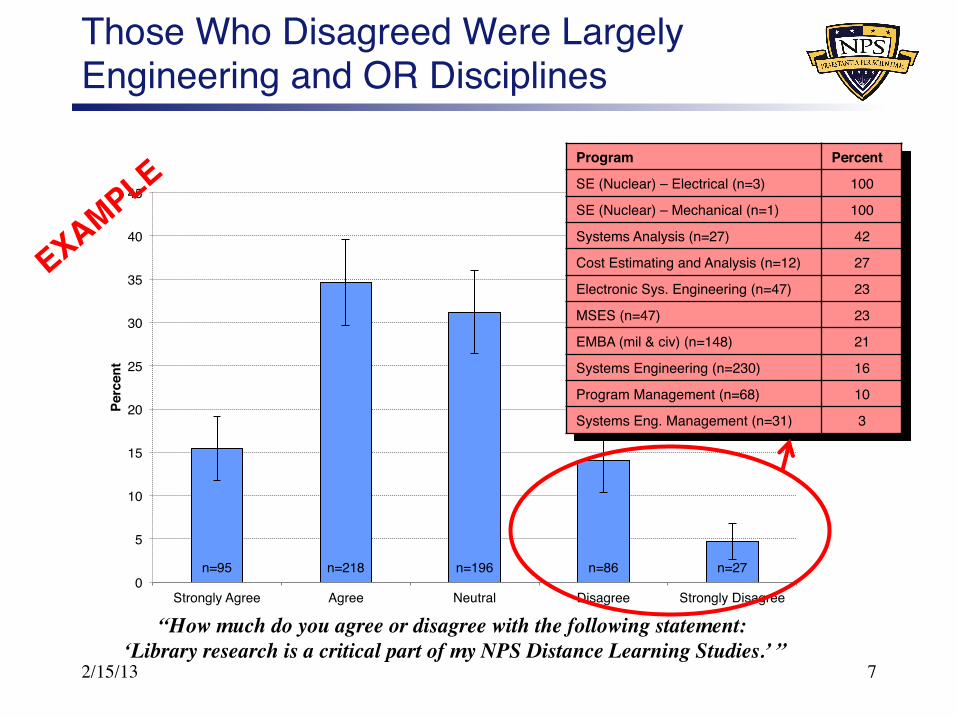
Those Who Disagreed Were Largely Engineering and OR Disciplines"
7
“How much do you agree or disagree with the following statement: ���‘Library research is a critical part of my NPS Distance Learning Studies.’ ”
2/15/13

n=95" n=218" n=196" n=86" n=27"0"
5"
10"
15"
20"
25"
30"
35"
40"
45"
Strongly Agree" Agree" Neutral" Disagree" Strongly Disagree"
Percent!
Program! Percent!
SE (Nuclear) – Electrical (n=3)" 100"
SE (Nuclear) – Mechanical (n=1)" 100"
Systems Analysis (n=27)" 42"
Cost Estimating and Analysis (n=12)" 27"
Electronic Sys. Engineering (n=47)" 23"
MSES (n=47)" 23"
EMBA (mil & civ) (n=148)" 21"
Systems Engineering (n=230)" 16"
Program Management (n=68)" 10"
Systems Eng. Management (n=31)" 3"
Some Majors Did Not Disagree at All, But Small Numbers Not Definitive"
8
“How much do you agree or disagree with the following statement: ���‘Library research is a critical part of my NPS Distance Learning Studies.’ ”
Program! Percent!
Contract Management (n=3)" 0"
HSI (N=9)" 0"
Software Engineering (n=4)" 0"
Space Systems Operations (n=6)" 0"
2/15/13

n=95" n=218" n=196" n=86" n=27"0"
5"
10"
15"
20"
25"
30"
35"
40"
45"
Strongly Agree" Agree" Neutral" Disagree" Strongly Disagree"
Percent!
Neutrals Are Largely Outside (Hard) Engineering Disciplines"
9
“How much do you agree or disagree with the following statement: ���‘Library research is a critical part of my NPS Distance Learning Studies.’ ”
• “I believe that the NPS library is an essential tool that should always be available to DL students.”"
• “The NPS Library is a valuable resource. Not every class requires need for use, however, some do.”"
• “I have used the NPS Library for a good deal of my day job work as well. It has provided me an easy avenue to periodicals and journals that are often difficult to get access to through local research streams.”"
Program! Percent!
MSES (n=47)" 51"
Contract Management (n=18)" 47"
HSI (n=9)" 37"
EMBA (mil & civ) (n=148)" 35"
Program Management (n=68)" 34"
Systems Engineering (n=230)" 32"
Electronic Systems Engineering (n=47)" 21"
Cost Estimating and Analysis (n=12)" 18"
Systems Analysis (n=27)" 17"
Systems Eng. Management (n=31)" 10"
2/15/13

n=95" n=218" n=196" n=86" n=27"0"
5"
10"
15"
20"
25"
30"
35"
40"
45"
Strongly Agree" Agree" Neutral" Disagree" Strongly Disagree"
Percent!
Most Disciplines Had Substantial Percentage of Students Who Agreed"
10
“How much do you agree or disagree with the following statement: ���‘Library research is a critical part of my NPS Distance Learning Studies.’ ”
• “I believe that the NPS library is an essential tool that should always be available to DL students.”"
• “The NPS Library is a valuable resource. Not every class requires need for use, however, some do.”"
• “I have used the NPS Library for a good deal of my day job work as well. It has provided me an easy avenue to periodicals and journals that are often difficult to get access to through local research streams.”"
Program! Percent!
Space Systems (n=6)" 100"
Systems Eng. Management (n=31)" 87"
Space Systems Operations (n=6)" 83"
HSI (n=9)" 63"
Program Management (n=68)" 56"
Cost Estimating and Analysis (n=12)" 55"
Electronic Systems Engineering (n=47)" 53"
Contract Management (n=18)" 53"
Systems Engineering (n=230)" 50"
EMBA (mil & civ) (n=148)" 43"
Systems Analysis (n=27)" 38"
MSES (n=47)" 22"
2/15/13

On Displaying Margins of Error"
• “Do I have to display margins of error on every plot?”!– No, sometimes it’s overkill and/or distracting"– But they should be communicated somehow "
• If not included on every plot and table, give the reader/audience some general guidelines: ""“For analyses of the entire DL student population, the margins of error in this survey are approximately!– two percent for questions with a binary scale (e.g., yes/no), !– five percent for questions with a Likert scale (e.g., strongly
agree, agree, neutral, disagree, strongly disagree).!!When analyzing smaller groups the margins of error will be larger, perhaps substantially.”"
2/15/13 11

Barcharts and Histograms Not Optimal for Comparing Between Groups or Subsets"
• Neither plot particularly good at allowing visual comparison between groups"
2/15/13 12
Married and collocated with family Single Married and a geographic bachelor Single with dependents Other
Very SatisfiedSatisfiedNeutralUnsatisfiedVery Unsatisfied
Presidio Health Clinic Rating
Count
0100
200
300
400
500
600
700
Married and collocated with family Single Married and a geographic bachelor Single with dependents Other
Very UnsatisfiedUnsatisfiedNeutralSatisfiedVery Satisfied
Presidio Health Clinic Rating
Count
050
100
150
200
250
300

Barcharts and Histograms Not Optimal for Comparing Between Groups or Subsets"
• Converting to percentages does not really help:"
2/15/13 13
Married and collocated with family Single Married and a geographic bachelor Single with dependents Other
Presidio Health Clinic Rating
Fraction
0.0
0.2
0.4
0.6
0.8
1.0
Married and collocated with family Single Married and a geographic bachelor Single with dependents Other
Presidio Health Clinic Rating
Fraction
0.0
0.1
0.2
0.3
0.4
0.5

Likert-scale Data:Diverging Stacked Bar Charts"
2/15/13 14
Source: Robbins, N.B., and R.M. Heiberger, Plotting Likert and Other Rating Scales, Proceedings of the 2011 Joint Statistical Meetings, 1058-1066.

Compare to Traditional Bar Charts"
• Much harder to distinguish differences:"– Divided bar chart:"
– Side-by-side bar chart"
2/15/13 15
Source: Robbins, N.B., and R.M. Heiberger, Plotting Likert and Other Rating Scales, Proceedings of the 2011 Joint Statistical Meetings, 1058-1066.

Creating Diverging Stacked Bar Charts"
• In R, use the likert() function in the HH package"• Examples from QOL survey results:"
2/15/13 16
Presidio Health Clinic Rating
Count
Fam
ily S
tatu
s
Other
Single with dependents
Married and a geographic bachelor
Single
Married and collocated with family
200 0 200 400
Likert_ScaleVery Unsatisfied Unsatisfied Neutral Satisfied Very Satisfied
Presidio Health Clinic Rating
Percent
Fam
ily S
tatu
s
Row
Cou
nt T
otal
s
Other
Single with dependents
Married and a geographic bachelor
Single
Married and collocated with family
40 20 0 20 40 60
6
21
70
210
725
Likert_ScaleVery Unsatisfied Unsatisfied Neutral Satisfied Very Satisfied

Diverging Stacked Bar Charts"
2/15/13 17
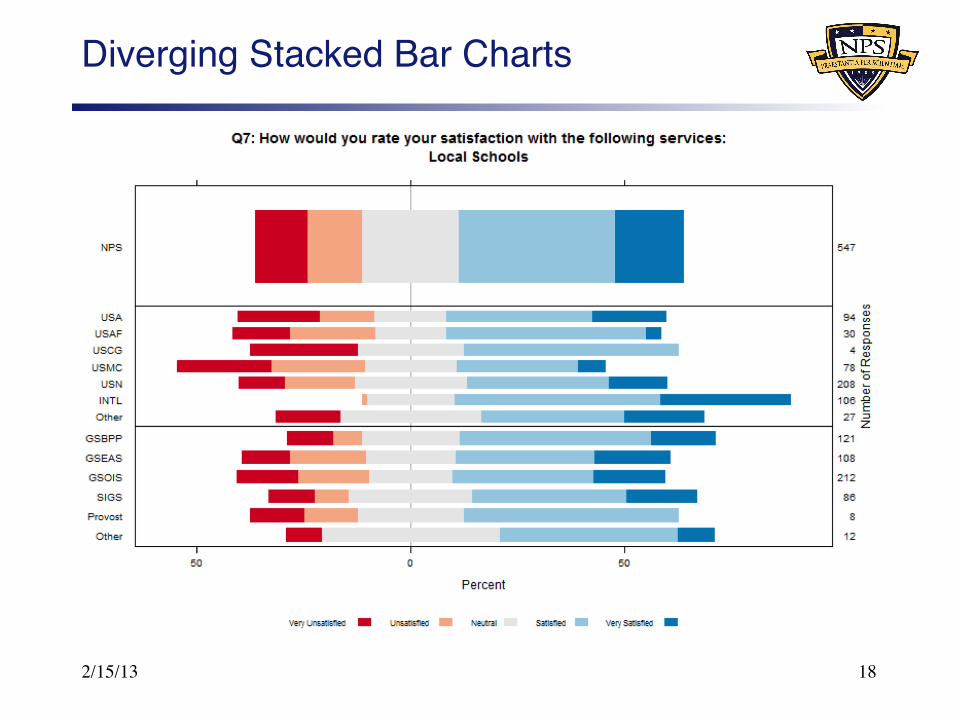
Diverging Stacked Bar Charts"
2/15/13 18

Other Thoughts on Survey Briefings"
• Goal is to communicate to decision maker what the data say about the survey objective"– Don’t make it a data dump"
• Focus on effective graphical communication"– Use graphics that effectively communicate the quantitative
results"• See Cleveland (1994, 1993) and Tufte (1990, 2001)"
– Save the mathematics, modeling, and technical details for the back-up slides / report appendix"
• But do communicate the necessary details to convince the audience that the survey was done effectively and rigorously"– Response rate (presumably high), margin(s) of error, etc."
2/15/13 19

Calculating the Response Rate"
• In theory, the response rate is simple:"
• In practice, it can be more complicated to calculate "– What counts as a “completed survey”?"– What to do with those who could not be reached,
say due to incorrect contact information?"– Etc."
2/15/13 20
Number of completed surveysResponse RateNumber of surveys sent out
=

Other Potential Response Rate Calculation Complications"
• When must screen frame members to determine sample eligibility"– Hard then to determine denominator for response
rate calculation"• When sample frame consists of clustered
elements and full cluster nonrespondent"– Unclear how many sample elements were really
nonrespondent"• When using unequal sampling probabilities"
– Unclear whether to use weights in response rate calculation"
2/15/13 21

One (Conservative) Approach"
where ""I = number of complete surveys""R = number of refusals and break-offs""NC = number of non-contacts""O = number of other eligible""U = number of unknown eligibility""e = estimated proportion of eligibility"
2/15/13 22
Response rate II R NC O e U
=+ + + + ×

If Only News Organizations (and Many Others) Followed These Suggestions…"
2/15/13 23

What We Have Just Learned"
• Discussed a bit about how to display survey data and results in a briefing"– How to structure slides"– What to include"– Displaying margins of error"
• Learned about a couple of useful new plots"• Discussed how to calculate response rates
and possible issues""
2/15/13 24

References on Good Graphics"
• Cleveland, W.S. (1993). Visualizing Data, Hobart Press."
• Cleveland, W.S. (1994). The Elements of Graphing Data, Hobart Press."
• Tufte, E.R. (2001). The Visual Display of Quantitative Information, 2nd ed., Graphics Press."
• Tufte, E.R. (1990). Envisioning Information, Graphics Press."
2/15/13 25