Embed Size (px)
Citation preview

Categorical Data Analysis in Complex Surveys"
Professor Ron Fricker"Naval Postgraduate School"
Monterey, California"
2/22/13 1
Reading Assignment:"Lohr chpt. 10"
Goals for this Lecture"
• What about categorical data analysis for complex designs?"
• How do complex designs affect chi-square hypothesis tests?"
• What are some methods to correct for the sampling design in order to correctly do the tests?"
2/22/13 2
What’s the Problem?"
• Chi-square distribution of test statistic results from SRS assumption"
• In complex surveys table counts unlikely to reflect relative frequencies of the categories in the population "– Can’t just plug counts into standard X 2 calculations"– Results in incorrect p-values"
2/22/13 3 3

Computer/Cable TV Example"
• What if interviewed two individuals in each house and got same answers?"
2/22/13 4
Computer? Yes No
Cable? Yes 119 188 307 No 88 105 193
207 293 500
New data:
Original data:
Computer? Yes No
Cable? Yes 238 376 614 No 176 210 386
414 586 1000
2 4.562X =-value 0.03p =
2 2.281X =-value 0.13p =
4
Let’s Check the Calculations (1)"
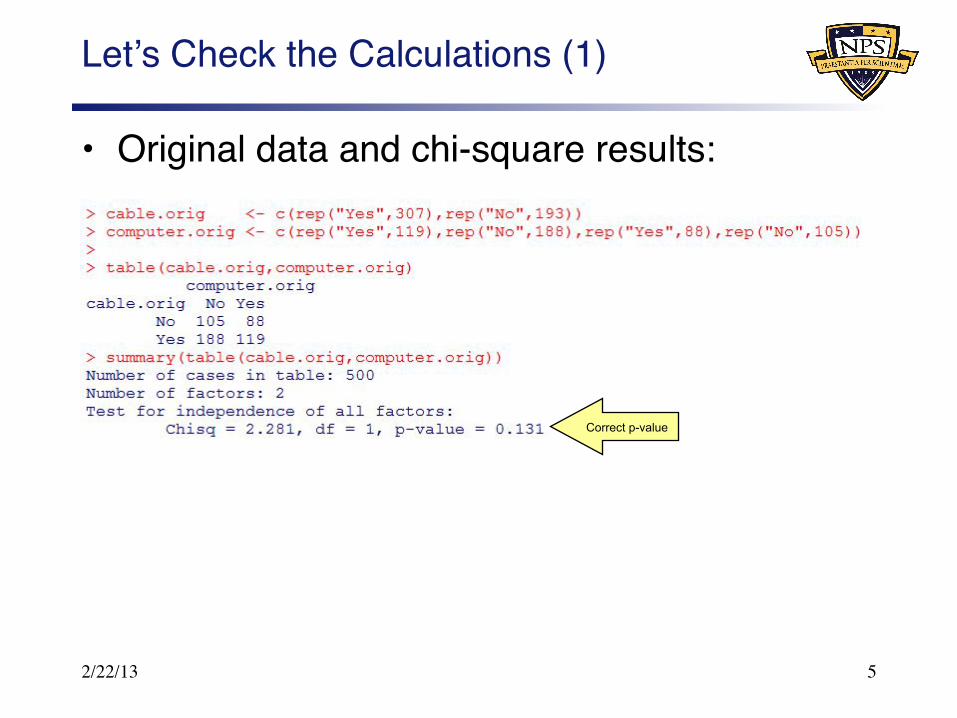
• Original data and chi-square results:"
2/22/13 5
Correct p-value
Let’s Check the Calculations (2)"
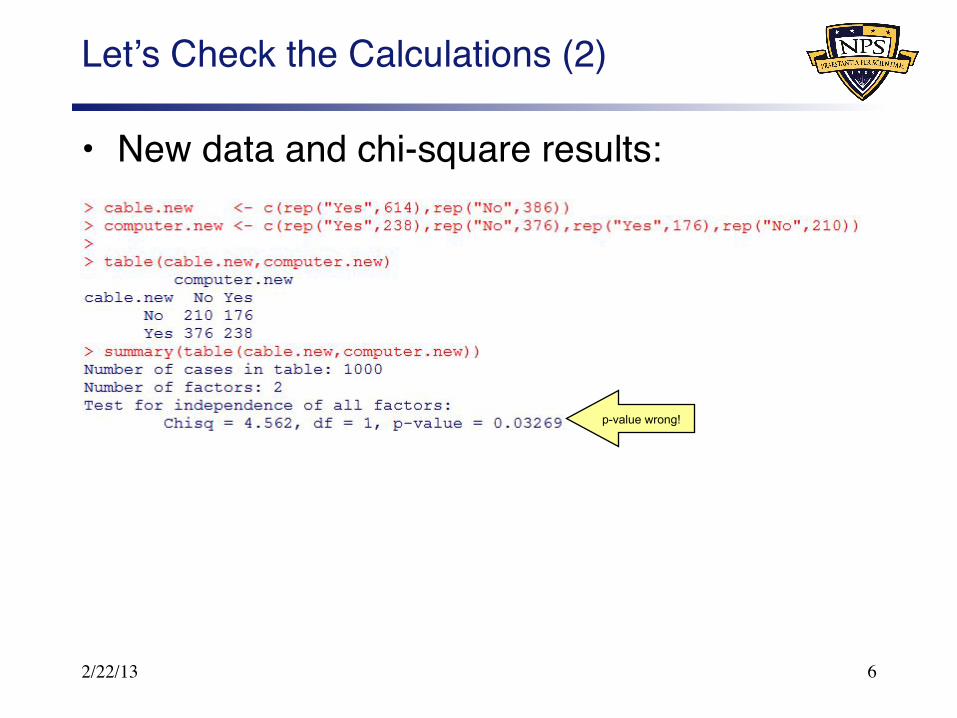
• New data and chi-square results:"
2/22/13 6
p-value wrong!
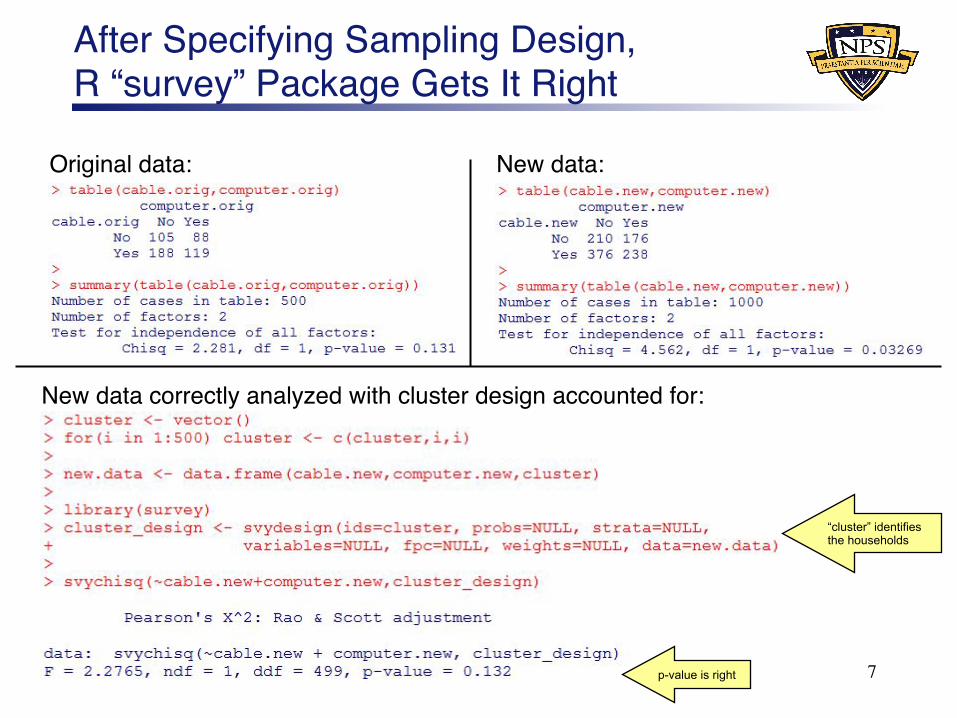
After Specifying Sampling Design, R “survey” Package Gets It Right"
2/22/13 7
“cluster” identifies the households
p-value is right
Original data:" New data:"
New data correctly analyzed with cluster design accounted for:"
Effects of Stratified Sampling Design on Hypothesis Tests and CIs (1) "
• If rows in contingency table correspond to strata, usual chi-square test of homogeneity fine"– But may want to test association between other
(non-strata) factors"• In general, stratification increases precision of
estimates"– E.g., stratified sample of size n gives same
precision for estimating pij as a SRS of size n / dij, where dij is the design effect"
2/22/13 8 8
Effects of Stratified Sampling Design on Hypothesis Tests and CIs (2) "
• Thus p-values for chi-square tests with stratification are conservative"– E.g., actual p-value will be smaller than calculated
p-value"– Means if null rejected, it is appropriate"– However, could also fail to reject and miss a
significant result (“Type II error”)"• If don’t reject but close, how to tell if null should
be rejected?"
2/22/13 9 9
Effects of Clustered Sampling Design on Hypothesis Tests and CIs"
• Opposite effect from stratification"• As we illustrated, p-values artificially low"
– Means if fail to reject null, it is appropriate"• However, if do reject null, how to tell if null
really should be rejected?"• Clustering unaccounted for can result in
spurious “significant” results"– I.e., more likely to commit “Type I” error"
2/22/13 10 10
Corrections to Chi-square Tests"
• Wald tests"• Bonferroni tests"• Matching moments"• Model-based methods"
2/22/13 11 11
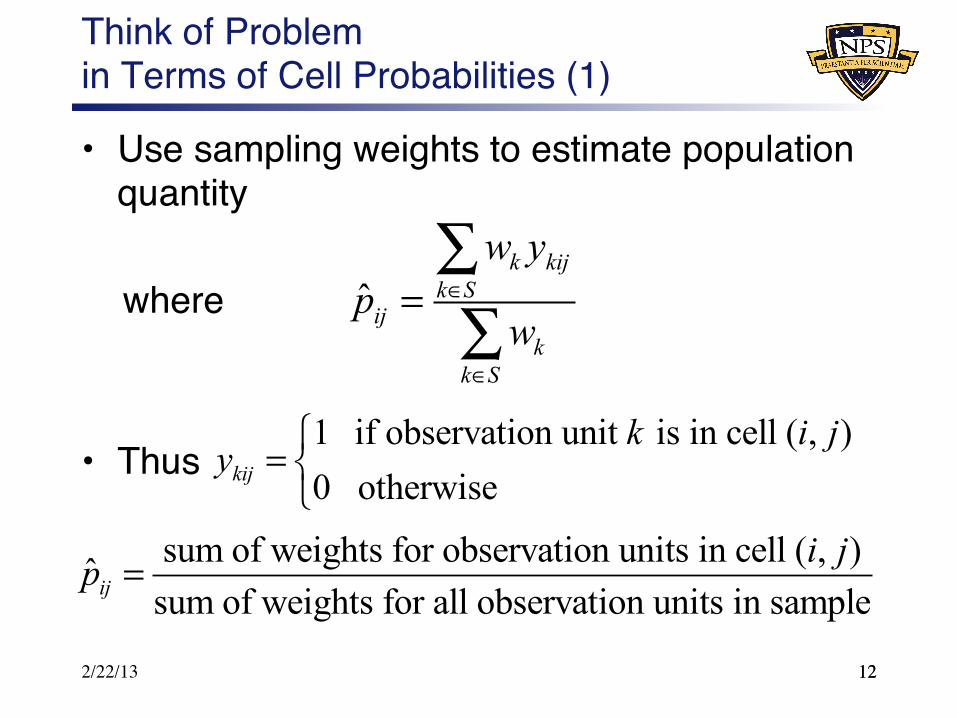
Think of Problem in Terms of Cell Probabilities (1)"
• Use sampling weights to estimate population quantity"
where"
• Thus"
2/22/13 12
ˆk kij
k Sij
kk S
w yp
w∈
∈
=∑∑
1 if observation unit is in cell ( , )0 otherwise kij
k i jy ⎧
= ⎨⎩
sum of weights for observation units in cell ( , )ˆsum of weights for all observation units in sampleij
i jp =
12
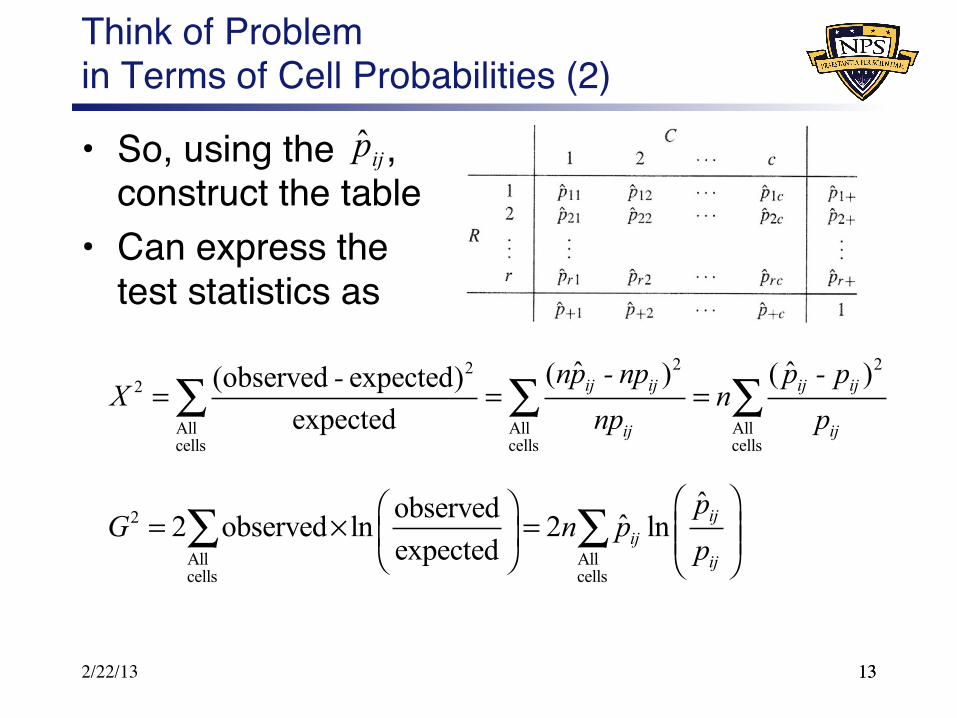
Think of Problem in Terms of Cell Probabilities (2)"
• So, using the , construct the table"
• Can express the test statistics as"
""
2/22/13 13
ˆ ijp
13
2 222
All All Allcells cells cells
ˆ ˆ( ) ( )(observed expected)expected
ij ij ij ij
ij ij
np - np p - p - X nnp p
= = =∑ ∑ ∑
2
All Allcells cells
ˆobserved ˆ2 observed ln 2 lnexpected
ijij
ij
pG n p
p⎛ ⎞⎛ ⎞
= × = ⎜ ⎟⎜ ⎟ ⎜ ⎟⎝ ⎠ ⎝ ⎠∑ ∑
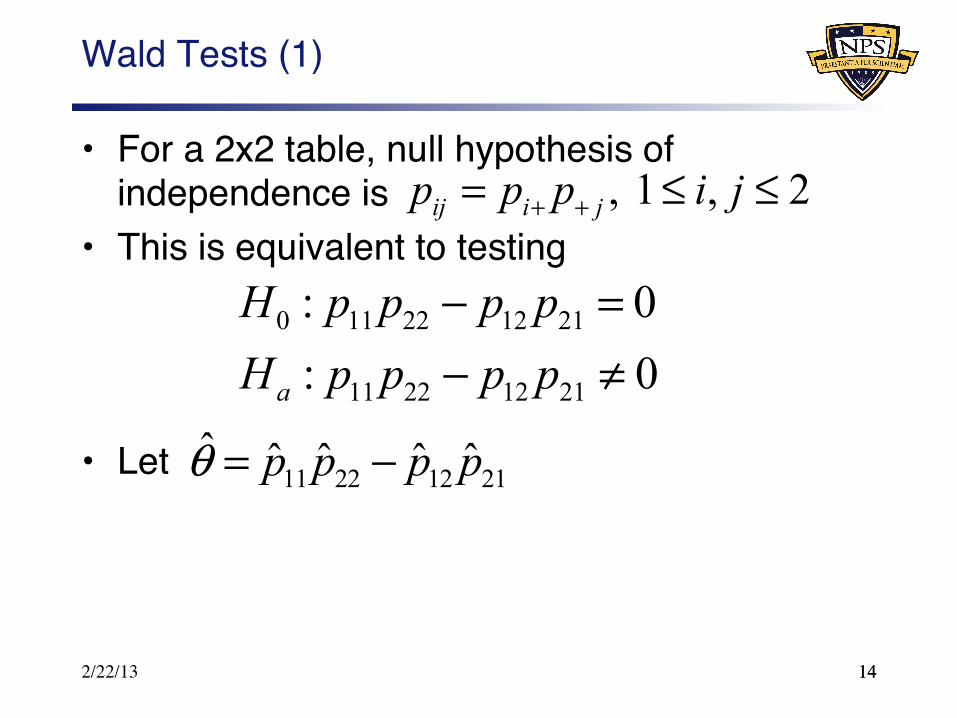
Wald Tests (1)"
• For a 2x2 table, null hypothesis of independence is"
• This is equivalent to testing"
• Let"
2/22/13 14 14
, 1 , 2ij i jp p p i j+ += ≤ ≤
0 11 22 12 21
11 22 12 21
: 0: 0a
H p p p pH p p p p
− =− ≠
11 22 12 21ˆ ˆ ˆ ˆ ˆp p p pθ = −
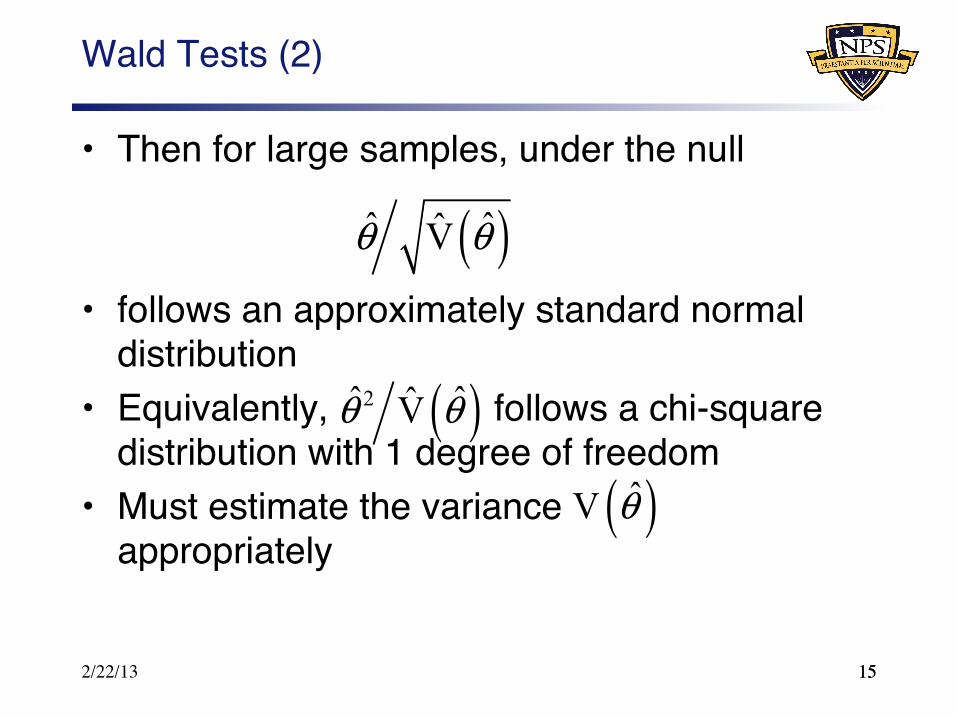
Wald Tests (2)"
• Then for large samples, under the null"
• follows an approximately standard normal distribution "
• Equivalently, follows a chi-square distribution with 1 degree of freedom"
• Must estimate the variance appropriately"
2/22/13 15 15
( )ˆ ˆV̂θ θ
( )2ˆ ˆV̂θ θ
( )ˆV θ
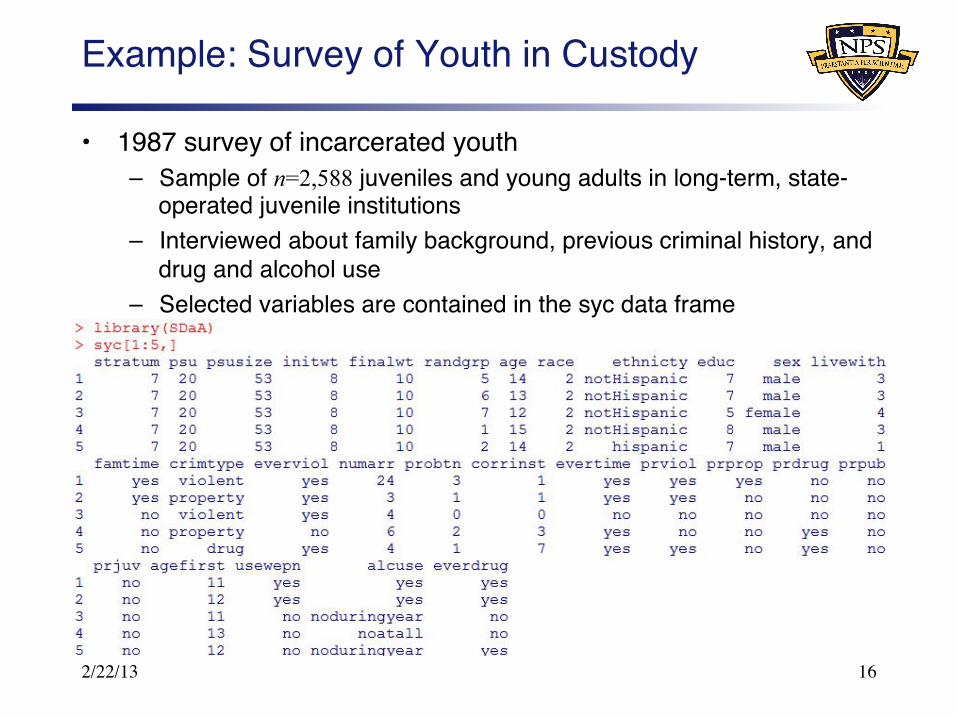
Example: Survey of Youth in Custody"
• 1987 survey of incarcerated youth"– Sample of n=2,588 juveniles and young adults in long-term, state-
operated juvenile institutions"– Interviewed about family background, previous criminal history, and
drug and alcohol use"– Selected variables are contained in the syc data frame"
"
2/22/13 16
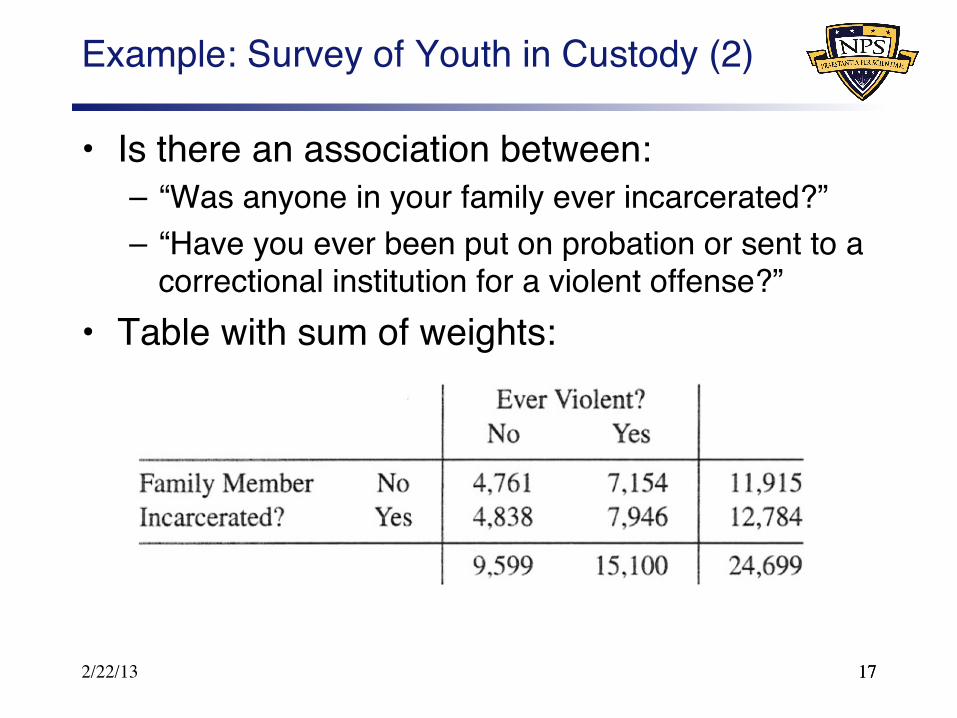
Example: Survey of Youth in Custody (2)"
• Is there an association between:"– “Was anyone in your family ever incarcerated?”"– “Have you ever been put on probation or sent to a
correctional institution for a violent offense?”"• Table with sum of weights:""
2/22/13 17 17
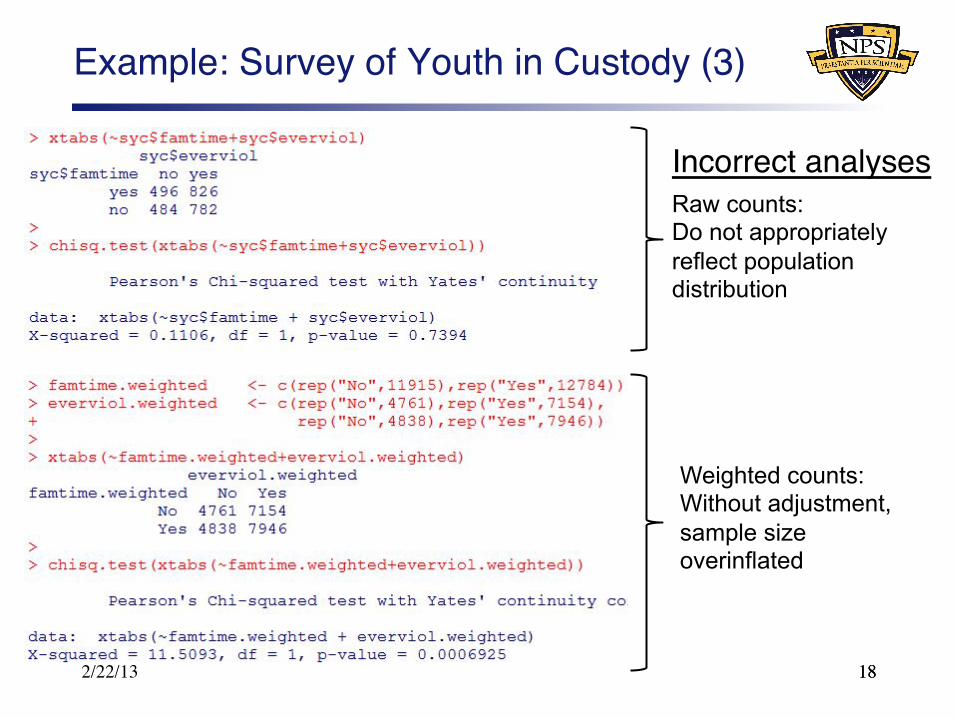
Example: Survey of Youth in Custody (3)"
Incorrect analyses"
2/22/13 18
Raw counts: Do not appropriately reflect population distribution
Weighted counts: Without adjustment, sample size overinflated
18
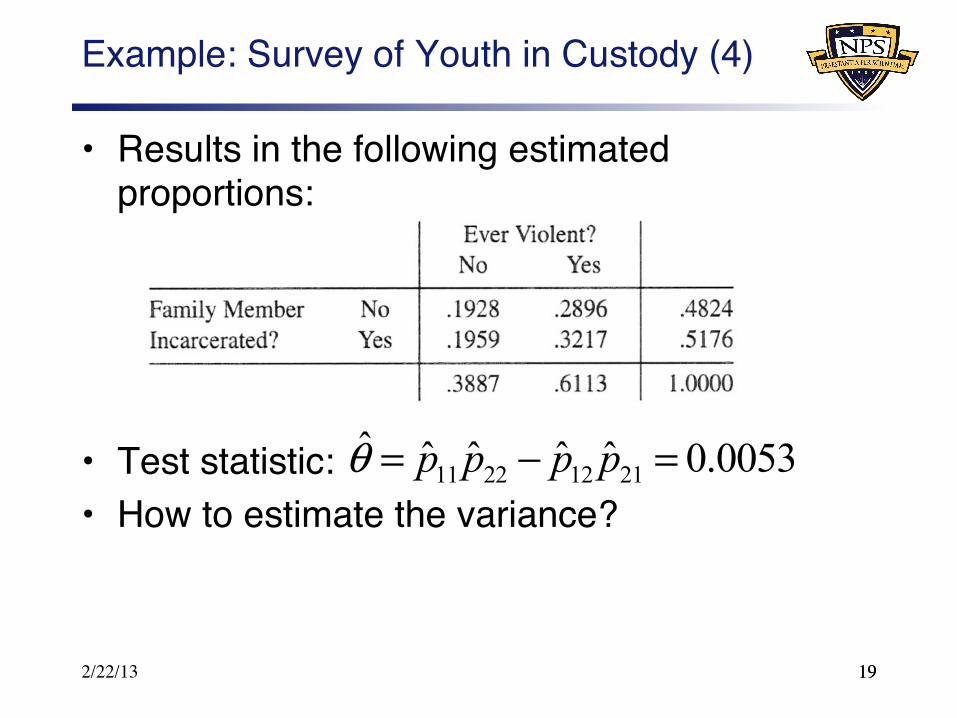
Example: Survey of Youth in Custody (4)"
• Results in the following estimated proportions:"
• Test statistic:"• How to estimate the variance? "
2/22/13 19 19
11 22 12 21ˆ ˆ ˆ ˆ ˆ 0.0053p p p pθ = − =
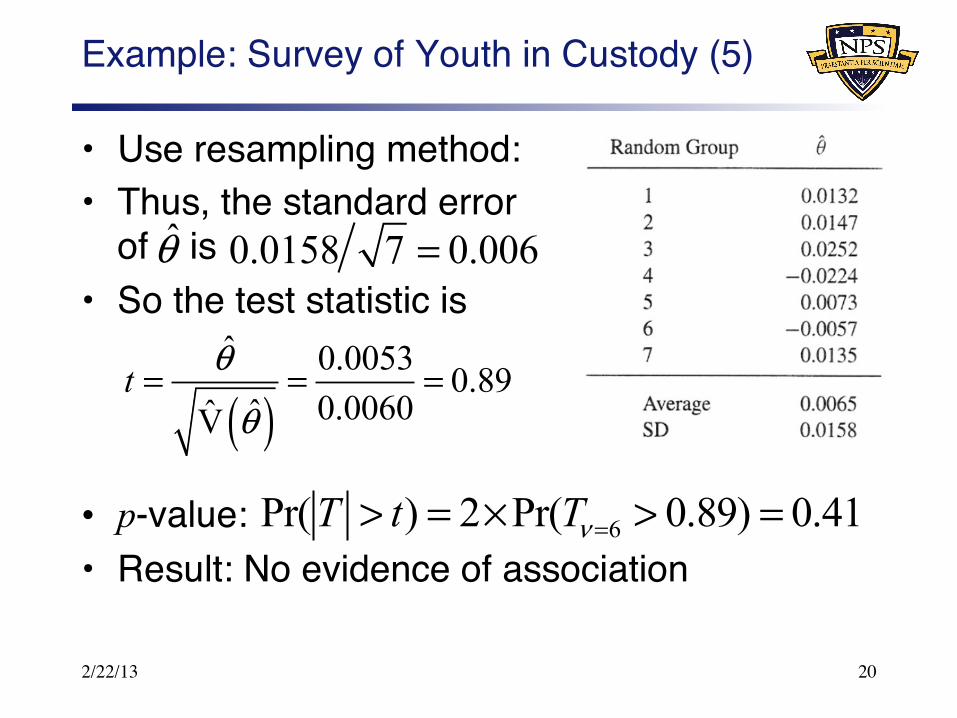
Example: Survey of Youth in Custody (5)"
• Use resampling method:"• Thus, the standard error
of is"• So the test statistic is"
• p-value:"• Result: No evidence of association "
2/22/13 20
0.0158 7 0.006=θ̂
( )ˆ 0.0053 0.89
0.0060ˆV̂t θ
θ= = =
6Pr( ) 2 Pr( 0.89) 0.41T t Tν => = × > =
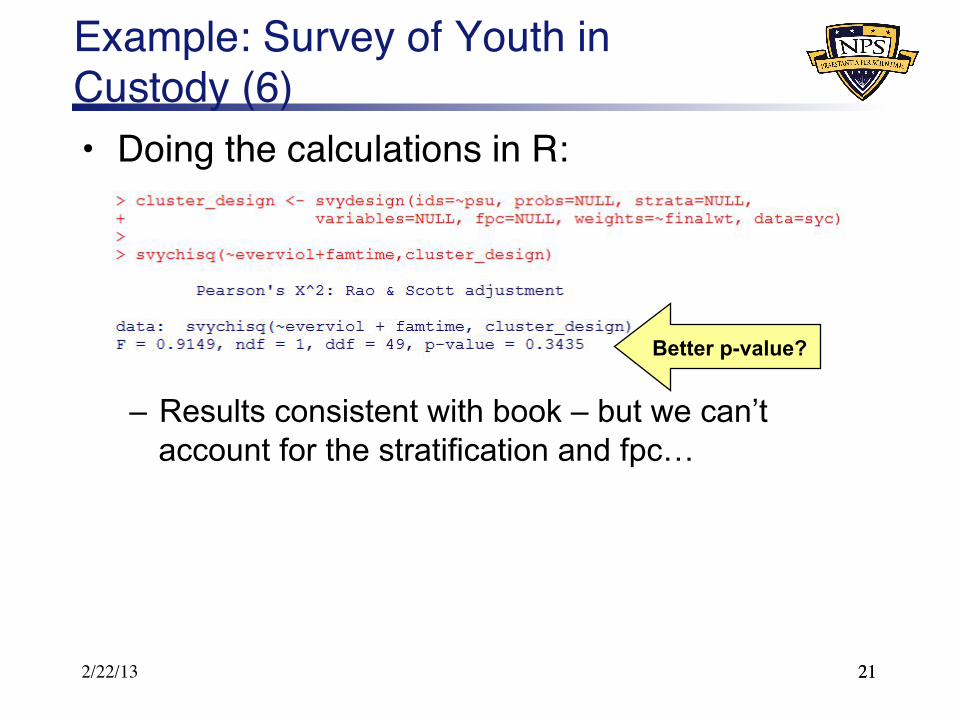
Example: Survey of Youth in Custody (6)"• Doing the calculations in R:"
– Results consistent with book – but we can’t account for the stratification and fpc…
2/22/13 21 21
Better p-value?
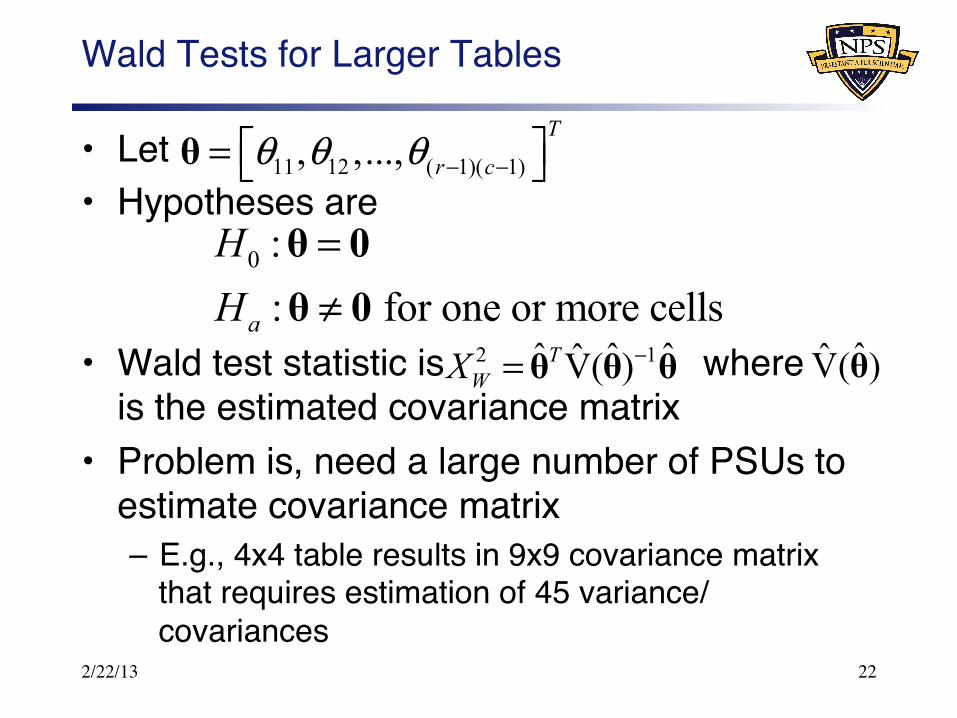
Wald Tests for Larger Tables"
• Let"• Hypotheses are"
• Wald test statistic is where is the estimated covariance matrix "
• Problem is, need a large number of PSUs to estimate covariance matrix"– E.g., 4x4 table results in 9x9 covariance matrix
that requires estimation of 45 variance/covariances"
2/22/13 22
11 12 ( 1)( 1), ,...,T
r cθ θ θ − −⎡ ⎤= ⎣ ⎦θ
0 :: for one or more cellsa
HH
=≠θ 0θ 0
2 1ˆ ˆ ˆV̂( )TWX
−= θ θ θ ˆV̂( )θ
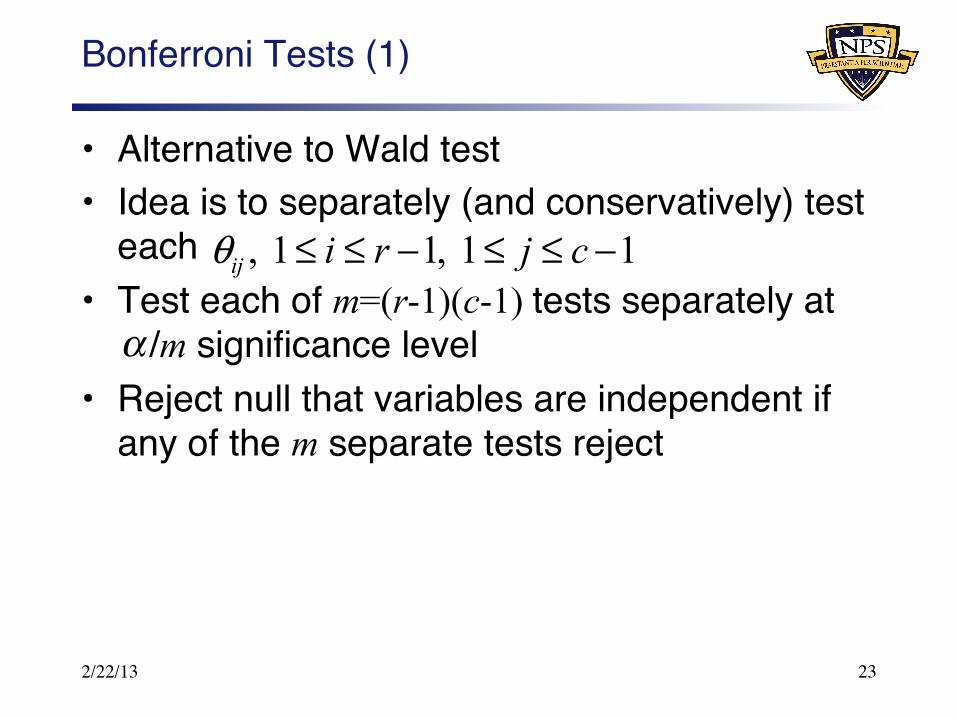
Bonferroni Tests (1)"
• Alternative to Wald test"• Idea is to separately (and conservatively) test
each "• Test each of m=(r-1)(c-1) tests separately at
/m significance level"• Reject null that variables are independent if
any of the m separate tests reject"
2/22/13 23
, 1 1, 1 1ij i r j cθ ≤ ≤ − ≤ ≤ −
α
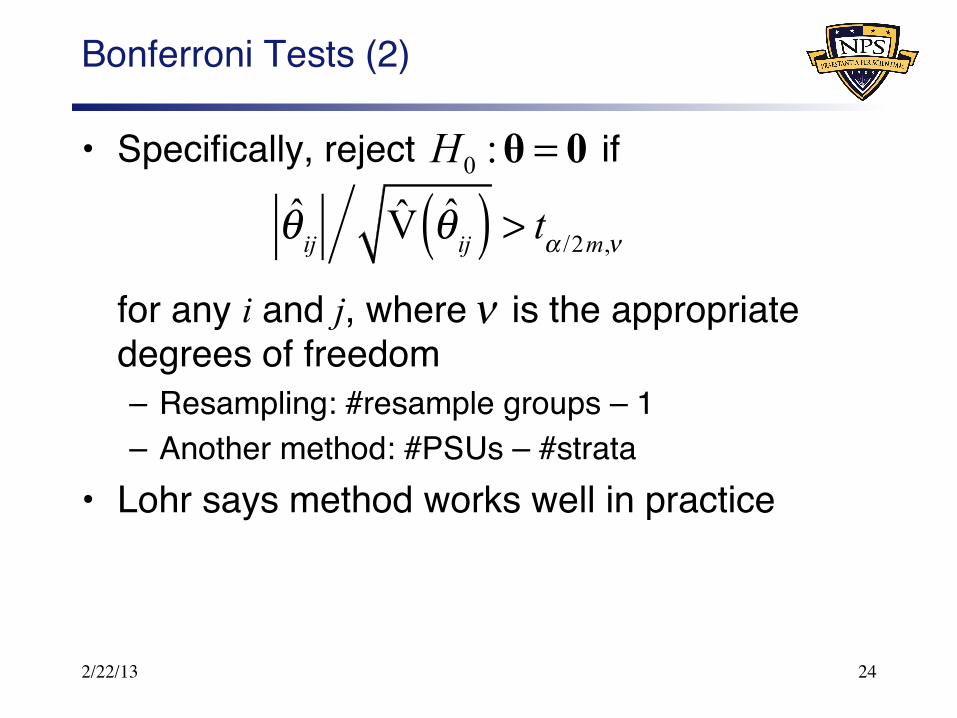
Bonferroni Tests (2)"
• Specifically, reject if"
"for any i and j, where is the appropriate degrees of freedom"– Resampling: #resample groups – 1"– Another method: #PSUs – #strata"
• Lohr says method works well in practice"
2/22/13 24
θ̂ ij V̂ θ̂ ij( ) > tα /2m,ν
0 :H =θ 0
ν
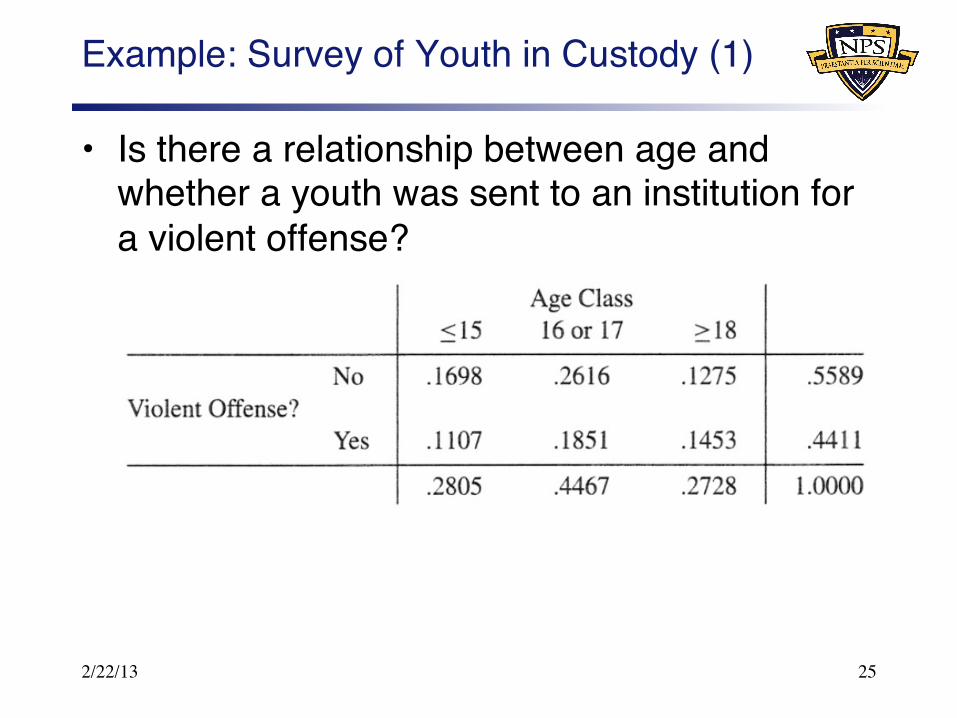
Example: Survey of Youth in Custody (1)"
• Is there a relationship between age and whether a youth was sent to an institution for a violent offense?"
2/22/13 25
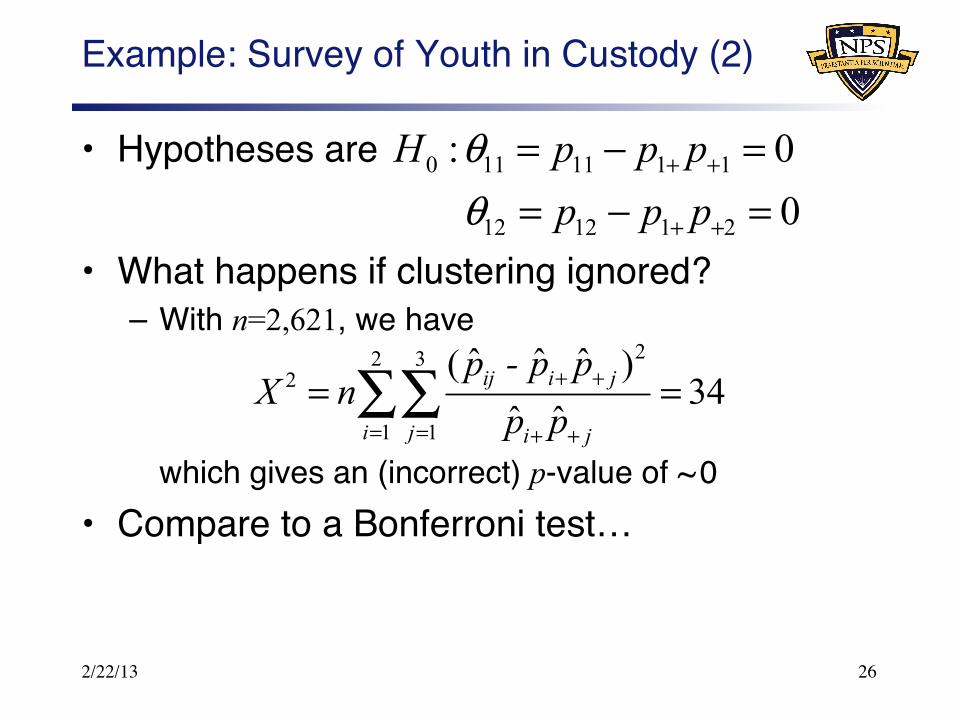
Example: Survey of Youth in Custody (2)"
• Hypotheses are"
• What happens if clustering ignored?"– With n=2,621, we have"
"which gives an (incorrect) p-value of ~ 0"• Compare to a Bonferroni test…"
2/22/13 26
0 11 11 1 1
12 12 1 2
: 00
H p p pp p p
θθ
+ +
+ +
= − == − =
22 32
1 1
ˆ ˆ ˆ( )34
ˆ ˆij i j
i j i j
p - p pX n
p p+ +
= = + +
= =∑∑
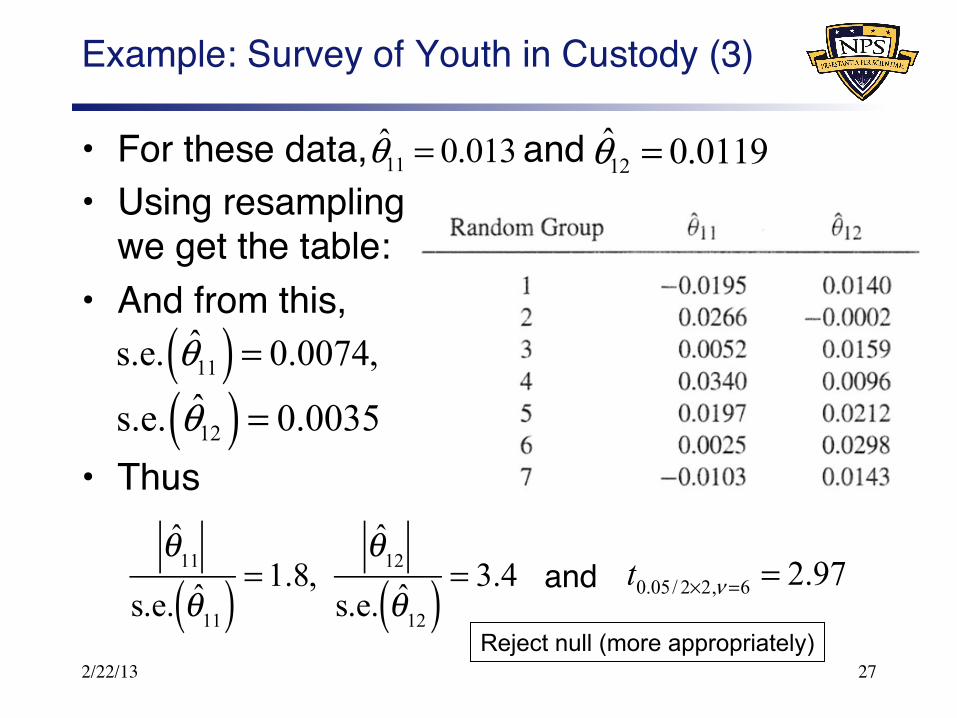
Example: Survey of Youth in Custody (3)"
• For these data, and"• Using resampling,
we get the table:"• And from this,"
• Thus "
2/22/13 27
11ˆ 0.013θ = 12
ˆ 0.0119θ =
( )11ˆs.e. 0.0074,θ =
( )12ˆs.e. 0.0035θ =
θ̂11
s.e. θ̂11( ) = 1.8, θ̂12
s.e. θ̂12( ) = 3.4 0.05/ 2 2, 6 2.97t ν× = =and"
Reject null (more appropriately)
Matching Moments (1) "
• As before, X 2 test statistics from complex survey don’t follow distribution"
• Idea is to use first and second moments to adjust test statistic"– I.e., perhaps multiples of X 2 test statistics
approximately follow distribution"• Developed by Rao and Scott (1981, 1984)""
2/22/13 28
2( 1)( 1)r cχ − −
2χ
Matching Moments (2)"
• Won’t go into detail here – see Lohr if interested"
• First-order correction: "– Estimate expected value of X2 as well as various
design effects"– Use to calculate a new test statistic ( )"– Compare to an F distribution to calculate p-values"
• Second-order correction:"– Estimate first and second moments of X 2, as well
as various design effects"– Use to calculate a new test statistic ( )"– Compare to a distribution to calculate p-values"
2/22/13 29 29
2FX
2SX
2χ
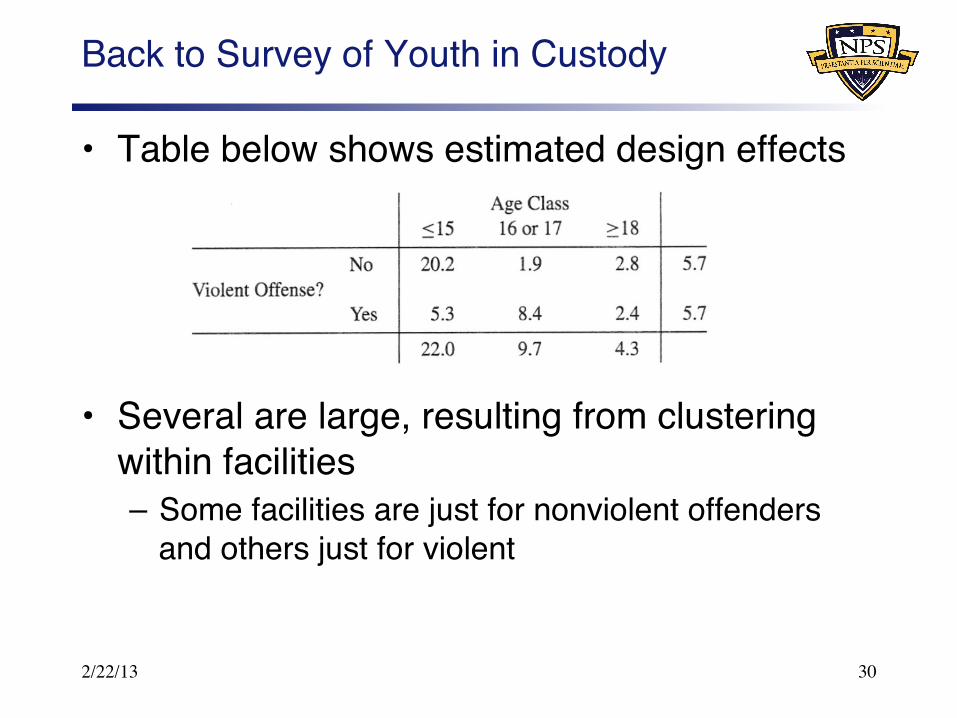
Back to Survey of Youth in Custody"
• Table below shows estimated design effects"
• Several are large, resulting from clustering within facilities"– Some facilities are just for nonviolent offenders
and others just for violent"
2/22/13 30

Survey of Youth Study (cont’d)"
• Just doing a first-order correction"• Turns out that"• Appropriate reference distribution is an"• Thus, the p-value is"
• Conclusion: Reject the null "– Consistent with Bonferroni result"– p-value may be a bit too small (because of large
design effect differences) "
2/22/13 31
2 16.2FX =2,12F
2,12Pr( 16.2 / 2) 0.006F > =
31
Model-based Methods"
• Rather than use covariance estimates to adjust chi-squared tests, use model"
• Lohr describes model for cluster sample with two observations per cluster"– Model assumes design effects are the same in
each cell and margin"• Well just illustrate with example from Lohr"
2/22/13 32
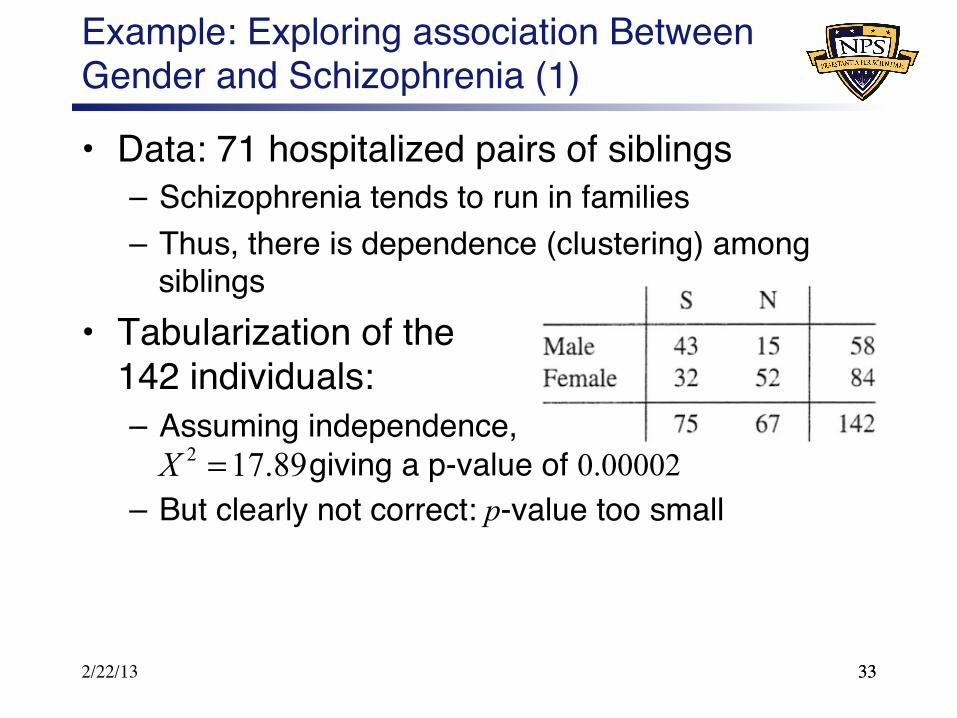
Example: Exploring association Between Gender and Schizophrenia (1)"
• Data: 71 hospitalized pairs of siblings"– Schizophrenia tends to run in families"– Thus, there is dependence (clustering) among
siblings"• Tabularization of the
142 individuals:"– Assuming independence,
giving a p-value of 0.00002 – But clearly not correct: p-value too small "
2/22/13 33 33
2 17.89X =
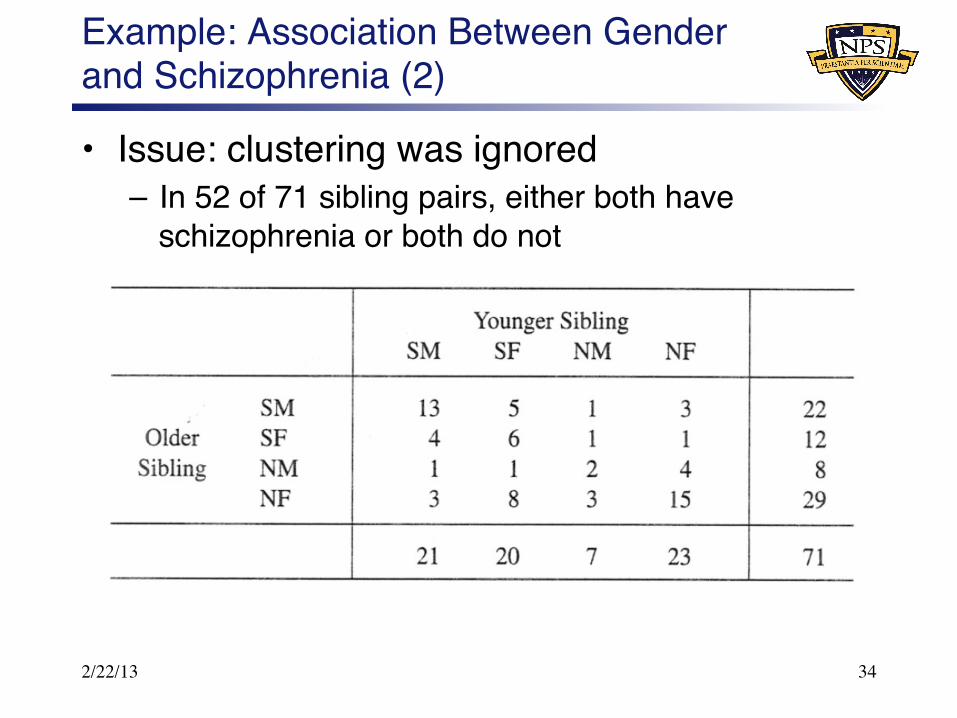
Example: Association Between Gender and Schizophrenia (2)"
• Issue: clustering was ignored"– In 52 of 71 sibling pairs, either both have
schizophrenia or both do not"
2/22/13 34
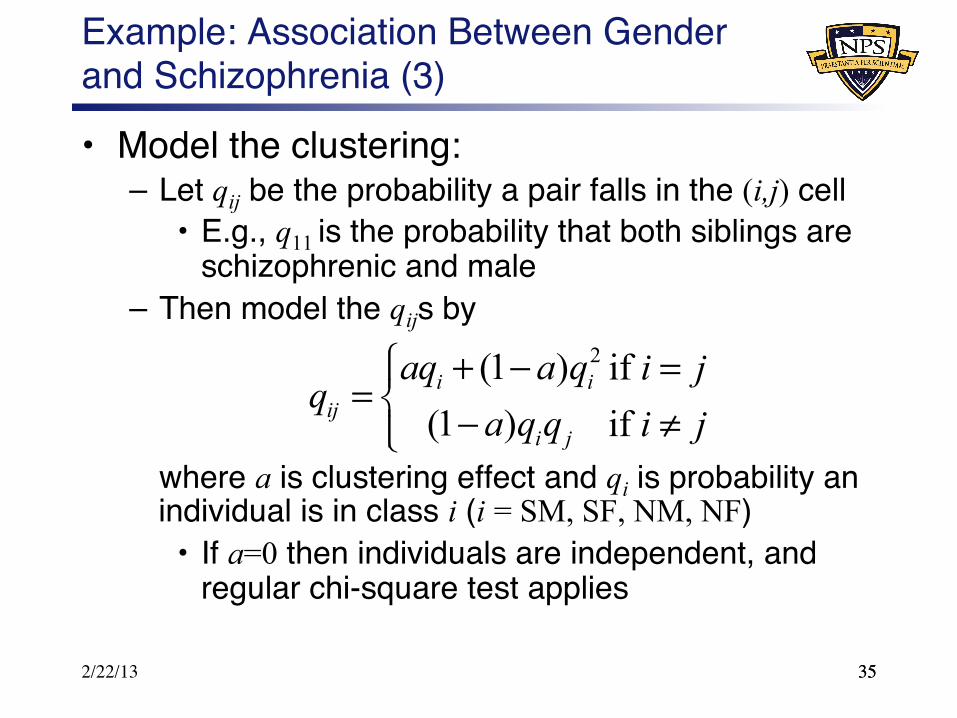
Example: Association Between Gender and Schizophrenia (3)"
• Model the clustering:"– Let qij be the probability a pair falls in the (i,j) cell"
• E.g., q11 is the probability that both siblings are schizophrenic and male"
– Then model the qijs by"
"""where a is clustering effect and qi is probability an individual is in class i (i = SM, SF, NM, NF)"
• If a=0 then individuals are independent, and regular chi-square test applies "
2/22/13 35 35
2(1 ) if (1 ) if i i
iji j
aq a q i jq
a q q i j⎧ + − =⎪= ⎨ − ≠⎪⎩
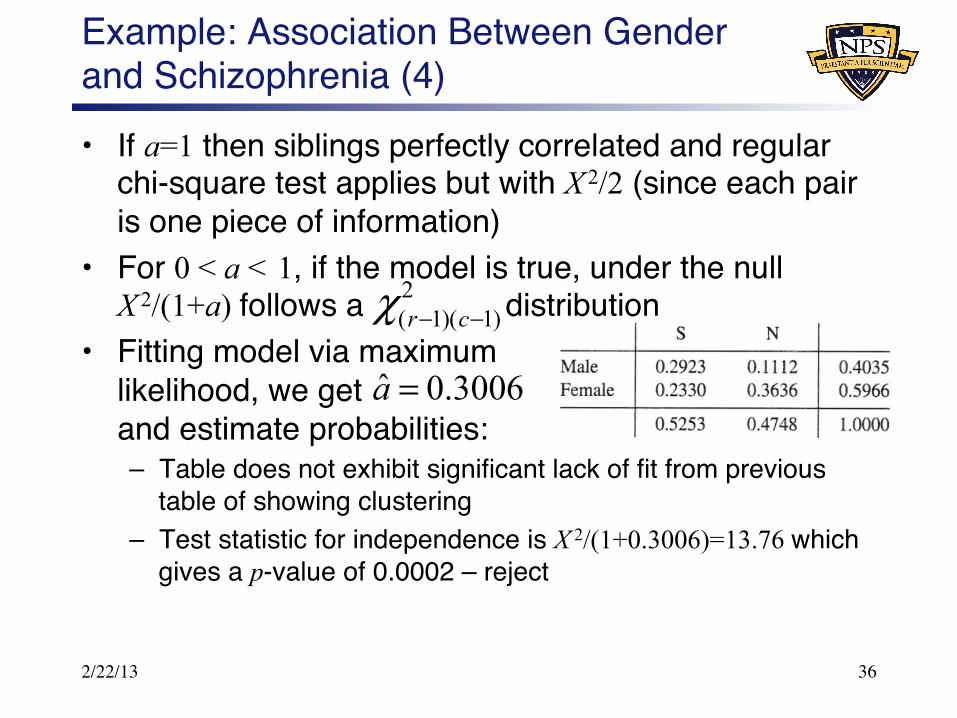
Example: Association Between Gender and Schizophrenia (4)"
• If a=1 then siblings perfectly correlated and regular chi-square test applies but with X 2/2 (since each pair is one piece of information)"
• For 0 < a < 1, if the model is true, under the null X 2/(1+a) follows a distribution"
• Fitting model via maximum likelihood, we get and estimate probabilities:"– Table does not exhibit significant lack of fit from previous
table of showing clustering"– Test statistic for independence is X 2/(1+0.3006)=13.76 which
gives a p-value of 0.0002 – reject "
2/22/13 36
2( 1)( 1)r cχ − −
ˆ 0.3006a =
Other Software: Stata"
• Stata 9: SVY procedures support both one-way and two-way tables"– svy: tab [var]"– svy: tab [var1] [var2]"
• Need to order manuals to see which methods used"
• See www.stata.com/stata9/svy.html for more detail"
2/22/13 37
Other Software: SAS"
• SAS v8 has some procedures for complex survey analysis (PROC SURVEYMEANS PROC SURVEYREG), but no PROCs for categorical data analysis"– PROC FREQ and PROC CATMOD would
incorrectly estimate standard errors"• SAS v9.1 has PROC SURVEYFREQ for
categorical data analysis"– Can specify various Wald and Rao-Scott tests "
• See http://support.sas.com/onlinedoc/913/docMainpage.jsp"
2/22/13 38
And Still Other Software…"
• …designed for complex survey analysis include SUDAAN and WestVar"– Don’t know if they can do these calculations or not"– See their documentation ""
ü JMP: Cannot do appropriate calculations"
2/22/13 39
What We Have Just Learned"
• Gained some insight into "– What to do about categorical data analysis for
complex designs"– How complex designs affect chi-square hypothesis
tests"• Learned about some methods to correct for
the sampling design in chi-square tests"
2/22/13 40