Embed Size (px)
Citation preview

Models and modellers for coastal flooding Presented by Dr. Ole Svenstrup Petersen, [email protected] Head of Research Coastal and Estuarine Engineering, DHI And colleagues at DHI

Agenda
22 May, 2013 © DHI #2
• Introduction to DHI and DHI’s models
• Examples of model applications and validation relevant for coastal flooding
• Examples of model coupling
• Discussion of points of interest

About DHI
• Founded 1963 as Coastal Lab from Danish Technical University
• Independent, not-for-profit foundation
• All about water – Marine, coastal, inland, urban and industrial
• 30 % Research - 20 % Software – 50 % international consulting
22 May, 2013 © DHI #3

© DHI 2013
Offices
Head office
RD Centre
DHI OFFICES 1100 Staff, 700 outside DK in 36 offices
RD centers in Denmark and Singapore

A modeling timeline – the history of DHI’s models
• 1958-59 Thyborøn Inlet, Lundgren and Sørensen (DHI’s first director) develop a 14-box diffusive-
wave storm surge model of the Limfjord on DASK
22 May, 2013 © DHI #5

A modeling timeline – the history of DHI’s models
• 1959 Limfjord model on DASK
• 1962 Mike Abbott, IHE, initiates DHI’s modeling team
• 1983 MIKE 21 commercial software products
• 1986 MIKE 3
• 1998 Start of FM development
• 2000 Generalized Wave equation, 2D and 3D
• 2004 Finite Volume 2D and 3D with flooding and drying
• 2004 First Spectral Wave model based on Flexible Mesh
• 2012 MIKE 3/21 on 1000 cores
• 201X GPU, non-hydrostatic, BW ……
22 May, 2013 © DHI #6 MIKE 11 Limfjord model

DHI Modeling systems
DHI’s modeling platforms - MIKE by DHI

• A platform for customised software building on
top of the modeling engines in order to make
results more accessible and useful for the
public
• http://www.dhigroup.com/MIKECUSTOMISEDbyDHI.aspx

MIKE by DHI Marine models
22 May, 2013 © DHI #9
http://mikebydhi.com/Products/CoastAndSea.aspx

MIKE 3/21 basics • Shallow water equations (hydrostatic) in cartesian or radial projections
• Fractional step with Partial mode split
• Explicit time integration – strict conditions for Courant numbers
• Adaptive time stepping – global (for HD) or local (for SW)
• 3 step flooding and drying
• Finite volume method
• Unstructured horizontally
• Sigma or combined sigma-z vertically
Know more ?
http://mikebydhi.com/~/media/Microsite_MIKEbyDHI/Publications/PDF/Short%20descriptions/MIKE213_FM_HD_Short_Description.ashx

Z-level
-level
Vertical Discretization in MIKE 3 FM
MIKE 3/21 Spatial
Combined sigma and z-layers
Improved description along steep slopes
Better description of stratified layers
Accurate description of heat exchange

MIKE 21 Spectral Wave
• Fully spectral (FS) and directionally decoupled parametric (DS) formulations
• Instationary and quasi-stationary formulations with adaptive and local timestepping
• Source functions based on state-of-the-art formulations (WAM cycle 4)
• Unstructured mesh
• Dynamic coupling with hydrodynamic flow model for modeling of wave-current interaction and time-varying water
depth
22 May, 2013 © DHI #12
Know more ?
http://mikebydhi.com/~/media/Microsite_MIKEbyDHI/Publications/PDF/Short%20descriptions/MIKE21_SW_FM_Short_Description.ashx

MIKE 21 BW (BOUSSINESQ WAVE)
• Time domain,deterministic free surface model
• Calculation and analysis of short- and long-
period waves in ports, harbours and coastal
areas.
• Solves a set of enhanced Boussinesq type
equations
• Includes diffraction, refraction, breaking, runup,
overtopping, non-linear, random directional
seas
• Wave agitation in harbours and wave
assessments in the coastal zone
© DHI 2013

MIKE 21 BW (BOUSSINESQ WAVE)
© DHI 2013
Know more ?
http://mikebydhi.com/~/media/Microsite_MIKEbyDHI/Publications/PDF/Short%20descriptions/MIKE21_BW_short_description.ashx

Sand Transport Processes – MIKE 21 STP
• Building mainly on Fredsøe and Dejgaard’s work
• Uses a profile ”intra-wave parameterisation” to calculate stress, turbulence and transport in wave-
currents
• Can use the wave and flow models to calculate forces
• Feed back on bathymetry
22 May, 2013 © DHI #15
Know more ?
http://www.mikebydhi.com/upload/dhisoftwarearchive/shortdescriptions/marine/SandTransportModuleST.pdf

Model calibration and validation
• A key activity in modeling
• The amount of time/data used is directly reflected in model quality
• Software quality assurance
• Making the right decisions
• ISO certification
• Daily build and basic tests, update procedures
• New feature tests in real environment
• Application/projects
• Use of relevant data is important
• Typically 50 % for model calibration/validation
22 May, 2013 © DHI #16
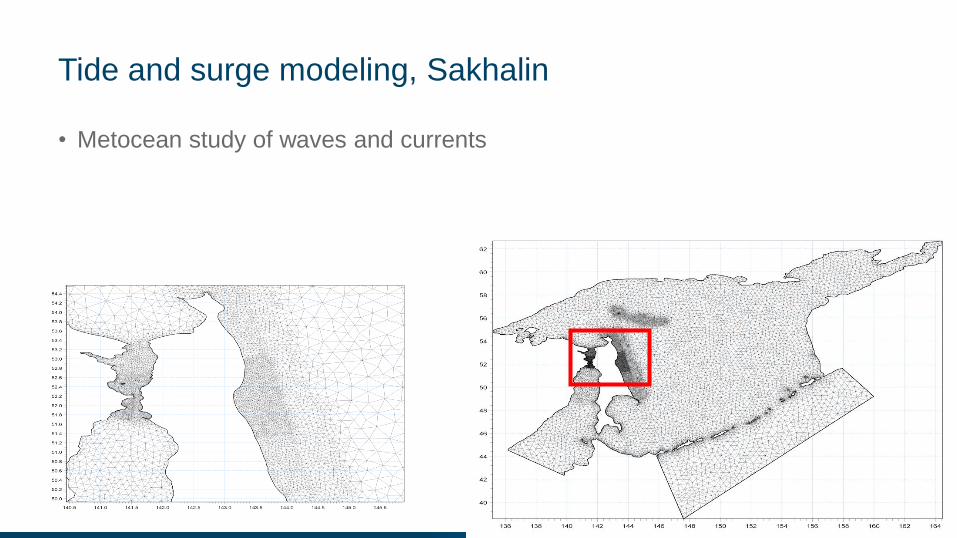
Tide and surge modeling, Sakhalin
• Metocean study of waves and currents

Tidal calibration
• MIKE 21 FM hydrodynamic model
• DTU10 tidal data on boundary and inside
• Customized wind fields (OWI)
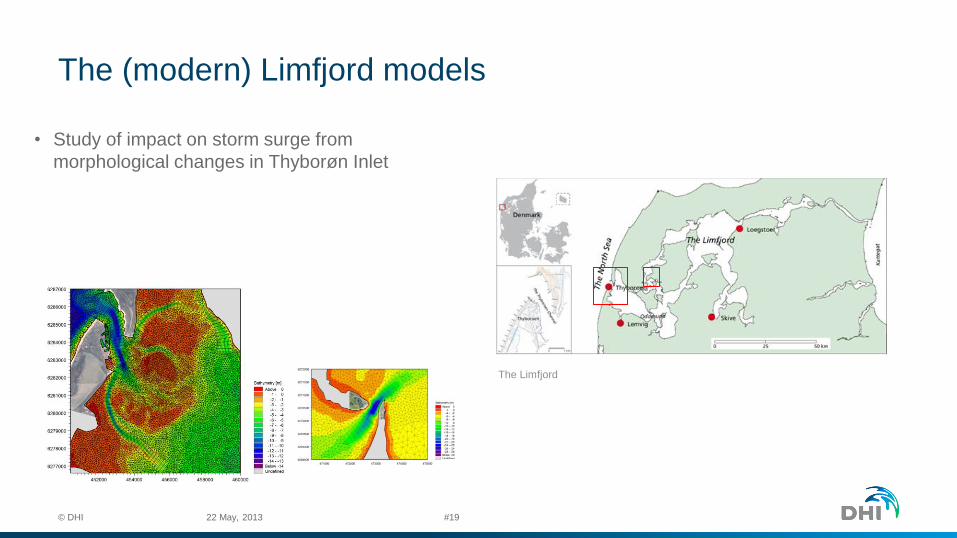
The (modern) Limfjord models
22 May, 2013 © DHI #19
• Study of impact on storm surge from
morphological changes in Thyborøn Inlet
The Limfjord
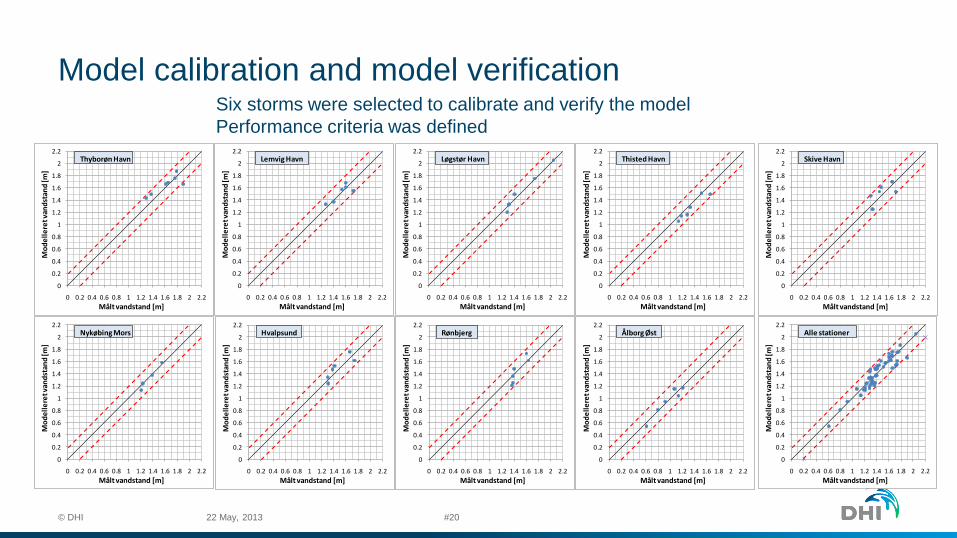
Model calibration and model verification
22 May, 2013 © DHI #20
Six storms were selected to calibrate and verify the model
Performance criteria was defined
0
0.2
0.4
0.6
0.8
1
1.2
1.4
1.6
1.8
2
2.2
0 0.2 0.4 0.6 0.8 1 1.2 1.4 1.6 1.8 2 2.2
Målt vandstand [m]
Mo
de
lle
ret v
and
stan
d [m
]
Thyborøn Havn
0
0.2
0.4
0.6
0.8
1
1.2
1.4
1.6
1.8
2
2.2
0 0.2 0.4 0.6 0.8 1 1.2 1.4 1.6 1.8 2 2.2
Målt vandstand [m]
Mo
de
lle
ret v
and
stan
d [m
]
Lemvig Havn
0
0.2
0.4
0.6
0.8
1
1.2
1.4
1.6
1.8
2
2.2
0 0.2 0.4 0.6 0.8 1 1.2 1.4 1.6 1.8 2 2.2
Målt vandstand [m]
Mo
de
lle
ret v
and
stan
d [m
]
Løgstør Havn
0
0.2
0.4
0.6
0.8
1
1.2
1.4
1.6
1.8
2
2.2
0 0.2 0.4 0.6 0.8 1 1.2 1.4 1.6 1.8 2 2.2
Målt vandstand [m]
Mo
de
lle
ret v
and
stan
d [m
]
Thisted Havn
0
0.2
0.4
0.6
0.8
1
1.2
1.4
1.6
1.8
2
2.2
0 0.2 0.4 0.6 0.8 1 1.2 1.4 1.6 1.8 2 2.2
Målt vandstand [m]
Mo
de
lle
ret v
and
stan
d [m
]
Skive Havn
0
0.2
0.4
0.6
0.8
1
1.2
1.4
1.6
1.8
2
2.2
0 0.2 0.4 0.6 0.8 1 1.2 1.4 1.6 1.8 2 2.2
Målt vandstand [m]
Mo
de
lle
ret v
and
stan
d [m
]
Nykøbing Mors
0
0.2
0.4
0.6
0.8
1
1.2
1.4
1.6
1.8
2
2.2
0 0.2 0.4 0.6 0.8 1 1.2 1.4 1.6 1.8 2 2.2
Målt vandstand [m]
Mo
de
lle
ret v
and
stan
d [m
]
Hvalpsund
0
0.2
0.4
0.6
0.8
1
1.2
1.4
1.6
1.8
2
2.2
0 0.2 0.4 0.6 0.8 1 1.2 1.4 1.6 1.8 2 2.2
Målt vandstand [m]
Mo
de
lle
ret v
and
stan
d [m
]
Rønbjerg
0
0.2
0.4
0.6
0.8
1
1.2
1.4
1.6
1.8
2
2.2
0 0.2 0.4 0.6 0.8 1 1.2 1.4 1.6 1.8 2 2.2
Målt vandstand [m]
Mo
de
lle
ret v
and
stan
d [m
]
Alle stationer
0
0.2
0.4
0.6
0.8
1
1.2
1.4
1.6
1.8
2
2.2
0 0.2 0.4 0.6 0.8 1 1.2 1.4 1.6 1.8 2 2.2
Målt vandstand [m]
Mo
de
lle
ret v
and
stan
d [m
]
Ålborg Øst

Model calibration and model verification
22 May, 2013 © DHI #21
Example: Comparison of modelled and observed water level at Lemvig

Femern Belt Link
• 20 km combined hi-speed rail and car bridge or tunnel between Denmark and Germany
• Planned completion 2021
• Very large EIA partly due to concern for Baltic ecosystem
22 May, 2013 © DHI #22

MIKE 3 Model set up for Femern Belt
Regional model
• 3-5 km, 1 m vertical
• 30+ years
Local model
• 500 m, 1 m vertical
• 1 year

Regional MIKE 3 Oceanographic Model 30 years simulation
Example of Calibration of 3D model
The model does reproduce
the major inflows of saline
water that are crucial for
the ecosystem of the Baltic
Sea

25
0.5° spatial resolution requires app. 2.7 GB RAM
0.25° spatial resolution requires app. 6 GB RAM
MIKE 21 SW Global wave prediction

26
January storm 2005
in the North Atlantic
Global wave prediction

27
Horns Rev
Offshore wind farm with 80 turbines (168 MW)
(m)
Objective (waves)
Establishment of 4 day wave forecast for planning of marine
operations (maintenance etc.)

28
Horns Rev
Atlantic model Number of elements: 8334
Maximum edge length: 1.0 degree Minimum edge length: 0.5 degree
North Sea-Baltic Sea model Number of elements: 8985 Maximum edge length:
40 km Minimum edge length: 1.5 km
(m)
(m)
29
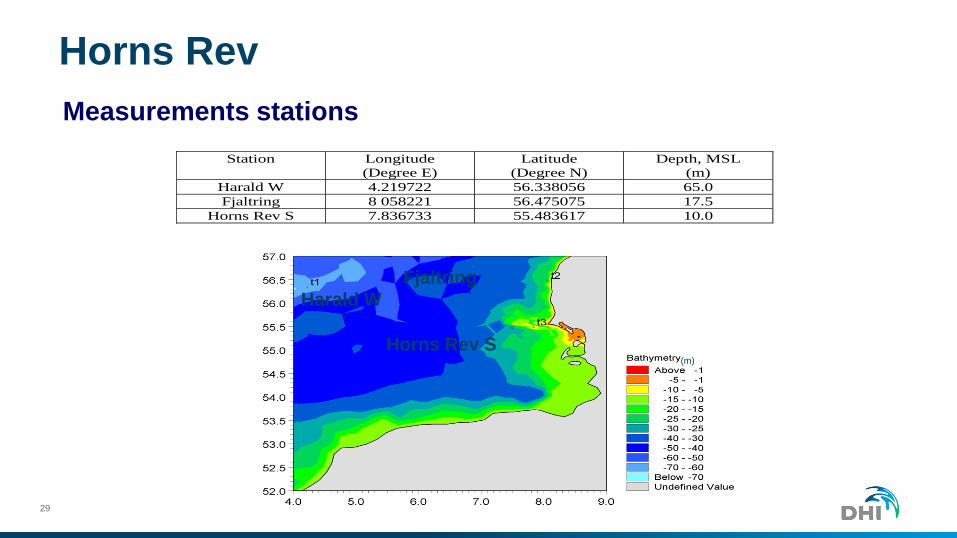
Horns Rev
Measurements stations
Horns Rev S
Harald W
Fjaltring
Station Longitude
(Degree E)
Latitude
(Degree N)
Depth, MSL
(m)
Harald W 4.219722 56.338056 65.0
Fjaltring 8 058221 56.475075 17.5
Horns Rev S 7.836733 55.483617 10.0
(m)

30
Horns Rev
Fjaltring
Wave period, T02 Significant wave height, Hm0
Horns Rev S Significant wave height, Hm0 Wave period, T02

31
Horns Rev
Horns Rev S - frequency spectrum
Fjaltring - frequency spectrum

*) Kirkwall Marine is used in the MIKE 21 BW step-by-step-guide
Kirkwall Marina, UK
• MIKE 21 Spectral Waves
• MIKE 21 Boussinesq Wave
• Physical model

Results from MIKE 21 BW Results from MIKE 21 SW*)
*) Using the DS (directionally decoupled parametric formulation) with diffraction and reflection
Kirkwall Marina
• Comparison between SW and BW

MIKE 21 Spectral Waves FM - Kirkwall Marina, UK
Comparison with measurements
Kirkwall Marina
• Comparison between BW and Lab inside harbour

Coastal flooding - two perspectives
1. Extreme events and their consequences - short term
• Wave impact on sea defense => Breaching => Hinterland inundation.
2. Long term changes in the coast’s resillience to potential extreme events
• Dune and dike stability.
• Importance of foreshore.
• Natural evolution versus anthropological activity (including climate adaptation).

Dune breaching
22 May, 2013 © DHI #36
Dune breach at Danish Westcoast 1991
Cross shore sediment transport in the surf zone
Dune erosion

Validation of dune erosion model
against results from DELTA flume (DELTARES)
Hs=1,5m Tp=4,9s
Measured dune erosion
Modelled dune erosion
during 6 hr

The dune erosion model illustrates that these narrow dunes are best
strengthened by adding sand behind the crest
Which is being done…

Comparison: dynamic simulation >< stationary analysis based on
topographic info only:
Extreme 40 hour storm event with max water level in the sea of 2.2 m ( i.e. present day extreme
event). Max flooded area to the left. Estimate based on topography to the right (2 m contour
line).

Dune overtopping
• MIKE 21 BW
• Hydrodynamics as storm
surge events
• Parameterisation of
overtopping
• Combined with Dune
erosion and sand transport
© DHI 2013

Ribe Polder flooding
• Flood Risk analysis of Polder
• Dynamic breach and flood modelling with MIKE 21
• Carried out by Danish Coastal Authority as part of
Climate Change Adaptation study

Levee breaching, Ribe
• Breaching dynamics from detailled model

Hinterland indundation
MIKE21 FM, HD – Development of breach

Hinterland indundation
MIKE21 FM, HD – Development of breach

Hinterland indundation
MIKE21 FM, HD – Development of breach
Know more ?
http://www.dhigroup.com/Aboutus/DHIAnnualReport2011/MakingKnowledgeAccessible/GuidanceOnClimateChangeAdaptation.aspx

Longterm - Hybridmodel
© DHI
• Under development !
• Combines Flow, wave and STP models for long term
morphology
• Quasi-steady flow and waves
• Morphology described in profiles
Know more ?
Kaergaard, K. and Fredsoe, J. (2013). A numerical shoreline model for shorelines with
large curvature. Coastal Engineering, Vol. 74, p. 19-32.
Kaergaard, K., Fredsoe, J. and Knudsen, S. B. (2012). Coastline undulations on the
West Coast of Denmark: Offshore extent, relation to breaker bars and transported
sediment volume. Coastal Engineering, Vol. 60, p. 109-122

Hybrid model – spit development
© DHI
Model coupling
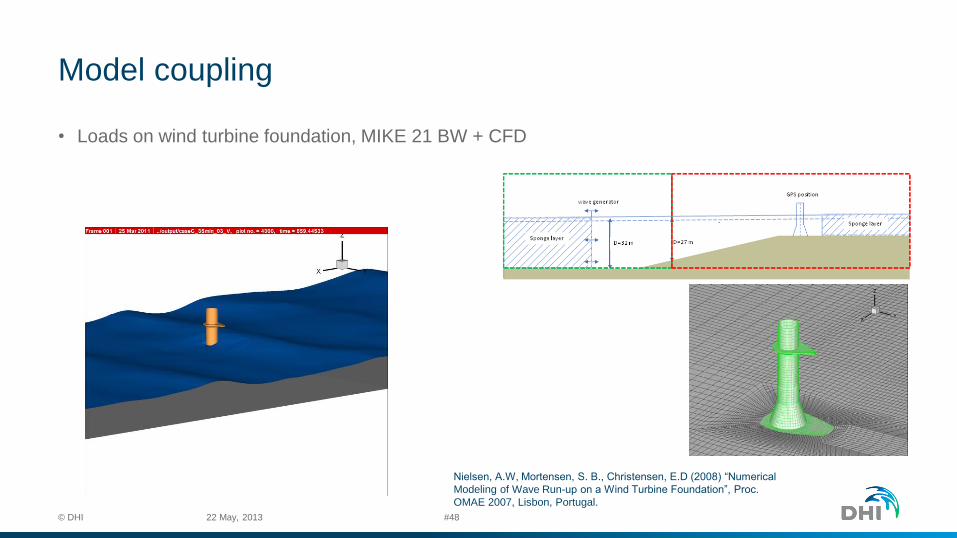
• Loads on wind turbine foundation, MIKE 21 BW + CFD
22 May, 2013 © DHI #48
Nielsen, A.W, Mortensen, S. B., Christensen, E.D (2008) “Numerical
Modeling of Wave Run-up on a Wind Turbine Foundation”, Proc.
OMAE 2007, Lisbon, Portugal.

Model coupling
• Levee overtopping using MIKE 21 BW + CFD
22 May, 2013 © DHI #49

Model coupling - Hvide Sande harbour
• Study of sand bypass using MIKE 21 HD + SW + ST
Dis
tan
ce a
lon
g s
ho
relin
e (
km
)
Shoreline evolution (m/year)
1957-2008 profile data
~400 m northern breakwater established in 1963:
• updrift accumulation up to ~3,5 km north of breakwater in total 3,600,000 m3 80.000
m3/yr
• shoreline advance ~3 m/yr 500 m to the north downdrift erosion counteracted by
nourishment of 300,000 m3/yr along 2-4 km to the south

Sedimentation in access channel
Navigation depth of 4,5 m is maintained
maintenance dredging ~170,000 m3/yr
hydraulically pumped to downdrift shore
With the present harbour layout, the natural depth of bypass bar is ~2.5 m
Yellow colour: depths between 3 and 4 m

Calibration results Bar crest elevation across the access channel during calibration period
Measured pre-storm
Measured post-storm
Modelled post-storm
Accurate reproduction of bypass bar evolution:
350 m southward migration of the bar
crest elevation along the bar from -2.5 to -3.5 m

The Limfjord model anno 2012
Key problems in Thyboron Harbour after 2004:
• Larger waves in the entry area
• Navigation
• Overtopping
• Wave disturbance in the harbour
• Sedimentation causing reduced depth
in the harbour entry area
Thyborøn
Harbour
Limfjord
Thyborøn
Channel
North Sea
http://www.youtube.com/watch?v=wPRQDpXHj6w

The Limfjord
• Since 2004 increasing overtopping at outer breakwater in Thyborøn Harbour
• Possible cause in morphological active entrance channel
• Approach
• Model sediment dynamics in entrance using HD + SW + ST
• Model wave activity using Boussinesque model (MIKE 21 BW)
22 May, 2013 © DHI #54
Thyborøn
Harbour
Limfjord
Thyborøn
Channel
North Sea
Niemann, S.L., Sloth, P., Buhl, J., Deigaard, R. and
Brøker, I. Thyborøn Harbour - Study of Wave
Agitation and Sedimentation. ICCE No 32 (2010):
Proceedings of the 32nd Conference on Coastal
Engineering, Shanghai, China, 2010.

Historical benchmark for Danish Coastal Engineers
Limfjord
Before 1862: The shoreline was located
more than 1500m further
offshore and there was no connection
between the North Sea
and the Limfjord
1862: Large breach occurred
1875-1930’ies: A large
groyne system were constructed
along the 22 km barrier
Today: Coastline is mitigated by
nourishment of about 750000 m3/year
North
Sea

Change in bathymetry have changed the wave conditions
2004 2008 Reduced
depth
Reduced
depth and
increased
bed slope
Erosion,
steeper beach

Impact on waves of 400.000 m3 excavation 2008 After excavation
Hs decreases
to 50-70%
Hs increases
by 10-50%

Summary
• Model have developed since 1960 and we have been
able to make use of this
• Model and data should be an integrated entity