Embed Size (px)
Citation preview

PACKAGING INSIDEROctober 2018
Packaging Sector HeadsIntroducing Clairfield International
Clairfield International is the leading M&A advisorfor crossborder midmarket transactions.
We provide top-notch advice to family businesses,multinational corporations and financial investorson mergers, acquisitions, and sales as well asadditional corporate finance services:
• Mergers & acquisitions• Strategic advisory• Capital markets advisory• Family business advisory
Contents
CONTACTFor additional information, contactSilverio [email protected]
Packaging Industry Expertise
Our team offers unique expertise in local and globalpackaging markets. We have direct contacts tomany of the leading packaging companies aroundthe world, thereby facilitating access to relevantdeal flow for acquisitive groups and private equityinvestors.
We have completed transactions for clients in the following segments of the packaging industry:
• Closures• Flexibles• Containers (plastic, metal)• Cartons• Labels• Machinery
Packaging is a vast and highly technical industry. Weunderstand the product/application/client profileof your business and recommend the bestindustrial and commercial fit to maximize value.
Silverio Davoli - [email protected]
International packaging industryexpert with both multinational andlocal clients.
Section 1:Market Comparables1.1. Rigid containers and closures page 21.2. Flexible packaging page 61.3. Paper and board page 101.4. Packaging machinery page 14
Section 2:Selected Clairfield International packaging transactions page 18
Oliver Le Grelle - [email protected]
Expert in packaging for the luxurymarket; perfumes, cosmetics, wines &spirits, pharmaceuticals.
Olivier began his career in the packaging industrywith various management positions, including inthe packaging division of Saint Gobain and AlcoaCSI. In 2006, he oversaw the acquisition of a labelcompany. He completed two more acquisitions inperfumery and industrial packaging. He thendeveloped M&A advisory business with Financièrede l’Epervier and Financière de Courcelles, closingseveral transactions.
Silverio began his career at Credit Suisse FirstBoston and Merrill Lynch in London. In 1989 hemoved to Italy and closed his first M&A deal forthe packaging industry. In 2005 he became theworldwide Packaging Sector Team Leader for anM&A network, coordinating all marketing actionsand buyer/target searches worldwide. Under hisdirection, the team closed an average of 2-3packaging transactions per year.
1

PACKAGING INSIDEROctober 2018
Margins
Company Country Revenue EBITDA EBIT EBITDA EBIT
AptarGroup, Inc. United States 2,664.2 519.8 360.0 19.5% 13.5%
Ball Corporation United States 11,550.0 1,993.0 1,283.0 17.3% 11.1%
CCL Industries Inc. Canada 3,883.5 790.2 577.6 20.3% 14.9%
Cristalerias de Chile S.A. Chile 466.7 90.9 59.5 19.5% 12.8%
Crown Holdings Inc. United States 9,887.0 1,425.0 1,120.0 14.4% 11.3%
Greif Inc. United States 3,854.2 493.5 365.9 12.8% 9.5%
Kian Joo Can Factory Bhd Malaysia 451.6 43.4 23.0 9.6% 5.1%
Myers Industries Inc. United States 556.2 71.4 46.0 12.8% 8.3%
Nihon Yamamura Glass Co. Ltd. Japan 637.7 41.5 2.4 6.5% 0.4%
Owens-Illinois, Inc. United States 7,011.0 1,189.0 740.0 17.0% 10.6%
PSB Industries SA France 419.1 48.8 26.2 11.6% 6.3%
Resilux NV Belgium 370.7 38.4 20.7 10.4% 5.6%
RPC Group plc (1)United Kingdom 4,966.3 761.0 474.8 15.3% 9.6%
Silgan Holdings Inc. United States 4,334.0 595.5 406.9 13.7% 9.4%
Toyo Seikan Kaisha Ltd. Japan 7,124.1 715.2 274.7 10.0% 3.9%
UFP Technologies Inc. United States 164.9 20.4 13.7 12.4% 8.3%
Vetropack Holding AG Switzerland 691.3 150.0 76.4 21.7% 11.1%
Vidrala SA Spain 1,076.8 259.2 157.8 24.1% 14.7%
Vitro SA de CV Mexico 2,215.8 400.8 278.7 18.1% 12.6%
Winpak Ltd. Canada 887.3 196.7 156.0 22.2% 17.6%
Median 14.9% 10.1%
Mean 15.5% 9.8%
Adjusted Mean (1) 15.4% 10.0%
*All LTM Figures are as Latest Completed Period
Source: Factset
(1) Top and Bottom 10% of data set is excluded from adjusted mean calculation
Latest Twelve Months
1. Market Comparables
1.1. Rigid containers and closures – listed comparables
(US$ in millions)
2

PACKAGING INSIDEROctober 2018
1. Market Comparables
1.1. Rigid containers and closures – listed comparables (Con’t)
(US$ in millions)
3
Market Enterprise Price / Debt /
Company Cap* Value*** Revenue EBITDA EBIT Earnings EBITDA
AptarGroup, Inc. 6,574.0 7,110.2 2.67x 13.7x 19.7x 25.3x 1.0x
Ball Corporation 15,723.6 22,619.6 1.96x 11.3x 17.6x 36.0x 3.4x
CCL Industries Inc. 7,814.1 9,221.0 2.37x 11.7x 16.0x 21.5x 1.8x
Cristalerias de Chile S.A. 559.4 819.6 1.76x 9.0x 13.8x 14.3x 1.8x
Crown Holdings Inc. 6,591.7 15,997.7 1.62x 11.2x 14.3x 23.6x 6.4x
Greif Inc. 2,454.2 3,479.1 0.90x 7.0x 9.5x 27.6x 1.9x
Kian Joo Can Factory Bhd 248.1 419.6 0.93x 9.7x 18.2x 14.8x 3.3x
Myers Industries Inc. 602.7 642.4 1.16x 9.0x 14.0x 23.8x 0.6x
Nihon Yamamura Glass Co. Ltd. 176.2 319.1 0.50x 7.7x 130.4x 152.4x 3.4x
Owens-Illinois, Inc. 3,005.0 8,429.0 1.20x 7.1x 11.4x 20.3x 4.5x
PSB Industries SA 201.0 203.7 0.49x 4.2x 7.8x 15.9x 0.1x
Resilux NV 322.4 332.2 0.90x 8.6x 16.1x 18.4x 0.3x
RPC Group plc 4,293.8 5,902.0 1.19x 7.8x 12.4x 16.0x 2.1x
Silgan Holdings Inc. 2,997.7 5,779.2 1.33x 9.7x 14.2x 12.1x 4.7x
Toyo Seikan Kaisha Ltd. 4,322.1 4,950.0 0.69x 6.9x 18.0x 30.6x 0.5x
UFP Technologies Inc. 261.5 295.2 1.79x 14.4x 21.5x 22.1x 1.6x
Vetropack Holding AG 526.7 472.9 0.68x 3.2x 6.2x 19.2x -0.4x
Vidrala SA 2,159.3 2,708.7 2.52x 10.5x 17.2x 23.4x 2.1x
Vitro SA de CV 1,368.1 1,929.1 0.87x 4.8x 6.9x 9.3x 1.4
Winpak Ltd. 2,288.2 1,994.7 2.25x 10.1x 12.8x 19.6x -1.6
Summary Statistics Summary Statistics
Median 1.20x 9.0x 14.2x 20.9x 1.8x
Mean 1.39x 8.9x 19.9x 27.3x 1.9x
Adjusted Mean (1) 1.35x 8.9x 14.6x 21.0x 1.9x
*Market Cap is as of Latest Available
**Net Debt and Minorities Interests are all latest available LTM figures
***EV is calculated as sum of the previous figures.
Source: Factset
(1) Top and Bottom 10% of data set is excluded from adjusted mean calculation
Enterprise Value / LTM

PACKAGING INSIDEROctober 2018
Company Dec-17 Dec-16 Dec-15 Dec-14 Dec-13 Dec-12 Dec-11 Dec-17 Dec-16 Dec-15 Dec-14 Dec-13 Dec-12 Dec-11
AptarGroup, Inc. 19.5% 20.3% 19.7% 17.7% 17.7% 17.5% 18.0% 13.7x 10.8x 10.5x 9.9x 10.8x 8.3x 8.3x
Ball Corporation 17.3% 14.8% 13.6% 14.0% 13.9% 13.5% 13.5% 11.3x 16.5x 11.9x 10.3x 9.5x 8.9x 7.9x
CCL Industries Inc. 20.3% 19.0% 20.0% 18.6% 17.9% 19.5% 18.8% 11.7x 14.4x 14.4x 10.3x 10.2x 6.3x 5.6x
Cristalerias de Chile S.A. 19.5% 21.5% 21.2% 22.1% 20.5% 19.0% 21.0% 9.0x 7.8x 6.8x 7.1x 9.0x 8.6x 6.6x
Crown Holdings Inc. 14.4% 15.9% 14.3% 12.9% 12.1% 12.7% 13.1% 11.2x 9.3x 10.5x 10.8x 9.7x 8.6x 7.7x
Greif Inc. 12.8% 13.1% 11.1% 11.1% 12.2% 11.5% 12.2% 7.0x 8.8x 7.2x 7.6x 7.8x 7.7x 7.2x
Kian Joo Can Factory Bhd 9.6% 14.0% 14.7% 13.8% 15.4% 16.9% 16.8% 9.7x 7.7x 6.9x 7.7x 7.1x 6.7x 5.8x
Myers Industries Inc. 12.8% 10.6% 10.5% 9.5% 11.6% 12.2% 9.8% 9.0x 10.5x 9.0x 9.6x 8.5x 7.5x 6.7x
Nihon Yamamura Glass Co. Ltd. 6.5% 8.9% 5.4% 2.9% 4.1% 7.2% 8.7% 7.7x 5.0x 6.8x 11.4x 7.8x 6.0x 4.3x
Owens-Illinois, Inc. 17.0% 15.8% 15.2% 14.9% 16.0% 16.5% 15.9% 7.1x 6.8x 9.1x 6.5x 7.9x 5.7x 5.6x
PSB Industries SA 11.6% 12.6% 15.1% 15.5% 14.8% 13.6% 15.5% 4.2x 6.2x 6.1x 5.5x 5.6x 4.9x 4.1x
Resilux NV 10.4% 12.0% 12.9% 11.4% 10.2% 8.8% 9.6% 8.6x 4.6x 11.2x 9.3x 9.4x 6.9x 5.2x
RPC Group plc (1)15.3% 14.3% 13.5% 12.9% 12.1% 12.8% 11.0% 7.8x 14.8x 13.6x 8.7x 9.7x 6.2x 7.6x
Silgan Holdings Inc. 13.7% 12.8% 12.7% 13.4% 13.7% 14.0% 13.7% 9.7x 9.9x 10.3x 9.9x 9.3x 9.0x 8.4x
Toyo Seikan Kaisha Ltd. 10.0% 11.3% 9.8% 6.6% 10.5% 8.0% 9.2% 6.9x 5.9x 8.2x 5.9x 8.1x 4.9x 2.7x
UFP Technologies Inc. 12.4% 11.1% 13.2% 12.5% 15.4% 15.0% 13.9% 14.4x 9.0x 8.1x 7.3x 7.0x 4.9x 4.1x
Vetropack Holding AG 21.7% 17.2% 18.3% 17.5% 19.7% 19.6% 22.4% 3.2x 6.2x 6.3x 5.3x 6.8x 6.3x 5.0x
Vidrala SA 24.1% 21.7% 19.6% 22.9% 23.9% 23.0% 23.9% 10.5x 9.5x 12.6x 9.8x 9.6x 6.6x 7.0x
Vitro SA de CV 18.1% 23.9% 21.2% 13.6% 21.4% 16.9% 19.4% 4.8x 5.8x 3.1x 7.1x NM 4.2x 7.4x
Winpak Ltd. 22.2% 23.6% 22.8% 19.1% 18.6% 19.2% 18.9% 10.1x 10.8x 11.5x 12.7x 9.6x 6.9x 5.8x
Summary Statistics
Median 14.9% 14.5% 14.5% 13.7% 15.1% 14.5% 14.7% 9.0x 8.9x 9.0x 9.0x 9.0x 6.7x 6.2x
Mean 15.5% 15.7% 15.2% 14.1% 15.1% 14.9% 15.3% 8.9x 9.0x 9.2x 8.6x 8.6x 6.8x 6.1x
Adjusted Mean (1) 15.4% 15.5% 15.3% 14.3% 15.1% 15.0% 15.1% 8.9x 8.7x 9.2x 8.6x 8.7x 6.8x 6.2x
All figures are LTM.
Source: Factset
(1) Top and Bottom 10% of data set is excluded from adjusted mean calculation
Enterprise Value / EBITDAEBITDA/Margins
1. Market Comparables
1.1. Rigid containers and closures – historical comparable trends
(US$ in millions)
4

PACKAGING INSIDEROctober 2018
Date Target Country Acquirer Country EV Revenues EBITDA EBIT
Sep-18 Holzverpackung Huefingen
GmbH und Co. KG
Germany PILOUS spol. s r.o. Czech Republic NA NA NA NA
Sep-18 BEWi Polar AS Norway BEWiSynbra Group AB
(Publ)
Sweden NA 16.1 1.9 0.8
Sep-18 BeWi Produkter AS Norway BEWiSynbra Group AB
(Publ)
Sweden NA 34.4 4.5 2.7
Aug-18 Industria Vidreira do Nordeste
Ltda.
Brazil Vidroporto S/A Brazil 38.0 NA NA NA
Aug-18 LUMSON S.p.A (35% Stake) Italy FSI SGR S.p.A. Italy NA NA NA NA
Jul-18 Lamiflex AB Sweden Priveq Investment Sweden NA NA NA NA
Jul-18 ARGO S.A. Greece ALPLA Werke Alwin Lehner
GmbH & Co KG
Austria NA NA NA NA
Jul-18 CSP Technologies, Inc. USA AptarGroup, Inc. USA 476.5 116.7 NA NA
Jul-18 Valery Glass s.r.l. Italy Vetroelite S.p.A. Italy NA 30.0 NA NA
Jun-18 CGL Pack Annecy S.A.S. France Faerch Plast A/S Denmark 81.5 48.0 NA NA
Jun-18 Induplast SpA Italy Europe Capital Partners VI Luxembourg NA 14.0 NA NA
Jun-18 Compositub, S.A. Spain Sonoco Iberia, S.L. Spain 8.6 6.6 NA NA
1. Market Comparables
1.1. Rigid containers and closures – M&A transactions
(€ in millions)
5
Source: MergerMarket , October 2018

PACKAGING INSIDEROctober 2018
Margins
Company Country Revenue EBITDA EBIT EBITDA EBIT
Amcor Ltd. Australia 9,319.1 1,365.1 1,008.0 14.6% 10.8%
Avery Dennison Corporation United States 7,045.4 962.1 784.9 13.7% 11.1%
Bemis Co. Inc. United States 4,099.4 551.0 380.5 13.4% 9.3%
Brødrene Hartmann A/S Denmark 365.5 66.4 44.6 18.2% 12.2%
Intertape Polymer Group Inc. Canada 968.9 134.5 94.9 13.9% 9.8%
Sealed Air Corp. United States 4,645.3 847.8 716.2 18.3% 15.4%
Tredegar Corp. United States 1,015.4 98.3 60.1 9.7% 5.9%
Median 13.9% 10.8%
Mean 14.5% 10.7%
Adjusted Mean (1) 14.5% 10.7%
*All LTM Figures are as of Latest Completed Period
Source: Factset
(1) Top and Bottom 10% of data set is excluded from adjusted mean calculation
Astrapak went private. Acquisition (still pendind) by RPC Group Plc.
LTM - Latest Completed Period
1. Market Comparables
1.2. Flexible packaging – listed comparables
(US$ in millions)
6

PACKAGING INSIDEROctober 2018
1. Market Comparables
1.2. Flexible packaging – listed comparables (con’t)
(US$ in millions)
7
Market Enterprise Enterprise Value / ANN Price / Debt /
Company Cap* Value*** Revenue EBITDA EBIT Earnings EBITDA
Amcor Ltd. 10,779.3 16,101.1 1.73x 11.8x 16.0x 17.8x 3.9x
Avery Dennison Corporation 9,154.4 10,590.3 1.50x 11.0x 13.5x 36.7x 1.5x
Bemis Co. Inc. 4,091.1 5,559.0 1.36x 10.1x 14.6x 46.9x 2.7x
Brødrene Hartmann A/S 353.3 993.8 2.72x 15.0x 22.3x 18.2x 9.6x
Intertape Polymer Group Inc. 861.6 1,197.7 1.24x 8.9x 12.6x 15.2x 2.4x
Sealed Air Corp. 5,955.4 9,111.0 1.96x 10.7x 12.7x 55.0x 3.7x
Tredegar Corp. 689.7 750.4 0.74x 7.6x 12.5x 16.6x 0.6x
Summary Multiples & Statistics Summary Multiples & Statistics
Median 1.50x 10.7x 13.5x 18.2x 2.7x
Mean 1.61x 10.7x 14.9x 29.5x 3.5x
Adjusted Mean (1) 1.61x 10.7x 14.9x 29.5x 3.5x
*Market Cap is as of Latest Available
**Net Debt and Minorities Interests are all latest available LTM figures
***EV is calculated as sum of the previous figures.
Source: Factset
(1) Top and Bottom 10% of data set is excluded from adjusted mean calculation

PACKAGING INSIDEROctober 2018
1. Market Comparables
1.2. Flexible packaging – historical comparable trends
(US$ in millions)
8
Summary multiples & statistics
Company Dec-17 Dec-16 Dec-15 Dec-14 Dec-13 Dec-12 Dec-11 Dec-17 Dec-16 Dec-15 Dec-14 Dec-13 Dec-12 Dec-11
Amcor Ltd. 15.5% 14.0% 14.2% 14.0% 13.8% 11.4% 9.6% 12.3x 12.0x 10.8x 12.9x 11.8x 10.5x 9.6x
Avery Dennison Corporation 13.9% 10.5% 12.0% 10.5% 10.9% 9.7% 9.4% 11.6x 10.4x 9.5x 8.4x 8.2x 7.8x 6.3x
Bemis Co. Inc. 13.1% 13.6% 14.2% 13.6% 12.8% 12.4% 11.9% 10.1x 10.0x 9.6x 9.4x 8.8x 7.8x 7.1x
Brødrene Hartmann A/S 15.9% 14.6% 15.3% 14.6% 14.3% 13.0% 14.0% 19.6x 8.2x 7.4x 6.8x 5.9x 4.5x 4.5x
Intertape Polymer Group Inc. 13.3% 11.8% 12.8% 11.8% 12.5% 10.7% 7.8% 9.6x 13.1x 10.3x 11.3x 10.0x 8.0x 6.7x
Sealed Air Corp. 16.4% 12.9% 15.0% 12.9% 12.9% 12.6% 13.2% 13.6x 12.1x 11.8x 12.5x 10.5x 8.2x 5.6x
Tredegar Corp. 10.2% 10.4% 9.7% 10.4% 10.5% 11.6% 11.3% 7.9x 10.4x 6.5x 8.1x 10.2x 6.7x 6.6x
EBITDA Margins Enterprise Value / EBITDA
Median 13.9% 12.9% 14.2% 12.9% 12.8% 11.6% 11.3% 11.6x 10.4x 9.6x 9.4x 10.0x 7.8x 6.6x
Mean 14.0% 12.5% 13.3% 12.5% 12.5% 11.6% 11.0% 12.1x 10.9x 9.4x 9.9x 9.3x 7.6x 6.6x
Adjusted Mean (1) 14.0% 12.5% 13.3% 12.5% 12.5% 11.6% 11.0% 12.1x 10.9x 9.4x 9.9x 9.3x 7.6x 6.6x
Company Dec-17 Dec-16 Dec-15 Dec-14 Dec-13 Dec-12 Dec-11 Dec-17 Dec-16 Dec-15 Dec-14 Dec-13 Dec-12 Dec-11
Amcor Ltd. 14.6% 14.0% 14.2% 14.0% 13.8% 11.4% 9.6% 11.8x 12.0x 10.8x 12.9x 11.8x 10.5x 9.6x
Avery Dennison Corporation 13.7% 10.5% 12.0% 10.5% 10.9% 9.7% 9.4% 11.0x 10.4x 9.5x 8.4x 8.2x 7.8x 6.3x
Bemis Co. Inc. 13.4% 13.6% 14.2% 13.6% 12.8% 12.4% 11.9% 10.1x 10.0x 9.6x 9.4x 8.8x 7.8x 7.1x
Brødrene Hartmann A/S 18.2% 14.6% 15.3% 14.6% 14.3% 13.0% 14.0% 15.0x 8.2x 7.4x 6.8x 5.9x 4.5x 4.5x
Intertape Polymer Group Inc. 13.9% 11.8% 12.8% 11.8% 12.5% 10.7% 7.8% 8.9x 13.1x 10.3x 11.3x 10.0x 8.0x 6.7x
Sealed Air Corp. 18.3% 12.9% 15.0% 12.9% 12.9% 12.6% 13.2% 10.7x 12.1x 11.8x 12.5x 10.5x 8.2x 5.6x
Tredegar Corp. 9.7% 10.4% 9.7% 10.4% 10.5% 11.6% 11.3% 7.6x 10.4x 6.5x 8.1x 10.2x 6.7x 6.6x
Summary Multiples & Statistics
Median 13.9% 12.9% 14.2% 12.9% 12.8% 11.6% 11.3% 10.7x 10.4x 9.6x 9.4x 10.0x 7.8x 6.6x
Mean 14.5% 12.5% 13.3% 12.5% 12.5% 11.6% 11.0% 10.7x 10.9x 9.4x 9.9x 9.3x 7.6x 6.6x
Adjusted Mean (1) 14.5% 12.5% 13.3% 12.5% 12.5% 11.6% 11.0% 10.7x 10.9x 9.4x 9.9x 9.3x 7.6x 6.6x
All figures are LTM.
Source: Factset
(1) Top and Bottom 10% of data set is excluded from adjusted mean calculation
EBITDA Margins Enterprise Value / EBITDA

PACKAGING INSIDEROctober 2018
1. Market Comparables
1.2. Flexible packaging – M&A transactions
(€ in millions)
9
Source: MergerMarket , October 2018
Date Target Country Acquirer Country EV Revenues EBITDA EBIT
Sep-18 Intelipac Ltd UK TPBI Public Company
Limited
Thailand 13.1 NA NA NA
Aug-18 Valley Packaging Supply
Company, Inc.
USA JZ Capital Partners Limited;
Advanced Converting Works
Holdings, LLC
USA; UK 7.3 NA NA NA
Jul-18 Elif Holding A.S Turkey Turkven Private Equity Turkey NA NA NA NA
Jun-18 Finnco Iberflex Papeis LdA Portugal Grupo Finnco, Sgps, S.A. Portugal NA NA NA NA

PACKAGING INSIDEROctober 2018
Margins
Company Country Revenue EBITDA EBIT EBITDA EBIT
Bio-Pappel SAB Mexico 1,264.2 187.7 133.3 14.8% 10.5%
Cascades, Inc. Canada 3,512.8 355.9 178.7 10.1% 5.1%
DS Smith plc. (1)United Kingdom 7,703.6 931.4 582.6 12.1% 7.6%
Graphic Packaging Holding Company United States 5,232.8 825.4 424.2 15.8% 8.1%
Huhtamaki Oyj Finland 3,563.4 429.0 282.7 12.0% 7.9%
Mayr-Melnhof Karton AG Austria 2,810.6 374.2 250.1 13.3% 8.9%
Mondi plc United Kingdom 8,626.7 2,242.2 1,728.7 26.0% 20.0%
Nampak Ltd. (2) (4)South Africa 1,410.4 209.2 156.0 14.8% 11.1%
Packaging Corp. of America United States 6,782.5 1,416.2 1,004.3 20.9% 14.8%
Rengo Co. Ltd. Japan 5,611.7 491.3 193.4 8.8% 3.4%
Smurfit Kappa Group plc Ireland 9,657.4 1,378.3 929.4 14.3% 9.6%
Sonoco Products Co. United States 5,285.2 716.8 483.8 13.6% 9.2%
WestRock United States 16,109.2 2,509.2 1,264.4 15.6% 7.8%
Median 14.3% 8.9%
Mean 14.8% 9.5%
Adjusted Mean (1) 14.2% 8.7%
*All LTM Figures are as Latest Completed Period
Source: Factset
(1) Top and Bottom 10% of data set is excluded from adjusted mean calculation
Latest Twelve Months
1. Market Comparables
1.3. Paper and board – listed comparables
(US$ in millions)
10

PACKAGING INSIDEROctober 2018
Market Enterprise Enterprise Value / LTM Price / Debt /
Company Cap* Value*** Revenue EBITDA EBIT Earnings EBITDA
Bio-Pappel SAB 292.2 663.3 0.5x 3.5x 5.0x 6.5x 2.0x
Cascades, Inc. 815.4 2,137.3 0.6x 6.0x 12.0x 2.5x 3.4x
DS Smith plc. 7,423.8 9,311.2 1.2x 10.0x 16.0x 25.5x 2.0x
Graphic Packaging Holding Company (2) 3,913.4 7,581.3 1.4x 9.2x 17.9x 16.1x 3.5x
Huhtamaki Oyj 3,262.4 4,313.0 1.2x 10.1x 15.3x 18.8x 2.3x
Mayr-Melnhof Karton AG 2,504.4 2,524.8 0.9x 6.7x 10.1x 15.8x 0.0x
Mondi plc 8,851.7 10,818.9 1.3x 4.8x 6.3x 15.9x 0.7x
Nampak Ltd. 691.4 1,128.3 0.8x 5.4x 7.2x n.a. 2.0x
Packaging Corp. of America 8,348.0 10,650.2 1.6x 7.5x 10.6x 17.0x 1.6x
Rengo Co. Ltd. 2,221.8 4,562.6 0.8x 9.3x 23.6x 13.7x 4.6x
Smurfit Kappa Group plc 8,016.1 11,546.4 1.2x 8.4x 12.4x 15.9x 2.4x
Sonoco Products Co. 5,160.4 6,437.1 1.2x 9.0x 13.3x 30.5x 1.7x
WestRock 10,804.0 16,912.8 1.0x 6.7x 13.4x n.a. 2.4x
Summary Statistics Summary Statistics
Median 1.2x 7.5x 12.4x # 15.9x 2.0x
Mean 1.1x 7.4x 12.5x # 16.2x 2.2x
Adjusted Mean (1) 1.2x 7.5x 12.6x # 16.0x 2.1x
*Market Cap is as of Latest Available
**Net Debt and Minorities Interests are all latest available LTM figures
***EV is calculated as sum of the previous figures.
Source: Factset
(1) Top and Bottom 10% of data set is excluded from adjusted mean calculation
1. Market Comparables
1.3. Paper and board – listed comparables (Con’t)
(US$ in millions)
11

PACKAGING INSIDEROctober 2018
Company Dec-17 Dec-16 Dec-15 Dec-14 Dec-13 Dec-12 Dec-17 Dec-16 Dec-15 Dec-14 Dec-13 Dec-12
Bio-Pappel SAB 15.2% 17% 15.0% 15.0% 15.1% 11.8% 3.5x 3.7x 4.5x 5.2x 6.1x 4.3x
Cascades, Inc. 10.1% 9.8% 10.5% 9.3% 9.8% 7.9% 6.0x 6.3x 7.2x 6.8x 7.5x 7.0x
DS Smith plc. 12.1% 12.3% 11.9% 11.2% 9.9% 10.4% 10.0x 9.2x 10.5x 8.6x 9.4x 9.8x
Graphic Packaging Holding Company 15.8% 17.2% 17.4% 16.4% 14.0% 14.2% 9.2x 8.3x 8.4x 9.6x 8.5x 6.7x
Huhtamaki Oyj 12.0% 13.1% 12.2% 10.9% 11.1% 10.3% 10.1x 11.4x 13.6x 10.3x 9.9x 7.0x
Mayr-Melnhof Karton AG 13.3% 13.5% 13.1% 12.9% 12.0% 12.7% 6.7x 6.9x 7.8x 6.6x 7.0x 5.9x
Mondi plc 26.0% 19.4% 18.7% 16.9% 16.1% 15.1% 4.8x 8.6x 9.3x 8.0x 8.1x 6.8x
Nampak Ltd. 14.8% 11.2% 15.5% 14.3% 15.2% 14.8% 5.4x 7.9x 8.7x 12.6x 10.0x 8.2x
Packaging Corp. of America 20.9% 20.0% 19.3% 18.5% 20.7% 18.4% 7.5x 9.2x 7.3x 8.9x 10.3x 9.0x
Rengo Co. Ltd. 8.8% 10.3% 8.2% 6.9% 8.9% 10.6% 9.3x 7.2x 9.2x 9.8x 7.6x 6.3x
Smurfit Kappa Group plc 14.3% 14.6% 13.8% 13.6% 12.7% 12.1% 8.4x 6.9x 7.7x 6.7x 7.3x 5.1x
Sonoco Products Co. 13.6% 13.4% 12.4% 12.1% 11.8% 12.0% 9.0x 9.4x 8.1x 8.6x 8.6x 6.9x
WestRock 15.6% n.a. n.a. n.a. n.a. n.a. 6.7x n.a. n.a. n.a. n.a. n.a.
Summary Statistics
Median 14% 13% 13% 13% 12% 12% 7.5x 8.1x 8.3x 8.6x 8.3x 6.9x
Mean 14.8% 14.3% 14.0% 13.1% 13.1% 12.5% 7.4x 7.9x 8.5x 8.5x 8.4x 6.9x
Adjusted Mean (1) 14.2% 13.4% 13.5% 13.2% 12.4% 12.1% 7.5x 8.1x 8.3x 8.6x 8.3x 6.9x
All figures are LTM.
Source: Factset
(1) Top and Bottom 10% of data set is excluded from adjusted mean calculation
EBITDA Margins Enterprise Value / EBITDA
1. Market Comparables
1.3. Paper and Board – Historical Comparable trends
(US$ in millions)
12

PACKAGING INSIDEROctober 2018
1. Market Comparables
1.3. Paper and board – M&A transactions(€ in millions)
13
Source: MergerMarket , October 2017
Date Target Country Acquirer Country EV Revenues EBITDA EBIT
Sep-18 Northern Paper Board Limited UK SOLIDUS SOLUTIONS
Holding B.V.
Netherlands NA NA NA NA
Aug-18 Gaster Wellpappe GmbH &
Co. KG
Germany De Jong Verpakking B.V. Netherlands NA NA NA NA
Aug-18 RPC Letica Corporation
(Foodservice business)
USA Graphic Packaging Holding
Company
USA 81.2 NA NA NA
Jul-18 Barcelona Cartonboard S.A.U. Spain Reno De Medici S.p.A. Italy 46.4 122.3 5.1 NA
Jul-18 Carton Pack Srl (80% Stake) Italy 21 Partners S.p.A. Italy NA 80.0 10.7 NA
Jun-18 The Cardboard Box Company
Ltd.
UK Logson Limited UK NA 18.0 2.2 1.5
Jun-18 Interpack S.p.a. Italy GPACK S.p.a. Italy NA 4.0 NA NA
Jun-18 NorPaper Avot-Vallee France Gemayel Freres & Chaoui
Industriel Group
Lebanon NA NA NA NA
Jun-18 Papeles y Cartones de
Europa SA
Spain DS Smith Plc UK 1800.9 868.2 158.0 106.5
Jun-18 Smurfit Kappa Baden Karton
GmbH
Germany LIVIA Corporate
Development SE
Germany NA 100.0 NA NA
PACKAGING INSIDEROctober 2018
1. Market Comparables
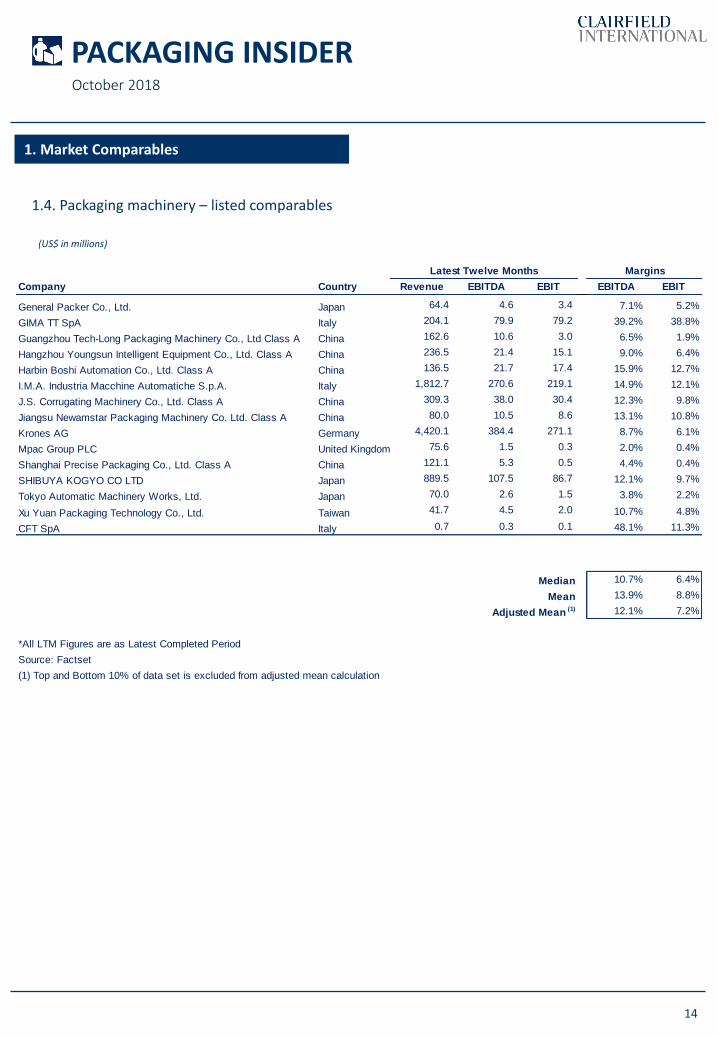
1.4. Packaging machinery – listed comparables
(US$ in millions)
14
Margins
Company Country Revenue EBITDA EBIT EBITDA EBIT
General Packer Co., Ltd. Japan 64.4 4.6 3.4 7.1% 5.2%
GIMA TT SpA Italy 204.1 79.9 79.2 39.2% 38.8%
Guangzhou Tech-Long Packaging Machinery Co., Ltd Class A China 162.6 10.6 3.0 6.5% 1.9%
Hangzhou Youngsun Intelligent Equipment Co., Ltd. Class A China 236.5 21.4 15.1 9.0% 6.4%
Harbin Boshi Automation Co., Ltd. Class A China 136.5 21.7 17.4 15.9% 12.7%
I.M.A. Industria Macchine Automatiche S.p.A. Italy 1,812.7 270.6 219.1 14.9% 12.1%
J.S. Corrugating Machinery Co., Ltd. Class A China 309.3 38.0 30.4 12.3% 9.8%
Jiangsu Newamstar Packaging Machinery Co. Ltd. Class A China 80.0 10.5 8.6 13.1% 10.8%
Krones AG Germany 4,420.1 384.4 271.1 8.7% 6.1%
Mpac Group PLC United Kingdom 75.6 1.5 0.3 2.0% 0.4%
Shanghai Precise Packaging Co., Ltd. Class A China 121.1 5.3 0.5 4.4% 0.4%
SHIBUYA KOGYO CO LTD Japan 889.5 107.5 86.7 12.1% 9.7%
Tokyo Automatic Machinery Works, Ltd. Japan 70.0 2.6 1.5 3.8% 2.2%
Xu Yuan Packaging Technology Co., Ltd. Taiwan 41.7 4.5 2.0 10.7% 4.8%
CFT SpA Italy 0.7 0.3 0.1 48.1% 11.3%
Median 10.7% 6.4%
Mean 13.9% 8.8%
Adjusted Mean (1) 12.1% 7.2%
*All LTM Figures are as Latest Completed Period
Source: Factset
(1) Top and Bottom 10% of data set is excluded from adjusted mean calculation
Latest Twelve Months

PACKAGING INSIDEROctober 2018
Market Enterprise Price / Debt /
Company Cap* Value*** Revenue EBITDA EBIT Earnings EBITDA
General Packer Co., Ltd. 30.7 NA NA NA NA 14.1x -1.5x
GIMA TT SpA 974.9 950.2 4.66x 11.9x 12.0x 33.2x -0.3x
Guangzhou Tech-Long Packaging Machinery Co., Ltd Class A 166.3 184.8 1.14x 17.4x 60.6x 97.3x 1.7x
Hangzhou Youngsun Intelligent Equipment Co., Ltd. Class A 426.9 488.7 2.07x 22.8x 32.4x 55.0x 2.8x
Harbin Boshi Automation Co., Ltd. Class A 760.8 675.7 4.95x 31.1x 38.9x 51.8x -4.4x
I.M.A. Industria Macchine Automatiche S.p.A. 2,927.1 3,225.7 1.78x 11.9x 14.7x 31.1x 1.0x
J.S. Corrugating Machinery Co., Ltd. Class A 597.6 646.6 2.09x 17.0x 21.3x 38.9x 0.7x
Jiangsu Newamstar Packaging Machinery Co. Ltd. Class A 242.5 220.6 2.76x 21.1x 25.5x 36.7x -2.4x
Krones AG 3,204.6 3,146.2 0.71x 8.2x 11.6x 19.2x -0.2x
Mpac Group PLC 32.6 0.3 - 0.00x -0.2x -1.0x 7.0x -22.2x
Shanghai Precise Packaging Co., Ltd. Class A 187.0 218.5 1.80x 41.0x 449.3x 238.7x 5.6x
SHIBUYA KOGYO CO LTD 948.4 836.5 0.94x 7.8x 9.6x 16.0x -1.0x
Tokyo Automatic Machinery Works, Ltd. 22.3 22.6 0.32x 8.6x 14.6x 10.7x 0.1x
Xu Yuan Packaging Technology Co., Ltd. 27.5 66.1 1.59x 14.8x 33.2x 30.6x 7.8x
CFT SpA 135.2 16.2 22.69x 47.1x 201.3x 1374.0x -346.9x
Summary Statistics Summary Statistics
Median 1.79x 15.9x 23.4x 33.2x -0.2x
Mean 3.39x 18.6x 66.0x 136.9x -23.9x
Adjusted Mean (1) 2.07x 17.8x 39.6x 51.8x -1.5x
*Market Cap is as of Latest Available
**Net Debt and Minorities Interests are all latest available LTM figures
***EV is calculated as sum of the previous figures.
Source: Factset
(1) Top and Bottom 10% of data set is excluded from adjusted mean calculation
Enterprise Value / LTM
1. Market Comparables
1.4. Packaging machinery– listed comparables (Con’t)
(US$ in millions)
15
PACKAGING INSIDEROctober 2018
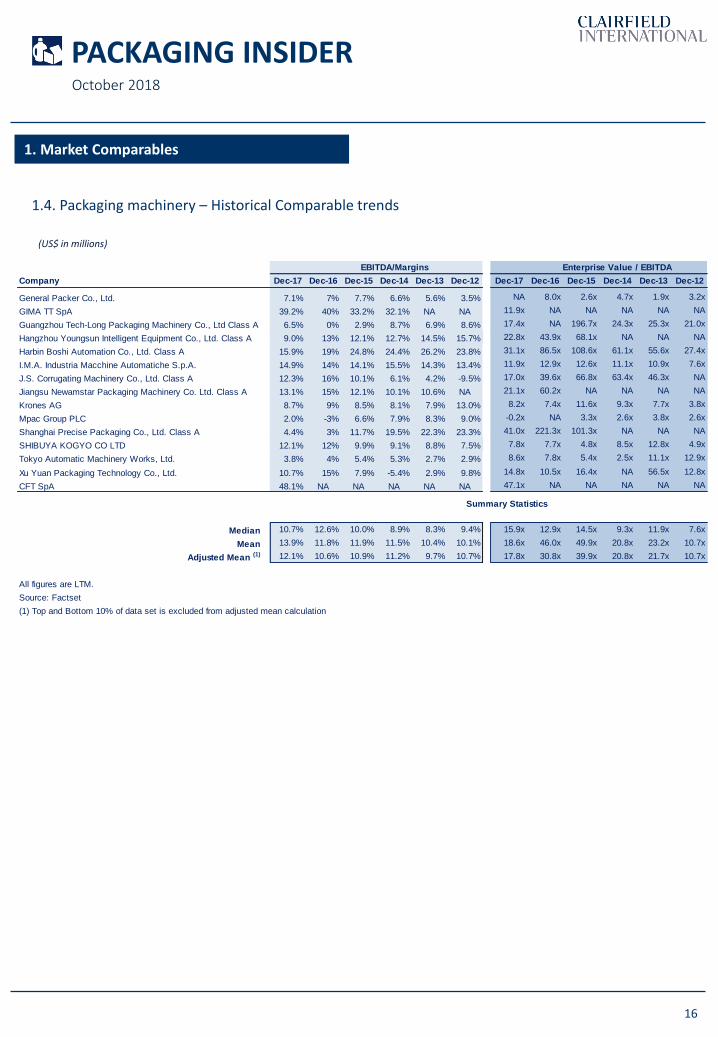
Company Dec-17 Dec-16 Dec-15 Dec-14 Dec-13 Dec-12 Dec-17 Dec-16 Dec-15 Dec-14 Dec-13 Dec-12
General Packer Co., Ltd. 7.1% 7% 7.7% 6.6% 5.6% 3.5% NA 8.0x 2.6x 4.7x 1.9x 3.2x
GIMA TT SpA 39.2% 40% 33.2% 32.1% NA NA 11.9x NA NA NA NA NA
Guangzhou Tech-Long Packaging Machinery Co., Ltd Class A 6.5% 0% 2.9% 8.7% 6.9% 8.6% 17.4x NA 196.7x 24.3x 25.3x 21.0x
Hangzhou Youngsun Intelligent Equipment Co., Ltd. Class A 9.0% 13% 12.1% 12.7% 14.5% 15.7% 22.8x 43.9x 68.1x NA NA NA
Harbin Boshi Automation Co., Ltd. Class A 15.9% 19% 24.8% 24.4% 26.2% 23.8% 31.1x 86.5x 108.6x 61.1x 55.6x 27.4x
I.M.A. Industria Macchine Automatiche S.p.A. 14.9% 14% 14.1% 15.5% 14.3% 13.4% 11.9x 12.9x 12.6x 11.1x 10.9x 7.6x
J.S. Corrugating Machinery Co., Ltd. Class A 12.3% 16% 10.1% 6.1% 4.2% -9.5% 17.0x 39.6x 66.8x 63.4x 46.3x NA
Jiangsu Newamstar Packaging Machinery Co. Ltd. Class A 13.1% 15% 12.1% 10.1% 10.6% NA 21.1x 60.2x NA NA NA NA
Krones AG 8.7% 9% 8.5% 8.1% 7.9% 13.0% 8.2x 7.4x 11.6x 9.3x 7.7x 3.8x
Mpac Group PLC 2.0% -3% 6.6% 7.9% 8.3% 9.0% -0.2x NA 3.3x 2.6x 3.8x 2.6x
Shanghai Precise Packaging Co., Ltd. Class A 4.4% 3% 11.7% 19.5% 22.3% 23.3% 41.0x 221.3x 101.3x NA NA NA
SHIBUYA KOGYO CO LTD 12.1% 12% 9.9% 9.1% 8.8% 7.5% 7.8x 7.7x 4.8x 8.5x 12.8x 4.9x
Tokyo Automatic Machinery Works, Ltd. 3.8% 4% 5.4% 5.3% 2.7% 2.9% 8.6x 7.8x 5.4x 2.5x 11.1x 12.9x
Xu Yuan Packaging Technology Co., Ltd. 10.7% 15% 7.9% -5.4% 2.9% 9.8% 14.8x 10.5x 16.4x NA 56.5x 12.8x
CFT SpA 48.1% NA NA NA NA NA 47.1x NA NA NA NA NA
Summary Statistics
Median 10.7% 12.6% 10.0% 8.9% 8.3% 9.4% 15.9x 12.9x 14.5x 9.3x 11.9x 7.6x
Mean 13.9% 11.8% 11.9% 11.5% 10.4% 10.1% 18.6x 46.0x 49.9x 20.8x 23.2x 10.7x
Adjusted Mean (1) 12.1% 10.6% 10.9% 11.2% 9.7% 10.7% 17.8x 30.8x 39.9x 20.8x 21.7x 10.7x
All figures are LTM.
Source: Factset
(1) Top and Bottom 10% of data set is excluded from adjusted mean calculation
EBITDA/Margins Enterprise Value / EBITDA
1. Market Comparables
1.4. Packaging machinery – Historical Comparable trends
(US$ in millions)
16

PACKAGING INSIDEROctober 2018
Date Target Country Acquirer Country EV Revenues EBITDA EBIT
Jul-18 Uteco Converting S.p.A.
(81% Stake)
Italy NB Renaissance Partners Italy NA 127.0 NA NA
Jun-18 FAWEMA GmbH; HDG
Verpackungsmaschinen GmbH
Germany HQ Equita GmbH Germany NA NA NA NA
May-18 Ciemme s.r.l. (70% Stake) Italy IMA S.p.A. Italy NA 9.0 2.0 NA
Apr-18 Tissue Machinery Company
(82.5% Stake)
Italy IMA S.p.A. Italy NA 70.0 6.0 NA
Jul-18 Diatec SRL (70% Stake) Italy Andritz AG Austria NA 40.0 6.0 NA
Jul-18 Uteco Converting S.p.A. (81%
Stake)
Italy NB Renaissance Partners Italy 197.5 121.0 12.0 NA
Jun-18 Schmucker S.r.l. ITA Marchesini Group S.p.A. ITA NA 11.0 NA NA
Jun-18 Sotemapack Srl (60% Stake) Italy Aetna Group SPA Italy NA 10.0 NA NA
Jan-18 Hiperbaric S.A. Spain Alantra Private Equity ;
Desmasa SL
Spain;Spain 135.0 60.0 NA NA
Feb-18 CFT S.p.A. Italy Glenalta (SPAC) Italy NA 200.0 20.0 NA
Dec-17 A+F Automation +
Foerdertechnik GmbH
Germany CGS Management AG Switzerland 25.0 28.0 NA NA
Oct-17 ROVEMA GmbH Germany Franz Haniel & Cie GmbH Germany NA 24.1 5.6 5.2
Sep-17 MGS Machine Corporation USA Coesia S.p.A. Italy NA NA NA NA
May-17 Romaco Pharmatechnik GmbH
(75.1% Stake)
Germany,Italy Chutian Asset Management
(Changsha) Co., Ltd.
China NA 134.0 NA NA
Jul-17 PLF International Limited UK John Bean Technologies
Corporation
USA 31.3 24.0 5.0 NA
Jun-17 Eurosicma S.p.A. (60% Stake) Italy IMA S.p.A. Italy NA 27.0 3.0 NA
May-17 Ocme S.r.l. (50% Stake) Italy Robopac SPA San Marino 60.0 125.0 11.0 NA
Aug-16 SBS Ecoclean Group (85%
Stake)
Germany Shenyang Blue Silver
Industry Automatic
Equipment Co., Ltd.
China 120.0 200.0 NA NA
Feb-17 DUMEK s.r.l. Italy Marchesini Group S.p.A. Italy NA 4.0 NA NA
Dec-16 MAI S.A. (70% Stake) Argentina IMA S.p.A. Italy NA NA NA NA
Jun-18 KraussMaffei Technologies
GmbH
Germany China National Chemical
Co., Ltd
China 925.0 684.0 150.0 NA
Mar-16 Komax Systems LCF SA;
Komax Systems Rockford Inc.;
Komax Systems Malaysia
Sdn.Bhd (76% Stake)
Switzerland;
Malaysia;
USA
GIMA TT S.p.A. Italy NA NA NA NA
1. Market Comparables
1.3. Packaging machinery – M&A transactions(€ in millions)
17
Source: MergerMarket , October 2017

PACKAGING INSIDEROctober 2018
2. Selected packaging transactions closed by Clairfield International
18
Germany
was sold to
Italy
sold all activities related to
production of injection-
stretch-blow molding (ISBM)
equipment
France
sold
to
France
sold its asset to
Finland
sold its Flexible Packaging
division to
Italy
sold its 100% stake in the
share capital of
to a subsidiary of
Germany
sold
Spain
The Netherlands
was sold to
France
acquired
Netherlands
merged with
France
acquired all the industrial
assets and the business of
Industrial European
Wood Production
Holding
Debt advisory
IMPACK