Embed Size (px)
Citation preview

January 2019
Investment Committee
Group Asset Management
1

2
Main snapshots (rating: )
View Topic Comment
Macro Decelerating growth but towards stabilization, not uniform and also questioned. Risks: increased tariffs, competitive retaliation, worsening financial conditions, populist outcomes, hard Brexit, shutdown, antitrust for the Internet, long-term decline in oil for investments.
Monetary More stringent financial conditions for Central Banks in normalization at risk of error but with flexibility, and for the stabilization of increases of risk premiums requested by financial markets. Risks: inflationary acceleration, increase in political and commercial uncertainty, excessive fiscal stimulus.
Asset Allocation
Actions not expensive but in a context of greater downside risks that make barbell dynamic stock-govies opportune with low-return corporate spreads and high leverage and refinancing needs. Risks: acceleration of risk off on negative newsflow from macro and monetary risks, acceleration of risk on positive growth surprises.
Equities Interesting multiples but decelerating profit growth and higher volatility. Preference for US (growth), then EMG (potential) and to follow JN (poor momentum) and EZ (vulnerability). Hold for diversification China and SP (multiples and momentum). Attention to technical levels for take profits and subsequent returns in the tactical dynamism. Risks: disappointing quarterly results, rising costs (wages, interest, and duties) and volatility for higher risks.
Govies core
Rates towards the US trading range minimum. Relevant opportunities in Breakeven inflation. Risks: excessive fiscal deficit in the US, political and confidence crises in the EU, further macro slowdown.
Spread Emg Debt adequately compensates for the risk involved. EZ spreads are also profitable but retain risk doses. High Yields offer no rewarding risk-return combination. Risks: Usd rise, increase in treasury yield, increase in default, outflows, political unrest, inflation out of control.
Gold Recent rise on a fragile basis, unattractive on fundamentals. Risks: worsening macro newsflow, inflation acceleration, USD collapse, unexpected new conflicts.
Oil Volatile but almost cheap and with new positive catalyst coming. Risks: tensions between producer countries, macro deceleration, Usd rallies, cancellation of US sanctions against Iran, non-compliance with the Opec + agreement.
Euro Eur with valuation support and momentum differentials improving but USD supported by differential rates and uncertainty. Sek and Nok diversification opportunities. Risks: populist and sovereign drifts in EZ, greater macro slowdown, Fed acceleration; inflation disappointments (Sek and Nok) or oil collapse (Nok).
Investment Committee - January 2019
Macro US: growth without overheating, contained risks of recession
3
Output Gap = livello attuale PIL - PIL al pieno impiego (potenziale +2%)
Fase del ciclo economico: espansione dal minimo del gap del 2009
Trend: attesa di crescita sopra il potenziale
Surriscaldamento
Output Gap
Depressione
-4%
-3%
-2%
-1%
0%
1%
2%
3%
4%
5%
mar
-01
mar
-03
mar
-05
mar
-07
mar
-09
mar
-11
mar
-13
mar
-15
mar
-17
mar
-19
Barometro dell'economia Stati Uniti
0
10
20
30
40
50
mar
-87
mar
-89
mar
-91
mar
-93
mar
-95
mar
-97
mar
-99
mar
-01
mar
-03
mar
-05
mar
-07
mar
-09
mar
-11
mar
-13
mar
-15
mar
-17
mar
-19
Recessioni
Probabilità recessione US tra un anno - Calcolo NY Fed
-1000
-800
-600
-400
-200
0
200
400
600
-4
-3
-2
-1
0
1
2
3
4
5
6
mar
-87
mar
-89
mar
-91
mar
-93
mar
-95
mar
-97
mar
-99
mar
-01
mar
-03
mar
-05
mar
-07
mar
-09
mar
-11
mar
-13
mar
-15
mar
-17
Recessioni
US: 10-2y Treas (sn)
GDP a/a (sn)
Change in Nonfarm Payrolls (ds)
30
35
40
45
50
55
60
65
-4
-3
-2
-1
0
1
2
3
4
5
6
mar
-87
mar
-89
mar
-91
mar
-93
mar
-95
mar
-97
mar
-99
mar
-01
mar
-03
mar
-05
mar
-07
mar
-09
mar
-11
mar
-13
mar
-15
mar
-17
Recessioni
US: 10-2y Treas (sn)
GDP a/a (sn)
ISM Manufacturing (ds)
ISM Non-Manufacturing (ds)
Investment Committee - January 2019
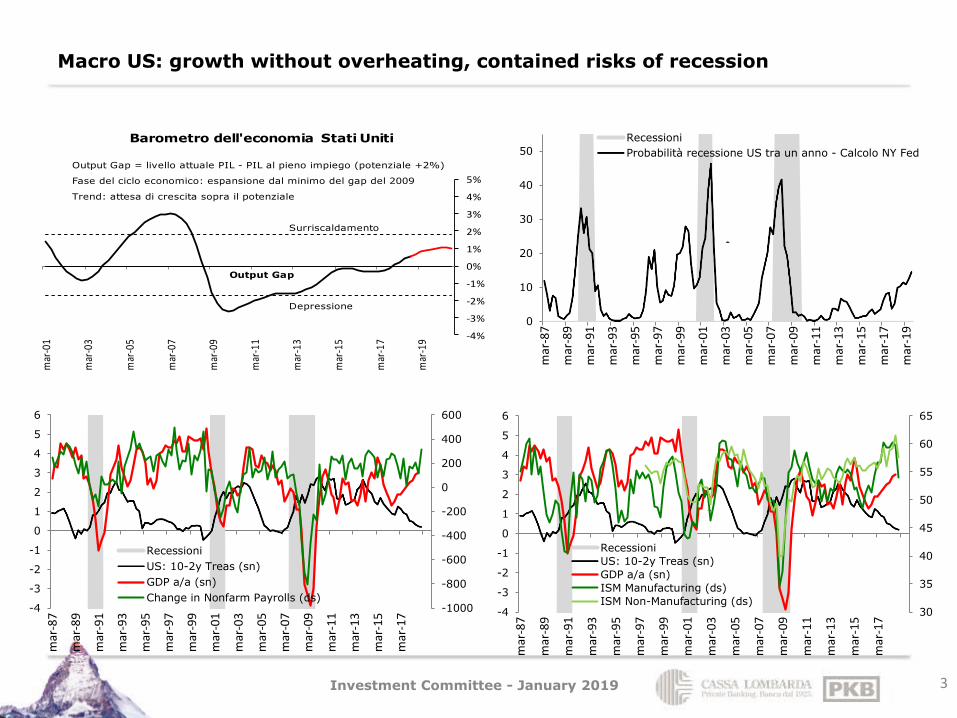
Macro EZ: decelerating to potential and expected to stabilize but with residual risks
4
The Eurozone continues to decelerate (graph up). Business confidence dropped significantly in the fourth quarter (graph below left). After a 2018 penalized by several negative one-offs, the consensus of economists continues to project growth in line with the potential up to mid-2020 (below), also thanks to the ECB's ultra-supportive policy.
-3
-2
-1
0
1
2
3
4
5
dic
-11
giu
-12
dic
-12
giu
-13
dic
-13
giu
-14
dic
-14
giu
-15
dic
-15
giu
-16
dic
-16
giu
-17
dic
-17
giu
-18
dic
-18
Momentum di attività Eurozona Indicatore proprietario di accelerazione /decelerazione
e velocità trimestrale rolling
Indicatore proprietario di momentum macro
Ultimi tre mesi completi
Mese in corso (in evoluzione)
Espansione Pil > 0, Contrazione Pil < 0
-4
-3
-2
-1
0
1
2
nov-0
7
nov-0
8
nov-0
9
nov-1
0
nov-1
1
nov-1
2
nov-1
3
nov-1
4
nov-1
5
nov-1
6
nov-1
7
nov-1
8
EU Commission Business Climate Indicator
-6.0%
-4.0%
-2.0%
0.0%
2.0%
4.0%
6.0%
set-
99
set-
01
set-
03
set-
05
set-
07
set-
09
set-
11
set-
13
set-
15
set-
17
set-
19
Crescita annuale PIL Eurozona a/a
Crescita potenziale
Attesa consenso
Investment Committee - January 2019

Macro RoW: United Kindom (=) Japan (=)
5
Consensus of economists remains aligned on potential growth Growth in Japan has been made volatile by unique factors in 2018 and will still be volatile due to the shock of the VAT increase in 2019. Inflation is low despite the low unemployment rate, due to the significant increase in female participation in the labor market.
48
48.5
49
49.5
50
50.5
51
51.5
52
52.5
53
60000
65000
70000
75000
80000
85000
90000
giu
-02
giu
-04
giu
-06
giu
-08
giu
-10
giu
-12
giu
-14
giu
-16
giu
-18
Popolazione attiva Giappone(migliaia, scala sn)
Forza lavoro Giappone (migliaia,scala sn)
Tasso di partecipazione femminile(in pct, scala ds)
-10%
-8%
-6%
-4%
-2%
0%
2%
4%
6%
set-
99
set-
01
set-
03
set-
05
set-
07
set-
09
set-
11
set-
13
set-
15
set-
17
set-
19
Crescita annuale PIL Giappone
Crescita potenziale
Attesa consenso
-7%
-6%
-5%
-4%
-3%
-2%
-1%
0%
1%
2%
3%
4%
5%
set-
99
set-
01
set-
03
set-
05
set-
07
set-
09
set-
11
set-
13
set-
15
set-
17
set-
19
Crescita PIL UK a/a
Crescita potenziale PIL UK a/a
Attesa Consenso
Investment Committee - January 2019

Macro China: slow down due to decline in foreign trade, expected growth in line with potential thanks to fiscal support
6
10
15
20
25
30
35
dic
-11
giu
-12
dic
-12
giu
-13
dic
-13
giu
-14
dic
-14
giu
-15
dic
-15
giu
-16
dic
-16
giu
-17
dic
-17
giu
-18
dic
-18
Momentum di attività Cina Indicatore di accelerazione /decelerazione
e velocità annuale rolling
Indicatore proprietario di momentum macro
Ultimi tre mesi completi
Mese in corso (in evoluzione)
Espansione Pil > 0, Contrazione Pil < 0
-60
-40
-20
0
20
40
60
80
100
ott
-07
ott
-08
ott
-09
ott
-10
ott
-11
ott
-12
ott
-13
ott
-14
ott
-15
ott
-16
ott
-17
ott
-18
Cina - Export in Usd a/a
Cina - Import in Usd a/a
100
120
140
160
180
200
220
20
25
30
35
40
45
50
55
60
65
70
feb-0
5
feb-0
7
feb-0
9
feb-1
1
feb-1
3
feb-1
5
feb-1
7
feb-1
9
feb-2
1
feb-2
3Debito pubblico lordo / PIL (scala sn)
Previsione FMI (scala sn)
Debito settore privato non finanziario / PIL (scala ds)
5%
6%
7%
8%
9%
10%
11%
12%
13%
14%
15%
set-
99
set-
01
set-
03
set-
05
set-
07
set-
09
set-
11
set-
13
set-
15
set-
17
set-
19
Crescita PIL Cina a/a
Crescita potenziale PIL Cina a/a
Attesa consenso
Investment Committee - January 2019

Macro EM: weak end of 2018 for Asia and Turkey, growth prospects intact
7
On the whole, the emerging are still expected to grow and to a greater extent than the advanced ones
4
4.5
5
5.5
6
6.5
7
7.5
8
dic
-11
giu
-12
dic
-12
giu
-13
dic
-13
giu
-14
dic
-14
giu
-15
dic
-15
giu
-16
dic
-16
giu
-17
dic
-17
giu
-18
dic
-18
Momentum di attività EM Indicatore di accelerazione /decelerazione
e velocità annuale rolling
Indicatore proprietario di momentum macro
Ultimi tre mesi completi
Mese in corso (in evoluzione)
Espansione Pil > 0, Contrazione Pil < 0
-2
-1
0
1
2
3
4
dic
-11
giu
-12
dic
-12
giu
-13
dic
-13
giu
-14
dic
-14
giu
-15
dic
-15
giu
-16
dic
-16
giu
-17
dic
-17
giu
-18
dic
-18
Momentum di attività Turchia Indicatore di accelerazione /decelerazione
e velocità annuale rolling
Indicatore proprietario di momentum macro
Ultimi tre mesi completi
Mese in corso (in evoluzione)
Espansione Pil > 0, Contrazione Pil < 0
-4
-2
0
2
4
6
8
10
12
dic
-00
dic
-01
dic
-02
dic
-03
dic
-04
dic
-05
dic
-06
dic
-07
dic
-08
dic
-09
dic
-10
dic
-11
dic
-12
dic
-13
dic
-14
dic
-15
dic
-16
dic
-17
dic
-18
dic
-19
dic
-20
dic
-21
dic
-22
dic
-23
Crescita PIL EM in %Attesa IMFCrescita PIL economie avanzate in %Attesa IMFCrescita PIL EM Asia in %Attesa IMF
Investment Committee - January 2019

Monetary Policies: in slow normalization but with risk of error
8
0
500'000
1'000'000
1'500'000
2'000'000
2'500'000
3'000'000
3'500'000
4'000'000
4'500'000
5'000'000
gen.0
4
gen.0
5
gen.0
6
gen.0
7
gen.0
8
gen.0
9
gen.1
0
gen.1
1
gen.1
2
gen.1
3
gen.1
4
gen.1
5
gen.1
6
gen.1
7
gen.1
8
gen.1
9
gen.2
0
gen.2
1
gen.2
2
gen.2
3
gen.2
4
BS Fed in mln usd
Evoluzione programmata con ritmo da Fomc 14/6/17 efine stimata da mercato al 2022
-0.6
-0.4
-0.2
0
0.2
0.4
0.6
0.8
feb.1
4
mag.1
4
ago.1
4
nov.1
4
feb.1
5
mag.1
5
ago.1
5
nov.1
5
feb.1
6
mag.1
6
ago.1
6
nov.1
6
feb.1
7
mag.1
7
ago.1
7
nov.1
7
feb.1
8
mag.1
8
ago.1
8
nov.1
8
BofA Merrill Lynch GFSI (Global financial stressindicator; >0 more stress than normal)
-9
-7
-5
-3
-1
1
3
5
7
dic
.97
nov.9
8
ott
.99
set.
00
ago.0
1
lug.0
2
giu
.03
mag.0
4
apr.
05
mar.
06
feb.0
7
gen.0
8
dic
.08
nov.0
9
ott
.10
set.
11
ago.1
2
lug.1
3
giu
.14
mag.1
5
apr.
16
mar.
17
feb.1
8
NZ Shadow Short Rate - US
NZ Shadow Short Rate - EURO
NZ Shadow Short Rate - Japan
2
2.1
2.2
2.3
2.4
2.5
2.6
gen.1
8
feb.1
8
mar.
18
apr.
18
mag.1
8
giu
.18
lug.1
8
ago.1
8
set.
18
ott
.18
nov.1
8
dic
.18
USD Inflation Swap Forward 5Y5
media 1 anno
Investment Committee - January 2019

AA: shares fell more than the cycle but still weighed in the ptf, already helped by buybacks and more volatile
9
49.5
50.5
51.5
52.5
53.5
54.5
55.5
-23%
-18%
-13%
-8%
-3%
3%
8%
13%
18%
23%
gen-1
6
mar-
16
mag-1
6
lug-1
6
set-
16
nov-1
6
gen-1
7
mar-
17
mag-1
7
lug-1
7
set-
17
nov-1
7
gen-1
8
mar-
18
mag-1
8
lug-1
8
set-
18
nov-1
8
gen-1
9
MSCI ACWI - Bloomberg Barclays Global Agg YoY % (sn)JPMorgan Global Manufacturing (ds)
Fonte: Goldman Sachs al 31/12/18
0.0%
0.5%
1.0%
1.5%
2.0%
2.5%
3.0%
gen-1
7
feb-1
7
mar-
17
apr-
17
mag-1
7
giu
-17
lug-1
7
ago-1
7
set-
17
ott
-17
nov-1
7
dic
-17
gen-1
8
feb-1
8
mar-
18
apr-
18
mag-1
8
giu
-18
lug-1
8
ago-1
8
set-
18
ott
-18
nov-1
8
dic
-18
gen-1
9
Oscillazione % daily MSCI ACWI media mobile 30 gg
30
35
40
45
50
55
60
65
-40
-30
-20
-10
0
10
20
30
40
50
dic
-98
dic
-00
dic
-02
dic
-04
dic
-06
dic
-08
dic
-10
dic
-12
dic
-14
dic
-16
dic
-18
Recessioni
S&P 500 a/a in percento (sn)
ISM Manufacturing (ds)
Investment Committee - January 2019

AA: negative momentum already extreme enough for actions
10
-15
-10
-5
0
5
10
US Eurozone UK Japan Brazil Russia India China
Var.% Exp Pil Q119 - Q418var%mkt da 10/10/18 a 08/01/19
0
10
20
30
40
50
60
70
80
1700
1900
2100
2300
2500
2700
2900
3100
gen.1
4
lug.1
4
gen.1
5
lug.1
5
gen.1
6
lug.1
6
gen.1
7
lug.1
7
gen.1
8
lug.1
8
gen.1
9
S&P 500 INDEX (sn)
Bloomberg Percentage of NYSE Stock above 200gg Mov Avg (ds)
-130000
-80000
-30000
20000
70000
120000
1.3
1.5
1.7
1.9
2.1
2.3
2.5
2.7
2.9
3.1
3.3
gen.1
4
apr.
14
lug.1
4
ott
.14
gen.1
5
apr.
15
lug.1
5
ott
.15
gen.1
6
apr.
16
lug.1
6
ott
.16
gen.1
7
apr.
17
lug.1
7
ott
.17
gen.1
8
apr.
18
lug.1
8
ott
.18
US Generic Govt 10 Year Yield (sn)
Posizioni futures nette su treasury (ds)
-0.8
-0.6
-0.4
-0.2
0.0
0.2
0.4
0.6
0.8
dic
-17
gen-1
8
feb-1
8
mar-
18
apr-
18
mag-1
8
giu
-18
lug-1
8
ago-1
8
set-
18
ott
-18
nov-1
8
dic
-18
Citi Earning revision: Citi ERI USCiti ERI Europe ex-UKCiti ERI JapanCiti ERI Emerging Mkts
Investment Committee - January 2019

AA: negative momentum is statistically good buying point but yield now not high
11
Fonte: Goldman Sachs
0%
20%
40%
60%
80%
100%
AZ World Global HighYield
Global IG Global Sov
percentile last yield vs range ultimi 10 anni
-80%
-60%
-40%
-20%
0%
20%
40%
60%
0 0.2 0.4 0.6 0.8 1 1.2
S&
P n
ei 1
2 m
esi
su
ccessiv
i
Indice Citi Macro Risk
SPX
10% 11% 15%
9%
15%
29%
17%
3%
-4% -17%
-20%
-10%
0%
10%
20%
30%
40%
1957 1962 1970 1974 1987 1990 2001 2001 2002 2008
S&P 500 - Performance su 6 mesi dopo un calo maggiore del 20%
Investment Committee - January 2019
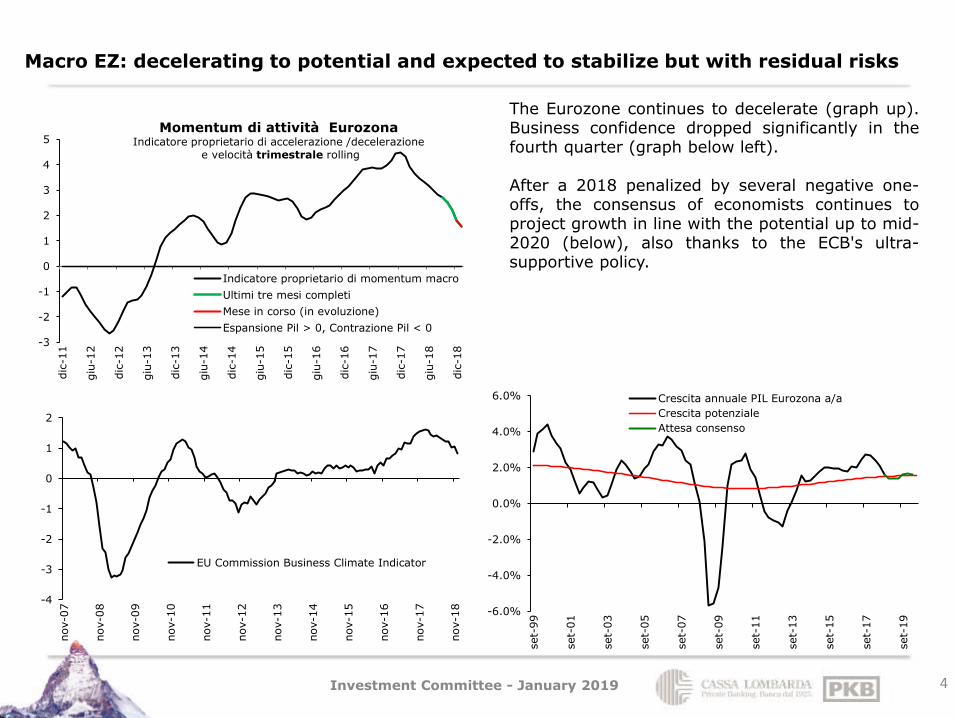
A.A.: mix yield risk favorable to a dynamic barbell equities-govies
12
0
0.5
1
1.5
2
2.5
3
3.5
4
4.5
gen.0
2
gen.0
3
gen.0
4
gen.0
5
gen.0
6
gen.0
7
gen.0
8
gen.0
9
gen.1
0
gen.1
1
gen.1
2
gen.1
3
gen.1
4
gen.1
5
gen.1
6
gen.1
7
gen.1
8
gen.1
9
Tasso medio globale governativimedia ultimi 10 anni-2 dev std+2 dev std
9
10
11
12
13
14
15
16
17
18
gen.0
9
lug.0
9
gen.1
0
lug.1
0
gen.1
1
lug.1
1
gen.1
2
lug.1
2
gen.1
3
lug.1
3
gen.1
4
lug.1
4
gen.1
5
lug.1
5
gen.1
6
lug.1
6
gen.1
7
lug.1
7
gen.1
8
lug.1
8
MSCI ACWI P/E roll 12m fwd
media 10 anni
-2 dev std
+2 dev std
3
4
5
6
7
8
9
2.3
2.4
2.5
2.6
2.7
2.8
2.9
3
3.1
07-g
en-1
4
07-a
pr-
14
07-l
ug-1
4
07-o
tt-1
4
07-g
en-1
5
07-a
pr-
15
07-l
ug-1
5
07-o
tt-1
5
07-g
en-1
6
07-a
pr-
16
07-l
ug-1
6
07-o
tt-1
6
07-g
en-1
7
07-a
pr-
17
07-l
ug-1
7
07-o
tt-1
7
07-g
en-1
8
07-a
pr-
18
07-l
ug-1
8
07-o
tt-1
8
07-g
en-1
9
MSCI ACWI BEST_div_yld (sn)
J.P. Morgan Global Aggregate ( last_price) HY spread (ds)
0
0.2
0.4
0.6
0.8
1
1.2
gen.1
4
apr.
14
lug.1
4
ott
.14
gen.1
5
apr.
15
lug.1
5
ott
.15
gen.1
6
apr.
16
lug.1
6
ott
.16
gen.1
7
apr.
17
lug.1
7
ott
.17
gen.1
8
apr.
18
lug.1
8
ott
.18
Citi Macro Risk Index: reading above 0.5 means
that risk aversion is above average
Citi Macro Risk Index
Investment Committee - January 2019

EQ US: penalized more than it would seem
13
P/E più che coerente col Pil (ds).
-50%
-40%
-30%
-20%
-10%
0%
10%
20%
30%
40%
50%
10
12
14
16
18
20
22
gen.0
9
giu
.09
nov.0
9
apr.
10
set.
10
feb.1
1
lug.1
1
dic
.11
mag.1
2
ott
.12
mar.
13
ago.1
3
gen.1
4
giu
.14
nov.1
4
apr.
15
set.
15
feb.1
6
lug.1
6
dic
.16
mag.1
7
ott
.17
mar.
18
ago.1
8
gen.1
9
S&P 500 INDEX best_pe_ratio (sn)
media 10 anni best_pe_ratio (sn)
S&P 500 INDEX best_eps yoy (ds)
media 10 anni best_eps yoy (ds)
10.8%
11.8% 11.5%
-15%
-10%
-5%
0%
5%
10%
15%
20%
25%
30%
35%
CQ
4 2
015
CQ
1 2
016
CQ
2 2
016
CQ
3 2
016
CQ
4 2
016
CQ
1 2
017
CQ
2 2
017
CQ
3 2
017
CQ
4 2
017
CQ
1 2
018
CQ
2 2
018
CQ
3 2
018
CQ
4 2
018
1 E
xp C
Q1
2 E
xp C
Q2
3 E
xp C
Q3
S&P 500 INDEX: y/y chg quarterly eps
9
11
13
15
17
19
21
gen.0
9
lug.0
9
gen.1
0
lug.1
0
gen.1
1
lug.1
1
gen.1
2
lug.1
2
gen.1
3
lug.1
3
gen.1
4
lug.1
4
gen.1
5
lug.1
5
gen.1
6
lug.1
6
gen.1
7
lug.1
7
gen.1
8
lug.1
8
gen.1
9
S&P 500 INDEX P/E roll 12m fwdmedia 10 anni-2 dev std+2 dev stdExtreme P/E rule of thumb
-
5
10
15
20
25
-10
-8
-6
-4
-2
0
2
4
6
set.
08
mar.
09
set.
09
mar.
10
set.
10
mar.
11
set.
11
mar.
12
set.
12
mar.
13
set.
13
mar.
14
set.
14
mar.
15
set.
15
mar.
16
set.
16
mar.
17
set.
17
mar.
18
set.
18
mar.
19
US: Pil, var% t/t annualizzato e stimeS&P 500 INDEX media trim. best_pe_ratio
Investment Committee - January 2019

EQ US appendice: look throught sectorial contribution
14
Fonte: S&P 500® (ndr: le marginali differenze dei singoli eps dai dati di Bloomberg dipendono da differenti classificazioni)
S&P Dow Jones Indices
Data as of the close of: 03/01/2019
Historical actuals: 30/09/2018 and prior
Estimates: 31/12/2018 and forward
INDEX NAME 2017 Q1 2017 Q2 2017 Q3 2017 Q4 2018 Q1 2018 Q2 2018 Q3 2018 Q4 2019 Q1 2019 Q2 2019 Q3 2019 Q4 2017 EPS 2017 P/E 2018 EPS 2018 P/E 2019EPS 2019 P/E
Operating Earnings Per Share by Economic Sector Price
S&P 500 2447,89 $28,82 $30,51 $31,33 $33,85 $36,54 $38,65 $41,38 $40,39 $39,46 $42,37 $44,16 $45,05 $124,52 21,47 $156,96 15,97 $171,04 14,31
S&P 500 Consumer Discretionary 771,54 $8,05 $8,71 $8,86 $9,62 $9,21 $10,47 $10,49 $9,89 $8,79 $10,99 $11,90 $11,54 $35,23 22,29 $40,05 19,51 $43,22 17,85
S&P 500 Consumer Staples 515,90 $5,99 $6,72 $7,17 $7,43 $6,77 $7,63 $7,82 $7,40 $6,98 $7,81 $8,19 $8,01 $27,32 21,50 $29,61 17,62 $31,00 16,64
S&P 500 Energy 428,07 $3,88 $2,75 $3,73 $2,93 $6,30 $6,66 $8,44 $7,57 $7,18 $7,72 $8,54 $8,51 $13,28 40,16 $28,97 14,64 $31,95 13,40
S&P 500 Financials 389,74 $6,83 $6,98 $6,14 $6,64 $7,88 $9,11 $9,92 $8,57 $9,31 $9,47 $9,62 $9,84 $26,59 17,45 $35,49 11,16 $38,24 10,19
S&P 500 Health Care 965,75 $10,52 $11,78 $11,37 $11,42 $12,15 $12,49 $13,14 $15,19 $16,32 $16,79 $16,95 $16,82 $45,08 21,21 $52,97 18,90 $66,88 14,44
S&P 500 Industrials 528,50 $6,37 $8,02 $8,05 $7,85 $8,93 $9,70 $9,83 $9,08 $8,59 $10,64 $10,51 $10,25 $30,29 21,06 $37,53 14,45 $40,00 13,21
S&P 500 Information Technology 1033,85 $10,30 $10,81 $12,20 $17,28 $15,30 $14,59 $16,69 $19,13 $15,82 $16,33 $17,68 $20,56 $50,59 21,87 $65,71 16,56 $70,39 14,69
S&P 500 Materials 309,26 $4,62 $4,89 $4,10 $3,57 $5,49 $6,63 $5,16 $4,72 $5,31 $6,35 $5,60 $5,49 $17,18 22,05 $22,00 14,39 $22,75 13,60
S&P 500 Communication Services 138,48 $2,70 $2,80 $2,74 $1,94 $3,59 $3,90 $2,12 $2,17 $2,07 $2,20 $2,23 $2,36 $10,18 16,31 $11,77 11,79 $8,85 15,65
S&P 500 Utilities 264,07 $3,75 $3,06 $4,66 $3,06 $4,45 $3,49 $5,13 $2,81 $4,29 $3,65 $5,09 $3,36 $14,53 18,40 $15,88 16,92 $16,39 16,11
S&P 500 Real Estate (proforma pre-9/19/16) 188,90 $1,37 $1,29 $1,56 $1,38 $1,49 $1,45 $1,68 $1,27 $1,14 $1,27 $1,27 $1,36 $5,60 36,38 $5,89 32,65 $5,05 37,40
OPERATING EARNINGS CONTRIBUTION
estimate estimate estimate estimate estimate
dic-19 set-19 giu-19 mar-19 dic-18 set-18 giu-18 mar-18 dic-17 set-17 giu-17 mar-17 dic-16
Energy 5,94% 6,08% 5,73% 5,72% 5,89% 6,34% 5,28% 5,24% 2,63% 3,62% 2,75% 4,07% 0,45%
Materials 2,64% 2,75% 3,25% 2,91% 2,53% 2,43% 3,34% 3,18% 2,23% 2,77% 3,28% 3,27% 1,98%
Industrials 9,69% 10,13% 10,69% 9,27% 9,56% 10,21% 10,77% 10,54% 9,97% 10,96% 11,23% 9,41% 10,06%
Consumer Discretionary 8,18% 8,60% 8,28% 7,11% 7,81% 8,10% 10,93% 10,45% 11,80% 11,77% 11,89% 11,62% 12,70%
Consumer Staples 6,33% 6,61% 6,56% 6,30% 6,52% 6,65% 7,06% 6,91% 8,19% 8,59% 8,52% 8,13% 9,26%
Health Care 14,55% 14,95% 15,43% 16,11% 14,64% 12,64% 12,80% 12,80% 13,05% 13,99% 14,80% 13,95% 14,20%
Financials 18,42% 18,37% 18,85% 19,89% 17,88% 20,28% 20,10% 18,34% 16,71% 16,81% 19,69% 20,37% 18,06%
Information Technology 21,17% 18,57% 17,87% 18,59% 21,95% 18,65% 21,85% 24,09% 29,31% 22,30% 20,33% 20,57% 25,74%
Communication Services 9,59% 9,24% 9,50% 9,60% 9,83% 9,32% 3,69% 3,29% 1,90% 2,95% 3,09% 3,15% 3,08%
Utilities 2,33% 3,59% 2,69% 3,39% 2,17% 3,82% 2,75% 3,59% 2,65% 4,36% 2,91% 3,77% 2,48%
Real Estate 1,17% 1,11% 1,16% 1,12% 1,21% 1,55% 1,44% 1,56% 1,55% 1,89% 1,51% 1,69% 1,99%
S&P 500 100,00% 100,00% 100,00% 100,00% 100,00% 100,00% 100,00% 100,00% 100,00% 100,00% 100,00% 100,00% 100,00%
Investment Committee - January 2019

EQ EZ: cheaper but with more risk and lower growth especially at the beginning of the year
15
6
8
10
12
14
16
gen.0
9
lug.0
9
gen.1
0
lug.1
0
gen.1
1
lug.1
1
gen.1
2
lug.1
2
gen.1
3
lug.1
3
gen.1
4
lug.1
4
gen.1
5
lug.1
5
gen.1
6
lug.1
6
gen.1
7
lug.1
7
gen.1
8
lug.1
8
Euro Stoxx 50 Pr P/E roll 12m fwd
media 10 anni
-2 dev std
+2 dev std
0.65
0.7
0.75
0.8
0.85
0.9
0.95
gen.0
9
giu
.09
nov.0
9
apr.
10
set.
10
feb.1
1
lug.1
1
dic
.11
mag.1
2
ott
.12
mar.
13
ago.1
3
gen.1
4
giu
.14
nov.1
4
apr.
15
set.
15
feb.1
6
lug.1
6
dic
.16
mag.1
7
ott
.17
mar.
18
ago.1
8
ratio p/e roll 12m fwd Euro Stoxx 50 Pr/S&P 500 INDEX
media 10 anni
-2 dev std
+2 dev std
media fase crisi Euro da EFSF a whatever it takes
-1.7%
3.7%
-1.7%
-40%
-20%
0%
20%
40%
60%
80%
100%
120%
140%
CQ
4 2
015
CQ
1 2
016
CQ
2 2
016
CQ
3 2
016
CQ
4 2
016
CQ
1 2
017
CQ
2 2
017
CQ
3 2
017
CQ
4 2
017
CQ
1 2
018
CQ
2 2
018
CQ
3 2
018
CQ
4 2
018
1 E
xp C
Q1
2 E
xp C
Q2
3 E
xp C
Q3
Euro Stoxx 50 Pr: y/y chg quarterly eps
72%
28%
Economieavanzate
ROW23%
2%
4%
2% 9%
2% 20%
38%
USA
CAD
JAP
NO
CH
Oceania
UK
Altri
Investment Committee - January 2019

EQ JN: cheap but with little momentum for low annual growth after first quarter
16
12
13
14
15
16
17
18
19
20
gen.1
4
lug.1
4
gen.1
5
lug.1
5
gen.1
6
lug.1
6
gen.1
7
lug.1
7
gen.1
8
lug.1
8
gen.1
9
NIKKEI 225 P/E roll 12m fwdmedia 5 anni-2 dev std+2 dev std
19'500
20'000
20'500
21'000
21'500
22'000
22'500
23'000
23'500
24'000
24'500
-8000
-7000
-6000
-5000
-4000
-3000
-2000
-1000
0
1000
2000
gen.1
8
gen.1
8
feb.1
8
mar.
18
mar.
18
apr.
18
mag.1
8
giu
.18
giu
.18
lug.1
8
ago.1
8
ago.1
8
set.
18
ott
.18
ott
.18
nov.1
8
dic
.18
dic
.18
cumulo da 05-01-18 Non-residents' net investmentBillion Yen (sn)NIKKEI 225 (ds)
-20%
-10%
0%
10%
20%
30%
40%
50%
60%
70%
10
12
14
16
18
20
22
gen.1
4
apr.
14
lug.1
4
ott
.14
gen.1
5
apr.
15
lug.1
5
ott
.15
gen.1
6
apr.
16
lug.1
6
ott
.16
gen.1
7
apr.
17
lug.1
7
ott
.17
gen.1
8
apr.
18
lug.1
8
ott
.18
NIKKEI 225 best_pe_ratio (sn)
media 5 anni best_pe_ratio (sn)
NIKKEI 225 best_eps yoy (ds)
media 5 anni best_eps yoy (ds)
37.4%
-12.9% -50%
0%
50%
100%
150%
200%
250%
CQ
4 2
015
CQ
1 2
016
CQ
2 2
016
CQ
3 2
016
CQ
4 2
016
CQ
1 2
017
CQ
2 2
017
CQ
3 2
017
CQ
4 2
017
CQ
1 2
018
CQ
2 2
018
CQ
3 2
018
CQ
4 2
018
1 E
xp C
Q1
2 E
xp C
Q2
NIKKEI 225: y/y chg quarterly eps
Investment Committee - January 2019

EQ EM: relative recovery space, modest growth but with upside
17
-50%
-30%
-10%
10%
30%
50%
70%
8
9
10
11
12
13
14
15
16
17
18
gen.0
9
lug.0
9
gen.1
0
lug.1
0
gen.1
1
lug.1
1
gen.1
2
lug.1
2
gen.1
3
lug.1
3
gen.1
4
lug.1
4
gen.1
5
lug.1
5
gen.1
6
lug.1
6
gen.1
7
lug.1
7
gen.1
8
lug.1
8
gen.1
9
MSCI EM best_pe_ratio (sn)
media 10 anni best_pe_ratio (sn)
MSCI EM best_eps yoy (ds)
media 10 anni best_eps yoy (ds)
-6.1% -0.1%
4.1%
-30%
-20%
-10%
0%
10%
20%
30%
40%
50%
60%
70%
80%
CQ
4 2
015
CQ
1 2
016
CQ
2 2
016
CQ
3 2
016
CQ
4 2
016
CQ
1 2
017
CQ
2 2
017
CQ
3 2
017
CQ
4 2
017
CQ
1 2
018
CQ
2 2
018
CQ
3 2
018
CQ
4 2
018
1 E
xp C
Q1
2 E
xp C
Q2
3 E
xp C
Q3
MSCI EM: y/y chg quarterly eps
0.45
0.47
0.49
0.51
0.53
0.55
0.57
0.59
-0.3
-0.2
-0.1
0
0.1
0.2
0.3
gen.1
8
feb.1
8
mar.
18
apr.
18
mag.1
8
giu
.18
lug.1
8
ago.1
8
set.
18
ott
.18
nov.1
8
dic
.18
gen.1
9
(Wld-Emg) Citi Macro Risk (sn)(Emg/Wld) Msci Index (ds)
7.5
8.5
9.5
10.5
11.5
12.5
13.5
14.5
gen.0
9
lug.0
9
gen.1
0
lug.1
0
gen.1
1
lug.1
1
gen.1
2
lug.1
2
gen.1
3
lug.1
3
gen.1
4
lug.1
4
gen.1
5
lug.1
5
gen.1
6
lug.1
6
gen.1
7
lug.1
7
gen.1
8
lug.1
8
gen.1
9
MSCI EM P/E roll 12m fwd
media 10 anni
-2 dev std
+2 dev std
Investment Committee - January 2019

EQ diversification: keep China
18
5
7
9
11
13
15
17
19
21
23
gen.0
9
lug.0
9
gen.1
0
lug.1
0
gen.1
1
lug.1
1
gen.1
2
lug.1
2
gen.1
3
lug.1
3
gen.1
4
lug.1
4
gen.1
5
lug.1
5
gen.1
6
lug.1
6
gen.1
7
lug.1
7
gen.1
8
lug.1
8
SHANGHAI SE COMPOSITE P/E roll 12m fwdmedia 10 anni-2 dev std+2 dev std
0.3
0.5
0.7
0.9
1.1
1.3
1.5
1.7
gen.0
9
giu
.09
nov.0
9
apr.
10
set.
10
feb.1
1
lug.1
1
dic
.11
mag.1
2
ott
.12
mar.
13
ago.1
3
gen.1
4
giu
.14
nov.1
4
apr.
15
set.
15
feb.1
6
lug.1
6
dic
.16
mag.1
7
ott
.17
mar.
18
ago.1
8
ratio p/e roll 12m fwd SHANGHAI SE COMPOSITE/MSCI ACWI
media 10 anni
-2 dev std
+2 dev std
1.0
1.5
2.0
2.5
3.0
3.5
dic
.09
giu
.10
dic
.10
giu
.11
dic
.11
giu
.12
dic
.12
giu
.13
dic
.13
giu
.14
dic
.14
giu
.15
dic
.15
giu
.16
dic
.16
giu
.17
dic
.17
giu
.18
dic
.18
giu
.19
dic
.19
China Annual Fiscal Deficit (% fixed by National People'sCongress in March)
Rumors next target
50.0
60.0
70.0
80.0
90.0
100.0
14.0
15.0
16.0
17.0
18.0
19.0
20.0
21.0
feb.1
5
mag.1
5
ago.1
5
nov.1
5
feb.1
6
mag.1
6
ago.1
6
nov.1
6
feb.1
7
mag.1
7
ago.1
7
nov.1
7
feb.1
8
mag.1
8
ago.1
8
nov.1
8China Required Deposit Reserve (sn)
China Monetary Conditions Inde (ds; rialzo=restrizione)
Investment Committee - January 2019
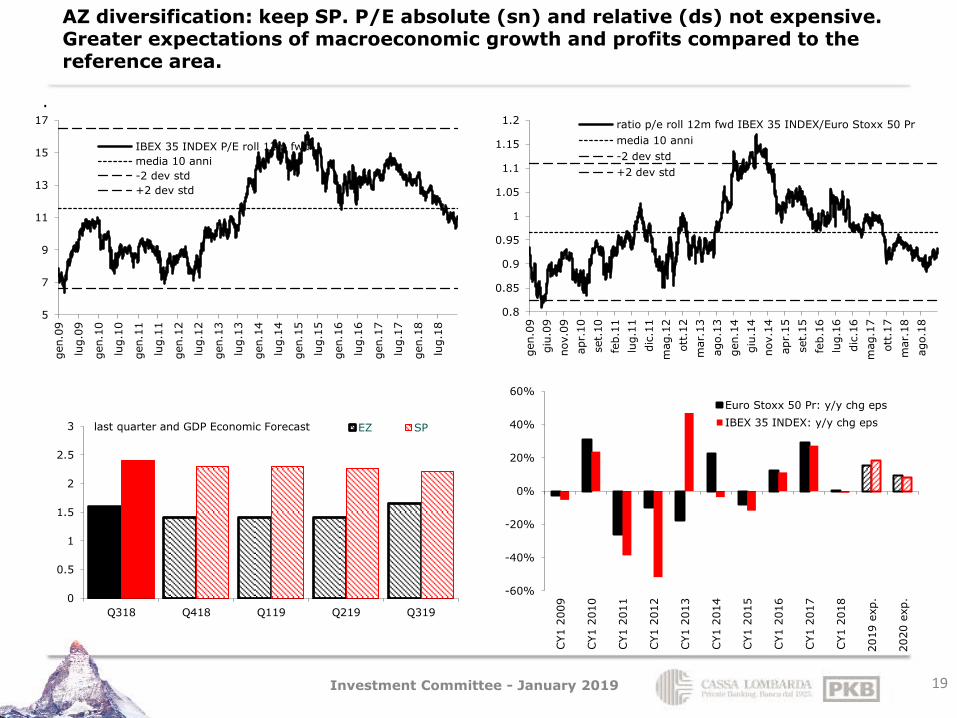
AZ diversification: keep SP. P/E absolute (sn) and relative (ds) not expensive. Greater expectations of macroeconomic growth and profits compared to the reference area.
19
.
0.8
0.85
0.9
0.95
1
1.05
1.1
1.15
1.2
gen.0
9
giu
.09
nov.0
9
apr.
10
set.
10
feb.1
1
lug.1
1
dic
.11
mag.1
2
ott
.12
mar.
13
ago.1
3
gen.1
4
giu
.14
nov.1
4
apr.
15
set.
15
feb.1
6
lug.1
6
dic
.16
mag.1
7
ott
.17
mar.
18
ago.1
8
ratio p/e roll 12m fwd IBEX 35 INDEX/Euro Stoxx 50 Pr
media 10 anni
-2 dev std
+2 dev std
5
7
9
11
13
15
17
gen.0
9
lug.0
9
gen.1
0
lug.1
0
gen.1
1
lug.1
1
gen.1
2
lug.1
2
gen.1
3
lug.1
3
gen.1
4
lug.1
4
gen.1
5
lug.1
5
gen.1
6
lug.1
6
gen.1
7
lug.1
7
gen.1
8
lug.1
8
IBEX 35 INDEX P/E roll 12m fwd
media 10 anni
-2 dev std
+2 dev std
0
0.5
1
1.5
2
2.5
3
Q318 Q418 Q119 Q219 Q319
last quarter and GDP Economic Forecast EZ SP
-60%
-40%
-20%
0%
20%
40%
60%
CY1 2
009
CY1 2
010
CY1 2
011
CY1 2
012
CY1 2
013
CY1 2
014
CY1 2
015
CY1 2
016
CY1 2
017
CY1 2
018
2019 e
xp.
2020 e
xp.
Euro Stoxx 50 Pr: y/y chg eps
IBEX 35 INDEX: y/y chg eps
Investment Committee - January 2019

Gov. US: rates at the low end of the trading range and opportunities in the B.E.Inflation
20
In US the past 10-year rate increase exactly followed the acceleration of the activity while the recent pull back emphasized the current deceleration because it is also fueled by the stock crash: this shows a possible range for the rates. The stock crash and the pullback of rates reduce the relative attractiveness of government yield at these levels . The recent deceleration, accentuated by the collapse of oil, has led to a decline in expectations of price growth, but the Breakeven have more than priced and can recover in relative terms.
1.3
1.8
2.3
2.8
3.3
3.8
35
40
45
50
55
60
65
feb.0
9
ago.0
9
feb.1
0
ago.1
0
feb.1
1
ago.1
1
feb.1
2
ago.1
2
feb.1
3
ago.1
3
feb.1
4
ago.1
4
feb.1
5
ago.1
5
feb.1
6
ago.1
6
feb.1
7
ago.1
7
feb.1
8
ago.1
8
ISM Manufacturing PMI SA (sn)
US Generic Govt 10 Year Yield (ds)
-2.5
-2
-1.5
-1
-0.5
0
0.5
1
1.5
gen.0
9
lug.0
9
gen.1
0
lug.1
0
gen.1
1
lug.1
1
gen.1
2
lug.1
2
gen.1
3
lug.1
3
gen.1
4
lug.1
4
gen.1
5
lug.1
5
gen.1
6
lug.1
6
gen.1
7
lug.1
7
gen.1
8
lug.1
8
S&P 500 Dvd Yield - 10y last_pricemedia 10 anni-2 dev std+2 dev std
1.0
1.2
1.4
1.6
1.8
2.0
2.2
30
35
40
45
50
55
60
65
70
75
80
dic
.13
mar.
14
giu
.14
set.
14
dic
.14
mar.
15
giu
.15
set.
15
dic
.15
mar.
16
giu
.16
set.
16
dic
.16
mar.
17
giu
.17
set.
17
dic
.17
mar.
18
giu
.18
set.
18
dic
.18
US: Ism Manifatturiero Prezzi
US Breakeven 5 Year
Investment Committee - January 2019

Gov. EZ: rewarded by the risk-off, offer poor performance; relative opportunities for B.E.I
21
In EU, the rate level has remained low under the growth for the purchases of the ECB now coming to an end. The stock crash amplified the relative low attractiveness of government yield. The recent deceleration, accentuated by the collapse of oil, has led to a decline in the indices and expectations of price growth, but the Breakeven have more than priced and can recover in relative terms.
0
0.5
1
1.5
2
2.5
3
3.5
4
4.5
mar.
09
set.
09
mar.
10
set.
10
mar.
11
set.
11
mar.
12
set.
12
mar.
13
set.
13
mar.
14
set.
14
mar.
15
set.
15
mar.
16
set.
16
mar.
17
set.
17
mar.
18
set.
18
mar.
19
set.
19
EUR SWAP ANN (VS 6M) 10Y al 30-set 0,99
avg 10y Euro Area Gross Domestic Produ.+ Cpi
proiezione media con stime Pil e Cpi
0
1
2
3
4
5
6
gen.0
9
lug.0
9
gen.1
0
lug.1
0
gen.1
1
lug.1
1
gen.1
2
lug.1
2
gen.1
3
lug.1
3
gen.1
4
lug.1
4
gen.1
5
lug.1
5
gen.1
6
lug.1
6
gen.1
7
lug.1
7
gen.1
8
lug.1
8
Euro Stoxx 50 Dvd Yield - EUR SWAP ANN (VS 6M) 10Ymedia 10 anni-2 dev std+2 dev std
0.6
0.7
0.8
0.9
1
1.1
1.2
1.3
1.4
46
48
50
52
54
56
58
60
giu
.16
ago.1
6
ott
.16
dic
.16
feb.1
7
apr.
17
giu
.17
ago.1
7
ott
.17
dic
.17
feb.1
8
apr.
18
giu
.18
ago.1
8
ott
.18
dic
.18
Francia: PMI Manifatturiero (sn)
Francia: PMI Servizi (sn)
Francia: PMI Composto (sn)
France Breakeven 5 Year (ds)
Investment Committee - January 2019

Gov EZ: spread widening x fears higher than current data; relative opportunities BtpIT
22
The performance of French government has widened the spread on the Bund due to the concern of a slowdown induced by the social tensions of yellow gilets. However, the movement has been greater than that expressed by the indicators of political risk and in fact it is falling. BTP yield is abundant with respect to growth and inflation because it still incorporates a dose of government risk and reliability. Btp Italia offer the indexing option at an economic price.
-2.0
-1.0
0.0
1.0
2.0
3.0
4.0
5.0
0
0.1
0.2
0.3
0.4
0.5
0.6
gen.1
8
feb.1
8
mar.
18
apr.
18
mag.1
8
giu
.18
lug.1
8
ago.1
8
set.
18
ott
.18
nov.1
8
dic
.18
gen.1
9
Spread % 10anni: Oat-Bund (sn)
Political Risk FR-DE (ds)
0
0.5
1
1.5
2
2.5
3
3.5
4
gen.1
6
mar.
16
mag.1
6
lug.1
6
set.
16
nov.1
6
gen.1
7
mar.
17
mag.1
7
lug.1
7
set.
17
nov.1
7
gen.1
8
mar.
18
mag.1
8
lug.1
8
set.
18
nov.1
8
gen.1
9
Italy Generic Govt 10Y Yield
teorico 10y IT (pil+bei)
-0.25
0
0.25
0.5
0.75
1
1.25
1.5
1.75
2
2.25
2.5
23/0
4/2
020
27/1
0/2
020
26/1
1/2
022
20/0
4/2
023
22/0
5/2
023
20/1
1/2
023
11/0
4/2
024
24/1
0/2
024
21/0
5/2
026
inflaz. implicita "pagata" (ex high watermark)
Btp Italia Ytm%
Btp Nominali Ytm%
media 10 anni Italy CPI FOI Ex Tobacco Unrev
Investment Committee - January 2019
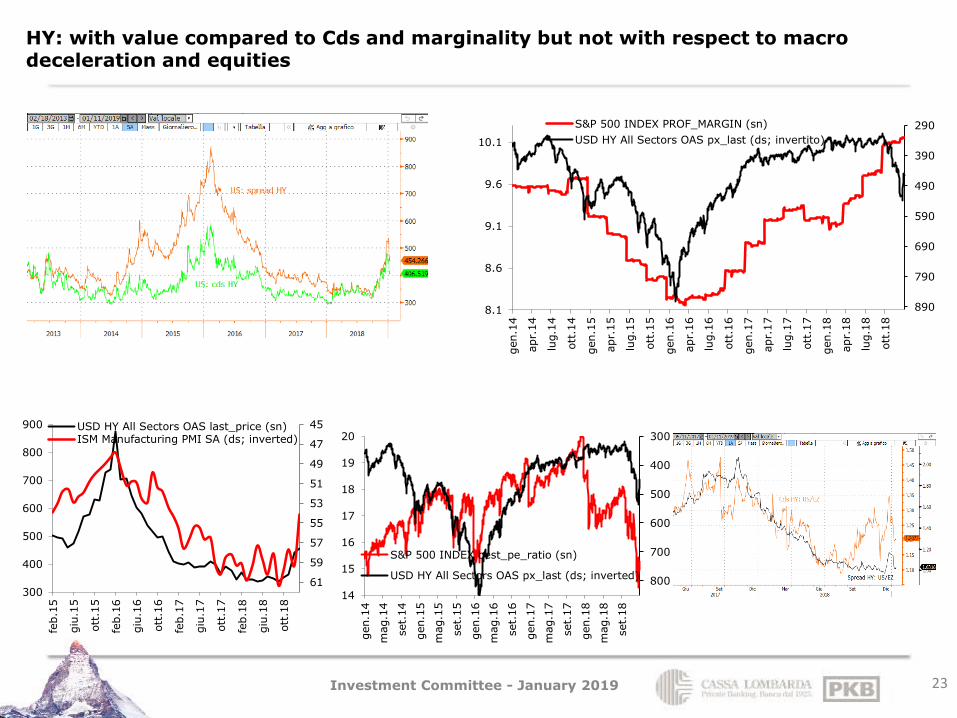
HY: with value compared to Cds and marginality but not with respect to macro deceleration and equities
23
290
390
490
590
690
790
8908.1
8.6
9.1
9.6
10.1
gen.1
4
apr.
14
lug.1
4
ott
.14
gen.1
5
apr.
15
lug.1
5
ott
.15
gen.1
6
apr.
16
lug.1
6
ott
.16
gen.1
7
apr.
17
lug.1
7
ott
.17
gen.1
8
apr.
18
lug.1
8
ott
.18
S&P 500 INDEX PROF_MARGIN (sn)
USD HY All Sectors OAS px_last (ds; invertito)
45
47
49
51
53
55
57
59
61300
400
500
600
700
800
900
feb.1
5
giu
.15
ott
.15
feb.1
6
giu
.16
ott
.16
feb.1
7
giu
.17
ott
.17
feb.1
8
giu
.18
ott
.18
USD HY All Sectors OAS last_price (sn)ISM Manufacturing PMI SA (ds; inverted) 300
400
500
600
700
800
14
15
16
17
18
19
20
gen.1
4
mag.1
4
set.
14
gen.1
5
mag.1
5
set.
15
gen.1
6
mag.1
6
set.
16
gen.1
7
mag.1
7
set.
17
gen.1
8
mag.1
8
set.
18
S&P 500 INDEX best_pe_ratio (sn)
USD HY All Sectors OAS px_last (ds; inverted)
Investment Committee - January 2019

Emerging debt: spread is rich compared to Usd, the perceived risk expressed by the CDS, volatility and macro trend
24
88
90
92
94
96
98
100
102
290
310
330
350
370
390
410
430
gen.1
7
mar.
17
mag.1
7
lug.1
7
set.
17
nov.1
7
gen.1
8
mar.
18
mag.1
8
lug.1
8
set.
18
nov.1
8
gen.1
9
J.P. Morgan EMBI Global Spread (sn)
DOLLAR INDEX SPOT (ds)
10
15
20
25
30
35
280
300
320
340
360
380
400
420
440
gen.1
7
feb.1
7
mar.
17
apr.
17
mag.1
7
giu
.17
lug.1
7
ago.1
7
set.
17
ott
.17
nov.1
7
dic
.17
gen.1
8
feb.1
8
mar.
18
apr.
18
mag.1
8
giu
.18
lug.1
8
ago.1
8
set.
18
ott
.18
nov.1
8
dic
.18
gen.1
9J.P. Morgan EMBI Global Spread (sn)
CBOE EM ETF Volatility (ds)
275
325
375
425
475
52549
49.5
50
50.5
51
51.5
52
52.5
53
53.5
54
gen-1
6
mar-
16
mag-1
6
lug-1
6
set-
16
nov-1
6
gen-1
7
mar-
17
mag-1
7
lug-1
7
set-
17
nov-1
7
gen-1
8
mar-
18
mag-1
8
lug-1
8
set-
18
nov-1
8
Markit Emerging Markets Composite PMI (sn)
J.P. Morgan EMBI Global Spread (ds; invertito)
Investment Committee - January 2019

Emerging Debt: with risk. Spread of the emerging debt reflects the tightening of the financial conditions, decrease of the commodities, marginality no longer improving.
25
100
200
300
400
500
600
700
800
900
1000
98
99
100
101
102
103
104
105
feb-0
1
feb-0
2
feb-0
3
feb-0
4
feb-0
5
feb-0
6
feb-0
7
feb-0
8
feb-0
9
feb-1
0
feb-1
1
feb-1
2
feb-1
3
feb-1
4
feb-1
5
feb-1
6
feb-1
7
feb-1
8
GS US FCI (sn; Financial Conditions Index:higher is more restrictive)
J.P. Morgan EMBI Global Spread (ds)
150
160
170
180
190
200
210
290
340
390
440
490
540
gen.1
6
mar.
16
mag.1
6
lug.1
6
set.
16
nov.1
6
gen.1
7
mar.
17
mag.1
7
lug.1
7
set.
17
nov.1
7
gen.1
8
mar.
18
mag.1
8
lug.1
8
set.
18
nov.1
8
gen.1
9
J.P. Morgan EMBI Global Spread (sn)
TR/CC CRB ER Index (ds)
280
330
380
430
480
7.5
8
8.5
9
9.5
10
gen.1
4
apr.
14
lug.1
4
ott
.14
gen.1
5
apr.
15
lug.1
5
ott
.15
gen.1
6
apr.
16
lug.1
6
ott
.16
gen.1
7
apr.
17
lug.1
7
ott
.17
gen.1
8
apr.
18
lug.1
8
ott
.18
gen.1
9MSCI EM PROF_MARGIN (sn)
J.P. Morgan EMBI Global Spread (ds;inverted)
280
330
380
430
480
530
10
10.5
11
11.5
12
12.5
13
13.5
14
14.5
gen.1
4
apr.
14
lug.1
4
ott
.14
gen.1
5
apr.
15
lug.1
5
ott
.15
gen.1
6
apr.
16
lug.1
6
ott
.16
gen.1
7
apr.
17
lug.1
7
ott
.17
gen.1
8
apr.
18
lug.1
8
ott
.18
gen.1
9
MSCI EM best_pe_ratio (sn)
J.P. Morgan EMBI Global Spread (ds; inverted)
Investment Committee - January 2019
26
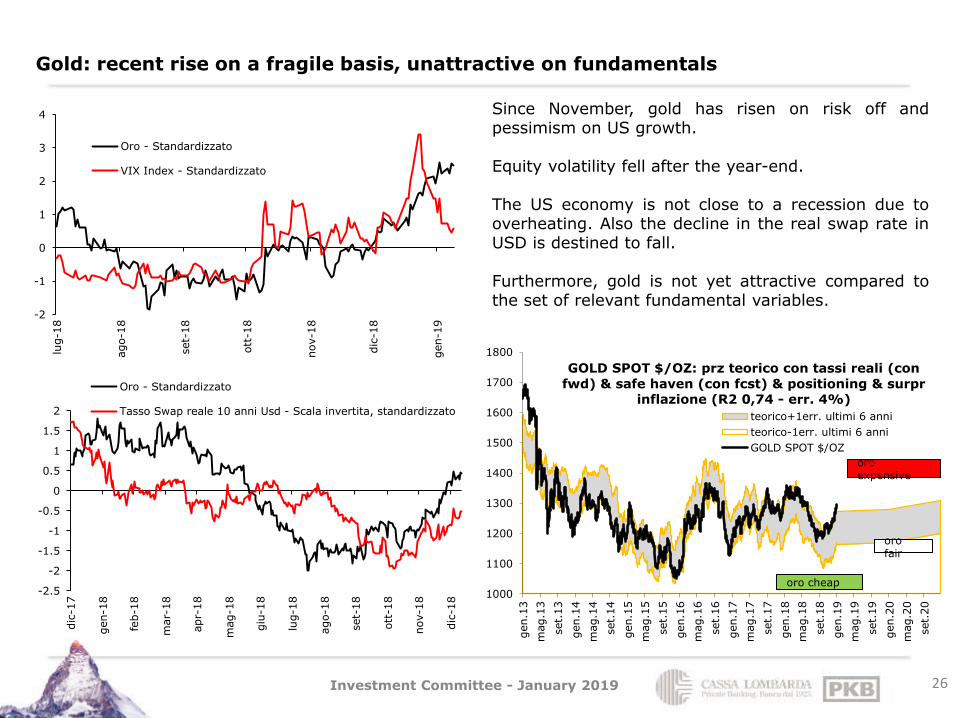
Gold: recent rise on a fragile basis, unattractive on fundamentals
Since November, gold has risen on risk off and pessimism on US growth. Equity volatility fell after the year-end. The US economy is not close to a recession due to overheating. Also the decline in the real swap rate in USD is destined to fall. Furthermore, gold is not yet attractive compared to the set of relevant fundamental variables.
1000
1100
1200
1300
1400
1500
1600
1700
1800
gen.1
3
mag.1
3
set.
13
gen.1
4
mag.1
4
set.
14
gen.1
5
mag.1
5
set.
15
gen.1
6
mag.1
6
set.
16
gen.1
7
mag.1
7
set.
17
gen.1
8
mag.1
8
set.
18
gen.1
9
mag.1
9
set.
19
gen.2
0
mag.2
0
set.
20
GOLD SPOT $/OZ: prz teorico con tassi reali (con
fwd) & safe haven (con fcst) & positioning & surpr inflazione (R2 0,74 - err. 4%)
teorico+1err. ultimi 6 anni
teorico-1err. ultimi 6 anni
GOLD SPOT $/OZ
oro cheap
oro expensive
oro fair
-2
-1
0
1
2
3
4
lug-1
8
ago-1
8
set-
18
ott
-18
nov-1
8
dic
-18
gen-1
9
Oro - Standardizzato
VIX Index - Standardizzato
-2.5
-2
-1.5
-1
-0.5
0
0.5
1
1.5
2
dic
-17
gen-1
8
feb-1
8
mar-
18
apr-
18
mag-1
8
giu
-18
lug-1
8
ago-1
8
set-
18
ott
-18
nov-1
8
dic
-18
Oro - Standardizzato
Tasso Swap reale 10 anni Usd - Scala invertita, standardizzato
Investment Committee - January 2019
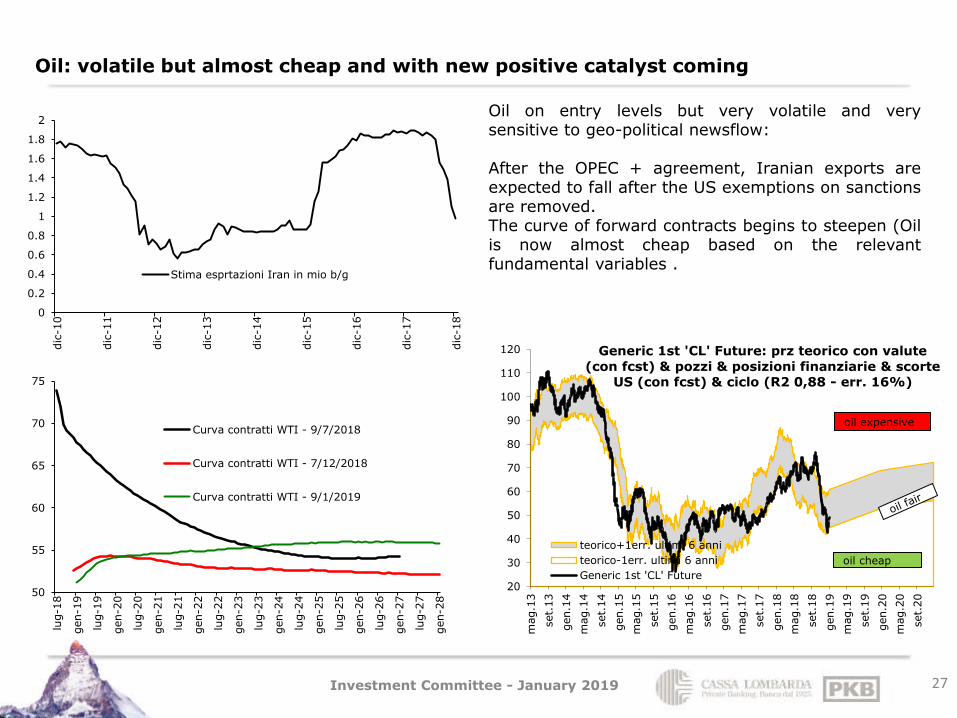
Oil: volatile but almost cheap and with new positive catalyst coming
27
Oil on entry levels but very volatile and very sensitive to geo-political newsflow: After the OPEC + agreement, Iranian exports are expected to fall after the US exemptions on sanctions are removed. The curve of forward contracts begins to steepen (Oil is now almost cheap based on the relevant fundamental variables .
20
30
40
50
60
70
80
90
100
110
120
mag.1
3
set.
13
gen.1
4
mag.1
4
set.
14
gen.1
5
mag.1
5
set.
15
gen.1
6
mag.1
6
set.
16
gen.1
7
mag.1
7
set.
17
gen.1
8
mag.1
8
set.
18
gen.1
9
mag.1
9
set.
19
gen.2
0
mag.2
0
set.
20
Generic 1st 'CL' Future: prz teorico con valute
(con fcst) & pozzi & posizioni finanziarie & scorte US (con fcst) & ciclo (R2 0,88 - err. 16%)
teorico+1err. ultimi 6 anni
teorico-1err. ultimi 6 anni
Generic 1st 'CL' Future
oil cheap
oil expensive
50
55
60
65
70
75
lug-1
8
gen-1
9
lug-1
9
gen-2
0
lug-2
0
gen-2
1
lug-2
1
gen-2
2
lug-2
2
gen-2
3
lug-2
3
gen-2
4
lug-2
4
gen-2
5
lug-2
5
gen-2
6
lug-2
6
gen-2
7
lug-2
7
gen-2
8Curva contratti WTI - 9/7/2018
Curva contratti WTI - 7/12/2018
Curva contratti WTI - 9/1/2019
0
0.2
0.4
0.6
0.8
1
1.2
1.4
1.6
1.8
2
dic
-10
dic
-11
dic
-12
dic
-13
dic
-14
dic
-15
dic
-16
dic
-17
dic
-18
Stima esprtazioni Iran in mio b/g
Investment Committee - January 2019

Fx: Eur cheap against Usd, rather expensive in the cross, mixed EM against euro
28
Valutazione di lungo periodo delle principali valute in termini reali
usd eur chf gbp jpy aud nzd cad nok sek
REER -6.6% +0.6% +2.5% +4.0% +0.4% +11.7% +4.5% +9.1% +3.9% +6.6%
/ usd / eur / chf / gbp / jpy / aud / nzd / cad / nok /sek
usd -7.0% -5.0% -10.6% -2.7% -18.9% -11.9% -10.5% -13.1% -13.2%
eur 7.0% 1.0% -5.3% 4.7% -10.3% -3.6% -7.1% -8.6% -8.1%
chf 5.0% -1.0% -5.5% -0.3% -13.9% -7.1% -6.4% -8.5% -7.5%
gbp 10.6% 5.3% 5.5% 9.9% -5.3% 1.0% 3.2% -3.2% -1.8%
jpy 2.7% -4.7% 0.3% -9.9% -13.5% -8.3% -9.5% -8.3% -11.0%
Distanza in % al trend di lungo periodo (PPP stimata)
Valutazione di lungo periodo delle principali valute EM
REER / usd / eur REER / usd / eur
cny +1.5% +6.4% -0.2% zar -1.1% +10.3% +4.5%
krw -3.2% +2.7% -4.1%
inr -1.7% +6.1% -0.2% try +25.3% +37.4% +33.1%
idr +2.2% +9.4% +3.1% rub +12.2% +20.9% +14.8%
php +2.7% +8.7% +0.6% czk -1.7% +5.0% -1.4%
thb -4.6% +0.3% -7.0% pln +2.4% +10.5% +2.6%
twd -2.8% +2.0% -5.6% huf +4.3% +11.1% +2.3%
brl +10.1% +21.3% +15.4% Media EM+3.6% +10.8% +4.0%
clp +4.4% +10.7% +4.0%
mxn +3.6% +9.4% +4.4% Distanza in % al trend di lungo
pen -0.0% +7.0% +1.7% periodo (PPP stimata)
Investment Committee - January 2019

Fx: Eur with evaluation support and momentum variation but Usd sustained by uncertainty
29
0.6
0.7
0.8
0.9
1
1.1
1.2
1.3
1.4
1.5
1.6
mag-7
8
mag-8
3
mag-8
8
mag-9
3
mag-9
8
mag-0
3
mag-0
8
mag-1
3
mag-1
8
Eur/Usd 1.1457
-1 dv std
Stima PPP (Bis-narrow) 1.2236
+ 1 dv std
cheap
expensive
-0.5
0
0.5
1
1.5
2
2.5
3
gen-1
0
gen-1
1
gen-1
2
gen-1
3
gen-1
4
gen-1
5
gen-1
6
gen-1
7
gen-1
8
gen-1
9
gen-2
0
gen-2
1
gen-2
2
OIS Eur 3 mesi
Forwards
OIS Usd 3 mesi
Forwards
-3
-2
-1
0
1
2
3
gen
-12
lug-
12
gen
-13
lug-
13
gen
-14
lug-
14
gen
-15
lug-
15
gen
-16
lug-
16
gen
-17
lug-
17
gen
-18
lug-
18
Citi Economic Surprise Index: Euroarea - US standardizzato
+ 1 Std
- 1 Std
-4%
-3%
-2%
-1%
0%
1%
2%
3%
set-
05
set-
06
set-
07
set-
08
set-
09
set-
10
set-
11
set-
12
set-
13
set-
14
set-
15
set-
16
set-
17
set-
18
set-
19
set-
20
set-
21
Crescita a/a Eurozona - US
Previsione su base IMF
Investment Committee - January 2019
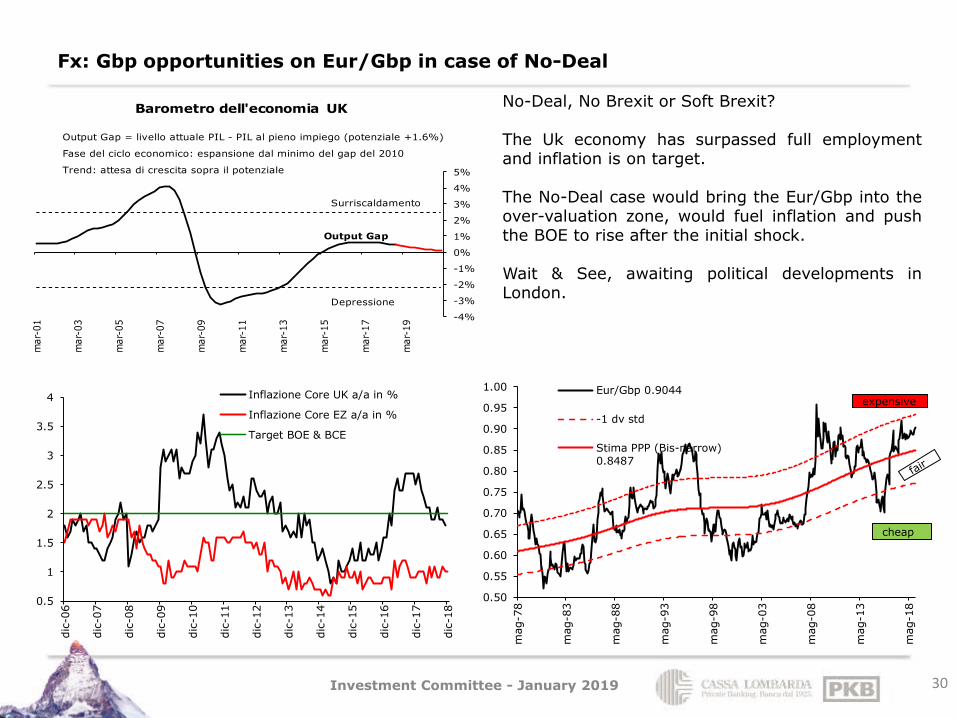
Fx: Gbp opportunities on Eur/Gbp in case of No-Deal
30
No-Deal, No Brexit or Soft Brexit? The Uk economy has surpassed full employment and inflation is on target. The No-Deal case would bring the Eur/Gbp into the over-valuation zone, would fuel inflation and push the BOE to rise after the initial shock. Wait & See, awaiting political developments in London.
expensive
cheap
Output Gap = livello attuale PIL - PIL al pieno impiego (potenziale +1.6%)
Fase del ciclo economico: espansione dal minimo del gap del 2010
Trend: attesa di crescita sopra il potenziale
Surriscaldamento
Output Gap
Depressione
-4%
-3%
-2%
-1%
0%
1%
2%
3%
4%
5%
mar-
01
mar-
03
mar-
05
mar-
07
mar-
09
mar-
11
mar-
13
mar-
15
mar-
17
mar-
19
Barometro dell'economia UK
0.5
1
1.5
2
2.5
3
3.5
4
dic
-06
dic
-07
dic
-08
dic
-09
dic
-10
dic
-11
dic
-12
dic
-13
dic
-14
dic
-15
dic
-16
dic
-17
dic
-18
Inflazione Core UK a/a in %
Inflazione Core EZ a/a in %
Target BOE & BCE
0.50
0.55
0.60
0.65
0.70
0.75
0.80
0.85
0.90
0.95
1.00
mag-7
8
mag-8
3
mag-8
8
mag-9
3
mag-9
8
mag-0
3
mag-0
8
mag-1
3
mag-1
8
Eur/Gbp 0.9044
-1 dv std
Stima PPP (Bis-narrow)0.8487
Investment Committee - January 2019

Fx: Sek and Nok to hold, inflation to support, oil to support the Nok
31
expensive
cheap
expensive
cheap
5
6
7
8
9
10
11
12
mag-7
8
mag-8
3
mag-8
8
mag-9
3
mag-9
8
mag-0
3
mag-0
8
mag-1
3
mag-1
8
Eur/Sek 10.2274
-1 dv std
Stima PPP (Bis-narrow) 9.3794
+ 1 dv std
6
6.5
7
7.5
8
8.5
9
9.5
10
10.5
mag-7
8
mag-8
3
mag-8
8
mag-9
3
mag-9
8
mag-0
3
mag-0
8
mag-1
3
mag-1
8
Eur/Nok 9.7513
-1 dv std
Stima PPP (Bis-narrow) 8.9391
+ 1 dv std
30
50
70
90
110
130
150
75
80
85
90
95
100
105
dic
-07
dic
-08
dic
-09
dic
-10
dic
-11
dic
-12
dic
-13
dic
-14
dic
-15
dic
-16
dic
-17
dic
-18
Nok REER (scala sn)
Petrolio WTI (scala ds)
-1
0
1
2
3
4
5
nov-1
0
nov-1
1
nov-1
2
nov-1
3
nov-1
4
nov-1
5
nov-1
6
nov-1
7
nov-1
8
nov-1
9
CPI EurozonaPrevisione ConsensoCPI NorvegiaPrevisione ConsensoCPI SveziaPrevisione Consenso
Investment Committee - January 2019
Disclaimer The information and opinions contained in this report have been obtained from public sources believed to reliable. No representation or warranty is made or implied that is accurate or complete. Any opinions expressed in this report are subject to change without notice. This report has been prepared solely for information purposes and if so decided, for private circulation and does not constitute any solicitation to buy or sell any instrument, or to engage in any trading strategy. Sources: PKB / Cassa Lombarda calculations on Bloomberg data, unless otherwise stated
32
Asset Management & Products
Investment Committee - January 2019


![Clean organic lines define today’s contemporary€¦ · DINING ROOM [ 12] Modena Double Pedestal Dining Table 911-876C 78W x 44D x 30H in. Extends to 100 inches wide with one 22-inch](https://img.dokumen.tips/doc/110x75/6006d29ccc5c6c1bd25a81e4/clean-organic-lines-define-todayas-contemporary-dining-room-12-modena-double.jpg)