Embed Size (px)
Citation preview

Presentation to PPC Cost to communicate (2) 7 November 2014

1. Reflection: Cost to communicate 2008 – 2012 (Cape Town 30 November 2012)
2. Cost to communicate 2012 onwards
3. South Africa achievements
4. International ranking and challenges towards available, accessible and affordable services
5. Comparison
6. Concluding thoughts
Contents

Reflection: Cost to Communicate 2008 - 2012 Cape Town 30 November 2012

• 44% decrease in effective prepaid PPM to 79c
• 30% decrease in effective total PPM to 1.07c
R
1.53
1.07 1.41
0.79
June'08
Blended ppm Prepaid ppm
Pricing: Blended and prepaid
June’12
Pricing: Data
R 0
R 200
R 400
R 600
R 800
R 1 000
R 1 200
500MB Price
1GB Price
2GB Price
• 88.5% decrease in 1GB data package from R599 to R69 (24 Month Mobile Broadband)
• Out of bundle rate decreased by 90% from R10 to R1 per MB
Reducing the cost to communicate 2008-2012 Prices are declining and will continue to go down due to…
…. effective competition in the telecommunications market.
1 988 3 149
4 737 793
1 009
1 140 24
164
FY2010 FY2011 FY2012
Smartphones
PC Connectivity
Tablets
5
Active data devices Data revenue contribution
• 87% increase in data revenue service contribution for period
Active data customers ‘000
• 82% increase in active data customers
• 117% increase in active data devices
Data growth 2008-2012 Broadband demand is …
7.5
9.1
11
.9 1
4.0
FY2009 FY2010 FY2011 FY2012
% of service revenue
6 685
8 997
12 182
FY2010 FY2011 FY2012
Internet Users
‘000
…. fuelled by smartphones and tablets.

Cost to communicate 2012 onwards Cape Town 7 November 2014

The journey: Significant progress in transforming pricing…
Pricing Transformation
Data growth
Simplification
Investment • Invested heavily in network to carry more traffic as prices are reduced. • Invested in increased coverage especially 3G/4G.
• Substantially reduced pricing for voice and data. • Much more value offered. • Launched worry free innovations – RED, PowerHour, My5, Everyday Extra, SMS
• All tariffs are simple & transparent – On net, All net, Anytime offers. • Old tariffs shifted to legacy. • Proactive migration in place for both voice and data legacy plans.
• Significant data growth to supplement declining voice revenues.
Bundles • On net bundles and all net bundles to drive down cost to communicate and target low end users.
Where to next… • Work proactively to build network capacity to maintain best network experience. • Embed and activate new pricing through education campaigning.
…. delivering value to customers.
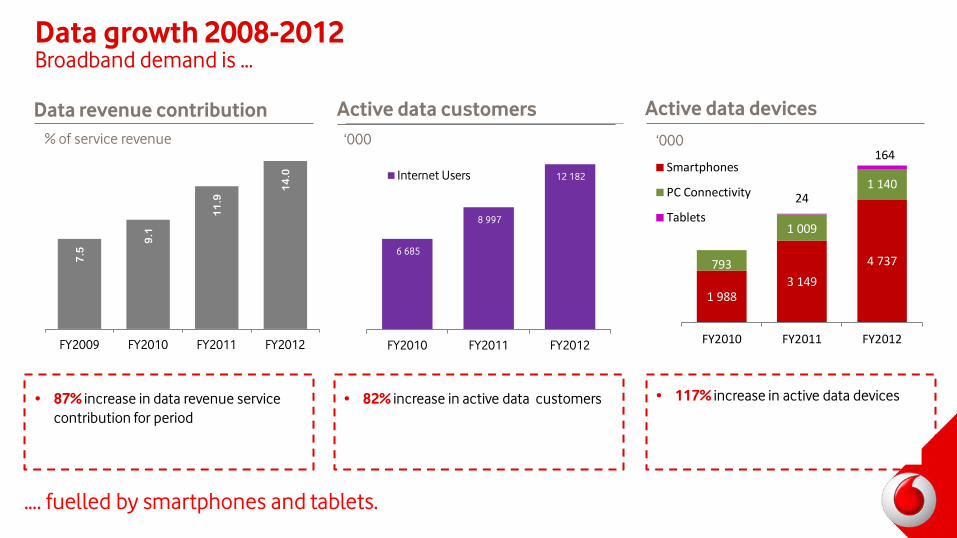
The journey: Prepaid pricing catering for…
…. access and affordability.

Vodacom Smart/Red
Subscription (no device)
Subscription (with device)
Voice Data SMS
Smart S R149 R 199 75 200 200
Smart M R229 R 299 120 300 300
Smart L R379 R 499 250 500 500
Smart XL R529 R 699 400 800 800
Red Advantage R749 R 999 700 1 GB Limitless
Red Premium R1199 R 1 599 1 200 2 GB Limitless
Red VIP R1499 R 1 999 Limitless 5 GB Limitless
• Simplified price plans with any network anytime pricing.
• Substantial value added.
• Integrated price plans with smartphones included driving data adoption.
The journey: Simplified and much more value…
…. to Contract customers.

0.91
0.68
0.64
0.46
Blended ppm Prepaid ppm
The journey: Further price reductions and more choice
• Converted 63% of voice only contracts to Smart and Red plans
• 28% decrease in effective prepaid PPM to 46c
• 25% decrease in effective blended PPM to 68c
• 26% increase in total outgoing voice traffic
R
• 83% of monthly gross connections in Top Up are on uChoose plans
37
63
Voice plans Integrated plans
Pricing: Blended and prepaid Hybrid: Smart and flexi plans Contract: Integrated plans %
Jun 14
Prices continued to decline
Jun 13

• 18.4% increase in data revenue
The journey: Accelerating take-up of mobile data
25.8% of service revenue
Data contribution Active data devices
• Smartphone average usage up 44.5% to 312MB
‘000
Active data customers
• 25.0% growth in active data customers
‘000
12 182 14 385 16 996
FY2012 FY2013 Q1 2015
Active data customers Penetration
43.5% 48.1%
52.3%
4 737 5 967 7 393
1 140
1 129
1 073 164
364
567
FY2012 FY2013 Q1 2015
Smartphones PC connectivity Tablets
12
Broadband demand is …
…. fuelled by smartphones and tablets.

The journey: Simple and transparent engagement
Retail Call Centre Online Self Service
Direct
…. towards informed decisions on service provider, service and tariff.

The journey: Customer satisfaction We track our net promoter score (‘NPS’) on a monthly basis …
…. our key measure of customer satisfaction.
South Africa achievements

25%
42% 44% 51% 55% 64% 67% 71%
79% 89%
96%
126% 134%
145% 148%
Mad
agas
car
Mal
awi
DRC
(ex-
Zaire
)
Moz
ambi
que
Tanz
ania
Swaz
iland
Ango
la
ave
Zam
bia
Leso
tho
Zim
babw
e
Nam
ibia
Mau
ritiu
s
Sout
h Af
rica
Bots
wan
aSource: GSMA, Intelligence (2015-2017 estimates)
Mobile penetration and coverage SA has a vibrant mobile market
Population Coverage
…. 3G where we have 2G.
3G 94.1%
2G 99.9% Vodacom’s accelerated capital investment programme
• Completed network RAN renewal – 4G ready
• 2000 LTE sites
• 76% of sites connected to own high capacity transmission network

International ranking and challenges towards available, accessible and affordable services

Brazil Russia India China South Africa
Ranking for period 2012 2014 2012 2014 2012 2014 2012 2014 2012 2014
Network Readiness Index 66 69 56 50 69 83 51 62 72 70
Source:http://www3.weforum.org/docs/WEF_GlobalInformationTechnology_Report_2014.pdf
• SA continued to show robust growth.
• SA’s global ranking improved based on certain important improvements in the penetration of ICTs among individuals.
• SA has overtaken India and ranks favourable with Brazil and China.
South Africa’s ranking improved Network Readiness Index
…..favourable compared with Brazil and China

Spectrum challenge: Timely assignment is vital for growth
European Regulators assigned 800MHz spectrum between 2010 and 2013
When will Regulators in Africa follow suite?
Source Vodafone and ITU IDI*: Global ICT Development Index 2012
7 8 11 16 19 23 24 27 30 31 32 34 36
42
55
69
80 84 86
113 116 121
142 147 148
0
20
40
60
80
100
120
140
160
0
20
40
60
80
100
120
140
160
180
200
IDI R
anki
ng
Am
ount
of S
pect
rum
(MH
z)
Operators & IDI Rankings (ITU)
Amount of Spectrum Allocated (MHz) IDI ranking
…correlates with ITU ICT Development Ranking
The amount of assigned spectrum…

Other challenges … • Site acquisition
– High rentals
– Cumbersome approval process
– Objections from public
– Lack of policy or alignment of policy in municipalities
– Long lead times to obtain AC power
• Fibre and microwave deployment – Way leaves
– Cumbersome approval process
– One-trench policy
– Mast space and strength on existing infrastructure

Comparison

Coverage Pricing
http://explorer.netindex.com/maps#
Speed
Technology e.g. LTE
Internet users
http://techtalkafrica.com/south-african-internet-users-infographic.html
Investment
Penetration Devices
Comparison against peer countries Performance indicators should amongst other consider…
8.4
…. in assessing SA’s global ranking.

Concluding thoughts
Concluding thoughts • Prices continue to decline
• Increased customer centricity
• Increased investment in coverage and capacity
• Spectrum required towards further improvement
• Be assured of Vodacom’s commitment

Thank you
29


![Thursday, 7 April 2016]13 - pmg-assets.s3-website-eu-west ...pmg-assets.s3-website-eu-west-1.amazonaws.com/161102report.pdf · Thursday, 7 April 2016]13 ANNOUNCEMENTS, TABLINGS AND](https://img.dokumen.tips/doc/110x75/5ed0cef86415977ed94590ee/thursday-7-april-201613-pmg-assetss3-website-eu-west-pmg-assetss3-website-eu-west-1.jpg)