Embed Size (px)
Citation preview

“PresentationOffice of Rural Health Programs and
Department of Family and Community Medicine by
Dr. Daryl J. Hobbs
December 10,2003
http://www.oseda.missouri.edu

Population1990 - 2000

Change in Population 1980-2000
•Missouri’s population increased from 4,917,000 in 1980 to 5,117,000 in 1990 – an increase of 4.1 percent.
•Population increased from 5,117,000 in 1990 to 5,595,000 in 2000 – an increase of 9.3 percent – more than double the increase during the 1980s.
•However, national population which increased by 9.8 percent during the 1980s increased by 13.1 percent in 2000. There were 29 states whose population increased by a larger percentage than Missouri during the 1990s.
•Therefore, even though Missouri population increased by more than twice the rate in the 1990s than during the 1980s, it dropped from being the 15th most populated state in 1990 to 17th in 2000.


Missouri’s Metro and Non-Metro PopulationMissouri’s Metro and Non-Metro Population
SOURCE: USDC, Bureau of the Census, Census of Population and Housing [2000 SF1; 1990 STF1]Table produced by: University Outreach and Extension, Office of Social and Economic Data Analysis (Feb. 2002)
Number Percent Births DeathsNatural
IncreaseNet Migration
478,138 9.3 753,673 534,120 219,553 258,585
303,930 8.7 533,051 335,423 197,628 106,302
92,061 9.4 151,194 92,855 58,339 33,722100,232 5.3 289,492 181,937 107,555 -7,323111,637 18.3 92,365 60,631 31,734 79,903174,208 10.7 220,637 198,711 21,926 152,282
Change, 1990-2000 Components of Change, 1990-2000


The Missouri Census Data Center has created a report that shows the just released definitions of Core Based Statistical Areas for Missouri. The CBSA's are a replacement for the metropolitan areas. We still have entities called MSA's (Metropolitan Statistical Areas) but the criteria for defining them has changed. It changed just enough to allow Jefferson City to now be classified as an MSA even though it does not have a central city of 50,000. Instead it has a "core area" with 50,000 people and it doesn't matter whether this population cluster happens to all fall within an incorporated place. Entirely new micropolitan areas have also been created based on the same concept as MSAs except the core area does not have to be as large. Missouri has lots of these.

Population Change2000 - 2002


5,62
9,70
7
5,59
5,21
1
5,56
1,94
8
5,52
1,76
5
5,48
1,19
3
5,43
1,55
3
5,37
8,24
7
5,32
4,49
7
5,27
1,17
5
5,21
7,10
1
5,17
0,80
0
5,12
8,88
0
5,11
6,90
1
4,800,000
4,900,000
5,000,000
5,100,000
5,200,000
5,300,000
5,400,000
5,500,000
5,600,000
5,700,000
1-Ju
l-90
1-Ju
l-91
1-Ju
l-92
1-Ju
l-93
1-Ju
l-94
1-Ju
l-95
1-Ju
l-96
1-Ju
l-97
1-Ju
l-98
1-Ju
l-99
April
1 20
00
1-Ju
l-01
1-Ju
l-02
Total Population Estimates by Year, 1990-2002Missouri
SOURCE: Federal-State Cooperative Program for Population EstimatesProduced by: University Outreach and Extension – Office of Social and Economic Data Analysis (6/12/03)

44,3
48
34,4
96
33,2
6340
,183
40,5
72
49,6
4053,3
06
53,7
50
53,3
2254
,074
46,3
01
41,9
20
0
10,000
20,000
30,000
40,000
50,000
60,000
Jul '9
0 - J
ul '91
Jul '9
1 - J
ul '92
Jul '9
2 - J
ul '93
Jul '9
3 - J
ul '94
Jul '9
4 - J
ul '95
Jul '9
5 - J
ul '96
Jul '9
6 - J
ul '97
Jul '9
7 - J
ul '98
Jul '9
8 - J
ul '99
Jul '9
9 - A
pr '00
Apr '0
0 - J
ul '0
1
Jul '0
1 - J
ul '02
Change in Total Population Estimates by Year, 1990-2002Missouri
SOURCE: Federal-State Cooperative Program for Population EstimatesProduced by: University Outreach and Extension – Office of Social and Economic Data Analysis (6/12/03)

357,8
60
357,3
05
358,1
32
358,3
80
357,9
01
357,3
66
356,5
43
354,3
01
352,3
07
350,6
81
348,0
93
345,9
57
344,2
14
335,000
340,000
345,000
350,000
355,000
360,000
1-Apr-9
0
1-Ju
l-91
1-Ju
l-92
1-Ju
l-93
1-Ju
l-94
1-Ju
l-95
1-Ju
l-96
1-Ju
l-97
1-Ju
l-98
1-Ju
l-99
April
1 20
00
1-Ju
l-01
1-Ju
l-02
Total Population Estimates by Year, 1990-2002Southeast Missouri Extension Region
SOURCE: Federal-State Cooperative Program for Population EstimatesProduced by: University Outreach and Extension – Office of Social and Economic Data Analysis (6/12/03)

555
-827-2
48
47953
582
3
2,24
2
1,99
4
1,62
6
2,58
8
2,13
6
1,74
3
-1,000
-500
0
500
1,000
1,500
2,000
2,500
3,000
Jul '9
0 - J
ul '91
Jul '9
1 - J
ul '92
Jul '9
2 - J
ul '93
Jul '9
3 - J
ul '94
Jul '9
4 - J
ul '95
Jul '9
5 - J
ul '96
Jul '9
6 - J
ul '97
Jul '9
7 - J
ul '98
Jul '9
8 - J
ul '99
Jul '9
9 - A
pr '00
Apr '0
0 - J
ul '0
1
Jul '0
1 - J
ul '02
Change in Total Population Estimates by Year, 1990-2002Southeast Missouri Extension Region
SOURCE: Federal-State Cooperative Program for Population EstimatesProduced by: University Outreach and Extension – Office of Social and Economic Data Analysis (6/12/03)

744,6
81
737,2
73
728,0
89
719,6
82
708,5
11
697,4
47
685,0
20
671,9
24
655,3
25
636,6
26
618,9
47
604,8
53
591,2
77
0
100,000
200,000
300,000
400,000
500,000
600,000
700,000
800,000
1-Apr-9
0
1-Ju
l-91
1-Ju
l-92
1-Ju
l-93
1-Ju
l-94
1-Ju
l-95
1-Ju
l-96
1-Ju
l-97
1-Ju
l-98
1-Ju
l-99
April
1 20
00
1-Ju
l-01
1-Ju
l-02
Total Population Estimates by Year, 1990-2002Southwest Missouri Extension Region
SOURCE: Federal-State Cooperative Program for Population EstimatesProduced by: University Outreach and Extension – Office of Social and Economic Data Analysis (6/12/03)

7,40
8
9,18
4
8,40
7
11,1
71
11,0
6412,4
2713,0
96
16,5
9918
,699
17,6
79
14,0
94
13,5
76
0
2,000
4,000
6,000
8,000
10,000
12,000
14,000
16,000
18,000
20,000
Jul '9
0 - J
ul '91
Jul '9
1 - J
ul '92
Jul '9
2 - J
ul '93
Jul '9
3 - J
ul '94
Jul '9
4 - J
ul '95
Jul '9
5 - J
ul '96
Jul '9
6 - J
ul '97
Jul '9
7 - J
ul '98
Jul '9
8 - J
ul '99
Jul '9
9 - A
pr '00
Apr '0
0 - J
ul '0
1
Jul '0
1 - J
ul '02
Change in Total Population Estimates by Year, 1990-2002Southwest Missouri Extension Region
SOURCE: Federal-State Cooperative Program for Population EstimatesProduced by: University Outreach and Extension – Office of Social and Economic Data Analysis (6/12/03)

Age of the Population

Percent Change in Missouri Population by Percent Change in Missouri Population by Age Cohorts, 1990-2000Age Cohorts, 1990-2000
0.2
11.9
3.6
-13.3
29.6
10.9
3.2
21.4
-15
-10
-5
0
5
10
15
20
25
30
SOURCE: USDC, Bureau of the Census, Census of Population and Housing, Summary File 1 (2000); Summary Tape File 1 (1990)Produced by: The Office of Social and Economic Data Analysis, UOE [E.J. Cleveland, Nov. 2001]


Missouri Transfer Payments, 1999 ($000)Missouri Transfer Payments, 1999 ($000)
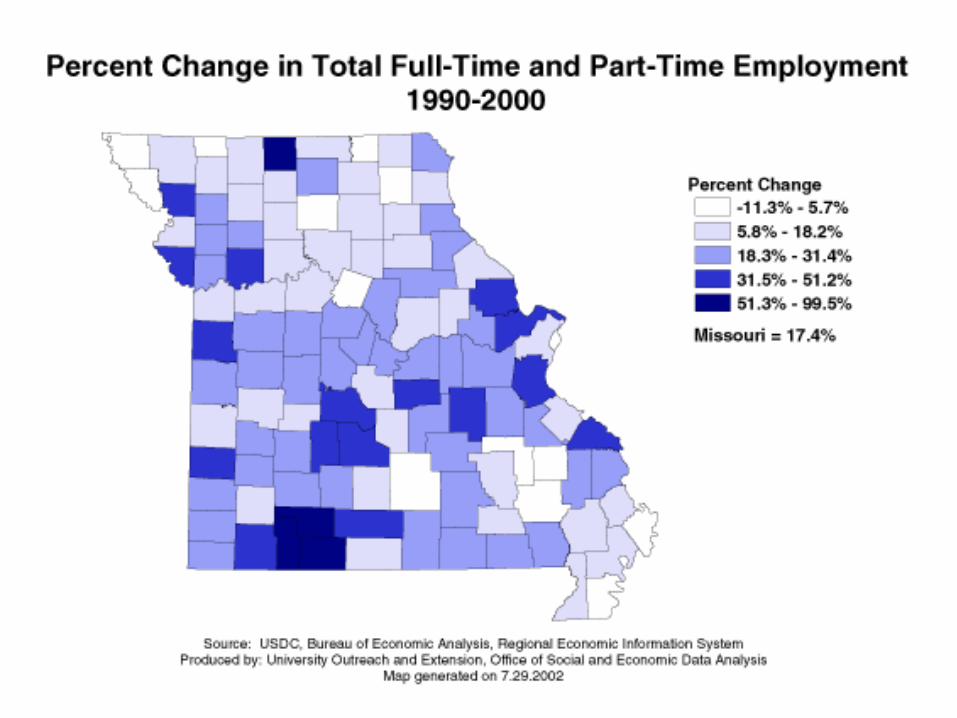
Source: USDC, Bureau of Economic Analysis, Regional Economic Information System
1999Pct. Of
Total
Total Transfer Payments 20,965,085
Retirement & Disability Insurance Benefit Payments 8,773,930 41.9Social Security 8,424,338 40.2Other 349,592 1.7Medical Payments 8,402,601 40.1Medicare Payments 4,615,910 22.0Public Assistance Medical Care 3,752,158 17.9Military Medical Insurance Payments 34,533 0.2Income Maintenance Benefit Payments 1,765,870 8.4Supplemental Security Income (SSI) Payments 489,243 2.3Family Assistance 234,759 1.1Food Stamps 350,967 1.7Other Income Maintenance 690,901 3.3Unemployment Insurance Benefits Payments 298,001 1.4State Unemployment Insurance Compensation 289,968 1.4Other Unemployment Compensation 122 0.0Veterans Benefit Payments 493,154 2.4Fed Ed. & Train. Assist. Payments (excl. vets) 213,183 1.0Other Payments To Individuals 12,948 0.1Payments To Nonprofit Institutions 590,840 2.8Federal Government Payments 145,778 0.7State and Local Government Payments 262,794 1.3Buisness Payments 182,868 0.9Buisness Payments To Individuals 414,558 2.0


Education

To work, a modern economy needs a mass welleducated work force. An educated elite will notsuffice. Illiteracy hurts the literate.
~Lester Thurow


Income


Minorities


Missouri Hispanic Population, 1990-2000Missouri Hispanic Population, 1990-2000
NOTE:* Newton is a metropolitan county but is included in the Top 8 agriculture producing counties** The eight Missouri counties having the greatest agricultural commodity sales also had the greatest non-metro Hispanic population increases during the 1990sSource: USDC, Bureau of the Census, "Census of Population and Housing"
2000 1990 Number Percent 2000 1990
Missouri 118,592 61,702 56,890 92.2 2.1 1.2
Total Metropolitan Areas* 88,137 49,315 38,822 78.7 2.4 1.5
NonMetropolitan Counties 30,455 12,207 18,248 149.5 1.5 0.7Top 8 Agriculture Producing Counties** 6,638 815 5,823 714.5 4.0 0.6Remainder of Non-Metro Counties 23,817 11,392 12,425 109.1 1.3 0.7
Change Pct. Of Total Population
Hispanic Population

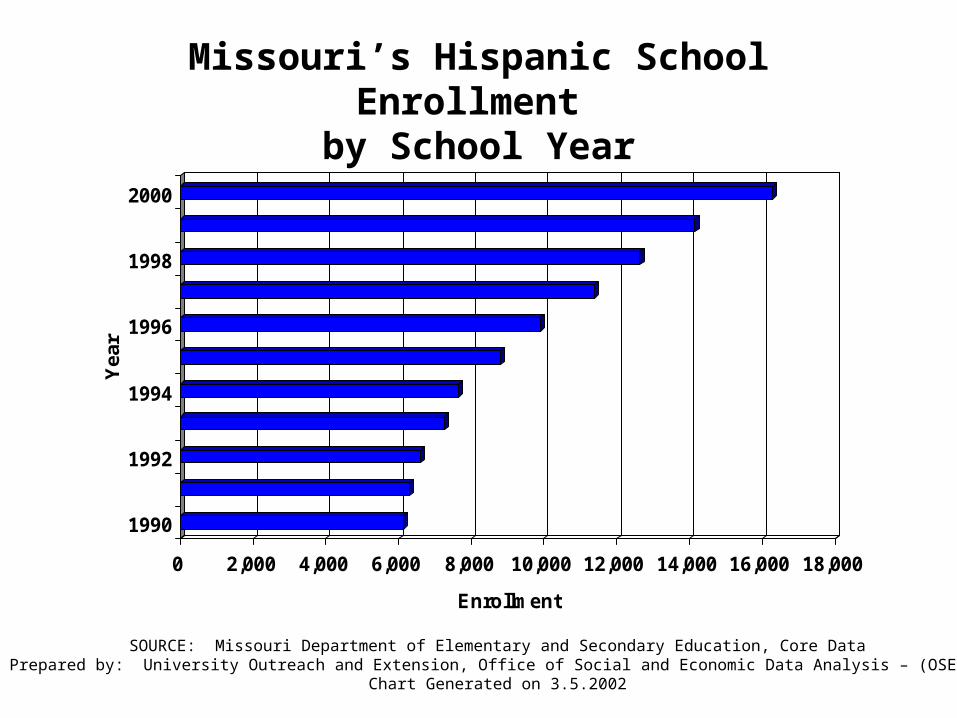
Missouri’s Hispanic School Enrollment by School Year
0 2,000 4,000 6,000 8,000 10,000 12,000 14,000 16,000 18,000
Enrollment
1990
1992
1994
1996
1998
2000
Yea
r
SOURCE: Missouri Department of Elementary and Secondary Education, Core DataPrepared by: University Outreach and Extension, Office of Social and Economic Data Analysis – (OSEDA)
Chart Generated on 3.5.2002


Missouri's Hispanic Population by Age Cohorts1990-2000
0 5 10 15 20 25
Age Cohorts
Under 5
5 to 17
18 to 24
25 to 34
35 to 54
55 to 64
65 to 84
85 or Older
Per
cen
t
1990 2000
SOURCE: USDC, Bureau of the Census, Census of Population and Housing [2000 SF1; 1990 STF1]Prepared by: University Outreach and Extension, Office of Social and Economic Data Analysis – (OSEDA)
Chart Generated on 3.5.2002

Missouri’s Hispanic School Enrollment by School Year
0 2,000 4,000 6,000 8,000 10,000 12,000 14,000 16,000 18,000
Enrollment
1990
1992
1994
1996
1998
2000
Yea
r
SOURCE: Missouri Department of Elementary and Secondary Education, Core DataPrepared by: University Outreach and Extension, Office of Social and Economic Data Analysis – (OSEDA)
Chart Generated on 3.5.2002

Hispanic School Enrollment in McDonald County by School Year
0 50 100 150 200 250 300 350 400 450
Enrollment
1990
1992
1994
1996
1998
2000
Ye
ar
SOURCE: Missouri Department of Elementary and Secondary Education, Core DataPrepared by: University Outreach and Extension, Office of Social and Economic Data Analysis – (OSEDA)
Chart Generated on 3.5.2002

Hispanic School Enrollment in Taney County by School Year
0 20 40 60 80 100 120 140 160
Enrollment
1990
1992
1994
1996
1998
2000
Ye
ar
SOURCE: Missouri Department of Elementary and Secondary Education, Core DataPrepared by: University Outreach and Extension, Office of Social and Economic Data Analysis – (OSEDA)
Chart Generated on 3.5.2002

Households


Kids Count

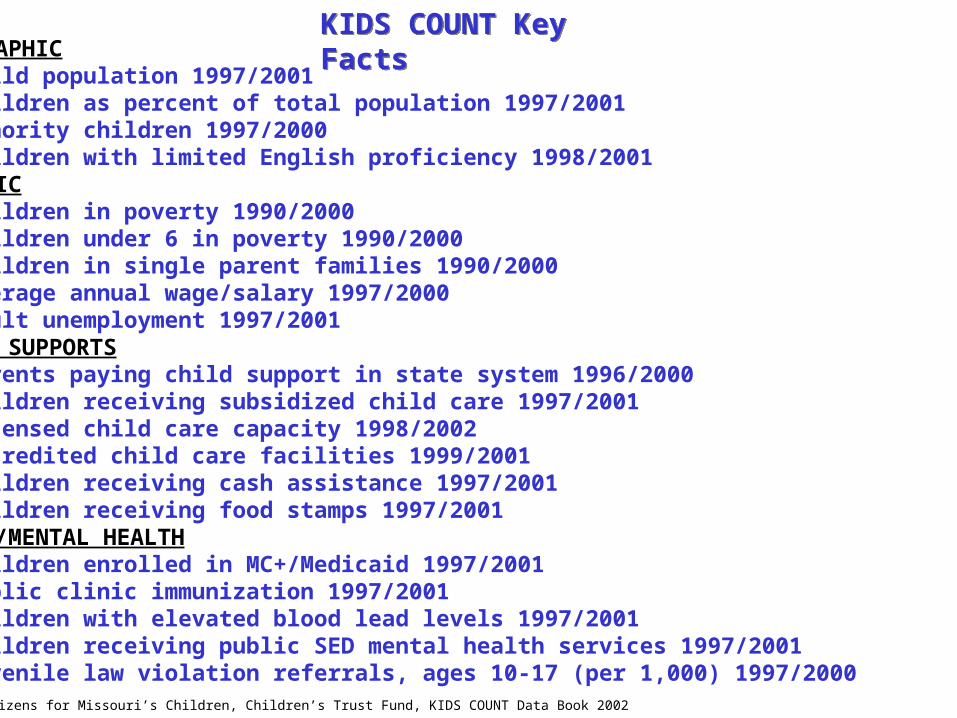
KIDS COUNT Key FactsKIDS COUNT Key FactsDEMOGRAPHIC
Child population 1997/2001Children as percent of total population 1997/2001Minority children 1997/2000Children with limited English proficiency 1998/2001
ECONOMICChildren in poverty 1990/2000Children under 6 in poverty 1990/2000Children in single parent families 1990/2000Average annual wage/salary 1997/2000Adult unemployment 1997/2001
FAMILY SUPPORTSParents paying child support in state system 1996/2000Children receiving subsidized child care 1997/2001Licensed child care capacity 1998/2002Accredited child care facilities 1999/2001Children receiving cash assistance 1997/2001Children receiving food stamps 1997/2001
HEALTH/MENTAL HEALTHChildren enrolled in MC+/Medicaid 1997/2001Public clinic immunization 1997/2001Children with elevated blood lead levels 1997/2001Children receiving public SED mental health services 1997/2001Juvenile law violation referrals, ages 10-17 (per 1,000) 1997/2000
Source: Citizens for Missouri’s Children, Children’s Trust Fund, KIDS COUNT Data Book 2002

KIDS COUNT Outcome MeasuresKIDS COUNT Outcome Measures
Students enrolled in free/reduced lunch 1997/2000
Births to mothers without h.s. diploma 1997/2001
Low birthweight infants 1992-96/1997-2001
Infant mortality (per 1,000 live births) 1992-96/1997-2001
Child deaths, ages 1-14 (per 100,000) 1992-96/1997-2001
Child abuse and neglect (per 1,000) 1997/2001
Out-of-home placement entries (per 1,000) 1997/2001
Annual high school dropouts 1997/2001
Births to teens, ages 15-19 (per 1,000) 1997/2001
Violent deaths, ages 15-19 (per 100,000) 1992-96/1997-2001Source: Citizens for Missouri’s Children, Children’s Trust Fund, KIDS COUNT Data Book 2002


Pct Eligible for Free & Reduced Price Lunch


Pct Births to mothers with less than 12 years education


Low Birth Weight (%) Moving Avg


Births to teenage mothers 15-19 (Per 1,000)

Child deaths per 100,000 kids ages 1-14


Infant deaths per 1,000 birth


Child abuse/family assessment per 1,000

Regionalization

REGIONALIZATION WORK RETAIL TRADE HEALTH CARE IMPLICATIONS
Community Public Finance


To obtain 2000 County to County Work Flow Reports go to:
http://mcdc2.missouri.edu/data/workflow/reports/

SOURCE: USDC, Bureau of the Census, Census 2000Produced by: The Missouri State Census Data Center
Counts of Workers Commuting INTO Pike CountyEach Flow Represents at Least .5% of All Trips Ending in
Pike County
Work Flows Into
Total work tripsending
in CountyWork Flows From
Work Flows
Pike County 6,604 Pike Co. 5,167
Pike Co. IL 502
Lincoln Co. 229
Audrain Co. 174
Ralls Co. 155
Marion Co. 127
St. Charles Co. 85

Counts of Workers Commuting FROM Pike CountyEach Flow Represents at Least .5% of All Trips Originating in
Pike County
SOURCE: USDC, Bureau of the Census, Census 2000Produced by: The Missouri State Census Data Center
Work Flows From
Total work tripsoriginatingin County
Work Flows into County
Work Flows
Pike County 7,457 Pike Co. 5,167
Lincoln Co. 474
Audrain Co. 416
Marion Co. 359
St. Charles Co. 294
Ralls Co. 147
St. Louis Co. 146
St. Louis City 106
Warren Co. 61
Montgomery Co. 40
Pike Co. IL 38


School Enrollment1991-2003
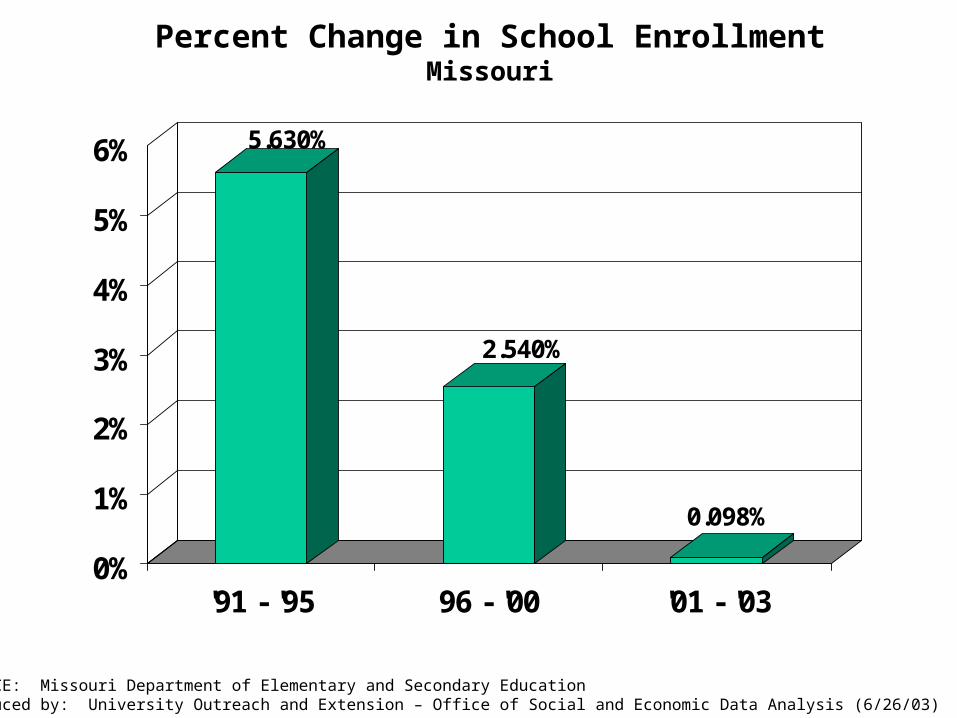
Percent Change in School EnrollmentMissouri
SOURCE: Missouri Department of Elementary and Secondary EducationProduced by: University Outreach and Extension – Office of Social and Economic Data Analysis (6/26/03)
5.630%
2.540%
0.098%
0%
1%
2%
3%
4%
5%
6%
'91 - '95 96 - '00 '01 - '03

893,
846
890,
199
892,
975
895,
624
896,
149
893,
618
884,
363
873,
469
862,
658
852,
437
841,
168
830,
150
816,
670
760,000
780,000
800,000
820,000
840,000
860,000
880,000
900,000
920,000
'199
1'1
992
'199
3'1
994
'199
5'1
996
'199
7'1
998
'199
9'2
000
'200
1'2
002
'200
3
Total School Enrollment by Year, 1991-2003Missouri
SOURCE: Missouri Department of Elementary and Secondary EducationProduced by: University Outreach and Extension – Office of Social and Economic Data Analysis (6/26/03)

3.6
-2.8-2
.6
-0.5
2.5
9.3
10.9
10.8
10.2
11.3
11.0
13.4
-4.0
-2.0
0.0
2.0
4.0
6.0
8.0
10.0
12.0
14.0
16.0
'91
- '92
'92
- '93
'93
- '94
'94
- '95
'95
- '96
'96
- '97
'97
- '98
'98
- '99
'99
- '00
'00
- '01
'01
- '02
'02
- '03
Annual Numerical Change in Total School Enrollment by Year, 1991-2003 (in thousands)
Missouri
SOURCE: Missouri Department of Elementary and Secondary EducationProduced by: University Outreach and Extension – Office of Social and Economic Data Analysis (6/26/03)

0.54
0.500.
600.70
0.90
1.701.
70
2.20
2.40
2.402.
50
1.70
0.0
0.5
1.0
1.5
2.0
2.5
3.0
'91
- '92
'92
- '93
'93
- '94
'94
- '95
'95
- '96
'96
- '97
'97
- '98
'98
- '99
'99
- '00
'00
- '01
'01
- '02
'02
- '03
Annual Numerical Change in Total School Enrollment by Year, 1991-2003 (in thousands)
Southwest Missouri Extension Region
SOURCE: Missouri Department of Elementary and Secondary EducationProduced by: University Outreach and Extension – Office of Social and Economic Data Analysis (6/27/03)

0.50
-0.8
0-1
.40-0
.30
2.00
5.10
5.00
4.20
3.20
4.60
3.30
6.30
-2.0
-1.0
0.0
1.0
2.0
3.0
4.0
5.0
6.0
7.0
'91
- '92
'92
- '93
'93
- '94
'94
- '95
'95
- '96
'96
- '97
'97
- '98
'98
- '99
'99
- '00
'00
- '01
'01
- '02
'02
- '03
Annual Numerical Change in Total School Enrollment by Year, 1991-2003 (in thousands)
East Central Missouri Extension Region
SOURCE: Missouri Department of Elementary and Secondary EducationProduced by: University Outreach and Extension – Office of Social and Economic Data Analysis (6/27/03)