Embed Size (px)
Citation preview

November 2014
Europe Outlook

Europe Outlook, November 2014
Section 1
Slow motion recovery and bumpy road ahead
Section 2
The drivers of growth: further policy measures to prevent headwinds
Section 3
Forecast: downward revision
Section 4
Some imbalances have been corrected, but the growth potential is reduced
Annex
Country breakdown
Index
Page 2

Europe Outlook, November 2014
Main messages
Page 3
1
2
The global expansion goes on slower than expected except in the US (and Mexico)
The likelihood of the risk scenario increases due to geopolitical risks and the lower traction of support policies
Volatility, extremely low until now, has increased a bit, quickly over a very short period. Warrants monitoring
Global GDP growth (%) Source: BBVA Research
How do we assess the growth stance in BBVA’s footprint?
US EMU Spain Mex
Latam-5
Turkey China Em. Asia Arg Ven Andean C.
2014 ↓↓ ↓↓ ↓↓ ↓↓
2015 ↓↓ ↓↓ ↓↓ ↓↓ ↓↓ ↓↓
No change:
Bias without change in the forecast:
Forecast revision relative to July’s MC:
2,9
-0,3
5,3
3,9
3,2 3,2 3,2
3,7
-4
-3
-2
-1
0
1
2
3
4
5
6
2008 2009 2010 2011 2012 2013 2014 2015
Developed Emerging World BBVA footprint
3

Europe Outlook, November 2014
The economic conditions are in place for growth: suitable funding conditions and less stringent fiscal policy
Page 4
Fiscal Stimulus General Government. Annual change (multiplied by -1) of the Cyclically Adjusted Primary Balance, pp of Potential GDP Source: BBVA Research with IMF Fiscal Monitor data. Oct-14
Central Banks, Balance Sheet, % GDP Source: BBVA Research with Haver data
-2,0
-1,5
-1,0
-0,5
0,0
0,5
1,0
United States Euro area Emerging Economies(G20)
2013 2014-15 (f)
Fiscal Stimulus
Fiscal Tightening
0%
10%
20%
30%
40%
50%
60%
Sep-0
8
Jun-0
9
Mar
-10
Dec
-10
Sep-1
1
Jun-1
2
Mar
-13
Dec
-13
Sep-1
4
BoJ ECB BoE Fed

Europe Outlook, November 2014
Page 5
BBVA Financial Stress Index Source: BBVA Research
Economic Surprises vs Consensus Citigroup Index (*) Source: Haver and Citigroup
(*) A positive (negative) reading of the Economic Surprise Index suggests that economic releases have on balance beating (below) Bloomberg consensus.
-70
-35
0
35
70
08
-Jan
-20
14
05
-Feb-2
01
4
05
-Mar
-20
14
02
-Ap
r-2
01
4
30
-Ap
r-2
01
4
28
-May
-20
14
25
-Jun-2
01
4
23
-Jul-2
01
4
20
-Au
g-2
01
4
17
-Sep-2
01
4
15
-Oct
-20
14
USA eurozone Emerging Markets
Positive surprises
Negative surprises -0.07
-0.05
-0.03
-0.01
0.01
-0.7
-0.5
-0.3
-0.1
0.1
0.3
8-J
an-1
4
5-F
eb-1
4
5-M
ar-
14
2-A
pr-
14
30-A
pr-1
4
28-M
ay-1
4
25-J
un-1
4
23-J
ul-14
20-A
ug-1
4
17-S
ep-1
4
15-O
ct-1
4
USA eurozone Emerging Markets, right
As of late volatility has increased from extremely low levels due to disappointing economic expectations …

Europe Outlook, November 2014
BBVA World Conflict Heat-map (3Q-2014) (Number of conflict / Total events) Source: www.gdelt.org & BBVA Research
Ukraine-Russia
IS advances in M. East
Ebola Outbreak
Social Unrest in Asia
Ceasefire in place but still fragile.
Sanctions 2.0 in place
Waiting for the Winter
Stop the IS advance: The Coalition strikes
A rapid spread but regional
The real “Black Swan”
Turkey’s low profile but key role
Thailand’s “déjà vu”
Democratic demands in Hong Kong
… and an accumulation of potential disruptions due to geopolitical tensions could impact on the economic scenario
Page 6

Europe Outlook, November 2014
Page 7
All in all, current indicators still point to an improvement in global economic growth in the second half of 2014
Global GDP growth based on BBVA-GAIN (QoQ %) Source: BBVA Research
… given: supportive funding conditions and confidence, both coherent with an easing mood from fiscal and monetary policies.
However, if volatility continues, there is a risk that further readings worsen
0,0
0,2
0,4
0,6
0,8
Ju
l 1
4
Cu
rre
nt
Est
Ju
l 1
4
Cu
rre
nt
Est
2Q13 3Q13 4Q13 1Q14 2Q14 3Q14 4Q14
Actual data Forecast
Indicators continue to point out towards a modest recovery in global growth, although probably heterogeneous) …

Europe Outlook, November 2014
US: Strong rebound in 2Q14 to be followed by growth over 2.5% in 2H14
Page 8
US: GDP growth (YoY Source: BBVA Research, BEA
US: BBVA Weekly Activity index % change Source: BBVA Research
-3
0
3
5
8
10
24
May-1
3
5 J
ul-
13
16
Au
g-1
3
27
Se
p-1
3
8 N
ov-1
3
20
De
c-13
31
Ja
n-1
4
14
Mar-
14
25
Ap
r-14
6 J
un
-14
18
Ju
l-14
29
Au
g-1
4
10
Oct-
14
2,22,0
2,5
0,0
0,5
1,0
1,5
2,0
2,5
3,0
3,5
2013 2014 2015
Oct-14 Jul-14
Europe Outlook, November 2014
US: the Fed sticks to its “no-plan” plan: monetary policy are “as slow as data allows”
Page 9
US: Fed Funds (%) Source: BBVA Research
Timing of the rate hike and the path of policy rate remains data dependent
A dovish bias seems arising from the delayed changes to forward guidance “to err on the
side of patience” and current lower inflationary pressures
0,00
0,25
0,50
0,75
1,00
1,25
1,50
1,75
2,00
Sep
-14
Dec-1
4
Ma
r-1
5
Jun-1
5
Sep
-15
Dec-1
5
Ma
r-1
6
Jun-1
6
Sep
-16
Dec-1
6
BBVA forecast Fed funds End of 1Q14
End of 2Q14 End of 3Q14 16 Oct 2014
4Q14
Expected End QE3
3Q15
First FFR Hike
1H16
Policy Normalization Let securities mature/sales
Timeline
Exit Strategy

Europe Outlook, November 2014
Page 10
China: manufacturing confidence and activity Source: BBVA Research, PMI
China: total social financing monthly level %, CNY100mn Source BBVA Research
3
6
9
12
15
18
21
36
40
44
48
52
56
60
Ma
r-0
7
Dec-0
7
Sep
-08
Jun-0
9
Ma
r-1
0
Dec-1
0
Sep
-11
Jun-1
2
Ma
r-1
3
Dec-1
3
Sep
-14
PMI Industrial Activity (rhs)
China: some negative surprises on activity and credit growth during the summer
Industry production fell sharply in August, due to sluggish domestic demand
The July-August adjustment in the new funding was driven by real estate
slowdown and shadow banking tighter control
4.000
8.000
12.000
16.000
20.000
Ma
r-1
0
Dec-1
0
Sep
-11
Jun-1
2
Ma
r-1
3
Dec-1
3
Sep
-14

Europe Outlook, November 2014
China: The baseline scenario unchanged expecting policy support
Page 11
China: GDP Growth (%, y-o-y) Source: BBVA Research
7,7
7,2 7,0
0
1
2
3
4
5
6
7
8
9
2013 2014 2015
Oct-14 Jul-14
Economic rebalancing from investment to consumption will continue, but slowly
Policies will need to support economic activity:
• Expected easing in monetary policy (RRR
cuts or liquidity injection)
• More balanced fiscal policy (expansionary at the central gov. level; consolidation at the local level)
• Push forward structural reforms.
Negative bias from foreign demand: Japan’s tax tightening and eurozone downward revision

Europe Outlook, November 2014
Section 1
Slow motion recovery and bumpy road ahead Section 2
The drivers of growth: further policy measures to prevent headwinds Section 3
Forecast: downward revision Section 4
Some imbalances have been corrected, but the growth potential is reduced Annex
Country breakdown
Index
Page 12

Europe Outlook, November 2014
What’s new in Europe
1) Incoming data: some downside risks materialized, both external (geopolitical) and idiosyncratic
Page 13
2) External environment: Ukraine crisis weighs on confidence and, therefore, on investment (Germany), and on exports, to a lesser extent
3) Credit: more evidence of a demand issue in the current situation, more than a supply one
5) Exchange rate: Euro depreciation after the ECB’s new measures and is projected to continue over the medium term and support growth
6) Monetary policy: higher likelihood of QE
4) France and Italy: deterioration in confidence; some progress in the reform agenda, but slower than expected
7) Fiscal policy: open debate about French, Italian and German deficits and investment in infrastructures. Less restrictive stance.

Europe Outlook, November 2014
1) Incoming data: weak growth in 3Q (0.2% QoQ)
Better-than-expected performance of the French economy
Growth driven by positive private consumption behavior; investment still weak
GDP growth (% QoQ) Source: BBVA Research
Eurozone: quarterly GDP growth (%) by components
4Q13 1Q14 2Q14
3Q14
Observed
BBVA
Research
GDP 0,3 0,3 0,1 0,2 0,1
Private consumption -0,1 0,2 0,3
Public consumption -0,2 0,7 0,2
Investment 0,3 0,6 -0,9
Inventories (1) -0,2 0,2 -0,2
Domestic demand (1) 0,0 0,4 0,0
Exports 1,1 0,3 1,3
Imports 0,4 0,6 1,3
Net exports (1) 0,3 -0,1 0,1
(1) Contributions to QoQ GDP growth.
Sources: Eurostat and BBVA Research
Page 14
-0,4
-0,2
0,0
0,2
0,4
0,6
0,8
EMU Germany France Italy Spain
3Q13 4Q13 1Q14 2Q14 3Q14

Europe Outlook, November 2014
1) Incoming data: recovery set back in 2H14
Significant fall in confidence over the summer across countries and sectors, linked to
geopolitical tensions
Disappointing hard data
In October the deterioration of confidence has stopped
Page 15
GDP Jun
Private consumption Jun
Public consumption Jun
Investment Jun
Exports Jun
Imports Jun
ESI Oct
Industrial confidence Oct
Consumer confidence Oct
Export order books Oct
Order books Oct
Unemployment expectations Oct
PMI manufacturing Oct
PMI services Oct
Industrial production Sep
Domestic new orders Aug
Foreign new orders Aug
Passenger car registration Sep
Retail Sales Sep
Exports of goods Aug
China Aug
USA Aug
Imports of goods Aug
Based on quarterly growth rates. For the latest
data, the average of available months in the
quarter is taken. For confidence data,
standarized values are used, and the growth
and fall are related to the mean.
2012 2013 2014
Nati
onal
acco
unts
So
ft d
ata
Hard
data

Europe Outlook, November 2014
1) Incoming data: very weak recovery in 2H14
MICA-BBVA GDP short term model (% QoQ) Sources: Haver and BBVA Research
Growth expected stable at 0.2% in 4Q; but data are very limited
By country, feeble growth across the region…
… except for Spain and Ireland
Forecast by country
Page 16
Germany France Italy Spain
0,3 0,2 0,1 0,5
-0,6
-0,4
-0,2
0,0
0,2
0,4
0,6
0,8
1,0
1,2
1Q
10
2Q
10
3Q
10
4Q
10
1Q
11
2Q
11
3Q
11
4Q
11
1Q
12
2Q
12
3Q
12
4Q
12
1Q
13
2Q
13
3Q
13
4Q
13
1Q
14
2Q
14
3Q
14
4Q
14
Series3 Series9 Series4 ObservedCI 20% CI 40% CI 60%

Europe Outlook, November 2014
2) Geopolitical tensions persist: trade channel (lower growth in Russia), but also impact on confidence
The eurozone exports to Russia are relatively small (4,5% goods, 3,3% services)
Russian GDP forecasts have been slashed about 2,5pp since the beginning of the conflict
Page 17
-15
-10
-5
0
5
10
Goods Services Average exports 3Q13-1Q14 (% YoY)
Eurozone: exports to Russia Source: ECB and BBVA Research
Export share
0.0
0.5
1.0
1.5
2.0
2.5
3.0
3.5
2014 2015 2016
Nov-13 Feb-14 Jun-14 Oct-14
Russia: annual GDP growth forecasts (%) Source: FocusEconomics

Europe Outlook, November 2014
2) And weak demand from developed countries
UEM: Exports by destination (%3m/3m) Source: BBVA Research
Page 18
Volatile but weaker exports lately
Exports to the UK and the rest of the EU have
maintained the tone
Weak demand from emerging markets
-2
-1
0
1
2
3
4
1Q12 2Q12 3Q12 4Q12 1Q13 2Q13 3Q13 4Q13 1Q14 2Q14 3Q14
Other European Union Other EuropeanAfrica AmericaAsia OceaniaRest Total

Europe Outlook, November 2014
Eurozone (% YoY) Note: Retail loans is the sum of loans to households and companies up to 1M€ Sources: BCE, Eurostat and BBVA Research
The new credit to large companies is still falling, partly because of their increased use of
the market
3) The new credit to households and small businesses has not taken off...
Page 19
-25
-20
-15
-10
-5
0
5
10
15
20
25
-6
-4
-2
0
2
4
6
Sep
-04
Ma
r-0
5
Sep
-05
Ma
r-0
6
Sep
-06
Ma
r-0
7
Sep
-07
Ma
r-0
8
Sep
-08
Ma
r-0
9
Sep
-09
Ma
r-1
0
Sep
-10
Ma
r-1
1
Sep
-11
Ma
r-1
2
Sep
-12
Ma
r-1
3
Sep
-13
Ma
r-1
4
Sep
-14
GDP
New RETAIL loans (t-2) (RHS)
Stock TOTAL loans (RHS)
The new credit and real variables (consumption and investment) are flows and are strongly
correlated (correlation of 0.9, compared to 0.6 with the stock of credit)
The new consumer credit and for small and medium enterprises has been growing for half a
year, but with some doubts

Europe Outlook, November 2014
3) … despite lower credit constraints
Page 20
-60
-40
-20
0
20
40
60
-0.015
-0.010
-0.005
0.000
0.005
0.010
0.015
1Q
20
03
3Q
2003
1Q
20
04
3Q
20
04
1Q
20
05
3Q
20
05
1Q
20
06
3Q
20
06
1Q
20
07
3Q
20
07
1Q
20
08
3Q
2008
1Q
20
09
3Q
20
09
1Q
20
10
3Q
20
10
1Q
20
11
3Q
20
11
1Q
20
12
3Q
20
12
1Q
2013
3Q
20
13
1Q
20
14
model error (LHS) credit standards (inverted, RHS)
-20
-15
-10
-5
0
5
10
15
20
-60
-40
-20
0
20
40
60
Q1
-04
Q3
-04
Q1
-05
Q3
-05
Q1
-06
Q3
-06
Q1
-07
Q3
-07
Q1
-08
Q3
-08
Q1
-09
Q3
-09
Q1
-10
Q3
-10
Q1
-11
Q3
-11
Q1
-12
Q3
-12
Q1
-13
Q3
-13
Q1
-14
Q3
-14
Credit standards (t-5) Loan demand (t-5)
Flow NFC (% YoY, RHS)
Eurozone: Flow , credit standards and loan demand Source: ECB and BBVA Research
Eurozone: Demand model estimation error and credit standards Source: ECB and BBVA Research
Higher correlation between credit flows and loan demand than with credit supply.
In 2008 and 2012, supply factors could explain a larger fall in credit to private sector.
Currently, limit evidence on supply constraints

Europe Outlook, November 2014
4) Italy / France: Lower growth momentum linked to internal issues
• GDP contracted in 2Q14 (-0,2% QoQ) and weak data for 3Q14
• The electoral and institutional reforms broadly on track (to be completed by February)
• Labour market reform launched (flexible dismissal), but details to be adopted throughout 2015
• Spending review delayed
• Growing internal impatience for the slowness of reforms
• Reduction of corporate and labour taxes to regain competitiveness
• € 50bn spending cut expected in 3 years (2.5% of GDP), but still to be detailed
• Launch of reforms in retail opening hours and professional services (December 2015)
• Deteriorated political landscape despite the government reshuffling.
Page 21
Italy
Fra
nce

Europe Outlook, November 2014
5) Stronger depreciation should help sustain the recovery in 2015…
The euro depreciation is due to: (a) Increasing cyclical divergence with US
(b) Increasing differences in monetary policy
Page 22
1.100
1.150
1.200
1.250
1.300
1.350
1.400
Ja
n-1
4
Ap
r-1
4
Ju
l-1
4
Oct-
14
Ja
n-1
5
Ap
r-1
5
Jul-1
5
Oct-
15
Ja
n-1
6
Ap
r-1
6
Ju
l-1
6
Oct-
16
Ja
n-1
7
Ap
r-1
7
Ju
l-1
7
Oct-
17
Jun-14 Sep-14
Dollar/Euro exchange rate Source BBVA Research
9% both in 2015 and 2016

Europe Outlook, November 2014
5) …with differenciated effects across countries
Projected impact: 0.3pp in 2015
Page 23
0.00
0.10
0.20
0.30
0.40
0.50
0.60
0.70
2014 2015 2016
Area Wide model ECM model (Max) OECD model
Eurozone: effect of euro depreciation on annual GDP growth (pp) Source OECD and BBVA Research
Larger impact on Italy and Germany than in Spain or France
Effect of euro depreciation on annual GDP growth (pp). ECM model Source BBVA Research
0.0
0.1
0.2
0.3
0.4
0.5
0.6
0.7
20
14
20
15
20
16
20
14
20
15
20
16
20
14
20
15
20
16
20
14
20
15
20
16
20
14
20
15
20
16
Germany France Italy Spain Eurozone
Min Max

Europe Outlook, November 2014
6) ECB: how to increase significantly its balance sheet? Running out of options
• Disappointing liquidity take up in September (€ 82.6bn). We
have to wait to December (higher demand expected).
• Next quarterly auctions will be correlated with credit (eg
growth)
• Difficult to quantify the volume and impact (particularly the
ABS program for the lack of details, such as the purchasing
conditions of the tranches with the higher risk)
TLTRO (4 years since
Sept 2014)
ABS and CB (2 years since
Q414, no target)
• More likely given recent data (activity and inflation
expectations), and difficulties to significantly expand the
balance with other measures.
• German opposition
QE ??
Liquidity
Purchase of
privates
assets
Purchase of
government
bonds?

Europe Outlook, November 2014
Mid
2017
• Details of the ABSPP and CBPP: • It did not announce a target size for the
private asset buying programmes • The programmes will last for at least two
years and they will commence in the fourth quarter of 2014
• Pending eligibility criteria for guaranteed mezzanine tranches
• The door remains open for (full scale) QE.
• Draghi said that: the ECB's balance sheet was just an instrument to achieve its inflation mandate.
• Recent comments continue to show discrepancies with the GC on next steps to be taken (full-scale QE)
ECB
Latest What do we expect? Policy pause until
BB
VA
Expect
ed
Tim
eline
18 Sept14
First rate hike
TLTROs
11 Dec14 Mar15 Jun15 Sep15 Dec15 Mar16 Jun16 Jun 17 TLTRO1
EUR 82,6 bn)
TLTRO2
TLTRO3 TLTRO4
TLTRO5 TLTRO6
TLTRO7 TLTRO 8
Purchase program of private assets (ABS and covered bonds)
Oct 14. CBPP starts
• We believe that the ECB´s commitment to increase significantly its balance sheet is credible, but current measures will not be enough. Consequently, a full-scale QE (i.e, purchase of government bonds) will be needed to fill the gap.
• The probability of QE has risen slightly above 50% in our baseline scenario.
• We postpone the ECB´s first rate hike to June 2017
6) The ECB in a wait and see stance

Europe Outlook, November 2014
7) Fiscal policy is less restrictive than in previous years...
Strucrural deficit adjustment 2010-2015 (% GDP) Source: BBVA Research
The adjustment of the structural deficit will be lower in 2014 than in previous years
The structural deficit after 2015 will remain positive and need further adjustment to meet
the fiscal rules
Page 26
-2
0
2
4
6
8
10
12
14
16
Portugal Ireland France Spain Italy Greece
Post 2015 2015 2014 2013 2012 2011
Intense debate on fiscal policy:
1. Room for Germany 2. Deficit in France and Italy 3. Junker’s plan on infrastructures

Europe Outlook, November 2014
Section 1
Slow motion recovery and bumpy road ahead Section 2
The drivers of growth: further policy measures to prevent headwinds Section 3
Forecast: downward revision Section 4
Some imbalances have been corrected, but the growth potential is reduced Annex
Country breakdown
Index
Page 27

Europe Outlook, November 2014
-10
-8
-6
-4
-2
0
2
4
6
2008 2009 2010 2011 2012 2013 2014 2015
Domestic Demand Exports Imports Net exports GDP
Forecast: weaker than expected growth both in 2014 and 2015
EMU: annual GDP growth contributions (pp) Sources: Eurostat and BBVA Research
2012 2013
2014
(f)
2015
(f)
Activity
REAL GDP (% YoY) -0,7 -0,4 0,8 1,3
Private consumption -1,3 -0,6 0,7 1,3
Public consumption -0,2 0,2 0,9 0,4
Investment -3,2 -2,4 0,6 1,8
Domestic demand (contr. %) -2,1 -0,8 0,8 1,1
Exports 2,6 1,1 3,7 5,1
Imports -1,0 1,2 4,1 5,2
Net exports (contr. %) 1,4 0,4 0,0 0,2
Current account balance(% GDP) 1,2 2,3 2,2 2,1
Public deficit (% GDP) -3,6 -2,9 -2,8 -2,6
CPI, % average 2,5 1,4 0,5 1,0
Page 28

Europe Outlook, November 2014
GDP forecast by country (%) Sources: Eurostat and BBVA Research
By country: downward revisions in the three largest countries
• Germany continues to lead the recovery but
with downward revision
• France doesn’t gain momentum yet
• Recently, positive measures have been
adopted to regain competitiveness and
reduce public spending
• Italy: still in recession in 2014
• Extensive reform plans, that need to be
materialized
Page 29
-0,7
-0,4
0,8
1,3
0,6
0,2
1,3 1,4
0,4 0,4 0,4
1,1
-2,3
-1,9
-0,3
0,8
-3,0
-2,5
-2,0
-1,5
-1,0
-0,5
0,0
0,5
1,0
1,5
2,0
2,5
20
12
20
13
20
14
20
15
20
12
20
13
20
14
20
15
20
12
20
13
20
14
20
15
20
12
20
13
20
14
20
15
EMU Germany France Italy
New projection (Oct-14) Last projection (Jul-14)

Europe Outlook, November 2014
Inflation is expected to stay at very low rates
Eurozone: inflation (% YoY) Sources: Eurostat and BBVA Research
Page 30
-1.0
-0.5
0.0
0.5
1.0
1.5
2.0
2.5
3.0
3.5
Dec-08
May-09
Oct-09
Mar-10
Aug-10
Jan-11
Jun-11
Nov-11
Apr-12
Sep-12
Feb-13
Jul-13
Dec-13
May-14
Oct-14
Mar-15
Aug-15
20% 40% 60% 80% 95%
0.0
0.5
1.0
1.5
2.0
2.5
3.0
Ja
n-0
4
Jul-0
4
Ja
n-0
5
Ju
l-0
5
Ja
n-0
6
Ju
l-0
6
Ja
n-0
7
Ju
l-0
7
Ja
n-0
8
Ju
l-0
8
Ja
n-0
9
Jul-0
9
Ja
n-1
0
Ju
l-1
0
Ja
n-1
1
Ju
l-1
1
Ja
n-1
2
Ju
l-1
2
Ja
n-1
3
Ju
l-1
3
Ja
n-1
4
Jul-1
4
Core HICP (% YoY) Core HICP at constant tax (% YoY)
1stre
ce
ssio
n
2n
dre
cess
ion
Eurozone: core inflation (% YoY) Source: Eurosat and BBVA Research
Inflation moderation over 3Q14 reflected falling prices of food and energy.
Core inflation broadly stable at low levels (0.8%)
Projected acceleration to only 1% due to the euro depreciation

Europe Outlook, November 2014
Inflation expectations worsened, increasing the risk of de-anchoring
Eurozone: inflation (% YoY) Source: BBVA Research
Page 31
Eurozone: 5Y5Y inflation swaps Source: BBVA Research
-1
0
1
2
3
4
5
Oct
-04
Apr-
05
Oct
-05
Apr-
06
Oct
-06
Apr-
07
Oct
-07
Apr-
08
Oct
-08
Apr-
09
Oct
-09
Apr-
10
Oct
-10
Apr-
11
Oct
-11
Apr-
12
Oct
-12
Apr-
13
Oct
-13
Apr-
14
Oct
-14
CI95 CI80 CI60
CI40 CI20 Optimal trim
HICP inflation Core inflation
1,70
1,80
1,90
2,00
2,10
2,20
5Y5Y EZ Inflation swap fwd
Eurozone 2Q GDP
Draghi at Jackson Hole
ECB meeting
ECB meeting
German trade data
Sell-off

Europe Outlook, November 2014
Risks
1. Lower growth abroad (China)
2. Impact from a problematic Fed exit
3. Geopolitical risks
1. AQR surprises
2. Risk of deflation and the burden of a recovery
with very low inflation
3. Lack of effectiveness of ECB’s measures and
market reversion
External
Domestic
Page 32
Old
1. Fed intolerance to dollar appreciation
2. Prolonged conflict with Russia
1. Rebound in confidence
2. More activism in European authorities
3. Further delays with reforms
4. Political risks (Catalonia, Le Pen, etc)
5. True secular stagnation
New

Europe Outlook, November 2014
Section 1
Slow motion recovery and bumpy road ahead Section 2
The drivers of growth: further policy measures to prevent headwinds Section 3
Forecast: downward revision Section 4
Some imbalances have been corrected, but the growth potential is reduced Annex
Country breakdown
Index
Page 33

Europe Outlook, November 2014
Low potential growth
Eurozone: potential GDP growth (%) and factors’ contribution (pp) Sources: Eurostat and BBVA Research
US and EZ projected potential GDP growth (pp) Sources: Eurostat and BBVA Research
The crisis has reduced the potential below 1%, but should recover to 1.5% Lower potential than in US
Page 34
-1
0
1
2
3
4
5
6
19
66
19
68
19
70
19
72
19
74
19
76
19
78
19
80
19
82
19
84
19
86
19
88
19
90
19
92
19
94
19
96
19
98
20
00
20
02
20
04
20
06
20
08
20
10
20
12
20
14
20
16
20
18
20
20
20
22
20
24
Capital Participation rate Active Population
Nairu TFP Potential
0,0
0,5
1,0
1,5
2,0
2,5
3,0
2014-2022 2014-2022
Capital Labour TFP
EMU
US

Europe Outlook, November 2014
The impact of the crisis: US vs core vs periphery
GDP Note: Q1-2008=100
Sources: Eurostat, Haver and BBVA Research
Components Note: Q1-2008=100
Sources: Eurostat, Haver and BBVA Research
Page 35
97,6
102,9
101,1
90,7
93,4
107,5
90
95
100
105
110
Ma
r-0
8Jun-0
8S
ep
-08
Dec-0
8M
ar-
09
Jun-0
9S
ep
-09
Dec-0
9M
ar-
10
Jun-1
0S
ep
-10
Dec-1
0M
ar-
11
Jun-1
1S
ep
-11
Dec-1
1M
ar-
12
Jun-1
2S
ep
-12
Dec-1
2M
ar-
13
Jun-1
3S
ep
-13
Dec-1
3M
ar-
14
Jun-1
4
Eurozone Germany France
Italy Spain USA
-60
-50
-40
-30
-20
-10
0
10
20
30
Euro area Germany France Italy Spain USA
Consumption Investment (w/o construction)
Investment in construction Exports

Europe Outlook, November 2014
Heat map of macroeconomic imbalances
Excluding aid to the financial sector **Data for France: 4Q-2012 Source: Eurostat, BCE, Haver and BBVA Research Page 36
Public DebtPublic Deficit*
Unemploy-ment Rate
Current Account
Net International Investment
Position
Real Effective Exchange
Rate
Nominal Unit Labour
Cost Household Debt
Non-Financial Corporations
Debt
% of GDP % of GDP % of GDP % of GDP 3-yr % chg. 3-yr % chg. % of GDP % of GDP
Q4-2013 2013 Latest 2013 Q4-2013** Sep. 2013 Latest Latest Latest
Eurozone 92,7 -2,8 11,8 2,4 -12,2 1,0 3,9 63,9 81,5
GER 78,4 0,0 5,1 7,5 48,3 0,1 6,1 58,2 48,5
FRA 93,5 -4,3 10,4 -1,4 -21,2 -0,7 5,2 56,7 84,0
AUT 74,5 -0,9 4,9 2,7 3,4 2,2 7,3 54,5 92,9
BEL 101,5 -2,8 8,5 -1,6 44,0 0,5 8,6 56,5 92,4
NED 73,5 -2,5 7,2 10,4 53,0 1,5 6,4 127,9 91,5
FIN 57,0 -2,1 8,5 -1,1 15,8 1,9 8,5 65,4 92,5
ITA 132,6 -3,1 12,7 1,0 -30,0 2,0 4,3 45,3 81,0
SPA 93,9 -6,6 25,3 0,8 -98,2 0,8 -5,3 81,3 114,0
POR 129,0 -4,5 15,2 0,5 -118,7 0,2 -1,3 86,8 130,8
IRE 123,7 -6,7 11,8 6,6 -104,9 -2,4 -3,4 105,1 201,3
GRC 175,1 -2,1 26,5 0,7 -119,0 -3,9 -11,1 64,5 64,8
DEN 44,5 -0,9 6,5 7,3 39,6 -1,4 3,8 139,2 97,9
SWE 40,6 -1,1 8,1 6,2 -4,8 3,1 6,2 83,4 121,2
U.K. 90,6 -5,7 6,7 -4,4 -1,3 3,9 6,2 93,1 83,8Colour criterion:
Higher than 130 Lower than -6 Higher than 16 Lower than -6 Lower than -100 Greater than 6 Greater than 9 Greater than 110 Greater than 140
110/130 -6/-5 13/16 -6/-4 -100/-50 4/6 6/9 90/110 120/140
90/110 -5/-4 10/13 -4/-2 -50/0 2/4 3/6 75/90 100/120
60/90 -4/-3 7/10 -2/0 0/20 0/2 0/3 60/75 80/100
Lower than 60 Higher than -3 Lower than 7 Greater than 0 Greater than 20 Lower than 0 Lower than 0 Lower than 60 Lower than 80

Europe Outlook, November 2014
Public and private debt 2005-2015 (% GDP) Sources: Eurostat and BBVA Research
Deleveraging isn’t in process yet, with exceptions
Private debt has stabilized and begun to fall in Spain
The peripheral countries have experienced much larger increases in debt than the core
during the crisis
Page 37
Spain
Portugal
France
Greece
Italy
Germany
Netherlands
0
20
40
60
80
100
120
140
160
180
80 130 180 230
Pu
blic
deb
t (%
GD
P)
Private debt (% GDP)
MacroeconomicImbalancesLimits
2005 X 2015

Europe Outlook, November 2014
Peripheral countries have reduced public deficits but public debts continue to grow
Government debt and deficit 2005–2015 Source: FMI
The adjustment of the deficit has been huge, especially in the countries subject to the
program
But debt levels have not begun to fall yet
The return to growth and higher inflation are key to rapid deleveraging
Page 38
Spain
France
Italy
Greece
Portugal
20
40
60
80
100
120
140
160
180
200
-16 -11 -6 -1 4
Genera
l G
overn
ment D
ebt
(% o
f G
DP
)
General Government Deficit (% GDP)
Maastricht deficit and debt limits
2005 X 2015

Europe Outlook, November 2014
Unit labour costs adjustment, 2009-2013 (%) Sources: Haver y BBVA Research
Unit labor costs have been adjusted rapidly in the periphery
In some countries this was due to increased productivity caused by the decline in
employment
Wage moderation has also played an important role, especially in comparison with the core
countries
Page 39
-20
-15
-10
-5
0
5
10
15
Gre
ece
Irela
nd
Sp
ain
Port
ug
al
EA
17
De
nm
ark
Ge
rma
ny
Ita
ly
Fra
nce
Ne
therl
and
s
Un
ite
d K
ing
dom
Au
str
ia
Fin
lan
d
Be
lgiu
m
Labour Productivity (Sign switched) Wages Unit Labour Cost

Europe Outlook, November 2014
Current account (% GDP) Sources: Eurostat and BBVA Research
The current account deficits have disappeared very fast
Current account (% GDP) Sources: Eurostat and BBVA Research
Most countries in the euro zone are now in surplus (except for France)
Part of the adjustment is due to the recession (less imports), but exports have also played an
important role
Page 40
-15,0
-10,0
-5,0
0,0
5,0
10,0
15,0
Mar-
01
Mar-
02
Mar-
03
Mar-
04
Mar-
05
Mar-
06
Mar-
07
Mar-
08
Mar-
09
Mar-
10
Mar-
11
Mar-
12
Mar-
13
Mar-
14
Germany France ItalySpain Portugal Netherlands
-20
-15
-10
-5
0
5
10
15
20
NLD
GE
R
IRL
AU
T
ITA
SP
A
GR
C
PO
R
FIN
FR
A
BE
L
Exports Imports Other items
Current account: 1Q08 Current account: 4Q13

Europe Outlook, November 2014
Unemployment since the beginning of the crisis (%) Sources: Haver and BBVA Research
The high unemployment remains the main problem of economic policy
The unemployment rate is well above that of 2008 (except in Germany)
Even so, it has begun to decrease earlier than in other recessions
Page 41
0
5
10
15
20
25
30
EA
18
GER
FR
A
AU
T
BEL
NLD
FIN
ITA
SPA
PO
R
IRE
GR
C
CYP
SLV
SLK
DEN
SW
E
UK
Last Feb-08 Feb-13

Europe Outlook, November 2014
Section 1
Slow motion recovery and bumpy road ahead Section 2
The drivers of growth: further policy measures to prevent headwinds Section 3
Forecast: downward revision Section 4
Some imbalances have been corrected, but the growth potential is reduced Annex
Country breakdown
Index
Page 42

Europe Outlook, November 2014
Germany: deterioration in the industrial sector 3Q14
Confidence indicators worsened over 3Q14
International conflicts have affected companies’ propensity to investment
2012 2013 2014 (f) 2015 (f)
Activity
REAL GDP (% YoY) 0,6 0,2 1,3 1,4
Private consumption 0,6 0,9 1,2 1,3
Public consumption 1,2 0,7 1,1 0,9
Investment 0,1 -0,6 3,2 3,3
Domestic demand (contr. %) -0,8 0,7 1,5 1,5
Exports 3,5 1,7 3,4 4,1
Imports 0,4 3,2 4,3 4,9
Net exports (contr. %) 1,4 -0,5 -0,1 0,0
External sector
Current account balance (% GDP) 7,2 7,3 6,7 7,1
Public finances
General Govt. Balance (% GDP) 0,1 0,1 0,0 0,0
Prices
CPI, % avg. 2,1 1,6 0,9 1,5
Page 43
GDP JunPrivate consumption JunPublic consumption JunInvestment JunExports JunImports Jun
ESI OctIndustrial confidence OctConsumer confidence OctService confidence Oct
Volume export order books OctVolume of order books OctUnemployment expectations Oct
Gfk consumer climate NovIfo business climate OctPMI manufacturing OctPMI services OctIndustrial production Sep
Domestic new orders SepForeign new orders Sep
Retail Sales SepExports of goods Aug
Intra EU AugExtra EU Aug
Imports of goods Aug
Based on quarterly growth rates. For the latest
data, the average of available months in the
quarter is taken. For confidence data,
standarized values are used, and the growth
and fall are related to the mean.
No DATAStronger growthGrowthFallDeeper fall
2012 2013 2014
Nati
on
al
acco
un
tsSo
ft d
ata
Hard
data

Europe Outlook, November 2014
Germany: slower growth with medium-term concerns
Ifo confidence, composite PMI and manufacturing orders from abroad Source: BBVA Research
Growth continues but at a slower pace than initially expected
Private consumption does not grow at rates consistent with the favorable labor market
conditions
The liberalization of some services sectors would help boost consumption and domestic
growth
Page 44
-10
-5
0
5
10
15
20
-1,0
-0,5
0,0
0,5
1,0
1,5
2,0
Jul-11
Sep-1
1
Nov-1
1
Jan-1
2
Mar-
12
May-1
2
Jul-12
Sep-1
2
Nov-1
2
Jan-1
3
Mar-
13
May-1
3
Jul-13
Sep-1
3
Nov-1
3
Jan-1
4
Mar-
14
May-1
4
Jul-14
Sep-1
4
Ifo confidence indexPMI CompositeForeign Manufacturing Orders (YoY, rhs)3-per M.A. (FMO)

Europe Outlook, November 2014
France: recovery doesn’t gain momentum
Confidence indicators fell sharply in Q3
Domestic demand continues to sustain the slow recovery
2012 2013 2014 (f) 2015 (f)
Activity
REAL GDP (% YoY) 0,4 0,4 0,4 1,1
Private consumption -0,4 0,3 0,2 1,1
Public consumption 1,7 2,0 1,7 0,5
Investment 0,3 -0,8 -0,6 1,1
Domestic demand (contr. %) -0,3 0,3 0,4 0,9
Exports 1,2 2,4 2,6 3,2
Imports -1,2 1,9 2,5 2,6
Net exports (contr. %) 0,7 0,1 0,0 0,1
External sector
Current account balance (% GDP) -2,1 -1,3 -1,7 -1,6
Public finances
General Govt. Balance (% GDP) -4,9 -4,1 -4,4 -4,3
Prices
CPI, % avg. 2,2 1,0 0,7 0,9
Page 45
GDP JunPrivate consumption JunPublic consumption JunInvestment JunExports JunImports Jun
ESI OctIndustrial confidence OctConsumer confidence Oct
Service confidence OctExport order books OctTotal order books OctUnemployment expectations Oct
Business Climate (INSEE) OctBusiness sentiment (BdF) OctPMI manufacturing OctPMI services OctIndustrial production SepDomestic turnover AugForeign turnover Aug
Capacity utilization (Industry) NovConsumer spending SepRetail Sales SepExports of goods Sep
Intra EU SepExtra EU Sep
Imports of goods SepBased on quarterly growth rates. For the latest
data, the average of available months in the
quarter is taken. For confidence data,
standarized values are used, and the growth
and fall are related to the mean.
No DATA
Stronger growth
Growth
Fall
Deeper fall
2012 2013 2014
Nati
onal
acco
unts
So
ft d
ata
Hard
data

Europe Outlook, November 2014
France: political instability slows reform process
Unit labour costs (2005=100) and current account balance Note: Unit labour costs normalized to 100 in 2005 Source: BBVA Research
The loss of competitiveness is the main issue in the medium term
The planned cuts in the tax burden on employment should be financed by lower public
spending
Page 46
But the government is negotiating to ease fiscal consolidation
-2,5
-2,0
-1,5
-1,0
-0,5
0,0
95
100
105
110
115
120
20
05
20
06
20
07
20
08
20
09
20
10
20
11
20
12
20
13
FRA Current Acc. Balance (%GDP) RHS
Eurozone
France
Germany
Spain

Europe Outlook, November 2014
Italy: the recession continues in 2014
Last confidence indicators have clearly worsened
Net exports no longer support the weak recovery
2012 2013 2014 (f) 2015 (f)
Activity
REAL GDP (% YoY) -2,3 -1,9 -0,3 0,8
Private consumption -4,1 -2,7 0,0 0,5
Public consumption -1,5 -0,7 0,0 -0,3
Investment -7,5 -5,4 -2,1 1,5
Domestic demand (contr. %) -5,0 -2,8 -0,4 0,6
Exports 1,6 0,9 2,0 3,8
Imports -8,2 -2,6 1,6 3,4
Net exports (contr. %) 2,6 0,9 0,2 0,3
External sector
Current account balance (% GDP) -0,2 1,0 0,9 0,9
Public finances
General Govt. Balance (% GDP) -3,0 -2,8 -3,0 -2,7
Prices
CPI, % avg. 3,3 1,3 0,3 0,7
Page 47
GDP JunPrivate consumption JunPublic consumption JunInvestment JunExports JunImports Jun
ESI OctIndustrial confidence OctConsumer confidence OctService confidence Oct
Export order books OctTotal order books OctUnemployment expectations Sep
Consumer confidence (ISTAT) OctBusiness confidence (ISTAT) JanPMI manufacturing JulPMI services JunIndustrial production Sep
Domestic new orders AugForeign new orders Aug
Capacity utilization rate SepPassenger car registrations OctRetail Sales AugExports of goods Aug
Intra EU AugExtra EU Sep
Imports of goods Aug
Fall
Deeper fall
Based on quarterly growth rates. For the latest
data, the average of available months in the
quarter is taken. For confidence data,
standarized values are used, and the growth
and fall are related to the mean.
2012 2013 2014
Nati
onal
acco
unts
So
ft d
ata
Hard
data
No DATA
Stronger growth
Growth

Europe Outlook, November 2014
Italy: reforms needed to increase the growth potential
GDP/working age population (2000=100) Source: BBVA Research In fiscal policy, the main problem is the high
volume of public debt (132.6%), while the deficit reduction is slower than expected
The growth potential is very slow …
…but could recover, should fiscal and labour market reforms underway be approved
Page 48
90
95
100
105
110
115
120
20
00
20
01
20
02
20
03
20
04
20
05
20
06
20
07
20
08
20
09
20
10
20
11
20
12
20
13
Italy Spain Eurozone

Europe Outlook, November 2014
Spain: recovery at a healthy pace
The growth will be driven by domestic and external factors, despite the lack of dynamism
in European demand
The trend in recent data points to a practical stabilization of growth around 0.5% in 3Q14
2012 2013 2014 (f) 2015 (f)
Activity
REAL GDP (% YoY) -2,1 -1,2 1,3 2,0
Private consumption -3,0 -2,3 2,1 1,8
Public consumption -3,7 -2,9 1,0 0,9
Investment -8,3 -3,7 0,7 4,2
Domestic demand (contr. %) -4,3 -2,7 1,6 2,0
Exports 1,2 4,3 3,7 5,3
Imports -6,3 -0,5 4,8 5,0
Net exports (contr. %) 2,5 1,5 0,0 5,5
External sector
Current account balance (% GDP) -0,3 1,4 1,2 2,1
Public finances
General Govt. Balance (% GDP) -6,6 -6,3 -5,5 -4,2
Prices
CPI, % avg. 2,4 1,4 0,0 1,0
Page 49
GDP JunPrivate consumption JunPublic consumption JunInvestment JunExports JunImports Jun
ESI OctIndustrial confidence OctConsumer confidence OctService confidence Oct
Export order books OctTotal order books OctUnemployment expectations Oct
Private cons. (synth. indicator) SepPMI manufacturing OctPMI services OctIndustrial production SepIndustrial new orders AugCapacity utilization rate NovMotor vehicle registrations OctRetail Sales SepExports of goods Aug
Intra EU JulExtra EU Jul
Imports of goods Aug
Stronger growth
Growth
Fall
Deeper fall
No DATA
2012 2013 2014
Nati
onal
acco
unts
So
ft d
ata
Hard
data
Based on quarterly growth rates. For the latest
data, the average of available months in the
quarter is taken.
For soft data, standarized values are used, and
the growth and fall are related to the mean.
Europe Outlook, November 2014
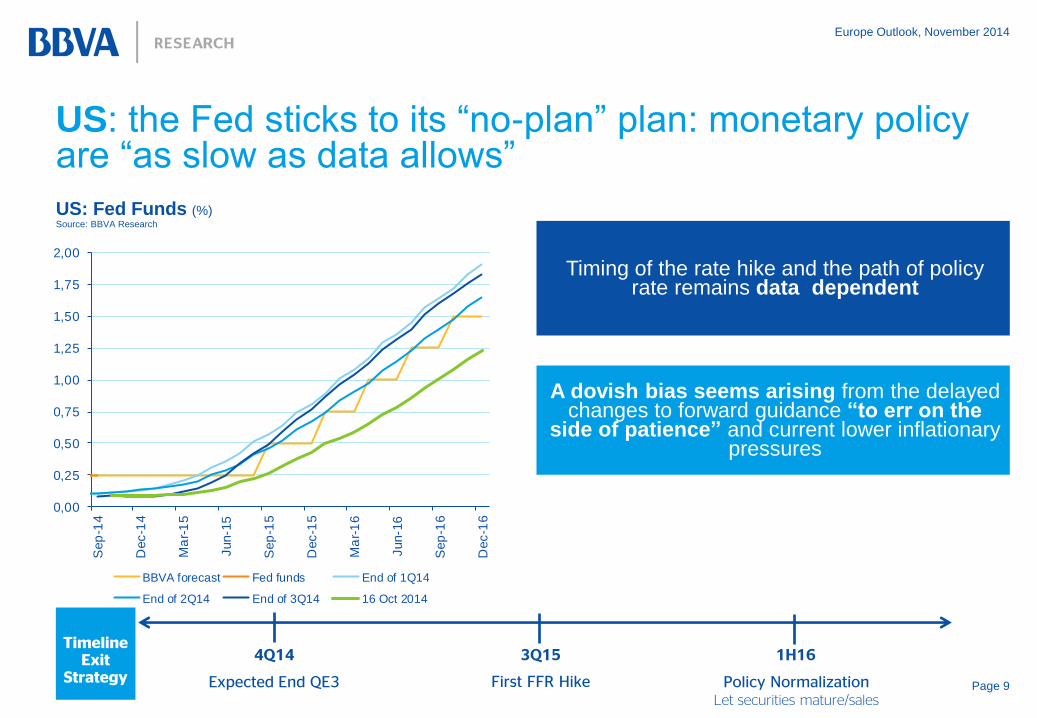
Spain: Investment in machinery & equipment (Real ratios, 2008 prices) Source: BBVA Research from INE
The recent increase in investment in machinery and equipment is consistent with the change in the production model oriented to the external
sector
The most urgent and important challenge is the sustained job creation, of the highest quality
possible
Need to take measures to improve productivity, competitiveness and human and technological
capital, among others
Spain: improvement in the labor market, but major imbalances persist
Page 50
4
5
6
7
8
9
10
Dec-8
1
Dec-8
3
Dec-8
5
Dec-8
7
Dec-8
9
Dec-9
1
Dec-9
3
Dec-9
5
Dec-9
7
Dec-9
9
Dec-0
1
Dec-0
3
Dec-0
5
Dec-0
7
Dec-0
9
Dec-1
1
Dec-1
3
Dec-1
5
% of GDP % of national demand


![When Lightning Strikes: Hadley v. Baxendale Probability ......15_O'GORMAN FINAL.DOCX (DO NOT DELETE) 4/1/2016 9:19 AM 2016] When Lightning Strikes 861 third (win, place, and show)](https://img.dokumen.tips/doc/110x75/60365441c550fc04ef6a3feb/when-lightning-strikes-hadley-v-baxendale-probability-15ogorman-finaldocx.jpg)