Embed Size (px)
Citation preview

83 - 96issn (en linea) 2014-9298 // issn (impresión) 2339-7500
The life of trend visual discourses A case study for Pollination
La vida de las tendencias visuales.Un caso de estudio sobre la Polinización
abstract This article presents a tool for visual discourse analysis that allows stylistic research indicators to be systema-tised.The tool, called Matrix for Documentary Analysis, is based on the theoretical aspects of visual semiotics. It can be used to describe or forecast the scope of trends in graphic design and visual communication. This article also presents a test carried out on a trend in logotype design in Spain during the first decade of the 21st century known as Pollination. The results confirmed that Pollination affects more the redesigned signs than the new de-signs, allowing us to think in a restyling trend phenomenon attached to the use of internet.
Keywords: visual communication; discourse analysis; graphic design; logotype
resumen El presente artículo propone una herramienta de análisis del discurso visual que permite sistematizar indica-dores estilísticos en las tendencias de diseño gráfico y comunicación visual. La herramienta, Matriz de Análisis Documental, se fundamenta en las bases teóricas de la semiótica visual. En este artículo se presenta también su rendimiento aplicado sobre el estudio de una tendencia en el diseño de logotipos, ocurrida en España en la primera década del siglo xxi, a la que hemos llamado Polinización. Los resultados confirman que afecta con más intensidad a los signos rediseñados que a los nuevos diseños, sugiriendo una tendencia asociada al uso de internet.
Palabras clave: comunicación visual; análisis de contenido; diseño gráfico; logotipo
# P13 Volumen 4. elena bartomeu magaña; Departament de Disseny i Imatge (Univer-sitat de Barcelona), EINA (Universitat Autónoma de Barcelona) [email protected]
Presentació: 04-04-2016 · Acceptació: 30-05-2016

The life of trend visual discourses. A case study for Pollination
La vida de las tendencias visuales. Un caso de estudio sobre la Polinización
84issn (en linea) 2014-9298 // issn (impresión) 2339-7500
INTRODUCTIONTrends in visual communication come one after another. As one disappears new trends are already emerging but all of them leave their marks of style and genre when they disappear and these are used by designers as graphic resources (Calvera, 1996: 37). They are integrated into different messages and lead to a series of meaning that outlast the life of the trend. One can therefore deduce that no trend is completely ephemeral or innocent. Rather, trends give shape and meaning to the graphic resources used by designers in their daily work (Bartomeu, 2012: 77).
This article proposes a tool for measuring trends and identifying them in the middle of the long mimetic chains that govern visual communication these days. To develop and adjust the measurement tool the phenomenon of a trend originated in the first decade of the 21th century was studied: we call it pollination. It has its roots in the last decade of the 20th, with the concepts of technokitsch (González Solas, 2002; Costa, 2004) and its counterpart in the USA, named techsavvy (Birdshall and Murphy, 2003). With the techsavvy and technokitsch phenomena, the logos and other secondary graphisms in the technology sector used codes with their own de-notation of electronic technology. Over time the code broke away from its sectoral reference and has remained in the visual field even though the technokitsch-techsavvy trend has now disappeared. From that breakaway moment the trend could be seen as the most myopic kind of hyperrealism (Costa, 2007) but here we have an aesthetic phenomenon linked to economic, social and technological change (Birdshall and Murphy, 2003).
Pollination, like many other phenomenon, could be defended on the basis of globalization. But beyond look-ing into the cause-effect relationship of globalization and the separation of graphic codes from their refer-ences, this article proposes a tool that weighs up the effects of that separation, of the code that is separated and the sediment that the trend leaves behind. So the questions to ask are: what is the semantic load of the sediment of a trend? What impact does it have on the future use of the graphic resources it exploits? How long will it last? And our main research question: is it possible to measure a visual trend?
SUBJECT OF RESEARCHThe main subject of research are visual trends in logotype design. We focused on a trend phenomenon called Pollination, which began in Spain in 2000. It can be recognised because the appearance of the logo-

The life of trend visual discourses. A case study for Pollination
La vida de las tendencias visuales.Un caso de estudio sobre la Polinización
85issn (en linea) 2014-9298 // issn (impresión) 2339-7500
types is increasingly indistinct as are the values that communicate with reference to the context. The visual discourses of the Corporate Visual Identity signs show progressive uniformization of the graphic resources and therefore the phenomenon was related to a trend.
Any trend may be understood as a set of phenomena on the rise. From contextual continuity a certain dis-continuity is perceived from a set of visual messages which, for different reasons, become more frequent. Changes create a discontinuity in the design praxis and help to bring together the indicators of an emerg-ing trend, which often manifests itself through the use of a series of messages and graphic resources. For example, we can confirm that during the first decade of the 21st century there has been a trend in interac-tive, three-dimensional logo design. We can see this by analysing their form but also, and especially, if we observe the sociotechnological frame that has led to an increase in companies operating online. Socially the companies that communicate values related to digital and interactive technology are held in higher regard and therefore all companies wishing to communicate values of innovation and cutting edge technology have to like the companies operating online. So formal indicators of latent interactivity or 3D effects constitute the top of the iceberg of a more complex change which remains submerged because it is invisible. What we can see and perceive is that there are more and more three-dimensional logotypes.
We can find other studies focusing on the changes occured on traditional media after the incursion of digital media. Carlos Scolari explains it as a translation of the gramathics of interactivity from digital to analogical world (Scolari, 2004). This translation includes composition changes in newspapers (Errea, 2007: 20-21) adapting space metaphors in magazine design (Bartomeu, 2012: 28), etc. In brand develop-ment we can find identity programs with more common points with data basis than traditional branding manuals (Kathman, 2002:32), where clients can reconfigurate their images in a sort of self-service of design. Ted Shida already predicted in 1996 that there will be changes in the design of corporate identity with the advent of the web and the entrance of branding in the digital world (Shida, 1996:60). After twenty years branding design adapted more or less their processess to new media, and, fortunally, there’s not too much blink three-dimensional logotypes. But these were just aproximations. In order to find out the intensity, duration and scope of Pollination we used a tool called Matrix for Documentary Analysis. It has been developed as part of a doctoral thesis on the trends (Bartomeu, Del Hoyo, 2012). The theoretical

The life of trend visual discourses. A case study for Pollination
La vida de las tendencias visuales. Un caso de estudio sobre la Polinización
86issn (en linea) 2014-9298 // issn (impresión) 2339-7500
basis of the study lies in design as a discipline, while the definition of the phenomenon of the trend takes place where sociosemiotics meets rhetoric, assimilating the analysis of a trend to its visual discourse.
To find out the impact of trends in the field of design, we set out with the affirmation that all trends are visual discourses. This affirmation is supported by three main arguments: visual discourse is a message with different levels of complexity (a), which combines different languages (b) and has its own method-ology for analysing trends (c). These three reasons, highlighted by Francesc Xavier Ruiz Collantes in the article ‘Per a una metodologia generativa de creativitat publicitària’ were developed with the aim of turning the methodologies for semiotic analysis of advertising messages into generative methodologies (1998: 221), as we can see in following section.
BACKGROUNDVisual discourse is not a simple enunciation (a); it integrates different levels of redesign and construc-tion of meaning. From a structural semiotic point of view (Greimas, 1973; Greimas and Courtés, 1982) visual discourse can be explained as a structure organised on a central axis with different levels of depth. The message is understood as a collection of deep and superficial levels of meaning, with the more abstract ideas lying at the deeper levels and the more concrete and perceptible meanings at the more superficial levels. On this scale formal and syntactic criteria are situated at the most superficial level and the criteria for iconicity and meaning at the deepest levels. The three levels that we will use strategically for an analysis of trends open up generative paths of meaning through transversally ap-plied operations. In the process of intermediate adjustment between the two extremes in this structure, the most abstract level can be expressed in verbal language and the most concrete through forms, colours, typographies and other elements of visual language (b). Structural semiotics is the discipline that has contributed most to the development of methods for analysing advertising messages (c) and at the same time enables those methods to be adapted to the different linguistic requirements of the visual resources that involve verbal and visual language (b). It also allows the concretion of visual dis-course to be articulated at different levels of interpretation (a), and therefore facilitates research into the phenomenon of a trend, which is at the heart of the exchange and stylization of meanings in a cultural context (Thurllow, G.; Aiello, C., 2006).
The life of trend visual discourses. A case study for Pollination
La vida de las tendencias visuales.Un caso de estudio sobre la Polinización
87issn (en linea) 2014-9298 // issn (impresión) 2339-7500
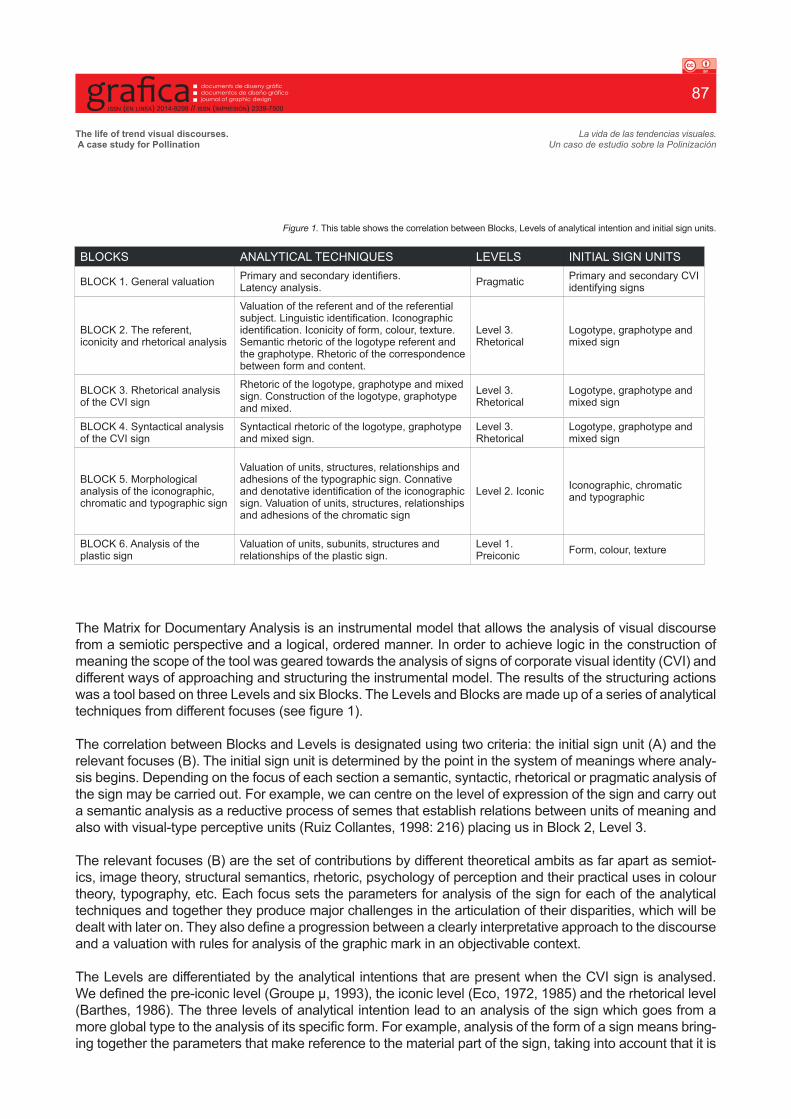
The Matrix for Documentary Analysis is an instrumental model that allows the analysis of visual discourse from a semiotic perspective and a logical, ordered manner. In order to achieve logic in the construction of meaning the scope of the tool was geared towards the analysis of signs of corporate visual identity (CVI) and different ways of approaching and structuring the instrumental model. The results of the structuring actions was a tool based on three Levels and six Blocks. The Levels and Blocks are made up of a series of analytical techniques from different focuses (see figure 1). The correlation between Blocks and Levels is designated using two criteria: the initial sign unit (A) and the relevant focuses (B). The initial sign unit is determined by the point in the system of meanings where analy-sis begins. Depending on the focus of each section a semantic, syntactic, rhetorical or pragmatic analysis of the sign may be carried out. For example, we can centre on the level of expression of the sign and carry out a semantic analysis as a reductive process of semes that establish relations between units of meaning and also with visual-type perceptive units (Ruiz Collantes, 1998: 216) placing us in Block 2, Level 3. The relevant focuses (B) are the set of contributions by different theoretical ambits as far apart as semiot-ics, image theory, structural semantics, rhetoric, psychology of perception and their practical uses in colour theory, typography, etc. Each focus sets the parameters for analysis of the sign for each of the analytical techniques and together they produce major challenges in the articulation of their disparities, which will be dealt with later on. They also define a progression between a clearly interpretative approach to the discourse and a valuation with rules for analysis of the graphic mark in an objectivable context. The Levels are differentiated by the analytical intentions that are present when the CVI sign is analysed. We defined the pre-iconic level (Groupe µ, 1993), the iconic level (Eco, 1972, 1985) and the rhetorical level (Barthes, 1986). The three levels of analytical intention lead to an analysis of the sign which goes from a more global type to the analysis of its specific form. For example, analysis of the form of a sign means bring-ing together the parameters that make reference to the material part of the sign, taking into account that it is
BLOCKS ANALYTICAL TECHNIQUES LEVELS INITIAL SIGN UNITS
BLOCK 1. General valuation Primary and secondary identifiers. Latency analysis. Pragmatic Primary and secondary CVI
identifying signs
BLOCK 2. The referent, iconicity and rhetorical analysis
Valuation of the referent and of the referential subject. Linguistic identification. Iconographic identification. Iconicity of form, colour, texture. Semantic rhetoric of the logotype referent and the graphotype. Rhetoric of the correspondence between form and content.
Level 3. Rhetorical
Logotype, graphotype and mixed sign
BLOCK 3. Rhetorical analysis of the CVI sign
Rhetoric of the logotype, graphotype and mixed sign. Construction of the logotype, graphotype and mixed.
Level 3. Rhetorical
Logotype, graphotype and mixed sign
BLOCK 4. Syntactical analysis of the CVI sign
Syntactical rhetoric of the logotype, graphotype and mixed sign.
Level 3. Rhetorical
Logotype, graphotype and mixed sign
BLOCK 5. Morphological analysis of the iconographic, chromatic and typographic sign
Valuation of units, structures, relationships and adhesions of the typographic sign. Connative and denotative identification of the iconographic sign. Valuation of units, structures, relationships and adhesions of the chromatic sign
Level 2. Iconic Iconographic, chromatic and typographic
BLOCK 6. Analysis of the plastic sign
Valuation of units, subunits, structures and relationships of the plastic sign.
Level 1. Preiconic Form, colour, texture
Figure 1. This table shows the correlation between Blocks, Levels of analytical intention and initial sign units.

The life of trend visual discourses. A case study for Pollination
La vida de las tendencias visuales. Un caso de estudio sobre la Polinización
88issn (en linea) 2014-9298 // issn (impresión) 2339-7500
possible to decontextualise the form of the meaning because there is another level that analyses meaning in context. The level that joins the structures to basic units of meaning is therefore made up of the analyti-cal techniques that allow the meaning of the sign to be analysed. It could be said that it is not so easy to separate the signifier and signified of signs and that the analysis should maintain a coherence as a set. This would not be an erroneous approach but the matrix anticipates different points of articulation that connect the analytical techniques through levels: these points of articulation are called Blocks. Moreover the defini-tion given to the different initial sign units (A) already includes a virtual separation between the signifier and the signified in Level I (the lowest) and for Block 6 (the highest).
This treatment can be synthesised in three units from which to interpret the CVI sign which, as mentioned above, are the initial sign units (see figure 2). And to facilitate the use of the model, we have designed an interactive matrix organised into Blocks (see figure 3).
METHODOLOGYWe carried out a validation plan in two phases for the following hypothesis: In 2000 begins in Spain the phe-nomenon of Pollination, as a standardization of graphic resources in signs of CVI1.
Phase 1:1) Initial estimation and comparative analysis of the signs. Comparison of logos redesigned from 2000. De-
termination of the area of acceptance for pollination values.2) Extensive analysis of signs. Development of suphypothesis. Analysis of the full sample. 3) Validation of the hypothesis, or not.4) Summary of results of the measurement system. Internal validation of the matrix as a measuring instru-
ment for pollination.
1. To find out when did the trend begun we studied the frame of the phenomenon in relationship with similar ones in the EEUU and UK. Both started in the middle nineties (Birdshall & Murphy, 2003). We crossed our frame data, as did the aforementioned, with internet popularization rates. It included penetration rates, speed navigation and advertising investment on the internet (Bartomeu, 2012:30). The first visual reference of pollination is dated November 1, 1999 –when Terra Networks went public–. However the emergence of ADSL in Spain was not ready until the year 2001. Finally, the beginning of the time frame was set in the year 2000, establishing our decision in practical and symbolic issues.
Figura 2. Even the subunits can become units and contain intermediate phases, as in the idea of range which is created from the similarity of meanings and forms.

The life of trend visual discourses. A case study for Pollination
La vida de las tendencias visuales.Un caso de estudio sobre la Polinización
89issn (en linea) 2014-9298 // issn (impresión) 2339-7500
Phase 2:5) Counting and interpretation of results.6) Qualitative analysis. Interpreting values as central tendency and trend. Analysis of possible relationship
between pollination and other variables. Comparison of the frequency distribution among internal groups of the sample.
The mechanical validation of the hypothesis was based on the verification of the null and alternative hypoth-esis. The null hypothesis indicated the occurrence of the phenomenon as a product of chance. Looking at the possibilities in the form of probability we came up with the assumption that the causes brought about the phe-nomenon were not a cause-effect relationship. There was a possibility that results were determined by a differ-ent cause from the one studied. The validation or rejection of the hypothesis was determined then according to the critical region —or acceptation area— results and confidence limits. If the results were within the critical re-gion and within the limits of confidence, the alternative hypothesis is valid and the null hypothesis is discarded.
The main variable of the study was pollination. The average value and frequency were used, but we also used trend to simplify approaches to the understanding of the phenomenon. It determined the trend of distribution of signs in relation to pollination, and its minimum and maximum values. In the second phase of the experiment it also provided more specific information about pollenized signs among different subgroups of the sample. To find out if there was dependence or independence in signs belonging to different subgroups, association measures were applied using Chi-squared. This measure confirmed the heterogeneity of the sample.
The subgroups within the sample provided data for the following subhypotheses:Subhypotheses 1. All signs redesigned from 2000 are pollenised while all previous designs are not.Subhypotheses 2. All signs designed from 2000 are pollenised.
Figura 3. Interactive matrix organised into Blocks, which contains 123 parameters and 617 values.

The life of trend visual discourses. A case study for Pollination
La vida de las tendencias visuales. Un caso de estudio sobre la Polinización
90issn (en linea) 2014-9298 // issn (impresión) 2339-7500
Subhypotheses 3. Signs designed for non-visual media —radio, telephony, TV suppliers— have a value of pollination (VP) significantly lower than the signs designed for visual media.Subhypotheses 4. The signs designed for the radio have an average value of pollination (VMP) significantly
lower than the other signs.Subhypotheses 5. The group C has a uniformity of graphic resources significantly higher than group A.Subhypotheses 6. The mixed signs are significantly more pollenised than graphotypes, and logotypes are
the signs with a lower pollination value (as a sign more complex is, more pollination it has).Subhypotheses 7. The more rethorical figures a sign has, the more pollenised it is.Subhypotheses 8. The signs generated in between internet use more graphics resources of their own envi-
ronment, so have significantly higher values of pollination.
Pollination was measured as an independent variable in two tests (see figure 4). The first allowed us to carry out an estimate of the minimum values of pollination, the value that pre-existed pollination and the zone of accept-ance of the trend values by Average Pollination Value (APV). It was carried out by comparing 30 CVI signs (see ‘a’ in figure 4) redesigned from the year 2000 with their corresponding redesigns (see ‘b’ in figure 4). The second test used quantitative analysis of 100 CVI signs from the same (see ‘c’ in figure 4) designed after the year 2000.
The sample of signs was formed by taking a random conglomerate sample (Jauset, 2007: 129). It con-sisted of 130 CVI signs from the media conglomerate (A. Sobrino in González Solas, 2002: 188). The randomness indicates that professionally designed signs were not specifically selected with the aim of avoiding bias in the results. Although we didn’t use a probabilistic sample, we considered appropriate to determine the margin of error and confidence level, in order to give an indication of the influence of the sample size in the precision of the results. The error factor of the sample was 8.8% according to maximum uncertainty. The interpreta-tion of the results was based on the index of pollination and the Trend test (Glass and Stanley, 1986: 58).
The index of pollination was obtained by dividing the number of pollenised signs by the total number of signs. If the sample had been probabilistic this value would have coincided with the expected results at a probabilistic
Figura 4. Test strategy.

The life of trend visual discourses. A case study for Pollination
La vida de las tendencias visuales.Un caso de estudio sobre la Polinización
91issn (en linea) 2014-9298 // issn (impresión) 2339-7500
level. The equiprobable result would therefore equal to the mean value of the index of pollination. Finally the ef-ficiency of the different measurement scales was tested, taking the Alfa Cronbach coefficient to 0,88 (figure 5):This included the indicators in relation to the markers and the independence of the pollination variable within the subgroups of the sample with the Chi-squared test. It also explained the correspondence between the instrumental model and the reality observed with the interval measurement based on minimum ‘effective difference’ (1986: 15) in the sensitivity of the matrix and the establishment of the pollination threshold, a threshold that included the minimum value of pollination.
DEVELOPMENTPhenomenological testing aims to establish a relationship of convergence between the visual appearance of sign in two different moments in time and the technological links that are established between appearances through semiotic practices. The test does not look to a deep analysis of the relationship between the visual appearance of the sign and its content, which would become excessively formalist. Faced with a descriptive analysis we propose the description of markers of pollination and faced with an interpretative analysis we propose indicators of pollination. In the analysis of the trend the indicators of pollination that were observed were systematised and broken down into the parameters and values of the matrix.
Pollination generates a convergence of parameters within the semiotic system of the CVI sign which communicate values when they converge. Our interpretation of these values of pollination is related to the metadiscourse of globalization as an identity of the global company, although no correlation levels are set in the pragmatic sense of the sign. Interpreting this type of message was possible thanks to the use of finite graphic resources which we identified through observation in a rough stage of the research. The most popular graphic resources for pollination were the use of back-lit logos that represent three-
Figura 5. Alfa Cronbach.
Figura 6. The instrument: the pollination systematised.

The life of trend visual discourses. A case study for Pollination
La vida de las tendencias visuales. Un caso de estudio sobre la Polinización
92issn (en linea) 2014-9298 // issn (impresión) 2339-7500
dimensional objects, gyratory graphotypes with latent interaction and the use of icons simulating buttons, among others. The values inherent in these representations could be interpreted in context because they were the marks with an index effect in interactive digital technology. Once the indicators of pollination had been observed they were systematised (see figure 6).
The pollenised sign leaves a specific profile on the matrix according to the parameters that it contains and whether or not they are markers of pollination (see figure 7). In this test, the independent variable is pollina-tion, and it was evaluated as the set of markers that identify the profile of the pollenised sign, like in medical studies where a series of markers are identified in blood in order to make a diagnosis. At the end of the test we were able to compare the profiles and find out whether the sign was pollenised or not and with what intensity (see figure 8).
RESULTSThe results of the analysis confirmed that pollination affects between 82.2% and 98.8% of the signs rede-signed from the year 2000 and between 75% and 93% of the newly designed signs from the year 2000. The fact that the values of the redesigned signs are higher than the new designs allows us to think that this is a restyling trend phenomenon that would be orientated to adding communicative values to a sign in order to integrate it better in the context (see figure 9). Moreover it allows us to answer a former ques-
Figura 8. Profile comparison to find out whether a regular sign is pollenised or not, and with what intensity.
DECOMPOSITION OF INDICATORS OF POLLINATION
INDICATOR 08. USE OF ICONOGRAPHIC SIGNS FROM THE INTERNET TO SIMULATE BUTTONS AND MENUS
Block 1 Analytical technique 1.1 ISU Secondary identifiers a) Form Framework value
Block 3 Analytical technique 3.1 ISU Logotype 3 Stylised Subparameter 1 Structural synthesis 2D Value
Block 4 Analytical technique 4.1 ISU Logotype 2 Relational Subparameter 1 Transformation Object value
1 Structural Inscription value
ISU Graphotype 2 Relational Subparameter 1 Transformation Object value
1 Structural Inscription value
Block 6 Analytical technique 6.1 ISU Subunits background Subparamete Active Overall value
Figura 7. Decomposition of indicators of pollination into markers in the matrix. Indicator 08.

The life of trend visual discourses. A case study for Pollination
La vida de las tendencias visuales.Un caso de estudio sobre la Polinización
93issn (en linea) 2014-9298 // issn (impresión) 2339-7500
tion about how long will this trend last: we are now at the end of this trend’s life, and from year 2010 signs have a descending pollination index.
During the study we were able to identify a strange variable in the initial pollination which biased the re-sults. Between 82.2% and 98.9% of the signs designed before 2000 were not pollenised but there was a small margin of pollination, which began gradually and looked as though it would fade out gradually since it is not a very intense phenomenon. The index of pollination was 0.56 and the limit of meaning 0.55. Statistically we can confirm that it exists but that would mean correctly identifying the low intensity of the phenomenon (see figure 9).
The signs generated on the Internet used more of their own graphic resources than the pollenized ones. If we take the Chi test we can see the result on 0,77 and 1 means dependence, so we can say the signs of this subgroup have a bias (see figure 10). When Chi 2 is applied, the result show a value of 0,84 for signs designed on the internet (IN), and 1 for the others (A) . We spected the internet signs to be more dependent of pollination that the other group. It lead us to think that we cannot talk about pollination for Internet brands because they were specifically created for that medium. Althought they may have an of-fline presence its main activity takes place on the Internet. Again this leads us to think that pollination is a trend phenomenon because it affects more the signs that are not Internet brands. If we look at the Chi distribution for group A, it is 0,01 and it means a total independence on the variable: the distribution is not a result of the different media. Group A obtained an equidistant value 0,54 and it has a normal curve distribution. Our interpretation is that signs created to be used on the Internet doesn’t need to show their connectivity, interactivity and digitalization, because they already operate on this media. Pollination can relate signs to the Internet stylistically by adding the digital and interactive values the brands doesn’t have before 2000 (see figure 11). The answer to the former question about what is the semantic load of the sediment of a trend like pollination would be about the load of digital and interactive overtones related to the use of Internet as a medium of communication and a technology.
The results with reference to the use of graphic resources showed high growth in the trend from 2000 to 2010. This value was very significant because it represents one of the highest increases obtained from the
Figura 9. Index of Pollination.
Figura 10. Chi Squared Test, Chi 2 and Distribution on subgroups IN (internet signs) and A (others) of the sample.

The life of trend visual discourses. A case study for Pollination
La vida de las tendencias visuales. Un caso de estudio sobre la Polinización
94issn (en linea) 2014-9298 // issn (impresión) 2339-7500
whole study that confirms that signs designed and redesigned between 2000 and 2010 have a high level of uniformization of graphic resources (see figure 12).
As far as the distribution of pollination in the matrix was concerned we reviewed the relevance of analytical techniques, markers and blocks according to the repetition of pollenised parameters, with 11 repetitions in Block 6 and 17 repetitions in Block 2.
CONCLUSIONSThe analytical matrix has proved valid and applicable to the instrumental analysis of the CVI sign. The results obtained from the matrix as an instrument in its own right can be observed through the high level of efficiency identifying the markers with indicators obtained from empirical observations. The phenomenological validation therefore gave us thirteen correct indicators, eight partially correct indi-cators and one incorrect indicator. The matrix also detected a new marker of the phenomenon under study in two of the logotype indicators which had not been identified through direct observation. This led us to confirm that the step taken to establish the correlations among indicators and markers was generally correct.
Some of the parameters of the matrix obtained a high number of repetitions beyond the markers of pol-lination. Bringing these repetitions together enabled us to create a profile of the typical sign in the sample and detect a trend pattern which lies alongside pollination in the matrix. The matrix allowed us to detect points at which a cause-effect relationship had not previously been established through direct observa-tion, demonstrating that the traceability of parameters and articulation between levels works. With this ca-pacity to complete and generate new patterns the matrix is presented as a useful tool for visual analysis. The traceability of parameters through the Blocks also allowed us to obtain information about obsolete parameters such as ‘digital typographies’. Initially it was though that this would be a marker of pollination but there were no significant results and so it made sense to maintain the classification of the matrix in terms of analysis of the CVI sign in general since this was a result obtained from a specific phenomenon of pollination.
Figura 11. Pollenised signs obtained more thresholds and frequency when these were not Internet brands.

The life of trend visual discourses. A case study for Pollination
La vida de las tendencias visuales.Un caso de estudio sobre la Polinización
95issn (en linea) 2014-9298 // issn (impresión) 2339-7500
We can also confirm that analysis of the plastic sign in a field of meaning articulated in higher levels is pertinent. Block 6 contains the analytical techniques of the plastic sign and is the leading block in bring-ing together the most important parameters of pollination. This leads us to confirm that the analytical block for the plastic sign is completely implicated in pollination. But the main weight of pollination as a phenomenon falls to the semantic rhetoric of recognition in Block 2. The referent is the major carrier of elements of recognition of the pollination discourse. In the construction of meaning on a rhetorical level the articulation of the form with reference to its environment becomes the most important aspect, also calling on intertextuality. It will led us to focus on context and intertextuality when trying to answer a former question. What impact does trends have on the future use of the graphic resources it exploits? As long as the environment changes, referents will change. But trends will leave new rhetoric figures, as we’ve seen with top repetitions of pollenised marks. These marks and new figures might be measured in the future comparing results with a new sample of signs.
The model has been demonstrated to be applicable but with the limitation that applicability forces the analysis of trends only for the CVI sign. The first path of continuity in this research is to expand the model to make it viable for the analysis of other trends in visual discourse.
The second line of continuity is to take a closer look at the typology of signs analysed in Block 5 as typo-graphic, chromatic and iconographic signs that are mutually complementary and which form part of the iconic level. The poor results obtained in the identification of the phenomenon could indicate that relevant data is not obtained when they are analysed separately since the articulation of meaning can occur jointly. The CVI sign can therefore not be analysed as the sum of the typographic, chromatic and iconographic signs since the minimum unit of meaning might be more than the sum of the parts.
Finally, the third option would be to carry out tests using a more sensitive statistical parameter. Given the low level of intensity of the phenomenon under study the results of the pollination test were very approxi-mate. This made us think of developing a more sensitive tool for measuring emerging phenomena. In many cases emerging elements that do not belong to the dominant culture are less frequent and judging their intensity is more complicated.
Figura 12. The frequency of relative repetition is higher in the markers that form the independent variable of pollination.

The life of trend visual discourses. A case study for Pollination
La vida de las tendencias visuales. Un caso de estudio sobre la Polinización
96issn (en linea) 2014-9298 // issn (impresión) 2339-7500
REFERENCESbarthes, R. (1986). ‘Retórica de la imagen’. Lo obvio y lo obtuso: imágenes, gestos, voces. Barcelona: Paidós
comunicació.bartomeu, E. (2012). La identidad visual corporativa en Internet. Available at: http://www.designprocesses.org/
prospective/utils/tesiELENA_BARTOMEU.pdf [accessed 10 March 2016] Thesis directed by Dr. Jesús del Hoyo Arjona.
birdsall, C. and murphy, B. (2003). ‘Cross Channel pollination’. Design Management Review, 14(4), 44–51.calvera, A. (1996). ‘La idea en diseño gráfico’. TipoGráfica, 30, 32–37.costa, J. (ed.) (2007). Diseñar para los ojos. Barcelona: Costa punto com.costa, J. (2004). La imagen de marca, un fenómeno social. Barcelona: Paidós.eco, U. (1972). La estructura ausente. Barcelona: Lumen.—, (1985). Tratado de semiòtica general. Barcelona: Lumen.errea, J. (2007) ‘Spain and Portugal: Waves of Change’. Design Journal, 105, Orlando: Society for News Design.glass, G.V. and stanley, J.C. (1986). Métodos estadísticos aplicados a las ciencias sociales. México: Pren-
tice Hall.gonzález solas, J. (2002). Identidad Visual corporativa. Madrid: Síntesis.greimas, A.J. (1973). Semántica estructural, investigación metodológica. Madrid: Gredos.—, (1973). En torno al sentido. Madrid: Fragua.greimas, A.J. and courtés, J. (1982). Semiótica: diccionario razonado de la teoría del lenguaje. Madrid: Gredos.groupe μ (1993). Tratado del signo visual. Madrid: Cátedra.Jauset, J.A. (2007). Estadística para periodistas, publicitarios y comunicadores.Barcelona: Ed. UOC.Kathman, J. (2002). ’Brand Identity Development in the New Economy’. Design Issues, 18(1), Boston: MIT.ruiz collantes, F.X. (1998). ‘Per a una metodologia generativa de creativitat publicitària’. Temes de Disseny.
Barcelona: Ed. Elisava, 216–224.scolari, C. (2004). Hacer clic. Barcelona: Gedisa.shida, T. (1996). ‘Corporate Identity ant the world wide web’, Design Management Review, 7(1), Boston: De-
sign Management Journal.thurlow, C. and aiello, G. (2006) ‘National Pride, Global Capital’. Visual communication, 6(306), 305–344.
Available at: http://vcj.sagepub.com [accessed 11 Febrary 2009].