Embed Size (px)
Citation preview

1Dalbeth N, et al. Ann Rheum Dis 2017;0:1–7. doi:10.1136/annrheumdis-2017-212046
Clinical and epidemiological research
ExtEndEd rEport
Presence of monosodium urate crystal deposition by dual-energy CT in patients with gout treated with allopurinolnicola dalbeth,1 Savvas nicolaou,2 Scott Baumgartner,3 Jia Hu,3 Maple Fung,3 Hyon K Choi4
AbstrACtObjective dual-energy Ct (dECt) detects and quantifies monosodium urate (MSU) crystal deposition with high precision. this dECt study assessed crystal deposition in patients with gout treated with stable-dose allopurinol, and investigated potential clinical determinants for crystal deposition.Methods patients with gout treated with allopurinol ≥300 mg daily for at least 3 months were prospectively recruited from the USA and new Zealand, using monitored enrolment to include approximately 25% patients with palpable tophi and approximately 50% with serum urate (sUA) levels <6.0 mg/dL (<357µmol/L). MSU crystal deposition was measured in the hands/wrists, feet/ankles/Achilles and knees bilaterally. the presence and total volume of crystals were assessed by dECt and analysed according to sUA levels and gout characteristics.results Among 152 patients receiving allopurinol ≥300 mg/day for 5.1 years on average, 69.1% had crystal deposition on dECt, with a median total crystal volume of 0.16 cm3 (range: 0.01–19.53 cm3). the prevalence of crystal deposition ranged from 46.9% among patients with sUA <6.0 mg/dL and no palpable tophi to 90.0% among those with sUA ≥6.0 mg/dL and tophi. total volume of crystal deposition was positively associated with sUA ≥6.0 mg/dL, gout flares within the past 3 months and tophi. total volume of crystal deposition correlated positively with patient Global Impression of disease Activity scores.Conclusion A substantial proportion of patients without palpable tophi have MSU crystal deposition, despite receiving allopurinol doses ≥300 mg/day for a considerable duration. patients with higher sUA and clinical features of severe disease have a higher frequency and greater volume of MSU crystal deposition.
IntrOduCtIOnIndividuals with chronic hyperuricaemia are predisposed to the deposition of monosodium urate (MSU) crystals in the musculoskeletal and other tissues. Over time, this leads to chronic inflammation, acute gout flares, joint damage and disfiguring tophi.1 Achieving a sustained reduc-tion in serum urate (sUA) levels to target levels, for example,<6.0 mg/dL (<357 µmol/L) (or <5.0 mg/dL (<297 µmol/L) for more severe cases), is asso-ciated with the dissolution of MSU crystals, which in turn leads to a reduction in gout flare rates and resolution of tophi.2–5
Allopurinol, a xanthine oxidase inhibitor, is a widely used urate-lowering therapy in patients with gout.6 Management guidelines recommend titrating doses of allopurinol to a maximum of 800 or 900 mg/day, according to local prescribing informa-tion.7 8 Many patients, however, fail to receive allo-purinol doses above 300 mg/day and the majority of patients do not achieve their target sUA using allo-purinol monotherapy at lower doses.9 10
Physical examination alone is frequently inca-pable of detecting MSU crystal deposits while arthrocentesis is not performed routinely, and so the ability of different imaging techniques has been investigated to detect and monitor crystal deposits.11–13Dual-energy CT (DECT) has been shown capable of detecting MSU crystals with high precision and can accurately measure crystal volume, with the potential to monitor response to therapy.14–20 DECT additionally demonstrates high reproducibility for assessing the joint erosions asso-ciated with crystal deposition.21
The main objectives of this DECT study were to assess the presence and volume of MSU crystal deposition in the peripheral joints and to investi-gate potential clinical determinants of crystal depo-sition in patients with gout treated with stable-dose allopurinol. Correlations of crystal deposition with patient and physician-reported assessments of pain, disease activity and disease control were also investigated.
MAterIAls And MethOdsstudy design and patientsThis prospectively recruited, non-interventional, multicentre study was performed in the USA (n=9 centres) and New Zealand (n=1 centre), with the centralised DECT reading centre at the Vancouver General Hospital in Canada (Dr Savvas Nicolaou, principal radiologist). The study was conducted between April 2015 and October 2016 in accor-dance with the ethical principles of Good Clinical Practice according to the International Council on Harmonisation, Harmonised Tripartite Guideline and in compliance with the Helsinki Declaration (NCT02393560).
The study included a day 1 visit, an imaging visit that included DECT scans of the patient’s hands/wrists, feet/ankles/Achilles and knees conducted at a study-specified imaging facility and a follow-up visit approximately 28 days after imaging to review the DECT results with the patient (figure 1).
to cite: dalbeth n, nicolaou S, Baumgartner S, et al. Ann Rheum Dis published online First: [please include day Month Year]. doi:10.1136/annrheumdis-2017-212046
handling editor tore K Kvien
► Additional material is published online only. to view please visit the journal online (http:// dx. doi. org/ 10. 1136/ annrheumdis- 2017- 212046).
1department of Medicine, University of Auckland, Auckland, new Zealand2department of radiology, Vancouver General Hospital and University of British Columbia, Vancouver, British Columbia, Canada3Formerly Ardea Biosciences, Inc., San diego, California, USA4department of rheumatology, Harvard Medical School and Massachusetts General Hospital, Boston, Massachusetts, USA
Correspondence todr nicola dalbeth, department of Medicine, University of Auckland, Auckland 1023, new Zealand; n. dalbeth@ auckland. ac. nz
received 10 July 2017revised 9 october 2017Accepted 31 october 2017
ARD Online First, published on November 16, 2017 as 10.1136/annrheumdis-2017-212046
Copyright Article author (or their employer) 2017. Produced by BMJ Publishing Group Ltd (& EULAR) under licence.
on May 26, 2020 by guest. P
rotected by copyright.http://ard.bm
j.com/
Ann R
heum D
is: first published as 10.1136/annrheumdis-2017-212046 on 16 N
ovember 2017. D
ownloaded from

2 Dalbeth N, et al. Ann Rheum Dis 2017;0:1–7. doi:10.1136/annrheumdis-2017-212046
Clinical and epidemiological research
Adult patients (aged 18–85 years) were eligible if they had American Rheumatism Association Criteria for the Classifica-tion of Acute Arthritis of Primary Gout22 and had been treated with allopurinol as the sole urate-lowering therapy at a stable dose ≥300 mg daily for ≥3 months prior to study day 1. Patients with concomitant medical or psychological conditions that might interfere with study protocol requirements were excluded.
Monitored enrolment was implemented on eligible subjects to ensure that the DECT imaging population included approxi-mately 25% of patients with palpable tophi and approximately 50% with sUA <6.0 mg/dL.
deCt assessmentsDECT examinations were performed using the second-gen-eration 128-slice Definition Dual Source scanner and routine 64-slice scanners at tube voltages of 80 kV and 140 Sn kV. 4D tube current modulation was deployed with a collimation of 0.6 mm and slice thickness of 0.75 mm. Two data sets were generated, one at 80 kV and one at 140 Sn kV, which were constructed with the B30 kernel.
Gout software ( syngo. via VB10 software package, Siemens, Forchheim, Germany) used characteristic differences in attenua-tion at these voltages to produce digital color-coded images that rendered urate green, cortical bone blue and trabecular bone purple. Green-rendered areas were required to have a minimum diameter of 3 mm to be described as urate positive. Regions had to be globular, focal and confluent to be considered as tophi for counting purposes.
The data that coded urate deposition as green were loaded separately in a dedicated automated volume assessment software program ( syngo. via VB10 software package), with minimum and maximum values of –1 and –1000, respectively. This technique allowed rapid, reproducible measurement of urate deposits.16 The radiologist circled the entire bodily region (eg, forefoot, knee, wrist) to determine total urate volume at each site, and the volume at each site was summed for the total volume measure-ment used in this analysis.
Erosions were identified on plain radiographs or at CT as breaks or defects in the cortical bone surface, often accompanied by loss of adjacent trabecular bone. Erosions could be central, periarticular/juxta-articular or marginal.
The presence and the volume of MSU crystals and the pres-ence of joint erosions were assessed by two DECT radiologists. In cases of discrepancy, a consensus meeting was held between the two readers and the consensus value was used in the analysis.
Patient and physician-reported assessmentsPatient-reported assessments of pain, global disease activity and disease control were performed at day 1 and follow-up visits using visual analogue scales for Pain Assessment (numerical rating scale: 0, no pain; 10, severe pain), Patient Global Impres-sion of Disease Activity (numerical rating scale: 0, very well; 10, very poor) and Patient Impression of Disease Control (numerical rating scale: 0, not at all controlled; 10, fully controlled).
Physician-reported Global Impression of Disease Activity (numerical rating scale: 0, none; 10, extremely active) and Impression of Disease Control (numerical rating scale: 0, not at all controlled; 10, fully controlled) were also performed at day 1 and follow-up visits.
statistical methodsAll subjects with a readable DECT scan were included in imaging analyses. DECT findings for the presence and total volume of crystal deposition, and the presence of joint erosions, were anal-ysed according to demographics (age, gender, race), medical history, clinical features of gout (duration, presence of tophi, number of tophi locations, gout flare history), duration of allopurinol treatment (years), baseline sUA (≥6.0 vs <6.0 mg/dL), body mass index (kg/m2), baseline renal function (glomer-ular filtration rate <60 vs ≥60 mL/min), allopurinol dose (300 vs >300 mg/day) and other baseline laboratory values.
The Wilcoxon Mann-Whitney test (two levels) and the Krus-kal-Wallis test (three or more levels) examined the association between end points in continuous scales (ie, total volume of MSU deposition) and clinical features (eg, age, sex, race, allopurinol dose and duration, presence of tophi and number of gout flares). Pearson’s χ2 test and Fisher’s exact test were used to examine the association between endpoints in categorical scales (ie, presence of MSU deposits and presence of joint erosions) and categor-ical factors. Logistic regression was used to examine the asso-ciation between end points in categorical scales and continuous
Figure 1 Study design and patient disposition. *Primary reason for not completing the study. DECT, dual-energy CT; PRO, patient-reported outcomes.
on May 26, 2020 by guest. P
rotected by copyright.http://ard.bm
j.com/
Ann R
heum D
is: first published as 10.1136/annrheumdis-2017-212046 on 16 N
ovember 2017. D
ownloaded from
3Dalbeth N, et al. Ann Rheum Dis 2017;0:1–7. doi:10.1136/annrheumdis-2017-212046
Clinical and epidemiological research
factors. Spearman correlation coefficients are presented to show the correlation between total volume of MSU deposition and continuous factors. Correlation coefficients above the threshold of 0.30 are considered relevant,23 and nominal p values<0.05 are considered statistically significant. Multivariate analyses were not performed in this cross-sectional study.
resultsPatientsOf 223 patients with gout who fulfilled the admission eligibility criteria, 153 patients completed the study with an interpretable DECT scan and constituted the imaging population (figure 1). Sixty-four patients were excluded from the imaging study due to enrolment restrictions, an uninterpretable DECT scan or a scan not performed. Six additional patients were excluded due to protocol violation (n=2) or withdrawn consent (n=4).
Patients in the imaging population were predominately male with a mean age of 58.5 (SD 11.42) years (table 1). The mean gout duration was 14.93 (SD 10.29) years and the mean duration of allopurinol treatment was 5.05 (SD 6.87) years. The mean allo-purinol dose was 332.7 mg (SD 81.78 mg, range: 300–750 mg); 81.7% of patients were treated with allopurinol at a stable dose of 300 mg/day and 18.3% at a stable dose >300 mg/day. Palpable tophi were present in 48 patients (31.4%) and sUA was ≥6.0 mg/dL in 75 patients (49.0%).
Median laboratory parameters on day 1 were within normal reference ranges, with the exception of estimated creatinine clearance (median 75.0 mL/min; normal range: 85–125 mL/min). Common comorbidities included hypertension (65.4%), hyperlipidaemia (58.2%) and diabetes mellitus (24.2%). The most common concomitant medications were ACE inhibitors (38.6%), HMG CoA reductase inhibitors (35.9%) and oral anti-coagulants/antiplatelet agents including aspirin (30.1%).
Msu crystal deposition and joint erosion on deCtData on MSU crystal deposition were missing for one patient with a readable DECT scan. Crystal deposits were identified by DECT in 105 of 152 (69.1%) patients overall, including 34 (22.4%), 90 (59.2%) and 81 (53.3%) patients, respectively, with deposits at the hands/wrists, feet/ankles/Achilles and knees.
The highest prevalence of deposition was in patients with both sUA ≥6.0 mg/dL and palpable tophi (90.0%), and the lowest prevalence was in patients with sUA <6.0 mg/dL and no palpable tophi (46.9%) (table 2). Figure 2A, B shows example DECT images of crystal deposition in patients in these respec-tive categories. Crystal deposits were detected by DECT in 35 of 42 patients (83.3%) with flares in the past 3 months versus 70 of 110 (63.6%) patients without flares in the past 3 months (p=0.019), and in 61 of 82 (74.4%) patients with flares in the
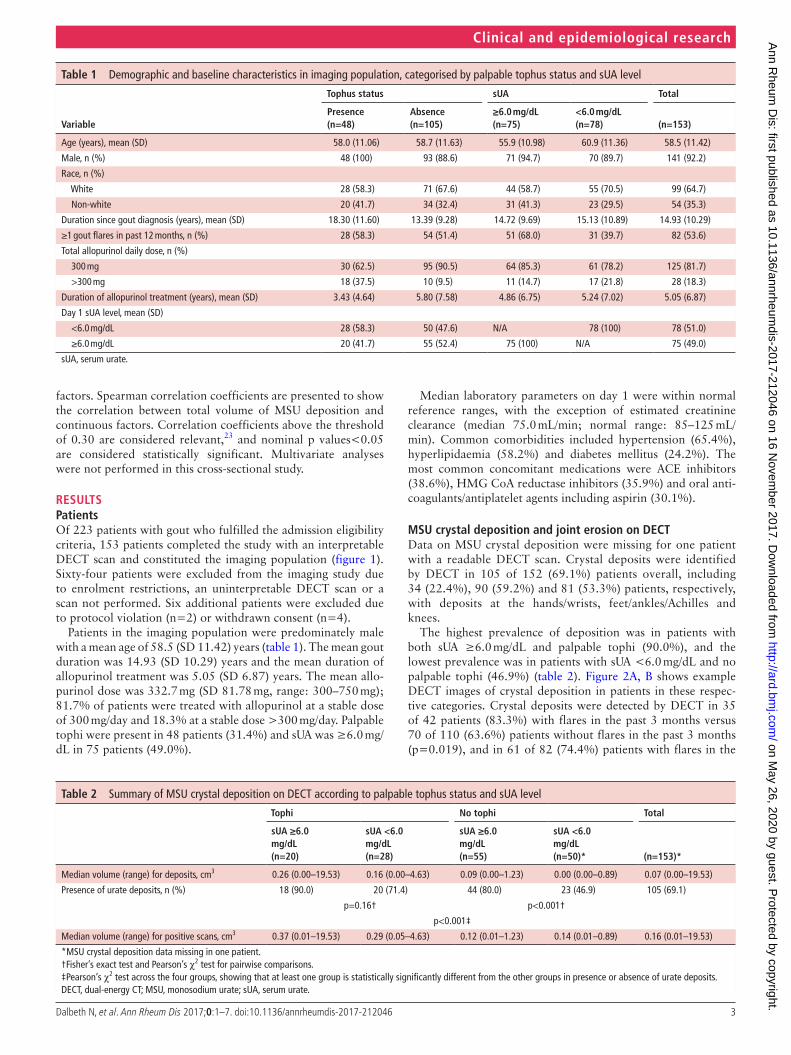
table 1 Demographic and baseline characteristics in imaging population, categorised by palpable tophus status and sUA level
Variable
tophus status suA total
Presence(n=48)
Absence(n=105)
≥6.0 mg/dl(n=75)
<6.0 mg/dl(n=78) (n=153)
Age (years), mean (SD) 58.0 (11.06) 58.7 (11.63) 55.9 (10.98) 60.9 (11.36) 58.5 (11.42)
Male, n (%) 48 (100) 93 (88.6) 71 (94.7) 70 (89.7) 141 (92.2)
Race, n (%)
White 28 (58.3) 71 (67.6) 44 (58.7) 55 (70.5) 99 (64.7)
Non-white 20 (41.7) 34 (32.4) 31 (41.3) 23 (29.5) 54 (35.3)
Duration since gout diagnosis (years), mean (SD) 18.30 (11.60) 13.39 (9.28) 14.72 (9.69) 15.13 (10.89) 14.93 (10.29)
≥1 gout flares in past 12 months, n (%) 28 (58.3) 54 (51.4) 51 (68.0) 31 (39.7) 82 (53.6)
Total allopurinol daily dose, n (%)
300 mg 30 (62.5) 95 (90.5) 64 (85.3) 61 (78.2) 125 (81.7)
>300 mg 18 (37.5) 10 (9.5) 11 (14.7) 17 (21.8) 28 (18.3)
Duration of allopurinol treatment (years), mean (SD) 3.43 (4.64) 5.80 (7.58) 4.86 (6.75) 5.24 (7.02) 5.05 (6.87)
Day 1 sUA level, mean (SD)
<6.0 mg/dL 28 (58.3) 50 (47.6) N/A 78 (100) 78 (51.0)
≥6.0 mg/dL 20 (41.7) 55 (52.4) 75 (100) N/A 75 (49.0)
sUA, serum urate.
table 2 Summary of MSU crystal deposition on DECT according to palpable tophus status and sUA level
tophi no tophi total
suA ≥6.0mg/dl(n=20)
suA <6.0mg/dl(n=28)
suA ≥6.0mg/dl(n=55)
suA <6.0mg/dl(n=50)* (n=153)*
Median volume (range) for deposits, cm3 0.26 (0.00–19.53) 0.16 (0.00–4.63) 0.09 (0.00–1.23) 0.00 (0.00–0.89) 0.07 (0.00–19.53)
Presence of urate deposits, n (%) 18 (90.0) 20 (71.4) 44 (80.0) 23 (46.9) 105 (69.1)
p=0.16† p<0.001†
p<0.001‡
Median volume (range) for positive scans, cm3 0.37 (0.01–19.53) 0.29 (0.05–4.63) 0.12 (0.01–1.23) 0.14 (0.01–0.89) 0.16 (0.01–19.53)
*MSU crystal deposition data missing in one patient.†Fisher’s exact test and Pearson’s χ2 test for pairwise comparisons.‡Pearson’s χ2 test across the four groups, showing that at least one group is statistically significantly different from the other groups in presence or absence of urate deposits.DECT, dual-energy CT; MSU, monosodium urate; sUA, serum urate.
on May 26, 2020 by guest. P
rotected by copyright.http://ard.bm
j.com/
Ann R
heum D
is: first published as 10.1136/annrheumdis-2017-212046 on 16 N
ovember 2017. D
ownloaded from

4 Dalbeth N, et al. Ann Rheum Dis 2017;0:1–7. doi:10.1136/annrheumdis-2017-212046
Clinical and epidemiological research
past 12 months versus 44 of 70 (62.9%) patients without flares in the past 12 months (p=0.16).
The median total volume of crystal deposition in patients with deposits was 0.16 cm3 (range: 0.01–19.53 cm3). The median and mean total volume of crystal deposition were higher in patients with palpable tophi and lower in patients without palpable tophi (table 2, figure 3). The median total volume of crystal deposition was similar in the hands/wrists, feet/ankles/Achilles and knees
at 0.00 cm3 (range: 0.0–3.4 cm3), 0.02 cm3 (range: 0.0–5.4 cm3) and 0.02 cm3 (range: 0.0–18.8 cm3), respectively.
Joint erosions were detected by DECT in the feet/ankles in 110 of 152 (72.4%) patients. The median number of erosions was higher in patients with palpable tophi than in those without (3 and 1, respectively) and in patients with sUA ≥6.0 mg/dL vs <6.0 mg/dL (3 and 2, respectively).
Greater total volume of MSU crystal deposition was associ-ated with presence of palpable tophi (compared with no tophi), sUA ≥6.0 mg/dL (compared with <6.0 mg/dL), ≥1 gout flares in the past 3 or 12 months (compared with no gout flares) and allo-purinol dose >300 mg (compared with 300 mg) (table 3). The total volume of crystal deposition also tended to increase with increasing number of palpable tophi locations (none, 1, 2 or >2) (table 3).
Patients self-reported low levels of pain and disease activity, with high levels of disease control, at baseline and follow-up visit. Median scores on day 1 and follow-up visit were 0.0 and 0.0 for Pain Assessment, 1.0 and 0.0 for Global Impression of Disease Activity and 9.0 and 9.0 for Patient Impression of Disease Control. Median scores on day 1 and follow-up visit were 2.0 and 2.0 for Physician-reported Global Impression of Disease Activity and 8.0 and 8.0 for Impression of Disease Control.
The Patient Global Impression of Disease Activity and the Patient Impression of Disease Control score on day 1 were, respectively, positively (r=0.31, p=0.0001) and negatively
Figure 2 Dual-energy CT image examples. (A) Patient with sUA 8.5 mg/dL, tophi present, total urate volume 19.53 cm3. Green indicates urate; blue indicates cortical bone; purple indicates trabecular bone. (B) Patient with sUA 5.6 mg/dL, tophi absent, total urate volume 0.52 cm3. sUA, serum urate.
Figure 3 Box plot of mean total volume of monosodium urate crystal deposition by tophus status and sUA at baseline. +, group means; o, values outside 1.5xIQR. sUA, serum urate.
on May 26, 2020 by guest. P
rotected by copyright.http://ard.bm
j.com/
Ann R
heum D
is: first published as 10.1136/annrheumdis-2017-212046 on 16 N
ovember 2017. D
ownloaded from

5Dalbeth N, et al. Ann Rheum Dis 2017;0:1–7. doi:10.1136/annrheumdis-2017-212046
Clinical and epidemiological research
(r=–0.25, p=0.002) correlated with the total volume of MSU crystal deposition, while the Pain Assessment score on day 1 was unrelated to total volume of crystal deposition (r=0.08, p=0.34) (online supplementary table 1).
The physician-reported Global Impression of Disease Activity and the Impression of Disease Control score on day 1 were, respectively, positively (r=0.21, p=0.01) and negatively (r=–0.33, p<0.0001) correlated with the total volume of MSU crystal deposition (table 5).
Higher prevalence of joint erosions in the feet/ankles was associated with male (compared with female) sex, presence of palpable tophi (compared with no tophi) and allopurinol dose >300 mg (compared with 300 mg) (online supplementary table 2).
The prevalence of erosions in the feet/ankles was positively associated with the total volume of MSU crystal deposition (Spearman correlation coefficient, r=0.33, p<0.0001) and the volume of crystal deposition in the feet/ankles/Achilles (r=0.34, p<0.0001).
dIsCussIOnIn this prospectively recruited, multicentre study, we found that a substantial proportion of patients with gout (69.1%) had crystal deposition on DECT scans, despite being treated with allopurinol at a stable dose of 300 mg or more daily for a mean of 5.1 (SD 6.9) years. The prevalence and total volume of crystal deposition were greater in patients with sUA ≥6.0 mg/dL, supporting the importance of sUA control as a primary treatment target. However, crystal deposits were present in almost one-half of patients with sUA below the target of 6.0 mg/dL and without palpable tophi, suggesting that a more intensive sUA-lowering target than recommended in current guidelines may be needed to reduce the total body urate burden.
The results of our study are consistent with previous reports demonstrating that DECT can identify subclinical tophi in patients both with and without symptomatic gout.11 17 Almost half of the patients with sUA at target and no palpable tophi in our study also had MSU crystal deposition. In addition, higher MSU crystal deposition on DECT was associated with more flares, tophi and greater severity as measured by patient-reported
table 3 Association between total volume of MSU crystal deposition and baseline characteristics
Parameter n
total volume of Msu crystal depositions (cm3)(n=152)
Age
Spearman correlation coefficient, r* 152 –0.11
P value* 0.17
Age categories
<65 years 100 0.07 (0.00, 19.53)
≥65 years 52 0.07 (0.00, 10.26)
P value† 0.59
Sex
Male 140 0.07 (0.00, 19.53)
Female 12 0.07 (0.00, 0.89)
P value† 0.38
Race categories
White 98 0.05 (0.00, 19.53)
Non-white 54 0.11 (0.00, 10.14)
P value† 0.09
Baseline allopurinol dose category
300 mg 124 0.06 (0.00, 19.53)
>300 mg 28 0.26 (0.00, 10.14)
P value† 0.004
Duration on allopurinol (years)
Spearman correlation coefficient, r* 152 –0.01
P value* 0.86
Tophus status
Presence 48 0.21 (0.00, 19.53)
Absence 104 0.05 (0.00, 1.23)
P value† 0.001
Number of tophi locations
None 104 0.05 (0.00, 1.23)
1 location only 21 0.07 (0.00, 3.05)
2 locations 9 0.07 (0.00, 2.57)
>2 locations 18 1.31 (0.00, 19.53)
P value‡ 0.0001
Duration of gout since diagnosis (years)
Spearman correlation coefficient, r* 152 0.18
P value* 0.03
Gout flares in the past 12 months
None 70 0.05 (0.00, 2.57)
≥1 82 0.11 (0.00, 19.53)
P value† 0.01
Gout flares in the past 3 months
None 110 0.05 (0.00, 10.26)
≥1 42 0.11 (0.00, 19.53)
P value† 0.01
Medical history of kidney stones
No 130 0.07 (0.00, 19.53)
Yes 22 0.05 (0.00, 2.50)
P value† 0.32
BMI (kg/m²)
Spearman correlation coefficient, r* 152 0.13
P value* 0.10
Day 1 sUA
<6.0 mg/dL 77 0.03 (0.00, 4.63)
≥6.0 mg/dL 75 0.09 (0.00, 19.53)
P value† 0.02
Continued
Parameter n
total volume of Msu crystal depositions (cm3)(n=152)
Renal function group§
<90 mL/min 115 0.06 (0.00, 19.53)
≥90 mL/min 35 0.08 (0.00, 10.14)
P value† 0.49
<60 mL/min 36 0.13 (0.00, 5.11)
≥60 mL/min 114 0.05 (0.00, 19.53)
P value 0.20
C reactive protein (mg/L)
Spearman correlation coefficient, r* 149 0.10
P value†* 0.24
The median, minimum and maximum total volume of MSU crystal depositions are displayed for all categorical parameters.*Estimates from Spearman correlation.†P value from Wilcoxon Mann-Whitney test.‡P value from Kruskal-Wallis test.§Renal function group is estimated creatinine clearance based on the Cockcroft-Gault method.BMI, body mass index; MSU, monosodium urate; sUA, serum urate.
table 3 Continued
on May 26, 2020 by guest. P
rotected by copyright.http://ard.bm
j.com/
Ann R
heum D
is: first published as 10.1136/annrheumdis-2017-212046 on 16 N
ovember 2017. D
ownloaded from

6 Dalbeth N, et al. Ann Rheum Dis 2017;0:1–7. doi:10.1136/annrheumdis-2017-212046
Clinical and epidemiological research
outcomes. Collectively, these findings suggest that DECT may have clinical benefit in assessing the need for more intensive urate-lowering therapy in individual patients.
Crystal deposition was more common in patients with flares compared with patients without flares in the past 3 months (83.3% vs 63.6%), in support of the observed relationship between crystal deposition and disease severity. Although crystal volumes were higher in those with flares in the preceding 12 months, the presence of any crystal deposition was not more common in this group. All participants were on allopurinol, and a single measure of urate crystal deposition may not reflect crystal burden for up to a year before in patients on urate-lowering therapy.
Patient and physician-reported assessments indicated gener-ally low levels of disease activity and pain and well-controlled disease. Nevertheless, the Patient Global Impression of Disease Activity was positively associated with MSU total crystal volume, while the Patient Impression of Disease Control score was negatively associated with crystal volume. These outcomes add further support to the validity and clinical relevance of the DECT findings.
DECT-detected joint erosions in the feet/ankles were present in the majority of patients (72.4%), especially those with char-acteristics of higher disease severity: greater allopurinol dose (>300 mg vs 300 mg) and presence of palpable tophi. Erosions were associated more commonly with males than females, although this is difficult to interpret given the small number of women in the study. Not unexpectedly, joint erosions were also associated with the presence of MSU crystal deposition.
Strengths and potential limitations of our study deserve comment. Our study prospectively scanned anatomical sites most commonly affected by the clinical features of gout24 with the use of a centralised reading centre with two DECT radiologists. We also correlated the DECT findings with patient and physician-re-ported outcomes. We adopted enrolment restrictions to ensure the study population provided data across a range of sUA levels and numbers of tophi; however, this could have impacted the generalisability of study outcomes to other patient groups. In addition, our study was cross-sectional and therefore not capable of identifying temporal changes in the correlations we observed. Greater total volume of crystal deposition was also associated with allopurinol doses>300 mg vs 300 mg, which likely reflects the presence of more severe disease and recognition of the need for a higher dose (ie, confounding by indication). Finally, our study included a limited number of female subjects; further studies among females would be valuable.
In conclusion, this DECT study of allopurinol-treated patients with gout demonstrates that the number and total volume of MSU crystal depositions are higher in those with evidence of greater disease severity: more frequent flares and tophi and higher sUA. However, even patients who can be categorised as having ‘controlled’ gout, that is, with sUA at target levels and no palpable tophi, have frequent evidence of crystal deposi-tion (46.9% in this study). DECT imaging may be of benefit in patients with gout to assess the need for more intensive urate-lowering therapy.Contributors Criterion 1: (a) substantial contributions to study conception and design; and/or (b) substantial contributions to acquisition of data; and/or (c) substantial contributions to analysis and interpretation of data. Criterion 2: drafting the article or revising it critically for important intellectual content. Criterion 3: final approval of the version of the article to be published. nd: 1a, 1b, 1c, 2, 3. Sn: 1a, 1b, 1c, 2, 3. SB: 1a, 1b, 2, 3. JH: 1a, 1b, 1c, 2, 3. MF: 1a, 1bb, 1c, 2, 3. HK: 1a, 1b, 1c, 2, 3.
Funding this clinical study was funded by AstraZeneca. the study sponsor had a role in the design and conduct of the study; collection, management, analysis, and interpretation of the data; and review and approval of the manuscript. Editorial
support for this manuscript was provided by Bill Wolvey of pArExEL, which was funded by AstraZeneca.
Competing interests nd, grant support from AstraZeneca, participated on speaker bureaus for Menarini, AstraZeneca, takeda and advisory boards for AstraZeneca, Fonterra, takeda, pfizer, Cymabay, and Crealta. Sn, University of British Columbia has an MrA with Siemens Healthcare. SB, JH and MF, formerly full-time employees of Ardea Biosciences, a member of the AstraZeneca Group. HKC, grant support from AstraZeneca, consulting fees from takeda and consulting fees from Selecta.
Patient consent obtained.
Provenance and peer review not commissioned; externally peer reviewed.
Open Access this is an open Access article distributed in accordance with the Creative Commons Attribution non Commercial (CC BY-nC 4.0) license, which permits others to distribute, remix, adapt, build upon this work non-commercially, and license their derivative works on different terms, provided the original work is properly cited and the use is non-commercial. See: http:// creativecommons. org/ licenses/ by- nc/ 4. 0/
© Article author(s) (or their employer(s) unless otherwise stated in the text of the article) 2017. All rights reserved. no commercial use is permitted unless otherwise expressly granted.
RefeRences 1 perez-ruiz F, dalbeth n, Bardin t. A review of uric acid, crystal deposition disease, and
gout. Adv Ther 2015;32:31–41. 2 dalbeth n, Saag KG, palmer WE, et al. Effects of febuxostat in early gout:
a randomized, double-blind, placebo-controlled study. Arthritis Rheumatol 2017. 3 Li-Yu J, Clayburne G, Sieck M, et al. treatment of chronic gout. Can we determine
when urate stores are depleted enough to prevent attacks of gout? J Rheumatol 2001;28:577–80.
4 perez-ruiz F, Calabozo M, pijoan JI, et al. Effect of urate-lowering therapy on the velocity of size reduction of tophi in chronic gout. Arthritis Rheum 2002;47:356–60.
5 Shoji A, Yamanaka H, Kamatani n. A retrospective study of the relationship between serum urate level and recurrent attacks of gouty arthritis: evidence for reduction of recurrent gouty arthritis with antihyperuricemic therapy. Arthritis Rheum 2004;51:321–5.
6 Harrold Lr, Andrade SE, Briesacher BA, et al. Adherence with urate-lowering therapies for the treatment of gout. Arthritis Res Ther 2009;11:r46.
7 Khanna d, Fitzgerald Jd, Khanna pp, et al. 2012 American College of rheumatology guidelines for management of gout. part 1: systematic nonpharmacologic and pharmacologic therapeutic approaches to hyperuricemia. Arthritis Care Res 2012;64:1431–46.
8 richette p, doherty M, pascual E, et al. 2016 updated EULAr evidence-based recommendations for the management of gout. Ann Rheum Dis 2017;76:29–42.
9 Becker MA, Schumacher Hr, Espinoza Lr, et al. the urate-lowering efficacy and safety of febuxostat in the treatment of the hyperuricemia of gout: the ConFIrMS trial. Arthritis Res Ther 2010;12:r63.
10 Schumacher Hr, Becker MA, Wortmann rL, et al. Effects of febuxostat versus allopurinol and placebo in reducing serum urate in subjects with hyperuricemia and gout: a 28-week, phase III, randomized, double-blind, parallel-group trial. Arthritis Rheum 2008;59:1540–8.
11 Choi HK, Al-Arfaj AM, Eftekhari A, et al. dual energy computed tomography in tophaceous gout. Ann Rheum Dis 2009;68:1609–12.
12 Chowalloor pV, Siew tK, Keen HI. Imaging in gout: A review of the recent developments. Ther Adv Musculoskelet Dis 2014;6:131–43.
13 McQueen FM, doyle A, dalbeth n. Imaging in gout--what can we learn from MrI, Ct, dECt and US? Arthritis Res Ther 2011;13:246.
14 Bacani AK, McCollough CH, Glazebrook Kn, et al. dual energy computed tomography for quantification of tissue urate deposits in tophaceous gout: help from modern physics in the management of an ancient disease. Rheumatol Int 2012;32:235–9.
15 Bongartz t, Glazebrook Kn, Kavros SJ, et al. dual-energy Ct for the diagnosis of gout: an accuracy and diagnostic yield study. Ann Rheum Dis 2015;74:1072–7.
16 Choi HK, Burns LC, Shojania K, et al. dual energy Ct in gout: a prospective validation study. Ann Rheum Dis 2012;71:1466–71.
17 dalbeth n, House ME, Aati o, et al. Urate crystal deposition in asymptomatic hyperuricaemia and symptomatic gout: a dual energy Ct study. Ann Rheum Dis 2015;74:908–11.
18 desai MA, peterson JJ, Garner HW, et al. Clinical utility of dual-energy Ct for evaluation of tophaceous gout. Radiographics 2011;31:1365–75.
19 Glazebrook Kn, Guimarães LS, Murthy nS, et al. Identification of intraarticular and periarticular uric acid crystals with dual-energy Ct: initial evaluation. Radiology 2011;261:516–24.
20 rajan A, Aati o, Kalluru r, et al. Lack of change in urate deposition by dual-energy computed tomography among clinically stable patients with long-standing tophaceous gout: a prospective longitudinal study. Arthritis Res Ther 2013;15:r160.
on May 26, 2020 by guest. P
rotected by copyright.http://ard.bm
j.com/
Ann R
heum D
is: first published as 10.1136/annrheumdis-2017-212046 on 16 N
ovember 2017. D
ownloaded from

7Dalbeth N, et al. Ann Rheum Dis 2017;0:1–7. doi:10.1136/annrheumdis-2017-212046
Clinical and epidemiological research
21 Shi d, xu Jx, Wu Hx, et al. Methods of assessment of tophus and bone erosions in gout using dual-energy Ct: reproducibility analysis. Clin Rheumatol 2015;34:755–65.
22 Wallace SL, robinson H, Masi At, et al. preliminary criteria for the classification of the acute arthritis of primary gout. Arthritis Rheum 1977;20:895–900.
23 Hinkle dE, Wiersma W, Jurs SG. Applied statistics for the behavioral sciences. 5th ed. Boston, MA: Houghton Mifflin, 2003.
24 roddy E. revisiting the pathogenesis of podagra: why does gout target the foot? J Foot Ankle Res 2011;4:13.
on May 26, 2020 by guest. P
rotected by copyright.http://ard.bm
j.com/
Ann R
heum D
is: first published as 10.1136/annrheumdis-2017-212046 on 16 N
ovember 2017. D
ownloaded from


![· UU \ \ ]ùP ^ \ ]°P ^ \ &¶ &¶k ! \ &¶ W V \ðá Acute gout Chronic gout Uric Acid Monosodium urate crystal Purine Bu- &'EnND< • "G](https://img.dokumen.tips/doc/110x75/5e214ac52f885c72967c3a6b/uu-p-p-k-w-v-acute-gout-chronic.jpg)