Embed Size (px)
Citation preview

Prepared for InnoCentive February 2010
The Total Economic Impact™ Of InnoCentive’s Enterprise Solution: Challenges, InnoCentive@Work, And ONRAMP Single-Company Case Study
Project Director: Michelle Bishop, Senior Consultant

The Total Economic Impact™ Of InnoCentive’s Enterprise Solution: Challenges, InnoCentive@Work, And ONRAMP
- 2 -
TABLE OF CONTENTS Executive Summary ............................................................................................................................... 4
Key Findings ...................................................................................................................................... 5
Purpose .............................................................................................................................................. 6
Methodology ....................................................................................................................................... 6
Approach ............................................................................................................................................ 7
Disclosures ......................................................................................................................................... 7
InnoCentive Challenges, InnoCentive@Work, And ONRAMP: Overview ........................................... 8
Analysis ................................................................................................................................................... 9
Interview Highlights ............................................................................................................................ 9
TEI Framework ................................................................................................................................ 10
Costs ................................................................................................................................................ 11
Benefits ............................................................................................................................................ 14
Additional Benefits (Not Quantified) ................................................................................................ 19
Risk ................................................................................................................................................... 21
Flexibility ........................................................................................................................................... 24
TEI Framework: Summary............................................................................................................... 24
Study Conclusions ................................................................................................................................ 26
Appendix A: Total Economic Impact™ Overview ............................................................................... 27
Benefits ............................................................................................................................................ 27
Costs ................................................................................................................................................ 27
Risk ................................................................................................................................................... 27
Flexibility ........................................................................................................................................... 27
Appendix B: Glossary ........................................................................................................................... 28

The Total Economic Impact™ Of InnoCentive’s Enterprise Solution: Challenges, InnoCentive@Work, And ONRAMP
- 3 -
Appendix C: About The Project Manager ............................................................................................ 29
© 2010, Forrester Research, Inc. All rights reserved. Unauthorized reproduction is strictly prohibited. Information is based on best available resources. Opinions reflect judgment at the time and are subject to change. Forrester®, Technographics®, Forrester Wave, RoleView, TechRadar, and Total Economic Impact are trademarks of Forrester Research, Inc. All other trademarks are the property of their respective companies. For additional information, go to www.forrester.com.

The Total Economic Impact™ Of InnoCentive’s Enterprise Solution: Challenges, InnoCentive@Work, And ONRAMP
- 4 -
Executive Summary In November 2009, InnoCentive commissioned Forrester Consulting to examine the total economic impact and potential return on investment (ROI) enterprises may realize by deploying InnoCentive Challenges, InnoCentive@Work, and ONRAMP. These offerings make up InnoCentive’s enterprise solution.
• InnoCentive Challenges is an innovation solution that gives users access to InnoCentive’s Challenge Marketplace, a Web community of 200,000 experts, to help them achieve innovative business results.
• InnoCentive ONRAMP (Open iNnovation Rapid Adoption Methods and Practices) is a suite of training and implementation services designed to help companies adopt open innovation rapidly and successfully within their organizations.
• InnoCentive@Work is a customized, internal Web-based collaborative community for problem solving.
This study illustrates the financial impact of using InnoCentive Challenges, InnoCentive@Work, and ONRAMP to facilitate innovation in the R&D organization of Syngenta, a large multinational agricultural company.
• With headquarters in Switzerland, Syngenta is an agribusiness firm with major research centers and production centers around the globe. Syngenta’s businesses include crop protection, seed businesses, and lawn and home-care products. The company had $11 billion in revenues in 2009.
• Syngenta initially launched InnoCentive Challenges for its North American business, later expanding the program worldwide for all of Syngenta’s businesses and using ONRAMP services throughout the implementation. InnoCentive@Work was launched simultaneously in Europe, North America, and India.
In conducting in-depth interviews with Syngenta, Forrester found that the organization achieved several benefits, including:
• Cost savings from Challenge solutions.
• Reduction in intellectual property (IP) transfer time, resulting in cost avoidance of licensing and legal fees.
• Productivity savings for Syngenta’s researchers.
• Changing Syngenta’s innovation capability by providing a complementary R&D process that transforms “high-risk projects” into “low-risk, low-cost Challenges.”
• Improved internal collaboration.
• Access to external talent outside the agribusiness field.
• Improved research process.

The Total Economic Impact™ Of InnoCentive’s Enterprise Solution: Challenges, InnoCentive@Work, And ONRAMP
- 5 -
Forrester calculated that Syngenta achieved an ROI of 182%, with a payback period of fewer than two months from the benefits quantified in the study.
Key Findings Forrester’s study yielded the following key findings:
• InnoCentive yielded positive ROI. Based on the interviews with Syngenta, Forrester constructed a TEI framework for the organization and the associated ROI analysis to illustrate the areas of financial impact. As seen in Table 1, the ROI for Syngenta is 182% with a payback period of fewer than two months.
• Benefits are related to greater efficiencies, cost savings, and productivity. The main quantified benefits for Syngenta were: 1) efficiency savings for the organization as a result of successful Challenges; 2) cost avoidance of the licensing effort and legal fees required for IP transfer; and 3) researcher productivity savings. The value of these benefits is estimated at $11,861,688 (risk-adjusted, present value [PV]) over three years.
Additional qualitative benefits to Syngenta included changing Syngenta’s innovation capability, improved internal collaboration, access to external talent that could not be found in-house, improved research process, and facilitation of cultural change to new ways of innovation.
• Costs are related to startup and maintenance fees. The costs of implementing InnoCentive Challenges, InnoCentive@Work, and ONRAMP include: 1) the fee for posting to InnoCentive Challenges; 2) the internal effort required for Challenge formulation and evaluation; 3) award fees paid for a successful Challenge; 4) fees paid for InnoCentive@Work; 5) internal resources required for InnoCentive@Work posting and evaluation; 6) ONRAMP costs; 7) administrative costs to run the InnoCentive innovation program; and 8) cost for external consultants. Forrester estimates the total of these costs at $4,200,567 (risk-adjusted, PV) over three years.
Table 1 illustrates the risk-adjusted cash flow for the organization, based on data and characteristics obtained during the interview process. Forrester risk-adjusts these values to take into account the potential uncertainty that exists in estimating the costs and benefits of a technology investment. The risk-adjusted value is meant to provide a conservative estimation, incorporating any potential risk factors that may later affect the original cost and benefit estimates. For a more in-depth explanation of risk and risk adjustments used in this study, please see the Risk section.

The Total Economic Impact™ Of InnoCentive’s Enterprise Solution: Challenges, InnoCentive@Work, And ONRAMP
- 6 -
Table 1: ROI, Risk-Adjusted
Ref. Project cash flow Calculation Initial Year 1 Year 2 Year 3 Total PV/NPV
K1 Total costs ($158,687) ($1,335,669) ($1,792,182) ($1,792,182) ($5,078,720) ($4,200,567)
L1 Total benefits $0 $2,361,231 $4,963,246 $7,471,246 $14,795,723 $11,861,688
P1 Net savings $1,025,562 $3,171,064 $5,679,064 $9,717,003 $7,661,121
P2 ROI (L1-H1)/H1 182%
P3 Payback period Fewer than
two months
Source: Forrester Research, Inc.
Please note that numbers in the tables may not align due to rounding.
Purpose The purpose of this study is to provide readers with a framework to evaluate the potential financial impact of InnoCentive Challenges, InnoCentive@Work, and ONRAMP on their organizations. Forrester’s aim is to clearly show all calculations and assumptions used in the analysis. Readers should use this study to better understand and communicate a business case for investing in InnoCentive Challenges, InnoCentive@Work, and ONRAMP.
Methodology InnoCentive selected Forrester for this project because of its industry expertise in enterprise innovation and Forrester’s Total Economic Impact™ (TEI) methodology. TEI not only measures costs and cost reduction (areas that are typically accounted for within IT) but also weighs the enabling value of a technology in increasing the effectiveness of overall business processes.
For this study, Forrester employed four fundamental elements of TEI in modeling InnoCentive Challenges, InnoCentive@Work, and ONRAMP:
1. Costs and cost reduction.
2. Benefits to the entire organization.
3. Flexibility.
4. Risk.
Given the increasing sophistication that enterprises have regarding cost analyses related to IT investments, Forrester’s TEI methodology serves an extremely useful purpose by providing a complete picture of the total economic impact of purchase decisions. Please see Appendix A for additional information on the TEI methodology.

The Total Economic Impact™ Of InnoCentive’s Enterprise Solution: Challenges, InnoCentive@Work, And ONRAMP
- 7 -
Approach Forrester used a five-step approach for this study:
1. Forrester gathered data from existing Forrester research relative to InnoCentive Challenges, InnoCentive@Work, and ONRAMP and the open innovation market in general.
2. Forrester interviewed InnoCentive marketing and sales personnel to fully understand the potential (or intended) value proposition of InnoCentive Challenges, InnoCentive@Work, and ONRAMP.
3. Forrester conducted a series of in-depth interviews with an organization, Syngenta, which deployed the InnoCentive enterprise solution consisting of InnoCentive Challenges, InnoCentive@Work, and ONRAMP product suite.
4. Forrester constructed a financial model representative of the interviews. This model can be found in the TEI Framework section below.
Disclosures The reader should be aware of the following:
• The study is commissioned by InnoCentive and delivered by the Forrester Consulting group.
• InnoCentive reviewed and provided feedback to Forrester, but Forrester maintains editorial control over the study and its findings and does not accept changes to the study that contradict Forrester’s findings or obscure the meaning of the study.
• Contacts at Syngenta were provided by InnoCentive.
• Forrester makes no assumptions as to the potential ROI that other organizations will receive. Forrester strongly advises that readers should use their own estimates within the framework provided in the report to determine the appropriateness of an investment in InnoCentive Challenges, InnoCentive@Work, and ONRAMP.
• This study is not meant to be used as a competitive product analysis.

The Total Economic Impact™ Of InnoCentive’s Enterprise Solution: Challenges, InnoCentive@Work, And ONRAMP
- 8 -
InnoCentive Challenges, InnoCentive@Work, And ONRAMP: Overview Over the past decade, interest in the concept of open innovation has exploded. While the term was originally conceived by Henry Chesbrough in 1998, the trend toward open innovation models has been supported over the past decade by powerful globalization and technology trends. As open innovation models are adopted by more leading organizations, they have become a key topic for IT and business professionals responsible for creating, managing, and sustaining the development of new ideas and business opportunities.
Yet despite all of the interest in open innovation, the term remains an elusive concept to many. Indeed, most IT and business professionals companies know they want to be more open and innovative in 2010, but they do not know where or how to start investing.
According to InnoCentive, an organization may require different approaches to implementing an open innovation strategy, depending on its level of experience with innovation and its business goals. The company asks critical questions about its clients’ existing resources and capabilities, their approach to innovation, and their strategic innovation goals — all of which help clients to drive stronger business results. To meet the full range of solution requirements, InnoCentive offers an enterprise solution that incorporates the following product options:
• InnoCentive Challenges. An InnoCentive Challenge is a unique problem posted by Seekers in the InnoCentive Challenge Marketplace. The goal of a Challenge is to solicit solutions from InnoCentive’s community of 200,000 Solvers and ultimately choose the one that best fits the criteria set out by the Seeker. Challenges can be large or small, short-term or long-term. If a solution is selected as “best” by the Seeker, the Solver transfers the IP to the Seeker and receives a financial award, which varies per Challenge.
• InnoCentive ONRAMP. ONRAMP is a suite of professional services and technical resources developed and delivered by InnoCentive’s team of scientists, Ph.D. holders, and consultants to help Seeker companies adopt open innovation rapidly and successfully within their organizations. ONRAMP provides planning, education, communication, and reporting services to help Seekers manage the process, fine-tune their open innovation plan, and measure the returns of their innovation strategy.
• InnoCentive@Work. InnoCentive@Work is an internal Web-based community customized by InnoCentive for Seeker organizations. InnoCentive@Work bridges the silos in disparate departments and R&D organizations. It applies a Seeker’s internal resources to an organization’s hardest problems. Cross-fertilization of ideas and solutions accelerate success by accessing the currently untapped value of institutional experience and knowledge, so results are optimized and occur faster. As companies gain experience with InnoCentive@Work, they can move problems from inside their organization’s community to InnoCentive’s global community of Solvers to further increase the diversity of potential solutions.

The Total Economic Impact™ Of InnoCentive’s Enterprise Solution: Challenges, InnoCentive@Work, And ONRAMP
- 9 -
Analysis Forrester took a multistep approach to evaluating the impact that implementing InnoCentive Challenges, InnoCentive@Work, and ONRAMP can have on an organization, including:
• Interviews with InnoCentive executive, marketing, sales, and service delivery personnel.
• Review and analysis by a Forrester analyst whose focus includes enterprise innovation.
• In-depth interviews with an enterprise client currently using InnoCentive Challenges, InnoCentive@Work, and ONRAMP.
• Construction of a common financial framework for the implementation of InnoCentive Challenges, InnoCentive@Work, and ONRAMP.
Interview Highlights Syngenta is a leading agribusiness firm committed to sustainable agriculture by raising productivity through innovative research and technology. Revenue for the organization in 2009 was approximately $11 billion, and Syngenta employs more than 24,000 people in more than 90 countries. With headquarters in Switzerland, Syngenta also has major research centers and production centers around the globe.
Syngenta was initially formed in 2000 when Novartis and AstraZeneca merged their agribusiness. Since then, the organization has grown through acquisitions and alliances into a leading agribusiness company with customer solutions in seed and crop protection and lawn and home care. The organization aims to drive growth in innovation through R&D.
The in-depth interviews with Syngenta revealed the following:
• The organization initially launched InnoCentive Challenges for its North American business, later expanding the program worldwide for all of Syngenta’s businesses and using ONRAMP services throughout the implementation. InnoCentive@Work was launched simultaneously in Europe, North America, and India.
• The InnoCentive program was one of the innovation initiatives that the organization implemented to explore ways to compete differently in the agricultural business space toward its goal of “bringing plant potential to life.”
• Through open innovation, the company saw an opportunity to work swiftly and be more nimble with its resources in an economic downturn. InnoCentive — with its “pay for performance” model of Challenges, solutions, and awards — gave it the opportunity to pursue “high-risk” projects with no fixed costs to the company. With the infrastructure provided by InnoCentive, these projects were transformed to “low-risk, low-cost” Challenges.
• The organization noted that extensive preparation and training was required to implement the InnoCentive program — as open innovation was not just a program change but a cultural change. Syngenta went through a thorough stakeholder buy-in process before launching InnoCentive Challenges to establish a strategy for implementation and to make sure that organizational incentives were aligned.

The Total Economic Impact™ Of InnoCentive’s Enterprise Solution: Challenges, InnoCentive@Work, And ONRAMP
- 10 -
After management approval, the organization then embarked on multiple training sessions and educational seminars through ONRAMP services and external consultants over the course of six months to encourage participation in InnoCentive Challenges and InnoCentive@Work and introduce the concept and emphasize the value of open innovation with its research teams. One portfolio leader characterized this multistep process as essential to the InnoCentive program success, stating: “Planning is everything. You have to embed a different way of doing business in the company. Only by embedding the culture of open innovation does this program become more meaningful and have more impact.”
• With InnoCentive, Syngenta could now gain access to people outside the agribusiness field who the organization would not normally have access to. “We try to hire the best and brightest we can find; other times, we try to access them through a university relationship or contract research.” InnoCentive is one more avenue for the company to gain access to these outside experts.
• Other drivers for Syngenta’s investment in open innovation through InnoCentive were to develop skills in successful integration of technology from external sources with internal R&D, to find a more competitive licensing model for IP transfer, and to provide an internal collaborative forum for its scientists.
• For the pilot project, Syngenta chose to post difficult Challenges that were industry problems for a number of years. By choosing to do so, as well as by framing Challenges that would have immediate cost efficiency savings for the organization, the organization was able to create a compelling case for moving forward with the program based on the pilot results.
• Syngenta also noted that “the initial group of projects was in many cases focused on near-term actionable and critical projects, which would allow the initiative to be self-funding from day one.”
• Syngenta views InnoCentive Challenges, InnoCentive@Work, and ONRAMP as one enterprise solution to “continue to reinforce the culture of problem solving” within its organization. InnoCentive@Work creates a sustainable pipeline for Challenges posted on the Open Innovation Marketplace and “moves Challenges incrementally” to final solutions.
• One of the Challenges the organization noted in implementing InnoCentive@Work was managing the legal barriers of IP transfer on a country-by-country basis. Another Challenge was determining reward and recognition for InnoCentive@Work that could be implemented globally. As part of this reinforcement of behavior for finding solutions through open innovation, Syngenta set up a points system that would reward an employee who would contribute to a solution on InnoCentive@Work.
• Throughout the interviews, Syngenta emphasized the importance of planning and training to successfully launch an open innovation program and effect cultural change within the company.
TEI Framework
Introduction From the information provided in the in-depth interviews, Forrester has constructed a TEI framework for those organizations considering implementation of InnoCentive Challenges,

The Total Economic Impact™ Of InnoCentive’s Enterprise Solution: Challenges, InnoCentive@Work, And ONRAMP
- 11 -
InnoCentive@Work, and ONRAMP. The objective of the framework is to identify the cost, benefit, flexibility, and risk factors that influence the investment decision.
Framework Assumptions Table 2 lists the discount rate used in the PV and NPV calculations and time horizon used for the financial modeling.
Table 2: General Assumptions
Ref. General assumptions Value
Discount rate 10%
Length of analysis Three years
Source: Forrester Research, Inc.
Organizations typically use discount rates between 8% and 16% based on their current environment. Readers are urged to consult with their finance department to determine the most appropriate discount rate to use within their own organizations.
In addition to the financial assumptions used to construct the cash flow analysis, Table 3 provides fully loaded compensation (salary plus benefits) assumptions used within this analysis.
Table 3: Salary Assumptions
Ref. Metric Calculation Value
A1 Hours per week 40
A2 Weeks per year 52
A3 Hours per year (M-F, 9-5) 2,080
A4 Scientist (fully loaded cost including benefits) $120,000
A5 Hourly rate (A4/A3) $57.69
Source: Forrester Research, Inc.
Costs The key cost categories associated with InnoCentive Challenges, InnoCentive@Work, and ONRAMP are: 1) the fee for posting to InnoCentive Challenges; 2) the internal effort required for Challenge formulation and evaluation; 3) award fees paid for a successful Challenge; 4) fees paid for InnoCentive@Work; 5) internal resources required for InnoCentive@Work posting and evaluation; 6) ONRAMP costs; 7) administrative costs to run the InnoCentive innovation program; and 8) cost for external consultants.

The Total Economic Impact™ Of InnoCentive’s Enterprise Solution: Challenges, InnoCentive@Work, And ONRAMP
- 12 -
The project is measured on a three-year basis. The following are the cost inputs to the financial analysis.
Challenge Posting Fees Fees for Challenge posting vary per customer, depending on the number of Challenges. Based on information provided by Syngenta, Forrester uses an average Challenge fee of $11,000 per Challenge. The three-year analysis estimates that the organization posted 14 Challenges in year 1 and 21 Challenges in years 2 and 3. The cost to post these Challenges within the organization totals $616,000.
Challenge Formulation And Evaluation Syngenta estimates that the internal effort required to formulate, post, and evaluate Challenges is valued at $10,000 per Challenge. This includes scientists’ time to write and evaluate each Challenge, as well as time of Syngenta’s internal legal team to vet each posted Challenge. At a total of 56 Challenges over a three-year time period, the cost for the organization over three years is estimated at $560,000.
Successful Challenge Award Fees Syngenta reported an 86% success rate for Challenges posted on InnoCentive’s Open Innovation Marketplace. The organization also estimated that it has paid out an average of $39,250 for each successful Challenge. With a total of 56 Challenges over three years, award fees paid by the organization for successful Challenges total $1,890,280.
Table 4: Challenge Awards
Ref. Metric Calculation Initial Year 1 Year 2 Year 3 Total
B1 Average Challenge award $39,250
B2 Percentage successful Challenges
86%
B3 Number of Challenges 14 21 21
Bt Challenge awards B1*B2*B3 $472,570 $708,855 $708,855
Bto Total (original) $0 ($472,570) ($708,855) ($708,855) ($1,890,280)
Source: Forrester Research, Inc.
InnoCentive@Work Fees The cost of InnoCentive@Work for Syngenta was an initial $90,000 in startup fees, $201,900 in fees in the first year, and an additional $375,000 in the subsequent two years when the program is fully ramped. Syngenta estimates that it will post a total of 48 Challenges in year 1 and 96

The Total Economic Impact™ Of InnoCentive’s Enterprise Solution: Challenges, InnoCentive@Work, And ONRAMP
- 13 -
Challenges in years 2 and 3 on InnoCentive@Work. The total cost to the organization over three years is $1,041,900.
InnoCentive@Work Formulation And Evaluation To encourage participation in InnoCentive@Work, Syngenta deliberately established “lower barriers to entry” for Challenges posted internally. The organization estimates that the time required to post and evaluate a Challenge on InnoCentive@Work totals 4 man-hours at a fully loaded cost of $57.69 per hour per scientist (full-time equivalent [FTE]). Syngenta estimates that it will post a total of 48 Challenges in year 1 and 96 Challenges in years 2 and 3 on InnoCentive@Work. With these 240 Challenges, the internal labor for InnoCentive@Work Challenge formulation and evaluation totals $55,385.
ONRAMP Fees Syngenta emphasized the importance of the seminars and training provided through ONRAMP to implement a successful open innovation program within the organization. Syngenta held several workshops prior to the launch and during implementation of InnoCentive Challenges and InnoCentive@Work. The organization estimates that it has spent a total of $176,501 in ONRAMP training fees.
Administrative Costs The organization estimates that the internal labor required in administering the open innovation program and supporting InnoCentive Challenges and InnoCentive@Work requires a total of 1.5 FTEs annually. In addition to this, the organization estimates that 10% of a program leader’s time was required in the first year of implementation. At a fully loaded cost of $120,000 annually per FTE, Syngenta will incur $552,000 in administrative costs over three years for the program.
External Consultant Services Syngenta also engaged an external consultant to provide a day-long seminar on open innovation at $8,000 in professional services fees.
Total Costs Table 5 summarizes all costs associated with the organization’s implementation of InnoCentive Challenges, InnoCentive@Work, and ONRAMP.

The Total Economic Impact™ Of InnoCentive’s Enterprise Solution: Challenges, InnoCentive@Work, And ONRAMP
- 14 -
Table 5: Total Costs
Costs Initial Year 1 Year 2 Year 3 Total
Challenges posting fees (154,000) (231,000) (231,000) (616,000)
Internal support — Challenge formulation and evaluation
(140,000) (210,000) (210,000) (560,000)
Challenge awards (472,570) (708,855) (708,855) (1,890,280)
InnoCentive@Work fees (90,000) (201,900) (375,000) (375,000) (1,041,900)
Internal support — InnoCentive@Work (11,077) (22,154) (22,154) (55,385)
ONRAMP — training (47,497) (129,004) (176,501)
Administrative costs — Challenges and InnoCentive@Work
(12,000) (180,000) (180,000) (180,000) (552,000)
Professional fees — external consultants (8,000) (8,000)
Total ($157,497) ($1,288,551) ($1,727,009) ($1,727,009) ($4,900,066)
Source: Forrester Research, Inc.
Benefits Syngenta views InnoCentive Challenges, InnoCentive@Work, and ONRAMP as an integrated “enterprise solution” for championing open innovation within the company. InnoCentive@Work provides an internal collaborative forum and a “sustainable pipeline” for Challenges to be posted to InnoCentive Challenges. Training and services provided by ONRAMP during the planning and launch process promote cultural change and “break down barriers” for a successful implementation of the open innovation program.
When evaluating the ROI of its InnoCentive implementation, Syngenta did not distinguish the benefits among the different products. The benefits cited by the organization below are ascribed to the entire InnoCentive program as one enterprise solution for open innovation.
The main quantified benefits of using InnoCentive Challenges, InnoCentive@Work, and ONRAMP for Syngenta have been: 1) efficiency and cost savings from solutions generated by successful Challenges; 2) licensing and legal fee savings generated by InnoCentive’s IP transfer process; and 3) productivity savings for internal researchers.
Other benefits mentioned by Syngenta also include improved internal collaboration, access to external talent, improved analysis and evaluation of solutions, and faster and cost-effective supplemental research process.
The Total Economic Impact™ Of InnoCentive’s Enterprise Solution: Challenges, InnoCentive@Work, And ONRAMP
- 15 -
Cost Savings From Challenge Solutions When formulating the first Challenges to be posted on InnoCentive Challenges, the organization noted that a big push was made to post Challenges that were “focused on near-term actionable and critical projects.” Solutions to these Challenges then “created space in the budget” and allowed the organization to effectively justify its investment in the program.
The organization chose to prioritize posting difficult problems in areas of complex computational and basic biology, some of which had been industry problems for a number of years, to InnoCentive Challenges. Dr. Joseph Byrum, a senior project portfolio leader, noted: “We put up business-critical complex Challenges. We tried to break it [InnoCentive Challenges] to see if we could tactically use the InnoCentive program.”
The organization noted that out of the initial 14 Challenges it posted to the Open Innovation Marketplace, 12 of these yielded solutions for Syngenta. These solutions resulted in cost savings for the organization ranging from reduced FTE requirements for projects, more efficient work methodology, focused screening of targeted leads, to incremental scientific advancement.
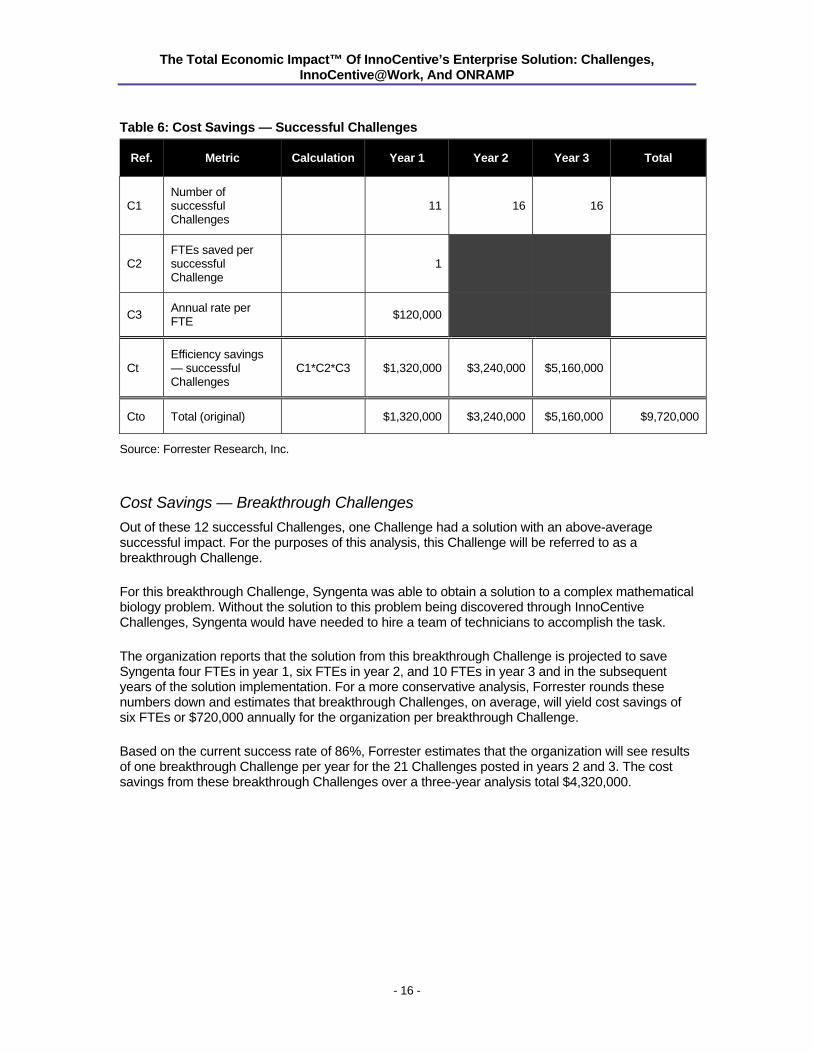
Cost Savings — Successful Challenges Out of these 12 successful Challenges, 11 Challenges have solutions with a moderately successful impact. These Challenges involved basic biology problems in the agribusiness sector.
The organization made a detailed analysis of the results of each of the initial Challenges and mapped out the benefits in yearly cost savings that each solved Challenge accrued. For the purposes of publication, the data from Syngenta’s analysis has been averaged.
Based on its analysis, Syngenta estimates that at a minimum, each moderately successful solution has yielded on average the equivalent of one FTE or $120,000 in annual cost savings. The organization also expects to post 21 Challenges in years 2 and 3 on the Open Innovation Marketplace through InnoCentive Challenges. Based on the current success rate of 86%, Forrester projects that 16 of those 21 Challenges will result in moderately successful solutions. The cost savings from these successful Challenges over a three-year analysis total $9,720,000.
The Total Economic Impact™ Of InnoCentive’s Enterprise Solution: Challenges, InnoCentive@Work, And ONRAMP
- 16 -
Table 6: Cost Savings — Successful Challenges
Ref. Metric Calculation Year 1 Year 2 Year 3 Total
C1 Number of successful Challenges
11 16 16
C2 FTEs saved per successful Challenge
1
C3 Annual rate per FTE $120,000
Ct Efficiency savings — successful Challenges
C1*C2*C3 $1,320,000 $3,240,000 $5,160,000
Cto Total (original) $1,320,000 $3,240,000 $5,160,000 $9,720,000
Source: Forrester Research, Inc.
Cost Savings — Breakthrough Challenges Out of these 12 successful Challenges, one Challenge had a solution with an above-average successful impact. For the purposes of this analysis, this Challenge will be referred to as a breakthrough Challenge.
For this breakthrough Challenge, Syngenta was able to obtain a solution to a complex mathematical biology problem. Without the solution to this problem being discovered through InnoCentive Challenges, Syngenta would have needed to hire a team of technicians to accomplish the task.
The organization reports that the solution from this breakthrough Challenge is projected to save Syngenta four FTEs in year 1, six FTEs in year 2, and 10 FTEs in year 3 and in the subsequent years of the solution implementation. For a more conservative analysis, Forrester rounds these numbers down and estimates that breakthrough Challenges, on average, will yield cost savings of six FTEs or $720,000 annually for the organization per breakthrough Challenge.
Based on the current success rate of 86%, Forrester estimates that the organization will see results of one breakthrough Challenge per year for the 21 Challenges posted in years 2 and 3. The cost savings from these breakthrough Challenges over a three-year analysis total $4,320,000.

The Total Economic Impact™ Of InnoCentive’s Enterprise Solution: Challenges, InnoCentive@Work, And ONRAMP
- 17 -
Table 7: Cost Savings — Breakthrough Challenges
Ref. Metric Calculation Year 1 Year 2 Year 3 Total
D1 Number of Challenges 1 1 1
D2 FTEs saved per successful Challenge 6
D3 Annual rate per FTE $120,000
Dt Efficiency savings — breakthrough Challenges
D1*D2*D3 $720,000 $1,440,000 $2,160,000
Dto Total (original) $720,000 $1,440,000 $2,160,000 $4,320,000
Source: Forrester Research, Inc.
Syngenta also noted that the seeds and traits product development process is based on successive screening. The single most important factor in determining the productivity of that process, measured in terms of quality of product output per unit of expense, is the accuracy of the screening methods. Many of these InnoCentive solutions have targeted complex basic biology problems in the agribusiness sector. These solutions have direct cost savings associated with the time to perform the analysis. These cost savings are what Forrester conservatively captures in this analysis.
Cost Avoidance — Licensing And Legal Fees The organization noted that InnoCentive’s template agreement for brokering the IP transfer between companies that post Challenges and entities that respond with solutions resulted in a more competitive licensing model for Syngenta. As contacts at Syngenta noted, “[The approach to licencing and legal fees is] low-risk and low-cost. With that template agreement, you can be in and out in 60 to 90 days.” Prior to InnoCentive, a more typical time frame to broker a deal for IP transfer would take the organization from nine to 12 months.
Syngenta estimates that by using the legal and licensing framework provided by InnoCentive, the organization has avoided the cost of internal licensing effort and legal fees valued conservatively at two FTEs. At a rate of $120,000 annually per fully loaded FTE, the cost avoidance savings for the organization over a three-year analysis total $720,000.

The Total Economic Impact™ Of InnoCentive’s Enterprise Solution: Challenges, InnoCentive@Work, And ONRAMP
- 18 -
Table 8: Cost Avoidance — Licensing And Legal Fees
Ref. Metric Calculation Per period Year 2 Year 3 Total
E1 Number of workers (saved) 2
E2 Yearly rate per worker $120,000
Et Cost avoidance — licensing and legal fees E1*E2 $240,000
Eto Total (original) $240,000 $240,000 $240,000 $720,000
Source: Forrester Research, Inc.
Researcher Time Saved For Posted Challenges The organization estimates that without the faster research process enabled by the internal and external collaboration through InnoCentive Challenges, InnoCentive@Work, and ONRAMP, its scientists would have spent more time and resources on the problems posted on the Open Innovation Marketplace and on InnoCentive@Work. With InnoCentive, Syngenta’s scientists are now freed up to work on other projects. As Syngenta noted, “InnoCentive helped solve problems that one company alone could not solve.”
For this conservative analysis, only the time saved from the problems posted on InnoCentive Challenges and not InnoCentive@Work is considered as a factor in this benefit category. Syngenta estimates that each posted Challenge has resulted in productivity savings for its researchers at a rate of 60 days or 480 man-hours. Forrester assumes that only 50% of this time saved is used for productive work. At a fully loaded hourly rate per scientist of $57.69, the total productivity savings for the organization total $775,385 over a three-year analysis.

The Total Economic Impact™ Of InnoCentive’s Enterprise Solution: Challenges, InnoCentive@Work, And ONRAMP
- 19 -
Table 9: Researcher Time Saved
Ref. Metric Calculation Year 1 Year 2 Year 3 Total
F1 Number of Challenges 14 21 21
F2 Hourly rate per worker $120,000 / 2080 $57.69
F3 Number of hours (saved) 480
F4 Percent captured 50%
Ft Researcher time saved — posted Challenges
F1*F2*F3*F4 $193,846 $290,769 $290,769
Fto Total (original) $193,846 $290,769 $290,769 $775,385
Source: Forrester Research, Inc.
Total Benefits Syngenta’s expected total quantified benefits from InnoCentive Challenges, InnoCentive@Work, and ONRAMP are summarized in the table below.
Table 10: Total Benefits
Benefits Initial Year 1 Year 2 Year 3 Total
Efficiency savings — successful Challenges 1,320,000 3,240,000 5,160,000 9,720,000
Efficiency savings — breakthrough Challenges 720,000 1,440,000 2,160,000 4,320,000
Cost avoidance — licensing and legal fees 240,000 240,000 240,000 720,000
Researcher time saved — posted Challenges 193,846 290,769 290,769 775,385
Total $2,473,846 $5,210,769 $7,850,769 $15,535,385
Source: Forrester Research, Inc.
Additional Benefits (Not Quantified) Syngenta identified the following qualitative benefits of using InnoCentive Challenges, InnoCentive@Work, and ONRAMP.

The Total Economic Impact™ Of InnoCentive’s Enterprise Solution: Challenges, InnoCentive@Work, And ONRAMP
- 20 -
Changing Syngenta’s Innovation Capability Using InnoCentive also provided Syngenta with an alternative research process that was fast and cost-efficient to supplement its resources. Syngenta noted that “the key to the InnoCentive approach is to take high-risk projects and make them low-risk.” Having access to a wide range of external and internal experts through the collaborative forums enabled more solution possibilities for posted problems and, subsequently, a faster investigative process for Syngenta’s researchers. Going to other institutions such as universities for these experts would have resulted in “millions in investment” for each solution, whereas rewards paid out to InnoCentive Solvers were quite moderate in comparison. The organization also viewed using InnoCentive as a “variable versus fixed cost play.” In an economic downturn, fixed costs for hiring the resources and setting up the infrastructure to get access to these solutions would not be viable. Syngenta’s use of InnoCentive as a variable expense (by paying for each posted Challenge and paying for performance — awards for solutions) allows the company to investigate what would usually be considered as high-cost, high-risk projects.
Improved Internal Collaboration “Through InnoCentive@Work, we want to start a conversation. There are people in the same building who would never have met [if not for the program]. Major sites worldwide are collaborating in a way they have never been.” (Senior project portfolio leader, Syngenta)
The organization noted that through effective training and lowering the barriers for participation in InnoCentive@Work, the organization has seen improved internal collaboration. One location in Hawaii was able to get better suggestions on the use of greenhouses. Another posted problem resulted in collaboration between researchers in North Carolina and the UK. Syngenta was committed to training at a level that ensured successful implementation of the program, which would make it easier for cross-country sites to collaborate. “The first quarter we launched, we saw a good response to the collaborative forum,” Dr. Byrum said.
Access To External Talent Outside The Agribusiness Field Syngenta noted that deploying InnoCentive has provided the organization with access to external scientists who, while not working specifically in Syngenta’s industries, would have the knowledge and the skills to provide solutions to Syngenta’s posted Challenges. While hiring these external talents who specialize in other fields would not be an option for Syngenta, the organization would still have access to their tangential knowledge through InnoCentive’s Open Innovation Marketplace.
Improved Research Process Syngenta also cited that the development of successful Challenges, and the review of solutions from these Challenges, is improving the ability of Syngenta scientists to formulate precise questions. This, in turn, enhances the likelihood of achieving solutions, faster and at lower cost, throughout their research work.
Another area of improvement in the research process noted by the organization was in the value provided by InnoCentive for Syngenta to evaluate possible solutions “in parallel versus serial.” Without InnoCentive, a Syngenta researcher working on a problem would have had to test possible solutions one after the other. With InnoCentive, these researchers now have access to all the possible solutions at once in the evaluation process. “While you might be rejecting most solutions, there is still value in knowing what works and what does not work,” the organization noted.

The Total Economic Impact™ Of InnoCentive’s Enterprise Solution: Challenges, InnoCentive@Work, And ONRAMP
- 21 -
Risk Risk is the third component within the TEI model; it is used as a filter to capture the uncertainty surrounding different cost and benefit estimates. If a risk-adjusted ROI still demonstrates a compelling business case, it raises confidence that the investment is likely to succeed because the risks that threaten the project have been taken into consideration and quantified. The risk-adjusted numbers should be taken as “realistic” expectations, as they represent the expected values considering risk. In general, risks affect costs by raising the original estimates, and they affect benefits by reducing the original estimates.
For the purpose of this analysis, Forrester risk-adjusts cost and benefit estimates to better reflect the level of uncertainty that exists for each estimate. The TEI model uses a triangular distribution method to calculate risk-adjusted values. To construct the distribution, it is necessary to first estimate the low, most likely, and high values that could occur within the current environment. The risk-adjusted value is the mean of the distribution of those points.
For example, take the case of administrative costs for InnoCentive Challenges and InnoCentive@Work. The $552,000 value used in this analysis can be considered the “most likely” or expected value. Internal labor costs may vary based on the nature of the Challenge. This variability represents a risk that must be captured as part of this study. Forrester uses a risk factor of 105% on the high end, 100% as the most likely, and 100% on the low end. This has the effect of increasing the cost estimate to take into account the fact that original cost estimates are more likely to be revised upward than downward. Forrester then creates a triangular distribution to reflect the range of expected costs, with 102% as the mean (102% is equal to the sum of 105%, 100%, and 100% divided by three). Forrester applies this mean to the most likely estimate, $552,000, to arrive at a risk-adjusted value of $563,040.
Risk adjustments for benefits reduce the original benefits estimates. For example, Forrester applies a risk range of 95% on the low end of the estimate and 100% on the most likely and on the high end for cost savings from the alternative of using internal resources. This has the effect of reducing the benefit estimate by 2%, equal to 98% of the original value.
The following risks were considered in this study:
• Variability in labor savings. Internal labor costs required for Challenge formulation and evaluation may vary according to the different types of problems posted on InnoCentive Challenges or InnoCentive@Work. There may also be variability in internal resources needed to administer and support the InnoCentive program.
• Implementation risks. This is due to the variability in awards given to successful Challenges throughout the three-year analysis.
• Variability in efficiency savings and cost avoidance. Benefits in the areas of efficiency savings, productivity savings, and cost avoidance may vary by Challenge.
The following tables show the values used to adjust for uncertainty in cost and benefit estimates. Different cost and benefit estimates have different levels of risk adjustments depending on variability and other factors. Readers are urged to apply their own risk ranges based on their own degree of confidence in the cost and benefit estimates.

The Total Economic Impact™ Of InnoCentive’s Enterprise Solution: Challenges, InnoCentive@Work, And ONRAMP
- 22 -
Table 11: Risk Factors — Costs
Costs Original estimate Low High Mean
Challenges posting fees 100% 100% 100% 100%
Internal support — Challenge formulation and evaluation 100% 100% 105% 102%
Challenge awards 100% 100% 125% 108%
InnoCentive@Work fees 100% 100% 100% 100%
ONRAMP — training 100% 100% 105% 102%
Administrative costs — Challenges and InnoCentive@Work 100% 100% 105% 102%
Internal support — InnoCentive@Work 100% 100% 110% 103%
Professional fees — external consultants 100% 100% 100% 100%
Source: Forrester Research, Inc.
Table 12: Risk Factors — Benefits
Benefits Original estimate Low High Mean
Efficiency savings — successful Challenges 100% 85% 100% 95%
Efficiency savings — breakthrough Challenges 100% 85% 100% 95%
Cost avoidance — licensing and legal fees 100% 95% 100% 98%
Researcher time saved — posted Challenges 100% 90% 100% 97%
Source: Forrester Research, Inc.
The risk factors in Tables 11 and 12 are applied to the benefits and costs listed earlier, resulting in the risk-adjusted cost and benefit values in Tables 13 and 14.

The Total Economic Impact™ Of InnoCentive’s Enterprise Solution: Challenges, InnoCentive@Work, And ONRAMP
- 23 -
Table 13: Total Costs — Risk-Adjusted
Cost
Step 1: Step 2:
Original estimate Low High
Risk adjustment
% Value
Challenges posting fees $616,000 $616,000 $616,000 100% $616,000
Internal support — Challenge formulation and evaluation $560,000 $560,000 $588,000 102% $571,200
Challenge awards $1,890,280 $1,890,280 $2,362,850 108% $2,041,502
InnoCentive@Work fees $1,041,900 $1,041,900 $1,041,900 100% $1,041,900
ONRAMP — training $176,501 $176,501 $185,326 102% $180,031
Administrative costs — Challenges and InnoCentive@Work
$552,000 $552,000 $579,600 102% $563,040
Internal support — InnoCentive@Work $55,385 $55,385 $60,923 103% $57,046
Professional fees — external consultants $8,000 $8,000 $8,000 100% $8,000
Source: Forrester Research, Inc.
Table 14: Total Benefits — Risk-Adjusted
Benefit
Step 1: Step 2:
Original estimate Low High
Risk adjustment
% Value
Efficiency savings — successful Challenges $9,720,000 $8,262,000 $9,720,000 95% $9,234,000
Efficiency savings — breakthrough Challenges $4,320,000 $3,672,000 $4,320,000 95% $4,104,000
Cost avoidance — licensing and legal fees $720,000 $684,000 $720,000 98% $705,600
Researcher time saved — posted Challenges $775,385 $697,846 $775,385 97% $752,123
Source: Forrester Research, Inc.

The Total Economic Impact™ Of InnoCentive’s Enterprise Solution: Challenges, InnoCentive@Work, And ONRAMP
- 24 -
Flexibility Flexibility, as defined by Forrester’s TEI methodology, represents an investment in additional capacity or agility today that can be turned into future business benefits at some additional cost. This provides an organization with the “right” or the ability to engage in future initiatives but not the obligation to do so.
Although data for calculating the value of several flexibility options is insufficient at this time, Forrester identified the following areas that present flexibility options for Syngenta through InnoCentive Challenges, InnoCentive@Work, and ONRAMP:
• Expanding the number of problems posted through InnoCentive Challenges and InnoCentive@Work provides the possibility of additional benefits from the successful solutions for these Challenges.
• Direct cost efficiency savings from the internal collaboration on InnoCentive@Work could result in additional quantifiable benefits for the organization as Syngenta expands the program internally.
The value of flexibility is unique to each organization, and the willingness to measure this value varies from company to company. (See Appendix A for additional information regarding the flexibility calculation.)
TEI Framework: Summary Considering the financial framework constructed above, the results of the Costs, Benefits, Risk, and Flexibility sections using the representative numbers can be used to determine an ROI, NPV, and payback period. Table 15 shows the consolidation of the numbers for the organization.
Table 15: Total Costs And Benefits, Non-Risk-Adjusted
Ref. Project cash flow Calculation Initial
cost Year 1 Year 2 Year 3 Total PV/NPV
G1 Total costs ($157,497) ($1,288,551) ($1,727,009) ($1,727,009) ($4,900,066) ($4,053,715)
H1 Total benefits $0 $2,473,846 $5,210,769 $7,850,769 $15,535,385 $12,453,771
I1 Net savings $1,185,295 $3,483,760 $6,123,760 $10,635,319 $8,400,056
J1 ROI (J1-H1)/H1 207%
Source: Forrester Research, Inc.
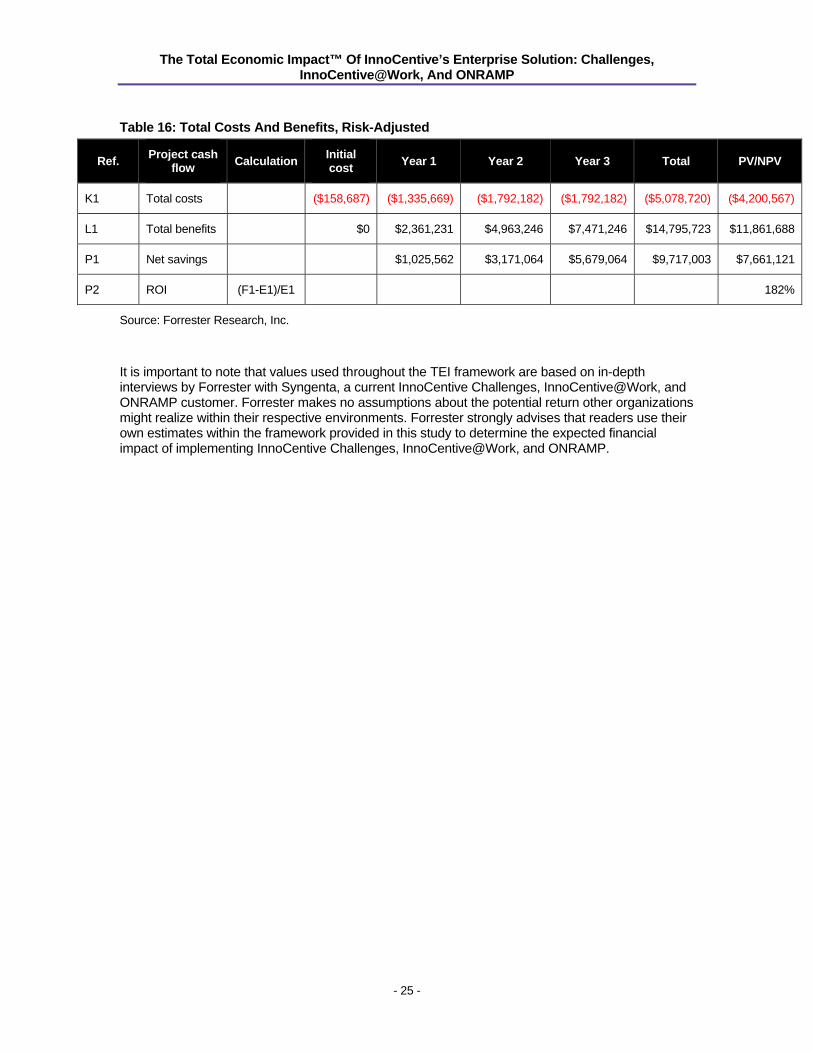
Table 16 shows the risk-adjusted values, applying the risk-adjustment method indicated in the Risk section.
The Total Economic Impact™ Of InnoCentive’s Enterprise Solution: Challenges, InnoCentive@Work, And ONRAMP
- 25 -
Table 16: Total Costs And Benefits, Risk-Adjusted
Ref. Project cash flow Calculation Initial
cost Year 1 Year 2 Year 3 Total PV/NPV
K1 Total costs ($158,687) ($1,335,669) ($1,792,182) ($1,792,182) ($5,078,720) ($4,200,567)
L1 Total benefits $0 $2,361,231 $4,963,246 $7,471,246 $14,795,723 $11,861,688
P1 Net savings $1,025,562 $3,171,064 $5,679,064 $9,717,003 $7,661,121
P2 ROI (F1-E1)/E1 182%
Source: Forrester Research, Inc.
It is important to note that values used throughout the TEI framework are based on in-depth interviews by Forrester with Syngenta, a current InnoCentive Challenges, InnoCentive@Work, and ONRAMP customer. Forrester makes no assumptions about the potential return other organizations might realize within their respective environments. Forrester strongly advises that readers use their own estimates within the framework provided in this study to determine the expected financial impact of implementing InnoCentive Challenges, InnoCentive@Work, and ONRAMP.

The Total Economic Impact™ Of InnoCentive’s Enterprise Solution: Challenges, InnoCentive@Work, And ONRAMP
- 26 -
Study Conclusions Forrester’s in-depth interviews with Syngenta, an InnoCentive Challenges, InnoCentive@Work, and ONRAMP customer, yielded several important observations:
• Based on information collected in interviews with Syngenta, Forrester found that organizations can realize benefits in the form of efficiency and cost savings from solutions generated by successful Challenges, licensing and legal fee savings generated by InnoCentive’s faster IP transfer process, and productivity savings for internal researchers.
• Other qualitative benefits include changing Syngenta’s innovation capability, improved internal collaboration, access to external talent outside the agribusiness field, and an improved research process.
• Implementing an innovation initiative through InnoCentive Challenges, InnoCentive@Work, and ONRAMP required extensive planning and training through all levels of the Syngenta organization to fully effect the cultural change required for a successful project.
• Syngenta relied heavily on ONRAMP services and InnoCentive@Work to reinforce the culture of problem solving within the organization to drive the successful Challenges posted on the Open Innovation Marketplace.
The financial analysis provided in this study illustrates the potential way an organization can evaluate the value proposition of InnoCentive Challenges, InnoCentive@Work, and ONRAMP. Based on information collected in in-depth customer interviews, Forrester calculated a three-year, risk-adjusted ROI of 182% for the organization, with a payback period of fewer than two months. All final estimates are risk-adjusted to incorporate potential uncertainty in the calculation of costs and benefits.
Based on these findings, companies looking to implement InnoCentive Challenges, InnoCentive@Work, and ONRAMP can see efficiency, productivity and labor savings, improved internal collaboration, and greater access to a network of experts. Using the TEI framework, many companies may find the potential for a compelling business case to make such an investment.
Table 17: ROI, Original And Risk-Adjusted
Summary financial results Original estimate Risk-adjusted
ROI 207% 182%
Payback period (years) 0.1 0.2
Total costs (PV) ($4,053,715) ($4,200,567)
Total benefits (PV) $12,453,771 $11,861,688
Total (NPV) $8,400,056 $7,661,121
Source: Forrester Research, Inc.
The Total Economic Impact™ Of InnoCentive’s Enterprise Solution: Challenges, InnoCentive@Work, And ONRAMP
- 27 -
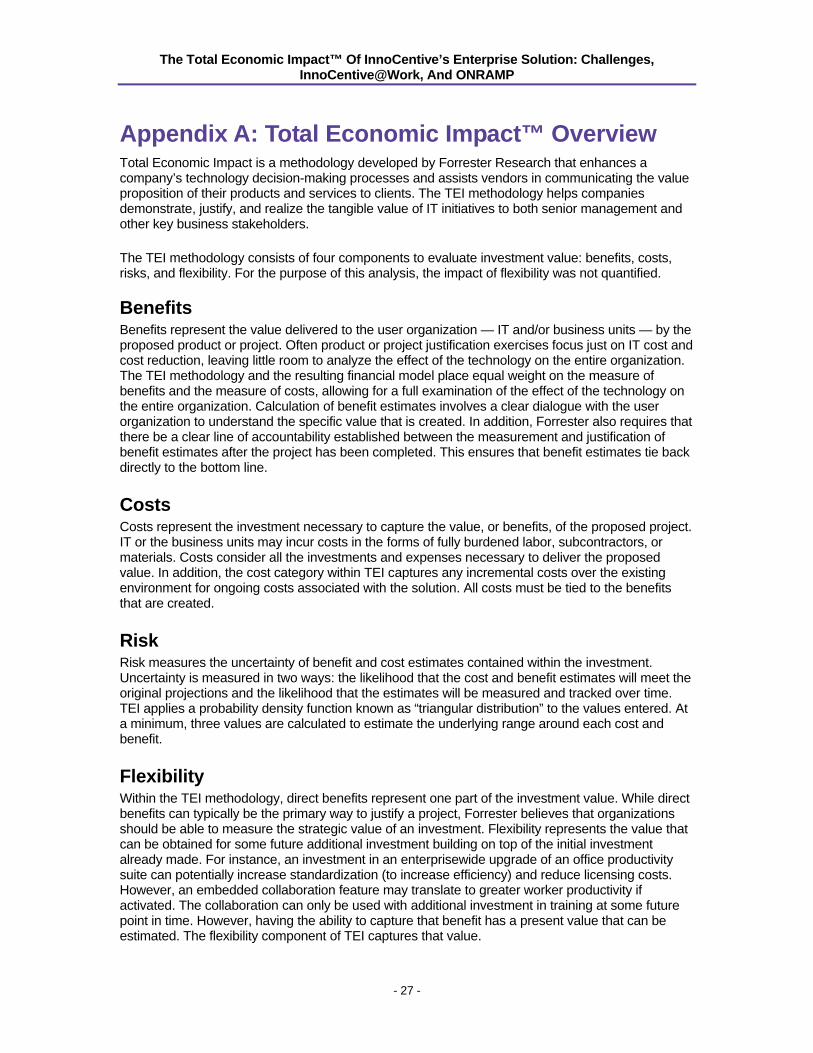
Appendix A: Total Economic Impact™ Overview Total Economic Impact is a methodology developed by Forrester Research that enhances a company’s technology decision-making processes and assists vendors in communicating the value proposition of their products and services to clients. The TEI methodology helps companies demonstrate, justify, and realize the tangible value of IT initiatives to both senior management and other key business stakeholders.
The TEI methodology consists of four components to evaluate investment value: benefits, costs, risks, and flexibility. For the purpose of this analysis, the impact of flexibility was not quantified.
Benefits Benefits represent the value delivered to the user organization — IT and/or business units — by the proposed product or project. Often product or project justification exercises focus just on IT cost and cost reduction, leaving little room to analyze the effect of the technology on the entire organization. The TEI methodology and the resulting financial model place equal weight on the measure of benefits and the measure of costs, allowing for a full examination of the effect of the technology on the entire organization. Calculation of benefit estimates involves a clear dialogue with the user organization to understand the specific value that is created. In addition, Forrester also requires that there be a clear line of accountability established between the measurement and justification of benefit estimates after the project has been completed. This ensures that benefit estimates tie back directly to the bottom line.
Costs Costs represent the investment necessary to capture the value, or benefits, of the proposed project. IT or the business units may incur costs in the forms of fully burdened labor, subcontractors, or materials. Costs consider all the investments and expenses necessary to deliver the proposed value. In addition, the cost category within TEI captures any incremental costs over the existing environment for ongoing costs associated with the solution. All costs must be tied to the benefits that are created.
Risk Risk measures the uncertainty of benefit and cost estimates contained within the investment. Uncertainty is measured in two ways: the likelihood that the cost and benefit estimates will meet the original projections and the likelihood that the estimates will be measured and tracked over time. TEI applies a probability density function known as “triangular distribution” to the values entered. At a minimum, three values are calculated to estimate the underlying range around each cost and benefit.
Flexibility Within the TEI methodology, direct benefits represent one part of the investment value. While direct benefits can typically be the primary way to justify a project, Forrester believes that organizations should be able to measure the strategic value of an investment. Flexibility represents the value that can be obtained for some future additional investment building on top of the initial investment already made. For instance, an investment in an enterprisewide upgrade of an office productivity suite can potentially increase standardization (to increase efficiency) and reduce licensing costs. However, an embedded collaboration feature may translate to greater worker productivity if activated. The collaboration can only be used with additional investment in training at some future point in time. However, having the ability to capture that benefit has a present value that can be estimated. The flexibility component of TEI captures that value.
The Total Economic Impact™ Of InnoCentive’s Enterprise Solution: Challenges, InnoCentive@Work, And ONRAMP
- 28 -
Appendix B: Glossary Discount rate: The interest rate used in cash flow analysis to take into account the time value of money. Although the Federal Reserve Bank sets a discount rate, companies often set a discount rate based on their business and investment environment. Forrester assumes a yearly discount rate of 10% for this analysis. Organizations typically use discount rates between 8% and 16% based on their current environment. Readers are urged to consult their organization to determine the most appropriate discount rate to use in their own environment.
Net present value (NPV): the present or current value of (discounted) future net cash flows given an interest rate (the discount rate). A positive project NPV normally indicates that the investment should be made, unless other projects have higher NPVs.
Present value (PV): the present or current value of (discounted) cost and benefit estimates given at an interest rate (the discount rate). The PV of costs and benefits feed into the total net present value of cash flows.
Payback period: the breakeven point for an investment. The point in time at which net benefits (benefits minus costs) equal initial investment or cost.
Return on investment (ROI): a measure of a project’s expected return in percentage terms. ROI is calculated by dividing net benefits (benefits minus costs) by costs.
A Note On Cash Flow Tables The following is a note on the cash flow tables used in this study (see the Example Table below). The initial investment column contains costs incurred at “time 0” or at the beginning of Year 1. Those costs are not discounted. All other cash flows in Years 1 through 3 are discounted using the discount rate shown in Table 2 at the end of the year. Present value (PV) calculations are calculated for each total cost and benefit estimate. Net present value (NPV) calculations are not calculated until the summary tables and are the sum of the initial investment and the discounted cash flows in each year.
Example Table
Ref. Category Calculation Initial cost Year 1 Year 2 Year 3 Total
Source: Forrester Research, Inc.

The Total Economic Impact™ Of InnoCentive’s Enterprise Solution: Challenges, InnoCentive@Work, And ONRAMP
- 29 -
Appendix C: About The Project Manager Michelle Bishop Senior Consultant
Michelle S. Bishop is a senior consultant with Forrester's Total Economic Impact (TEI) consulting practice. The TEI methodology focuses on measuring and communicating the value of IT and business decisions and solutions as well as providing an ROI business case based on the costs, benefits, risks, and flexibility of investments.
Prior to joining Forrester, Michelle held leadership roles in operations, technology, and marketing in such large organizations as Shell Corporation and Avaya. At Shell, she was a product manager for LPG retail distribution initiatives as well as project lead for quality and information security at Shell Philippines. While working at Avaya, she led the inventory reduction program and consulted on various aftermarket operations projects. Michelle also came to Forrester with process improvement and account management experience in high-growth startups in media and digital services.
Michelle holds a B.S. in industrial engineering from the University of the Philippines and an MBA from the MIT Sloan School of Management.