Embed Size (px)
Citation preview


Prepared by:
Under a Cooperative Agreement with
U. S. Environmental Protection Agency

Revision No.: 03 Date: September 2003
GENERIC VERIFICATION PROTOCOL FOR DETERMINATION OF EMISSIONSREDUCTIONS OBTAINED BY USE OF ALTERNATIVE OR REFORMULATEDLIQUID FUELS, FUEL ADDITIVES, FUEL EMULSIONS, AND LUBRICANTS
FOR HIGHWAY AND NONROAD USE DIESEL ENGINESAND LIGHT DUTY GASOLINE ENGINES AND VEHICLES
EPA Cooperative Agreement No. CR829434-01-1RTI Project No. 08281-001-003
Prepared by:
APPROVED BY:
APCTVC Director: J. R. Farmer Original signed by J.R. Farmer Date: 10/7/03
APCTVC Quality Manager: C. E. Tatsch Original signed by C.E. Tatsch Date: 10/8/03
APCTVC Task Leader: J. M. Elion Original signed by J.M. Elion Date: 10/7/03
EPA Project Manager: T. G. Brna Original signed by T.G. Brna Date: 10/2/03
EPA Quality Manager: P. W. Groff Original signed by P.W. Groff Date:10/2/03

Revision No.: 03 Date: September 2003
Table of Contents
Section Page
1.0 INTRODUCTION . . . . . . . . . . . . . . . . . . . . . . . . . . . . . . . . . . . . . . . . . . . . . . . . . . . . . . . . . . . . 1 1.1 Environmental Technology Verification . . . . . . . . . . . . . . . . . . . . . . . . . . . . . . . . . . . . . 1 1.2 Air Pollution Control Technology Verification Center . . . . . . . . . . . . . . . . . . . . . . . . . . 2 1.3 The APCTVC Mobile Sources Verification Program . . . . . . . . . . . . . . . . . . . . . . . . . . . 2 1.4 Quality Management . . . . . . . . . . . . . . . . . . . . . . . . . . . . . . . . . . . . . . . . . . . . . . . . . . . . 4
2.0 OBJECTIVE AND SCOPE . . . . . . . . . . . . . . . . . . . . . . . . . . . . . . . . . . . . . . . . . . . . . . . . . . . . . 5 2.1 Objective . . . . . . . . . . . . . . . . . . . . . . . . . . . . . . . . . . . . . . . . . . . . . . . . . . . . . . . . . . . . . 5 2.2 Scope . . . . . . . . . . . . . . . . . . . . . . . . . . . . . . . . . . . . . . . . . . . . . . . . . . . . . . . . . . . . . . . . 5 2.3 Applicability . . . . . . . . . . . . . . . . . . . . . . . . . . . . . . . . . . . . . . . . . . . . . . . . . . . . . . . . . . 6
2.3.1 Applicability of ETV Results to Other Engines and Engine Families . . . . . . . . 6 2.3.2 Relationship of ETV Program to EPA-OTAQ VDRP Verified
Technology List . . . . . . . . . . . . . . . . . . . . . . . . . . . . . . . . . . . . . . . . . . . . . . . . . 6 2.3.3 Assignment of Emissions Benefits to FMs . . . . . . . . . . . . . . . . . . . . . . . . . . . . . 6
2.4 Data Quality Objectives . . . . . . . . . . . . . . . . . . . . . . . . . . . . . . . . . . . . . . . . . . . . . . . . . . 7
3.0 ETV RESPONSIBILITIES . . . . . . . . . . . . . . . . . . . . . . . . . . . . . . . . . . . . . . . . . . . . . . . . . . . . . . 8
4.0 APPLICATION AND TECHNOLOGY DESCRIPTION . . . . . . . . . . . . . . . . . . . . . . . . . . . . . . 9 4.1 Manufacturer Information . . . . . . . . . . . . . . . . . . . . . . . . . . . . . . . . . . . . . . . . . . . . . . . . 9 4.2 Fuel Modification Descriptive Information . . . . . . . . . . . . . . . . . . . . . . . . . . . . . . . . . . . 9 4.3 Test Information . . . . . . . . . . . . . . . . . . . . . . . . . . . . . . . . . . . . . . . . . . . . . . . . . . . . . . 10 4.4 Component Information . . . . . . . . . . . . . . . . . . . . . . . . . . . . . . . . . . . . . . . . . . . . . . . . . 10
5.0 ETV TESTING . . . . . . . . . . . . . . . . . . . . . . . . . . . . . . . . . . . . . . . . . . . . . . . . . . . . . . . . . . . . . . 10 5.1 Test Design and Data Analysis for ETV of FMs . . . . . . . . . . . . . . . . . . . . . . . . . . . . . . 10
5.1.1 Overview of Testing Requirements . . . . . . . . . . . . . . . . . . . . . . . . . . . . . . . . . 10 5.1.2 Test Design Requirement for Single Engine Verification . . . . . . . . . . . . . . . . 11 5.1.3 Analysis of Combined Emissions Data . . . . . . . . . . . . . . . . . . . . . . . . . . . . . . 12
5.2 ETV Testing for Diesel FMs . . . . . . . . . . . . . . . . . . . . . . . . . . . . . . . . . . . . . . . . . . . . 16 5.2.1 Diesel Base Fuels . . . . . . . . . . . . . . . . . . . . . . . . . . . . . . . . . . . . . . . . . . . . . . . 16 5.2.2 Selection of Engines for ETV Testing . . . . . . . . . . . . . . . . . . . . . . . . . . . . . . . 17 5.2.3 Test Procedures—General Requirements . . . . . . . . . . . . . . . . . . . . . . . . . . . . . 18 5.2.4 ETV of Diesel FMs Delivering Immediate Emission Reductions . . . . . . . . . . 19 5.2.5 FMs Delivering Cumulative Emission Reductions . . . . . . . . . . . . . . . . . . . . . 22
iii

Revision No.: 03 Date: September 2003
5.3 ETV of Gasoline FMs . . . . . . . . . . . . . . . . . . . . . . . . . . . . . . . . . . . . . . . . . . . . . . . . . . 22 5.3.1 Base Fuels . . . . . . . . . . . . . . . . . . . . . . . . . . . . . . . . . . . . . . . . . . . . . . . . . . . . . 22 5.3.2 Test Vehicles . . . . . . . . . . . . . . . . . . . . . . . . . . . . . . . . . . . . . . . . . . . . . . . . . . 22 5.3.3 General Test Procedures . . . . . . . . . . . . . . . . . . . . . . . . . . . . . . . . . . . . . . . . . . 23 5.3.4 Gasoline FMs Delivering Immediate Emission Effects . . . . . . . . . . . . . . . . . . 24 5.3.5 ETV of Gasoline Cumulative Effect FMs . . . . . . . . . . . . . . . . . . . . . . . . . . . . 25
5.4 ETV of Lubricant FMs . . . . . . . . . . . . . . . . . . . . . . . . . . . . . . . . . . . . . . . . . . . . . . . . . 25 5.4.1 Candidate Lubricants . . . . . . . . . . . . . . . . . . . . . . . . . . . . . . . . . . . . . . . . . . . . 26 5.4.2 Base Lubricant and Test Fuel . . . . . . . . . . . . . . . . . . . . . . . . . . . . . . . . . . . . . . 27 5.4.3 Highway Use Test Engines or Vehicles . . . . . . . . . . . . . . . . . . . . . . . . . . . . . . 28 5.4.4 Nonroad Engine Selection . . . . . . . . . . . . . . . . . . . . . . . . . . . . . . . . . . . . . . . . 28 5.4.5 General Test Procedures . . . . . . . . . . . . . . . . . . . . . . . . . . . . . . . . . . . . . . . . . . 28 5.4.6 Lubricant FM ETV Test Sequences . . . . . . . . . . . . . . . . . . . . . . . . . . . . . . . . . 29 5.4.7 Evaluating Results . . . . . . . . . . . . . . . . . . . . . . . . . . . . . . . . . . . . . . . . . . . . . . 31
6.0 REPORTING AND DOCUMENTATION . . . . . . . . . . . . . . . . . . . . . . . . . . . . . . . . . . . . . . . . . 31 6.1 Reports . . . . . . . . . . . . . . . . . . . . . . . . . . . . . . . . . . . . . . . . . . . . . . . . . . . . . . . . . . . . . . 32 6.2 Data Reduction . . . . . . . . . . . . . . . . . . . . . . . . . . . . . . . . . . . . . . . . . . . . . . . . . . . . . . . 32
7.0 DISSEMINATION OF ETV REPORTS AND STATEMENTS . . . . . . . . . . . . . . . . . . . . . . . . 33
8.0 APPLICANT’S OPTIONS SHOULD A TECHNOLOGY PERFORM BELOWEXPECTATIONS . . . . . . . . . . . . . . . . . . . . . . . . . . . . . . . . . . . . . . . . . . . . . . . . . . . . . . . . . . . . 33
9.0 LIMITATIONS ON TESTING AND REPORTING . . . . . . . . . . . . . . . . . . . . . . . . . . . . . . . . . 34
10.0 REQUIREMENTS FOR TEST/QA PLAN . . . . . . . . . . . . . . . . . . . . . . . . . . . . . . . . . . . . . . . . 34 10.1 Quality Management . . . . . . . . . . . . . . . . . . . . . . . . . . . . . . . . . . . . . . . . . . . . . . . . . . . 34 10.2 Quality Assurance . . . . . . . . . . . . . . . . . . . . . . . . . . . . . . . . . . . . . . . . . . . . . . . . . . . . . 34 10.3 Additional Requirements To Be Included in Test/QA Plan . . . . . . . . . . . . . . . . . . . . . 36
11.0 ASSESSMENT AND RESPONSE . . . . . . . . . . . . . . . . . . . . . . . . . . . . . . . . . . . . . . . . . . . . . . 36 11.1 Assessment Types . . . . . . . . . . . . . . . . . . . . . . . . . . . . . . . . . . . . . . . . . . . . . . . . . . . . . 36 11.2 Assessment Frequency . . . . . . . . . . . . . . . . . . . . . . . . . . . . . . . . . . . . . . . . . . . . . . . . . . 37 11.3 Response to Assessment . . . . . . . . . . . . . . . . . . . . . . . . . . . . . . . . . . . . . . . . . . . . . . . . 37
12.0 SAFETY MEASURES . . . . . . . . . . . . . . . . . . . . . . . . . . . . . . . . . . . . . . . . . . . . . . . . . . . . . . . . 37 12.1 Safety Responsibilities . . . . . . . . . . . . . . . . . . . . . . . . . . . . . . . . . . . . . . . . . . . . . . . . . . 37 12.2 Safety Program . . . . . . . . . . . . . . . . . . . . . . . . . . . . . . . . . . . . . . . . . . . . . . . . . . . . . . . . 38
13.0 REFERENCES . . . . . . . . . . . . . . . . . . . . . . . . . . . . . . . . . . . . . . . . . . . . . . . . . . . . . . . . . . . . . . 38
iv

Revision No.: 03 Date: September 2003
APPENDIX A: EXAMPLE VERIFICATION STATEMENT . . . . . . . . . . . . . . . . . . . . . . . . . . . . A-1
APPENDIX B: DETERMINING MINIMUM NUMBER OF TESTS REQUIRED ATEACH TEST POINT . . . . . . . . . . . . . . . . . . . . . . . . . . . . . . . . . . . . . . . . . . . . . . . B-1
APPENDIX C: USE OF LOG SCALE TO TEST EMISSIONS REDUCTIONS . . . . . . . . . . . . . . C-1
APPENDIX D: DATA ANALYSIS FOR CUMULATIVE EFFECT FMs . . . . . . . . . . . . . . . . . . D-1
APPENDIX E: SINGLE VEHICLE TESTS FOR LUBRICANTS . . . . . . . . . . . . . . . . . . . . . . . . E-1
APPENDIX F: SENSITIVITY OF NUMBER OF TESTS CALCULATION TO MEASUREMENTVARIABILITY . . . . . . . . . . . . . . . . . . . . . . . . . . . . . . . . . . . . . . . . . . . . . . . . . . . . . F-1
v

Revision No.: 03 Date: September 2003
List of Tables
Table Page
1. Overview of Mobile Source ETV Process and Participants’ Responsibilities . . . . . . . . . . . . . . . 1 2. Summary of Tests Required at Each Test Point . . . . . . . . . . . . . . . . . . . . . . . . . . . . . . . . . . . . . 11 3. Properties of Base Fuel for ETV of Diesel FMs . . . . . . . . . . . . . . . . . . . . . . . . . . . . . . . . . . . . 17 4. Minimum ETV Test Program for Single On-highway Diesel Engine and
Immediate Effect FM . . . . . . . . . . . . . . . . . . . . . . . . . . . . . . . . . . . . . . . . . . . . . . . . . . . . . . . . . 20 5. FM Lubricant Properties and Tests . . . . . . . . . . . . . . . . . . . . . . . . . . . . . . . . . . . . . . . . . . . . . . 27 6. Lubricant FM Test Sequences . . . . . . . . . . . . . . . . . . . . . . . . . . . . . . . . . . . . . . . . . . . . . . . . . . 30
List of Figures
Figure Page
1. Performance Model and Testing for Cumulative Effects FMs . . . . . . . . . . . . . . . . . . . . . . . . . . 15 2. Lubricant FM Testing . . . . . . . . . . . . . . . . . . . . . . . . . . . . . . . . . . . . . . . . . . . . . . . . . . . . . . . . . 30
vi

Revision No.: 03 Date: September 2003
ABBREVIATIONS AND ACRONYMS
APCT air pollution control technology APCTVC Air Pollution Control Technology Verification Center BSFC brake-specific fuel consumption CARB California Air Resources Board CBI confidential business information CFR Code of Federal Regulations CI confidence interval CO carbon monoxide CO2 carbon dioxide CTM conditional test method DEC diesel exhaust catalyst DQO data quality objective EGR exhaust gas recirculation EPA Environmental Protection Agency ETV Environmental Technology Verification Program FM fuel modification FTIR Fourier transform infrared FTP federal test procedure g/bhp-hr grams per brake horsepower-hour g/kWh grams per kilowatt-hour GVP generic verification protocol HAP hazardous air pollutant HC hydrocarbon HHD heavy-heavy duty hp horsepower LDV light duty vehicle LHD light-heavy duty MHD medium-heavy duty MIL maintenance indicator light NH3 ammonia NMHC non-methane hydrocarbon NOX nitrogen oxides OBD on-board detection OEM original equipment manufacturer ORD Office of Research and Development OTAQ Office of Transportation and Air Quality PCV positive crankcase ventilation PM particulate matter ppm parts per million QA quality assurance QC quality control QMP quality management plan RFG reformulated gasoline RTI Research Triangle Institute SAC stakeholders advisory committee SCR selective catalytic reduction
vii

Revision No.: 03 Date: September 2003
SET Supplemental Emissions Test (40 CFR 86.1360) SOP standard operating procedure ULSD ultralow sulfur diesel VDRP Voluntary Diesel Retrofit Program VOC volatile organic compound
viii

Revision No.: 03 Date: September 2003
1.0 INTRODUCTION
This protocol describes the Environmental Technology Verification (ETV) Program’s considerations and requirements for verification of emissions reduction provided by fuel and lubricant technologies. For purposes of this protocol, all such technologies will be identified as fuel modifications (FMs). The basis of the verification will be comparison of the emissions and performance of well-maintained, conventionally fueled (or lubricated) engines or vehicles to the same engines or vehicles with FMs. The protocol applies to diesel- and gasoline-fueled engines and light-duty vehicles in mobile source applications and describes the requirements for a single engine or vehicle ETV having narrow application and for a multiple engine or vehicle ETV to evaluate fleet-wide emissions reductions.
ETV provides verified emissions reduction data for FM technologies. It may be part of an overall process that leads to inclusion of FMs on the U.S. Environmental Protection Agency (EPA) mobile sources retrofit emissions reduction verified technology list. This protocol describes the ETV portions of that process in detail. Table 1 provides an overview of mobile source FM ETV and its interface with the EPA retrofit emissions reduction program.
Table 1. Overview of Mobile Source ETV Process and Participants’ Responsibilities
Step in Process Applicant
ETV
EPA-OTAQb EPA-ORDcAPCTVCa Testing Org.
Preparation of preliminary application (without ETV data)
Primary None None Advise Access
Preliminary test dialog Participate Organize & participate
Participate Participate Access
Test/quality assurance (QA) plan Review Shared preparation, APCTVC approve
Review Review & approve
Acceptance of ETV test/QA plan, and terms and payment
Primary Advise Advise Access Access
Conduct ETV test Access Audit Primary Access Audit Prepare test report Access Review Primary Access Access Publish ETV report & statement Review Primary Review Access Review &
approve
a APCTVC = Air Pollution Control Technology Verification Center at RTI.b EPA-OTAQ = EPA’s Office of Transportation and Air Quality.c EPA-ORD = EPA’s Office of Research and Development, the ETV sponsor.
1.1 Environmental Technology Verification
EPA through its Office of Research and Development (EPA-ORD) has instituted the ETV Program to verify the performance of innovative and improved technical solutions to problems that threaten human health or the environment. EPA created the ETV Program to accelerate the entrance of new and improved environmental technologies into the marketplace. It is a voluntary, nonregulatory program. Its goal is to verify the environmental performance characteristics of commercially ready technologies through the evaluation of objective and quality-assured data so that potential purchasers and permitters are provided with an independent and credible assessment of what they are buying and permitting.
1

Revision No.: 03 Date: September 2003
The ETV Program does not conduct technology research or development. ETV test results are always publicly available, and the applicants are strongly encouraged to ensure prior to beginning an ETV test that they are satisfied with the performance of their technologies. Within the ETV Program, this state of development is characterized as “commercially ready.”
The provision of high-quality performance data on a commercial technology encourages more rapid implementation of that technology and consequent protection of the environment with better and less expensive approaches. The ETV Program is conducted by seven ETV centers that span the breadth of environmental technologies.
1.2 Air Pollution Control Technology Verification Center
EPA’s partner in the Air Pollution Control Technology Verification Center (APCTVC) is RTI International,1 a nonprofit contract research organization with headquarters in Research Triangle Park, NC. The APCTVC verifies the performance of commercially ready technologies used to control air pollutant emissions. The emphasis of the APCTVC is currently on technologies for controlling particulate matter (PM), volatile organic compounds (VOCs), nitrogen oxides (NOX), and hazardous air pollutants (HAPs) from both mobile and stationary sources. The activities of the APCTVC are conducted with the assistance of stakeholders from various interested parties. Overall, APCTVC guidance is provided by the Stakeholders Advisory Committee (SAC), whereas the detailed development of individual technology ETV protocols is conducted with input from technical panels focused on each technology area.
The APCTVC develops generic verification protocols and specific test/quality assurance (QA) plans, conducts independent testing of technologies, and prepares ETV test reports and statements for broad dissemination. Testing costs are ultimately borne by the technology applicants, although initial tests within a given technology area may be partially supported with government funds.
1.3 The APCTVC Mobile Sources Verification Program
The various retrofit technologies have been divided into three groups to facilitate ETV:
• Retrofit diesel mobile source control devices, • FMs, and • Selective catalytic reduction (SCR) devices.
Retrofit mobile diesel control devices include exhaust treatment emission control devices, other retrofit devices, and engine modifications. Some require no mechanical changes to engines, whereas others will involve some modification of the engine or its control system. Filters for PM control and diesel exhaust catalysts (DECs) may make use of or require some integration with engines. Engine modifications, in this context, refer to pollution reduction technologies integral to the engine or the engine control systems. All these technologies have the potential to affect engine performance, and the concurrence of the engine manufacturer that the changes are compatible with safe, efficient, and reliable operation in the engine is an important element in demonstrating commercial readiness and suitability for ETV. ETV of these technologies is guided by Generic Verification Protocol for Diesel Exhaust Catalysts, Particulate
1RTI International is a trade name of Research Triangle Institute.
2

Revision No.: 03 Date: September 2003
Filters, and Engine Modification Control Technologies for Highway and Nonroad Use Engines (RTI, 2002).
SCR NOX control technologies are also retrofit technologies, but they require more integration with the controlled engine than most other retrofit devices and therefore are being treated as a separate category (for which a separate verification protocol is being developed).
This generic verification protocol (GVP) provides the requirements for APCTVC’s verification of the performance of FMs applied to mobile source diesel and gasoline engines. Other organizations (e.g., EPA’s Office of Transportation and Air Quality [EPA-OTAQ] and the California Air Resources Board) also verify the performance of FMs under different protocols to meet the needs of those organizations. The technology applicant should discuss the intended application of the FM with EPA-OTAQ to determine the most suitable path for verification.
This GVP is intended to apply only to FMs. The APCTVC reserves the right to evaluate each technology submitted for verification and to determine the applicability of this protocol to that specific technology. Regulatory authorities (EPA-OTAQ and others) may also have requirements. Special testing may be required in some cases to maintain the integrity and credibility and, therefore, the value of verifications. The critical data quality objectives (DQOs) in this document were chosen to provide emissions measurements sufficient to support the vendor’s application for emissions credits under the Voluntary Diesel Retrofit Program (VDRP).
This protocol was developed and has been reviewed by a technical panel composed of a broad group of stakeholders who have expertise in mobile source controls and come from the vendor, user, and regulatory spheres. Technical panel membership is dynamic, and its composition is expected to change over time as technical emphases change. The APCTVC will maintain membership balance on the panel.
The basic FM verification will measure and report baseline emissions concentrations and rates using the Federal Test Procedures (FTPs) applicable to a particular engine or vehicle on a baseline fuel compared to that same engine or vehicle using the FM. The test requirements will differ depending on whether the FM provides its full emissions reduction immediately (immediate-effect FM) or requires operation for some period of time to reach full effect (cumulative-effect FM). The engines or vehicles required to be tested will depend on the intended use and applicability of the FM. The tests will be conducted at an independent, third-party testing organization that has been qualified and audited by the APCTVC. The data quality requirements of this GVP will be applied at approved testing organizations through the preparation of an FM-specific test/QA plan. Other laboratory-, application-, or technology-specific information may also need to be addressed in the test/QA plan, which is described in Section 10.0. Because specific technology areas may require special expertise or emphasis, input and review will be obtained from an ad hoc subcommittee of the technical panel and/or outside experts when deemed appropriate by the APCTVC. Test results will be presented as ETV reports and statements.
This generic protocol will be revised as necessary. Changes to the protocol will not affect products that have been verified. However, such changes will be reflected in test/QA plans not yet finalized regardless of the applicant’s application status. Test/QA plans that are being carried out when a protocol change is enacted will be examined to determine whether any modifications must be made.
3

Revision No.: 03 Date: September 2003
1.4 Quality Management
Management and testing in the APCTVC program are performed in accordance with procedures and protocols defined by the following:
• EPA’s ETV Quality and Management Plan (QMP) (U.S. EPA, 2002a or the QMP current at time of testing);
• APCTVC Quality Management Plan (RTI, 1998); • Generic Verification Protocol for Determination of Emissions Reductions Obtained by Use of
Alternative or Reformulated Liquid Fuels, Fuel Additives, Fuel Emulsions, Lubricants, and Lubricant Additives for Highway and Nonroad Use Diesel Engines and Light Duty Gasoline Engines and Vehicles (this document); and
• Test/QA plan prepared for each FM test or group of tests.
EPA’s ETV QMP lays out the definitions, procedures, processes, interorganizational relationships, and outputs that will ensure the quality of both the data and the programmatic elements of the ETV Program. Part A of the ETV QMP contains the specifications and guidelines that are applicable to common or routine quality management functions and activities necessary to support the ETV Program. Part B of the ETV QMP contains the specifications and guidelines that apply to test-specific environmental activities involving the generation, collection, analysis, evaluation, and reporting of test data.
The APCTVC QMP describes the quality systems in place for the overall APCTVC. It was prepared by RTI and approved by EPA. Among other quality management items, it defines what must be covered in the GVPs and test/QA plans for technologies undergoing ETV testing.
Generic Verification Protocols are prepared to describe the general procedures to be used for testing a type of technology and to define the critical DQOs. The GVPs for retrofit air pollution control technologies for highway and nonroad use engines were written by the APCTVC with input from a technical panel and approved by EPA.
A test/QA plan is prepared for each test or group of tests. The test/QA plan describes, in detail, how the testing organization will implement and meet the requirements of the GVP. The test/QA plan also sets DQOs for any planned measurements that were not set in the GVP for a particular technology. The test/QA plan addresses issues such as the testing organization’s management structure, the test schedule, test procedures and documentation, analytical methods, recordkeeping requirements, and instrument calibration and traceability, and it specifies the QA and quality control (QC) requirements for obtaining ETV data of sufficient quantity and quality to satisfy the DQOs of the GVP. Testing organizations will be audited by the APCTVC against the approved GVP and test/QA plan they are expected to follow. Section 10 of this GVP addresses requirements for the test/QA plan.
Because multiple testing organizations may be conducting the tests, the APCTVC will develop a prototype test/QA plan (not part of this GVP) for each type of technology to ensure comparability. This prototype will be customized by the testing organization to meet its specific implementation of the FTPs as defined in 40 Code of Federal Regulations (CFR) Parts 86 and 89, and the secondary measurements, subject to approval by the APCTVC and EPA-ORD. Testing arrangements that do not meet the requirements of the FTP will not be approved, and test instrumentation or test procedures that the APCTVC determines will compromise data reliability or comparability between testing organizations will not be approved.
4

Revision No.: 03 Date: September 2003
2.0 OBJECTIVE AND SCOPE
2.1 Objective
The objective of this GVP is to establish the parameters within which FMs to diesel or gasoline engines will be tested to verify their emissions control performance with uniform and consistent methods.
2.2 Scope
This protocol describes the considerations and requirements for ETV of emissions reduction by FMs. The FMs to which it applies are
• Alternative diesel and gasoline fuels, • Reformulated diesel and gasoline fuels, • Additives to standard diesel and gasoline fuels, • Alternative lubricants for diesel- and gasoline-fueled engines, and • Lubricant additives and systems for diesel- and gasoline-fueled engines.
Although FMs may achieve similar emissions reductions on many engines, each ETV test is conducted on and reported for the actual test conditions: engine (vehicle), base fuel, and FM test conditions. The base engine (vehicle) will be well maintained and will produce emissions at levels consistent with a wellmaintained engine (vehicle) of its age and use. FMs may be combined with other technologies for verification testing as a single entity emissions control system. Before systems can be accepted for verification,
• the controlling interests in each technology must be in agreement to pursue ETV (in this context, low sulfur diesel fuels are considered commodities available to all, not technologies, and therefore no permission is required),
• the applicant must be a single organization with authority to pay for the applicant’s cost, and • the applicant must show that each component of the system has a credible impact on emissions.
Verification testing for a system will incorporate into the test/QA plan elements from the protocols applicable to the individual technologies. In general, the test for a system will include the more stringent aspects of each protocol where they differ. Each test may be different, and the APCTVC should be consulted for assistance.
For purposes of ETV, the emission reduction effects of FMs are classified as either of two types:
1. Immediate effect—FMs whose emissions reduction effect is immediate for a well-maintained, basefueled engine. No long-term residual effect is expected from an immediate-effect FM. The applicant agrees and the test confirms that reproducible results can be obtained for both the base and FM fuels on the same engine with an alternating fuel test pattern, allowing only for fuel flushing and a brief stabilization period (as many as three preconditioning cycles [EPA Urban Dynamometer Driving Schedule 40 CFR 86.132-90] for a light duty vehicle (LDV) and 1 hour of engine operation for a diesel) between tests.
2. Cumulative effect—FMs that require more than 10 hours of engine operation for a diesel or 500 miles of driving for a LDV on the FM for the product to reach its full effectiveness. Cumulativeeffect FMs are expected to have residual effects on the test engine, and repeated base-fueled tests
5

Revision No.: 03 Date: September 2003
separated by FM tests would not be meaningful. Return to base fuel emissions rates is expected only after an extended period of operation or manual cleaning and rebuild.
FMs may be evaluated based on either of these categories. The applicant’s requests and the product’s performance mechanism will be considered. For example, an applicant may have a fuel additive that reaches its full potential only after an extended period of time, but the applicant may prefer to evaluate the additive with the immediate-effect procedure. The applicant must recognize and accept the implied liability for selecting the appropriate test program.
Emissions testing under this protocol is based on the FTPs for emissions certification of diesel highway engines (40 CFR Part 86), diesel nonroad engines (40 CFR Part 89), and light duty gasoline engines (40 CFR Part 86). For diesel nonroad engines, emissions testing under this protocol will also include the nonroad transient test cycle as published in the NPRM (Notice of Proposed Rulemaking) for “Control Emissions of Air Pollution from Nonroad Diesel Engines and Fuel” on May 23, 2003. (New test procedures become standardized and are incorporated into the FTPs from time to time. Verifications are to be conducted under the current applicable FTP.)
2.3 Applicability
2.3.1 Applicability of ETV Results to Other Engines and Engine Families
The basic ETV test remains the same for all FMs and engines; however, the FMs may interact differently with the various engines. The extension of emissions reductions from one engine or engine family to another requires engineering analysis of the data and may require additional testing. Determination of the applicability of single-engine tests to other engines is an EPA-OTAQ decision and not part of ETV.
2.3.2 Relationship of ETV Program to EPA-OTAQ VDRP Verified Technology List
EPA-OTAQ is charged with establishing a verified list of technologies capable of providing emissions reductions. The test results EPA-OTAQ will use to evaluate a technology may be generated following the ETV process, with the ETV report and verification statement submitted by the vendor as the data package to EPA-OTAQ. Other paths to the verified technology list also exist. The VDRP program is described and appropriate contacts are identified at http://www.epa.gov/otaq/retrofit/. The technology applicant should discuss the intended application of the technology with EPA-OTAQ to determine the most suitable evaluation path for the applicant’s technology.
2.3.3 Assignment of Emissions Benefits to FMs
The emissions from engines vary as engines age and progress through the cycle of routine maintenance. The intent of ETV under this GVP is to determine the emissions reductions provided by FMs, exclusive of oil and filter changes, engine tune-ups, and similar scheduled maintenance that, by themselves, may provide emissions benefits. Emissions benefits may also accrue from tuning an engine to lower power output or other operating points different from those recommended by the engine manufacturer. The ETV test will be designed to isolate the effects of the FMs from coincident engine adjustments and tuneups to the extent possible. Baseline engines will be tuned and set to the engine manufacturer’s recommendations, and the baseline emissions are expected to be consistent with the age and usage history of the engine (near certification levels for diesel engines; in conformance with the expected model year standard for gasoline vehicles).
6

Revision No.: 03 Date: September 2003
Engine modifications may be appropriate for particular FMs that have different energy contents than standard fuels, and these will be implemented on the required test engines provided they are part of the description of the FM as a single technology.
2.4 Data Quality Objectives
The data of primary interest in this verification are the reduction in emissions of the FTP primary pollutants: NOX, hydrocarbons (HCs), PM, and carbon monoxide (CO). The DQOs of this GVP are the requirements of the test methods specified in 40 CFR Part 86 (light duty gasoline and diesel highway engines) or 89 (nonroad diesel engines) when conducting the number and type of FTP tests called for by the approved test/QA plan for the FM. ETV tests that do not meet the FTP QA requirements are invalid.
The number and type of FTP tests (cold- and/or hot-start) required for ETV is determined from the following criteria:
First, a minimum of three tests is required to provide the basic ETV result of a mean emission reduction and the 95% confidence interval on that mean based on measured variability for each of the measured emissions and test parameters. For highway engines this minimum is satisfied with one cold start test and three hot start tests. For nonroad engines three replicates of the appropriate test sequence (i.e., three 8-mode tests, or three 6-mode tests) are required. A three test minimum is currently the same as is required by the State of California for its program.
Second, additional tests may be required to meet the ETV requirement that the test/QA plan provide a 90% probability of detecting the expected emissions reductions when computed using the expected experimental errors for the various measurements. These criteria become controlling for low emissions reductions and/or high test variability. This is a planning requirement for the test/QA plan. The procedure to determine the appropriate number of tests is given in Appendix B.
Third, additional tests may be desired by the applicant to reduce the width of the 95% confidence interval on the mean emission reduction. Section 5 provides additional explanation and example scenarios. This third criterion is a consequence of applying standard statistical procedures to the ETV test design and data analysis. At a fixed measurement variability, normal statistical procedures lead to a small number of tests giving a broader 95% confidence interval than a larger number of tests. To any regulator or potential technology user, an emission reduction of 40% ± 5% is better than 40% ± 20% and will be given more credence.
Noncritical measurements, including carbon dioxide (CO2) emissions, fuel utilization, and power, will also be made as described in later sections. These are not considered critical, and the methods and DQOs will be stated in the test/QA plan.
The FTP tests referenced above are conducted following test cycles specified in 40 CFR. As discussed in Section 5, other test cycles may also be required for verification of an FM. A single test data set would consist of a single FTP test cycle and any other special cycle required for the FM. The requirements for the emissions tests remain the same in both cases.
An applicant may conduct privately sponsored tests at a testing organization for development purposes with the same test engine prior to or after conducting verification tests. Such testing is understood to be
7
Revision No.: 03 Date: September 2003
common and important to ensure the technology is properly adjusted and tuned to the application. The ETV data quality objectives do not apply to privately sponsored testing. However, the applicant and testing organization must coordinate the entire testing effort with the APCTVC so that:
• Preparation for the ETV test (submittal of the technology to the APCTVC, discussion of engine selection, and preparation of the test/QA plan) is completed prior to conducting the ETV test itself;
• The APCTVC is notified of the ETV test dates in time to schedule QA activities at the discretion of the APCTVC; and
• Declaration of the test run that is to be the ETV test is made prior to starting the test, the engine must be brought to a starting point in accordance with the test/QA plan, and the results of that test are documented and reported in accordance with the test/QA plan.
An applicant may desire to run the base-fueled ETV test, conduct private developmental testing, and then complete the ETV tests following the private testing. This approach may be acceptable provided the base-fueled run is considered to remain valid for the duration of and for the activities that occur during the private testing. If not, the base-fuel case will have to be rerun.
The data from all ETV tests will be retained and reported to the APCTVC, including invalid FTP test results. Data that meet the QA requirements of the FTP are considered valid and will be used to compute emissions reductions for ETV purposes.
The FM emissions reduction performance will be reported as both absolute emissions in the appropriate units (per applicable FTP) for the base-fueled and FM-fueled cases, and as percentage emissions reduction for a specific engine or engine family. The percentage emissions reduction reported will be the mean emissions reduction (relative to the baseline emission) with attendant upper and lower 95% confidence limits on that mean.
3.0 ETV RESPONSIBILITIES
The primary responsibilities for each organization involved in the FM ETV verification program were summarized in Table 1. Additional comments are provided below:
• The technology applicant provides the complete, commercially ready product for ETV testing, and logistical and technical support, as required, during the ETV testing. The applicant’s responsibilities are defined by a contract or letter of agreement with the APCTVC (RTI.) The preliminary application (Table 1, Row 1) provides relevant background data and technology information to facilitate test/QA plan development. The applicant must pay the portion of the verification cost required at the time its contractual relationship with the APCTVC begins.
• In addition to the items in Table 1, the APCTVC prepares the GVP (this document); qualifies, approves, and audits the testing organization; provides a template for test/QA plans; prepares the ETV reports and statements from the laboratory test reports; and, jointly with EPA-ORD, reviews and approves the ETV reports and statements.
• Qualified testing organizations conduct ETV verifications under contract to the APCTVC. The order of activities in Table 1 is mandatory, with the test/QA plan being prepared and approved before testing. The testing organization also conducts internal QA on test results and reports.
8

Revision No.: 03 Date: September 2003
4.0 APPLICATION AND TECHNOLOGY DESCRIPTION
The ETV applicant is the basic source of information regarding its technology, information which is provided to the APCTVC and EPA-OTAQ through an application form. This information is used by the testing organization and APCTVC to prepare and review a test/QA plan that meets the requirements of the applicant and by EPA-OTAQ and other users to verify data. In keeping with the voluntary nature of ETV, the applicant must control the technology within the United States to submit it for verification.
For the applicant’s convenience, the application form used by the EPA-OTAQ retrofit program can also be used for ETV. The applicant should complete as much of the form as possible and submit it to OTAQ and the APCTVC. ETV will provide test data that will allow completion of the form for submission to EPA-OTAQ and participation in the VDRP. The form can be obtained from the APCTVC and is also posted on the EPA-OTAQ retrofit website at http://www.epa.gov/otaq/retrofit/retrofittech.htm. Both Microsoft Excel and Lotus 123 versions are provided. Alternatively, an applicant who is not participating in the VDRP can use the APCTVC’s shorter general application form.
The VDRP application consists of four worksheets: (1) Manufacturer Information, (2) Product Information, (3) Test Information, and (4) Component Information. There is a separate spreadsheet containing directions and examples for completing the forms. This guidance document begins with a page of general instructions for the entire form. Since no general form can anticipate the data requirements for all possible FMs, the applicant should use the applicable portions of the form. Additional information will be requested to supplement this form if needed.
The mobile sources ETV program is intended to provide independent and quality-assured performance data to potential users of technologies through a documented public process. Existing data (whether Confidential Business Information [CBI] or not) cannot be used to substitute for ETV tests, although they can be used to help design the ETV test. The ETV documents (protocol, test/QA plans, reports, and verification statements) are publicly available. For these reasons, the submittal of CBI to the APCTVC is unlikely to be necessary. The application form is not intended to convey CBI to the APCTVC and none should be included in the form. Any applicant who believes that CBI is required to provide input to the ETV process should explain that belief in a cover letter to the APCTVC. It should be noted that all information submitted on the application is subject to the Freedom of Information Act.
4.1 Manufacturer Information
This first page of the application requests background and contact information for the applicant who is seeking product verification. Guidance and examples supporting its use are provided on the second page of the guidance form.
4.2 Fuel Modification Descriptive Information
The second page of the application is used to describe the FM fully and concisely. It will be used to prepare the test/QA plan and as a more complete description of the technology in the ETV report. It requires a concise (300-word or less) description of the FM being verified and requests a number of operating details that summarize the emissions control performance expected, along with the product’s operation. All questions may not apply. Instructions for completing this page can be found in the “Explan_Prod” page of the guidance document.
9

Revision No.: 03 Date: September 2003
In the case where combinations of independent technologies are being submitted for verification, the description of the combined technology should completely identify and describe those technologies being combined and fully state the nature of the combined test and expected result.
4.3 Test Information
Results of verification testing on the applicant FM are to be detailed on the third sheet of the application form. Completion of this page is not required for application to the APCTVC for verification of a technology because the verification itself will be providing the test results. However, the applicant is encouraged to report all available test data, which can be used by the APCTVC to better plan the ETV test program for the applicant’s technology. These existing test data will not be included in the verification report. The Explan_Tests page of the guidance document provides information for completing this page.
4.4 Component Information
The last page of the application form, Component Information, lists the major components of the technology system. For fuels and fuel additives, it is expected that few components will need to be listed here, although for combined systems this will be an important document. Directions are given in the Explan_Components page of the guidance.
5.0 ETV TESTING
This section gives the test requirements for verification of FMs. It also describes reduction of the data to produce the emissions reduction measures that are the product of the tests. Section 5.1 gives an overview of the testing and data analysis as it applies to all FMs. Section 5.2 gives ETV testing details for FMs intended for use in diesel engines. Section 5.3 gives the detailed test requirements for ETV of FMs intended for use in gasoline vehicles and engines. Section 5.4 gives detailed test requirements for ETV of lubricants.
5.1 Test Design and Data Analysis for ETV of FMs
5.1.1 Overview of Testing Requirements
The data of primary interest in this verification testing are the reduction in emissions of NOX, HC, PM, and CO. Emissions reductions are defined as the percentage reduction obtained between a base case and the FM candidate case or the natural log equivalent. For all engine and vehicle types, emissions measurements are made using the FTP certification test cycles applicable to the engine or vehicle for which the FM is intended. Additional special test cycles are sometimes also required in addition to the FTP certification test. The details of the tests are different for different engines and vehicles and are given below.
A simple test of an engine without a control device installed followed by one with the device installed is not considered to be adequate for all FM ETVs. Emissions from engines or vehicles may increase over their service life, particularly for gasoline-fueled engines or vehicles. FMs may require significant service life to have their full effect. These characteristics require that the ETV test for FMs be designed to provide emissions reductions with a changing baseline emission.
10

Revision No.: 03 Date: September 2003
Testing conducted under this protocol utilizes individual FTP and special tests that measure emission rates, E, of various pollutants. Replicate tests are conducted at a particular test point in the service life of an engine or vehicle, fueled or lubricated by either the base or the FM candidate. The FTP and special tests are combined to give a combined emissions rate for each pollutant. The complete ETV test sequence includes several test points, each of which gives a combined emissions rate for either the base engine or the candidate FM engine. The combined emissions rates from all valid data are then used to estimate the emissions reduction, ER, for each pollutant.
The requirements for testing diesel and gasoline FMs for immediate and cumulative effects in highway and nonroad diesel applications will be discussed in greater detail in the following sections. Table 2 summarizes the tests required at each test point in the test sequence.
ETV provides engine emissions reductions from which EPA-OTAQ or others estimate fleet emissions reductions. Estimation of fleet-wide emissions reductions from single engine emissions reductions requires knowledge of the composition of the entire fleet, identification of the number and kind of representative engines or vehicles, and numerous other assumptions. All of these considerations factor into the experimental design. Making these assumptions is uniquely the responsibility of the agency evaluating the data.
Table 2. Summary of Tests Required at Each Test Point Type Effect Engine Sequence of Test
Points¹ Tests at Each Point² Reference
Diesel FMs Immediate Highway BCCB or BCBC (Cold + 3 hots + SET) 5.2.3.4, 5.2.4.1 Diesel FMs Immediate Nonroad BCCB or BCBC 3 (multi-mode steady-state)
+ NTTC³ 5.2.3.4, 5.2.4.1
Diesel FMs Cumulative Highway BBBBCCBB (Cold + 3 hots + SET) Fig. 1, 5.1.3.4 Diesel FMs Cumulative Nonroad BBBBCCBB 3 (multi-mode steady-state)
+ NTTC Fig. 1
Gasoline FMs Immediate Highway BCCB 3 (Cold + hot + US06)4 5.3.3.2, 5.3.4 Gasoline FMs Immediate Nonroad BCCB 3 (multi-mode steady-state) 5.3.3.2, 5.3.4 Gasoline FMs Cumulative Highway BBBBCCBB 3 (Cold + hot + US06)4 5.3.3.2, 5.1.3.4 Gasoline FMs Cumulative Nonroad BBBBCCBB 3 (multi-mode steady-state) 5.3.3.2, 5.1.3.4 Lubricant FM (diesel) Highway BBBBCCCCBBBB (Cold + 3 hots + SET) Fig. 2, Table 7 Lubricant FM (diesel) Nonroad BBBBCCCCBBBB 3 (multi-mode steady-state)
+ NTTC Fig. 2, Table 7
Lubricant FM (gasoline) Highway BBBBCCCCBBBB 3 (Cold + hot + US06) Fig. 2, Table 7 Lubricant FM (gasoline) Nonroad BBBBCCCCBBBB 3 (multi-mode steady-state) Fig. 2, Table 7
¹ B = Baseline condition; C = Candidate technology.² Minimum requirement. When emissions reductions are expected to be low, more tests may be required to achievethe 95% confidence interval.³ Nonroad transient test cycle. 4 Highway fuel economy test, cold CO, and evaporative emissions testing will be required on any FM that mayreasonably be expected to affect fuel volatility.
5.1.2 Test Design Requirement for Single Engine Verification
Minimizing the cost of ETV testing is important, and limiting the amount of testing required is one way to lower costs. However, if too few tests are conducted, normal experimental variability could prevent the ETV from finding a significant result. All ETV test/QA plans for FMs are required to include
11

Revision No.: 03 Date: September 2003
sufficient tests to have a high probability of detecting the emissions reductions expected by the applicant. In addition to other requirements, each FM ETV test plan is to be designed to have at least a 90% probability of detecting the emission reductions expected by the applicant. This requirement was adopted to ensure, as much as practical, that the ETV test would accomplish the applicant’s goals.
In this context, detecting means that the 95% confidence interval on the emission reduction does not include zero. (This requirement is for test design purposes and does not require that the test/QA plan be modified should actual test data show that the assumptions that went into the calculation were incorrect. However, insufficient replication can result in the inability to verify any emissions reduction and publication of an ETV report stating that a technology had no statistically significant benefit.) The test/QA plan prepared for the FM will reflect this requirement, based on the applicant’s knowledge of his product and the testing organization’s estimates of test variability.
At each test point, a minimum of three tests are required. More may be necessary for low emission reduction technologies. The definition of a single test depends on the technology. For diesel engines, for instance, one FTP cold start, three FTP hot starts, and one additional cycle are considered three tests when combined. Depending on the FM technology and test engine or vehicle, a complete single engine ETV may require as few as two or as many as 12 base and FM test points. Sections 5.2 (diesel engines), 5.3 (gasoline vehicles), and 5.4 (lubricants) provide the details of these requirements.
5.1.3 Analysis of Combined Emissions Data
5.1.3.1 Data analysis for single engine tests of immediate effect FMs. Immediate effect FMs produce their emission reduction as soon as they are fully flushed through the fuel system and are expected to have no residual effect. The emissions reduction can therefore be determined without concern for test engine drift or deterioration. Verification of immediate effect FMs requires a single base case test point followed closely in time by a single candidate FM test point and is very similar to that used to test retrofit devices. This section describes the data analysis procedure that will be used to calculate the emission reductions for immediate effect FMs.
The first steps are the calculation of the combined test emission results for each test and each pollutant for the base and candidate FM tests. EB and EF are understood to refer to a single pollutant in the equations below. Calculation of EB and EF from individual test results differs for diesel and gasoline engines and for LDVs and is described in the respective sections below. Once the E values for the test points are available, the sample means and standard deviations (sB and sF) are computed using Equations 1 and 2.
nB nF
∑EB i, ∑EF i,
EB = 1 and EF = 1 (1) nB nF
where:
EB = mean emission rate for base for a single pollutant,
EF = mean emission rate for FM for a single pollutant,
EB,i = emission results for a single base (B) test for a single pollutant,
EF,i = emission results for a single FM (F) test for a single pollutant,
12

Revision No.: 03 Date: September 2003
nB and nF = number of base (B) and FM (F) tests, and
sB and sF = standard deviations of base (B) and FM (F) tests.
nB nF
(2)s = ∑(E − E )2 (n − 1) and s = ∑(E − E )2 (n − 1)B B i , B B F F i , F F 1 1
The raw emission reduction for each pollutant, ERRAW, is then computed as the difference between the combined emission results for the base and candidate FM case, divided by the base case emission, as shown in Equation 3.
ERRAW = (EB − EF ) EB(3)
The upper and lower bounds of the approximate confidence interval (CI) around ERRAW are computed using Equations 4a and 4b.
2 2 CI (upper bound ) = ER +
t • sB + − 1 ER
2 sF E (4a)
RAW
α/2 nB
( RAW ) nF B
2 2 (lower bound ) = ER −
tα •
n
sB
B
(1 ER )2
n
sF
F
(4b)CI RAW /2 + − RAW EB
where t �/2 is t0.025 in tables of the critical values (alternatively, tail area probability) of the t-distribution,
with degrees of freedom, v, given by Equation 5 (rounded down):
ν = sB
2 / B + − ER RAW 2
F 2 nF
2
(5) n (1 ) s /
2 4 2 (s / n ) / n −1) + − ER ) (s / n ) / n − ) B 2
B ( B (1 RAW F 2
F ( F 1
The fractional values of emission reduction and the confidence intervals are converted to percentages by multiplying by 100%.
Although ERRAW is the observed value of the data for the single engine tested, there is significant potential for the true emission reduction achieved in the field to be lower due to measurement errors. Therefore, an environmentally conservative discounted single engine emission reduction, ERDSCT, is also reported as the lower bound of the confidence interval using Equation 6.
ERDSCT = 100% CI (lower bound from Equation 4b) (6)
For example, if ERRAW was 0.15 (15% emissions reduction) with a confidence interval of ± 0.05 (± 5%), ERDSCT would have a value of 0.1 (10%).
13

Revision No.: 03 Date: September 2003
5.1.3.2 Calculation of fleet-wide emissions reductions for immediate effect FMs. For immediate effect FMs, the fleet emissions reduction (ERFLEET) is computed by EPA-OTAQ for gasoline engines as the unweighted (gasoline) mean or as the weighted mean (diesel engines) of the discounted single engine emissions reductions. Emissions reductions are computed separately for each pollutant.
5.1.3.3 General treatment of cumulative effect FMs. ETV of cumulative effect FMs requires additional testing. Because the technology must be in use for an extended period to take full effect, the total duration of the testing can be long. Therefore, the base engine emissions may change as the engine/vehicle ages, or because ambient conditions change, or because test cell instrumentation requires recalibration. This situation leads to uncertainty about the cause of a measured emission change. Cumulative effect technologies also have a residual effect after use ceases. This characteristic prevents immediately re-running the baseline at the end of the test to quantify any drift.
Figure 1 illustrates the expected FM performance and testing model used in this protocol to evaluate a cumulative effect FM having residual effects on emissions. Increasing emissions with increasing service is assumed based on the known behavior of gasoline vehicles and their catalytic emissions control systems. Over the life of the vehicle, the emissions steadily increase as shown by the solid line, which represents the base case. Some of the deterioration is caused by changes in the engine, and some is caused by the emissions control system’s deterioration. The slope and intercept of the deterioration line varies from gasoline vehicle to gasoline vehicle and from within and across vehicle’s type and manufacturer. For the purposes of this protocol, the deterioration factor is assumed to be linear and unknown. Over the service life of diesel engines (when not controlled by catalytic systems), the deterioration factor is low and may be zero within the time frame of ETV tests. After changing to the candidate FM, the emissions are assumed to become lower. The shape of the curve during the transition is not important to this analysis.
The goal of the cumulative effects testing and data analysis is to separate the change in emissions due to the FM from the other changes. The emission reduction is assumed to be proportional to total emissions. That is, regardless of total emissions, the percent emissions reduction is assumed constant as implied by the natural log transformation of the emissions rate (vertical scale in Figure 1). As shown in Appendix C, the use of a log-scale analysis produces results nearly identical to using a percentage change in the native units when the measurement errors and effects to be detected are relatively small. The analysis is thus conceptually consistent with that for an immediate-effect FM.
14
Revision No.: 03 Date: September 2003
x • y •
base fuel
base fuel
FM fuel
base fuel
with FM
service req’d to build full effect
•
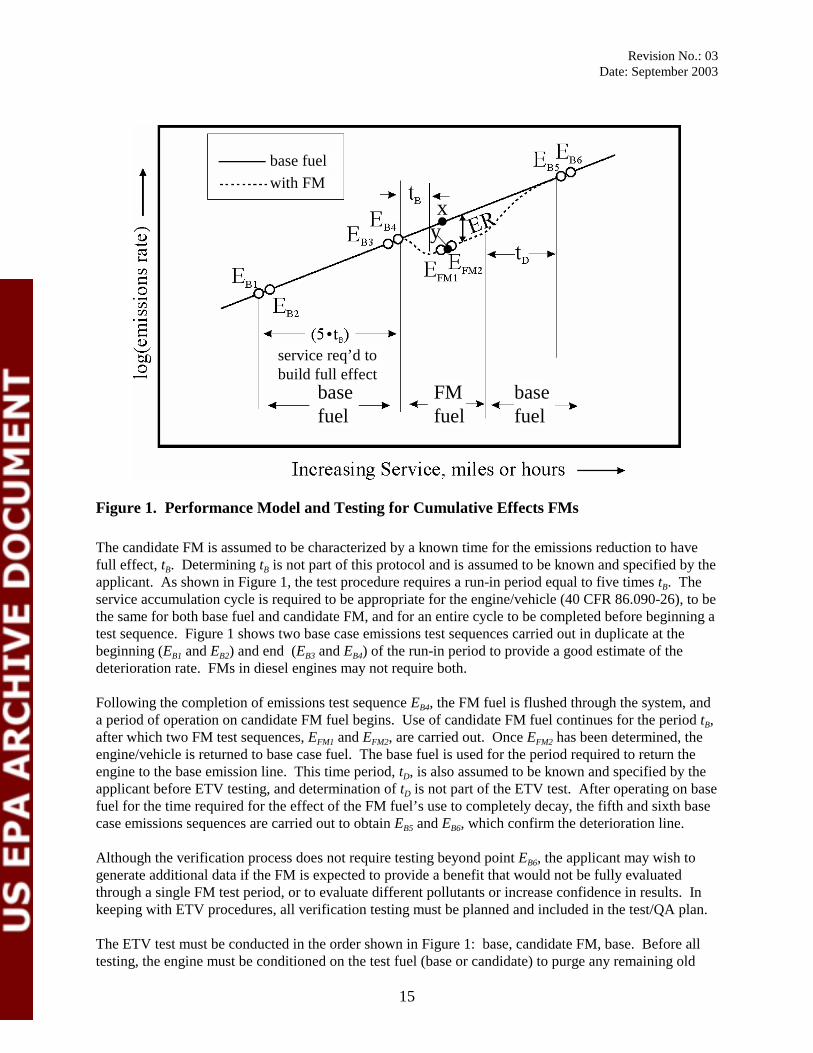
Figure 1. Performance Model and Testing for Cumulative Effects FMs
The candidate FM is assumed to be characterized by a known time for the emissions reduction to have full effect, tB. Determining tB is not part of this protocol and is assumed to be known and specified by the applicant. As shown in Figure 1, the test procedure requires a run-in period equal to five times tB. The service accumulation cycle is required to be appropriate for the engine/vehicle (40 CFR 86.090-26), to be the same for both base fuel and candidate FM, and for an entire cycle to be completed before beginning a test sequence. Figure 1 shows two base case emissions test sequences carried out in duplicate at the beginning (EB1 and EB2) and end (EB3 and EB4) of the run-in period to provide a good estimate of the deterioration rate. FMs in diesel engines may not require both.
Following the completion of emissions test sequence EB4, the FM fuel is flushed through the system, and a period of operation on candidate FM fuel begins. Use of candidate FM fuel continues for the period tB, after which two FM test sequences, EFM1 and EFM2, are carried out. Once EFM2 has been determined, the engine/vehicle is returned to base case fuel. The base fuel is used for the period required to return the engine to the base emission line. This time period, tD, is also assumed to be known and specified by the applicant before ETV testing, and determination of tD is not part of the ETV test. After operating on base fuel for the time required for the effect of the FM fuel’s use to completely decay, the fifth and sixth base case emissions sequences are carried out to obtain EB5 and EB6, which confirm the deterioration line.
Although the verification process does not require testing beyond point EB6, the applicant may wish to generate additional data if the FM is expected to provide a benefit that would not be fully evaluated through a single FM test period, or to evaluate different pollutants or increase confidence in results. In keeping with ETV procedures, all verification testing must be planned and included in the test/QA plan.
The ETV test must be conducted in the order shown in Figure 1: base, candidate FM, base. Before all testing, the engine must be conditioned on the test fuel (base or candidate) to purge any remaining old
15
Revision No.: 03 Date: September 2003
fuel before each map or cold start procedure. The reference cycle map used for the candidate diesel fuel must be the same as determined for the base fuel. The oil and oil filter are to be changed immediately prior to test sequences EB1, EFM1, and EB5.
The data analysis of the cumulative effect FMs described in the following sections is based on an assumption that Figure 1 represents the true behavior of FM, with tB and tD known so that there is no confounding between the base and FM fuel cases. These procedures are those recommended and preferred by EPA-OTAQ.
Because the data analysis approach in this protocol is specific to the technology performance and experimental design assumed in Figure 1, an applicant may propose a verification applying another experimental design. In this case, the applicant’s proposal must include a detailed justification and demonstrate quantitatively its superiority to the ETV protocol’s approach; the applicant’s proposal will be evaluated and tested by ETV statisticians regarding the reasonableness of the design and the engine/vehicle selection. The test/QA plan will include an appendix describing development of the experimental design to be used for testing.
5.1.3.4 Data analysis for single engine cumulative effect FMs. The emission reduction is computed from the two FM measurements (EFM1 and EFM2) and from the estimated base emissions at the same service (hours or miles). In Figure 1, this would be the intersection of a vertical line rising between EFM1 and EFM2 and the base case performance line (i.e., difference in rates at points X and Y). The base fueled emissions at that point are estimated from a linear least-squares regression of the natural logarithm of emissions [ln(E)] versus service accumulation for the six base case emissions measurements (EB1, EB2...EB6). Appendix D develops this approach to analyzing the data, presents equations that allow calculation of the estimated effect of the FM and the variance of that estimate, and provides some suggestions to maximize the power of the experiment.
5.2 ETV Testing for Diesel FMs
This section applies to FMs used in compression-ignition engines.
5.2.1 Diesel Base Fuels
Applicants may choose from among the following two FM base fuel alternatives, which are described in more detail in Table 3:
1. The nationwide average base fuel for nationwide application of the FM. 2. FMs intended for California (or an area in which California-type fuel is the dominant available diesel
fuel) may be tested using California-type fuel as the base fuel.
Applicants who intend to market FMs in specific markets (regional, specific, or other) may propose alternate base fuels for use during ETV testing. A proposal for an alternate base fuel must be accompanied by evidence that the fuel truly is a “base” that is in use and from which the candidate FM will reduce emissions. If acceptable, the fuel supplied by the applicant will be tested and reported as the base fuel in the ETV report and statement. ETV can make no representation regarding possible extension of the data to other base fuels.
In all these cases, the ETV report and statement will report the test conditions, the FM tested, and the results obtained.
16

Revision No.: 03 Date: September 2003
Note that the ranges given in Table 3 for the properties of the base fuels are not as broad as those for the fuel allowed in emissions certification tests, and that the sulfur level has been limited to 15 ppm. The ranges were narrowed to reduce test-to-test variations in the emissions reductions measurements, whereas the ultra-low sulfur diesel (ULSD) is proposed as the test case. Refinery diesel product streams must be used to produce the base fuels for tests. They cannot be blended from purified chemicals. Because oxygenates are rarely used in diesel, neither the California nor the national average fuel may contain oxygenates. Although additives are not used consistently in diesel, it is permissible for the California and/or the national average fuel to contain a registered additive or additives designed to maintain fuel quality during transport and storage, such as an antioxidant and/or corrosion inhibitor.
Table 3. Properties of Base Fuel for ETV of Diesel FMs
Nationwide Applicant-Choice Property Average Fuel California Fuel Base fuela ASTM Test
Accepted by EPA-OTAQ Yes Yes Noa
Cetane number 43 to 46 51 to 54 D 613
Aromatics, volume % 32 to 36 20 to 24 D 5186
Specific gravity 0.84 to 0.86 0.83 to 0.85 D 1298
Additives minimalb minimalb
Sulfur, ppm
Highway 0 to 15 0 to 15 D 6428
Nonroad 2500 to 3500c 100 to 160 D 2622
Distillation range
10% point, °F 410 to 430 410 to 430 D 86
50% point, °F 490 to 520 490 to 520 D 86
90% point, °F 585 to 620 595 to 630 D 86
a Testing of FMs using a base fuel chosen by the applicant is possible within this protocol. b Cetane improvers and some other additives cannot be avoided in refinery products. However, these are to be
minimized, and no additional additives are to be used. c Use of highway diesel sulfur levels allowed in accordance with 40 CFR part 89.330.
5.2.2 Selection of Engines for ETV Testing
The applicant may select one of three targets for the candidate diesel FM: (1) a specific engine family as represented by a single test engine, (2) the entire on-highway diesel fleet, or (3) some portion of the onhighway diesel fleet. A candidate FM ETV can be conducted on any single engine meeting the requirements of Section 5.2.2.1.
5.2.2.1 General criteria for diesel engine selection. Test engines must be in good operating condition and representative of in-use engines. Standard engines proposed for testing must be in a certified configuration. The engines are to be “as delivered, without any added technologies, and are to be tuned to the manufacturer’s specifications. (Specially prepared engines [such as future technology engines that are not commonly available] may also be tested under this protocol, and will be identified as such. However, the acceptability of such a verification to EPA-OTAQ should be explored by the applicant prior to beginning verification if VDRP listing is desired.) For engines manufactured before implementation of emission standards, the engine must be representative of normal production engines.
17

Revision No.: 03 Date: September 2003
Engines must have a minimum of 125 hours of use before beginning an ETV test and exhibit stable operation. Emissions control components must be sufficiently broken in so that they exhibit stable operation over the course of the test program. Because residual effect FMs may have been used in an engine before its use in the ETV program, the engine owner (testing organization or applicant) must establish that the engine can be considered a reasonable baseline for the engine family of interest, either through replicate baseline tests showing a stable baseline or documentation of its fueling history. On the base fuel, the test engine must not exceed 110% of its applicable emission standards. For engines manufactured before emission standards, the engine must not exceed 150% of the first standards for that engine category.
Rebuilt engines will be allowed so long as they represent a certified configuration, produce emissions at the certification standard when fueled by the base fuel (within limits given above), and meet other applicable criteria.
5.2.3 Test Procedures—General Requirements
5.2.3.1 Engine maintenance. All equipment used in the testing must be maintained and operated in accordance with applicable FTP regulations. To the extent practical, the engine and test conditions should be maintained the same between the base and candidate FM tests. This consideration applies to all aspects of engine operation and maintenance. Routine engine maintenance must be performed before beginning a verification test and, once testing has started, routine engine maintenance is not allowed. If use of an FM requires that an engine be tuned for the fuel, this requirement must be detailed in the test/QA plan and will be included in the report as a requirement for use of the FM. Resumption of testing following engine or test stand breakdown and repair will be evaluated by the APCTVC on a caseby-case basis and will be allowable only for brief shutdowns for which no emissions impact is considered likely. A full fuel analysis is required on both base and candidate FM fuel.
5.2.3.2 Test data format and retention. Raw test results will be retained by the testing laboratory in the electronic format required for EPA certification tests and made available to the APCTVC on request. Results for cold and hot starts will be reported both independently and appropriately weighted. Emissions during steady-state testing are to be reported mode-by-mode as well as in the final weighted form. Torque curves will be provided electronically for each engine map. Brake-specific fuel consumption (BSFC) will be measured during each engine map and provided with the map.
5.2.3.3 Fuel conditioning. When switching fuels, a conditioning cycle will be run to purge old fuel and stabilize engine operation on the new fuel. The conditioning cycle must represent normal engine operation and will be specified in the test/QA plan. The engine must be mapped prior to performing a test sequence each time a new test fuel (base fuel or candidate fuel) is used. Engine mapping is conducted following conditioning. The most recently generated engine map on base fuel shall be used in transient testing. The supplemental emissions test (SET) will be performed with the most recently conducted map.
5.2.3.4 ETV test procedures. For on-highway engines, the FTP is described at 40 CFR Part 86. The minimum immediate effects FM emission reduction ETV on-highway engine test at a single test point consists of one cold start FTP test, three hot start FTP tests, and one SET. The weighted cold start results shall be applied to each of the weighted hot start results to provide three (3) transient sets of data for each regulated pollutant and BSFC. Additional testing at each test point may be required to detect the expected emissions reduction, as described in Section 5.1.2.
18

Revision No.: 03 Date: September 2003
The SET for on-highway engines is specified at 40 CFR 86.1360. The SET is a 13-mode steady-state test cycle. The test sequence shall consist of using the FTP to perform one cold start and three hot start transient tests followed by one SET.
For nonroad engines, the FTP is described at 40 CFR Part 89. In most cases, nonroad engines will be verified with both the applicable steady-state cycle and the nonroad transient cycle. However, constant speed engines, such as for generators, may be tested using only the steady-state cycles. For nonroad engines, the basic minimum immediate emission reduction ETV test requires triplicate multimode FTP tests plus the diesel nonroad transient cycle. Additional testing at each test point may be required to detect the expected emissions reduction, as described in Section 5.1.2.
For locomotive engines, the FTP is described at 40 CFR Part 92. The marine engine FTP is described in 40 CFR Part 94. Additional testing at each test point may be required to detect the expected emissions reduction, as described in Section 5.1.2.
Future revisions to the applicable FTP or new procedures adopted in applicable regulations are incorporated in this protocol. Unless otherwise described in this document or identified in the approved test/QA plan, the FTP is to be followed in its entirety. In accordance with this protocol, any deviations from the test/QA plan will be noted and throughly documented by the testing organization in its report.
Requests for the use of alternate or special test procedures to better predict emissions and/or engine operation will not be rejected without consideration. All data quality and QA requirements of this protocol must be met by any alternate test, and this protocol relies on the QA incorporated in the FTP. Significant modification of the FTP sampling and analysis system is unlikely to be acceptable. Changes in the FTP that amount to re-arrangement of existing portions of the test procedure and retain the existing QA steps are more likely to be acceptable.
With these constraints, alternate or special test procedures may be proposed in the application for the technology and will be reviewed with the APCTVC for conformance to this generic protocol before test/QA plan preparation.
Existing data of any kind and chassis and in-use field (e.g., on-road testing devices) data are not acceptable as the basis for ETV.
5.2.4 ETV of Diesel FMs Delivering Immediate Emission Reductions
5.2.4.1 ETV testing sequence. Emission testing on the base fuel must be conducted first. For an arbitrary engine choice for which no historical emissions performance information is available, the base/candidate test points may be conducted in either sequence of base/candidate/base/candidate (BCBC), or base/candidate/ candidate/ base (BCCB). Each test point (B or C) is to include the same number of tests. For the special case of an engine having a substantial documented emissions history (explained further below), a test sequence of BBCC is permitted.
Table 4 outlines the minimum single highway diesel engine test for an immediate emissions reduction FM using the BCCB sequence. The minimum number of tests required at each point in the test sequence is given in Equation B-3. For example purposes, the FM being evaluated in Table 4 is assumed to be one whose expected emissions reduction is large enough that the minimum test set (one cold test, three hot starts, and one SET) at each test point provides a sufficiently narrow confidence interval. Other diesel engine applications would run the appropriate FTP test sequence.
19

Revision No.: 03 Date: September 2003
After the base fuel is used to conduct the prescribed minimum number of tests for the expected emission reduction, candidate fuel testing should be performed. After conducting the minimum number of prescribed tests on the candidate fuel, emission results for each pollutant should be analyzed. If the emission reduction achieved is less than expected, the applicant may run additional tests to support fuel performance. If additional testing on the candidate fuel is desired by the applicant, all testing on the candidate fuel should be completed before switching fuels.
Diesel engines are not expected to exhibit emissions deterioration such as is shown in Figure 1. However, for an unknown FM in an arbitrary engine, it is possible. Potential drift by the test diesel engine (Table 4, Step 11) is to be evaluated as follows:
1. By comparing base fuel emissions at the beginning and end of the test program. Initial and final base fuel results that are not statistically different indicate no deterioration and a zero slope emissions line.
2. By choosing an engine with a documented test history for which at least two baseline emissions measurements show constant emissions over a period that exceeds the expected total ETV test duration. The FM application should propose the engine and provide the requisite evidence of constant emissions so that the test/QA plan can be properly prepared. If the initial ETV baseline emissions result (Table 4, Step 3) is not statistically different from the previous two measurements for the engine, the final baseline test (Table 4, Step 10) may be conducted, on a separate day, prior to use of the FM, and the average emissions of the two will serve as the base-fuel emissions. That is, Step 10 becomes a new Step 3a.
Table 4. Minimum ETV Test Program for Single On-highway Diesel Engine and Immediate Effect FM
1. Select representative engine and stabilize operation on base fuel. 2. Map engine on base fuel and practice cycles. 3. Conduct cold start, three hot starts, and SET on base-fueled engine with base fuel map. 4. Switch to candidate FM, purge base fuel, and operate and stabilize engine. 5. Map engine with FM. Practice cycles using base fuel map. 6. Conduct cold start, three hot starts (using base fuel map), and SET (with FM map) on FM-fueled engine. 7. Repeat cold start, three hot starts (using base fuel map), and SET (with FM map) on FM-fueled engine. 8. Switch back to base fuel, purge FM fuel, and operate and stabilize engine. 9. Perform second map using base fuel. Perform practice cycles using new base map. 10. Using new base fuel map, conduct cold start, three hot starts, and SET. 11. Compare initial and final base fuel emissions results for statistical differences.
5.2.4.2 Data reduction for immediate effects diesel FM. For highway diesel engines, emissions tests results are recorded at each test point for HC, CO, NOX, PM and the other measured pollutants. For each pollutant, the single cold start emissions measurement (eC) is combined with each of up to three hot start emission measurements (eH) to obtain up to three composite emissions rates [(ECOMP)m] following the normal fractional calculation for highway engines:
( / )( e ) + (6 / 7)( e )1 7 (Ecomp )m =
( / )( Wc
c ) + (6 / 7)( WH
H ) m
m (7)1 7
where:
20
Revision No.: 03 Date: September 2003
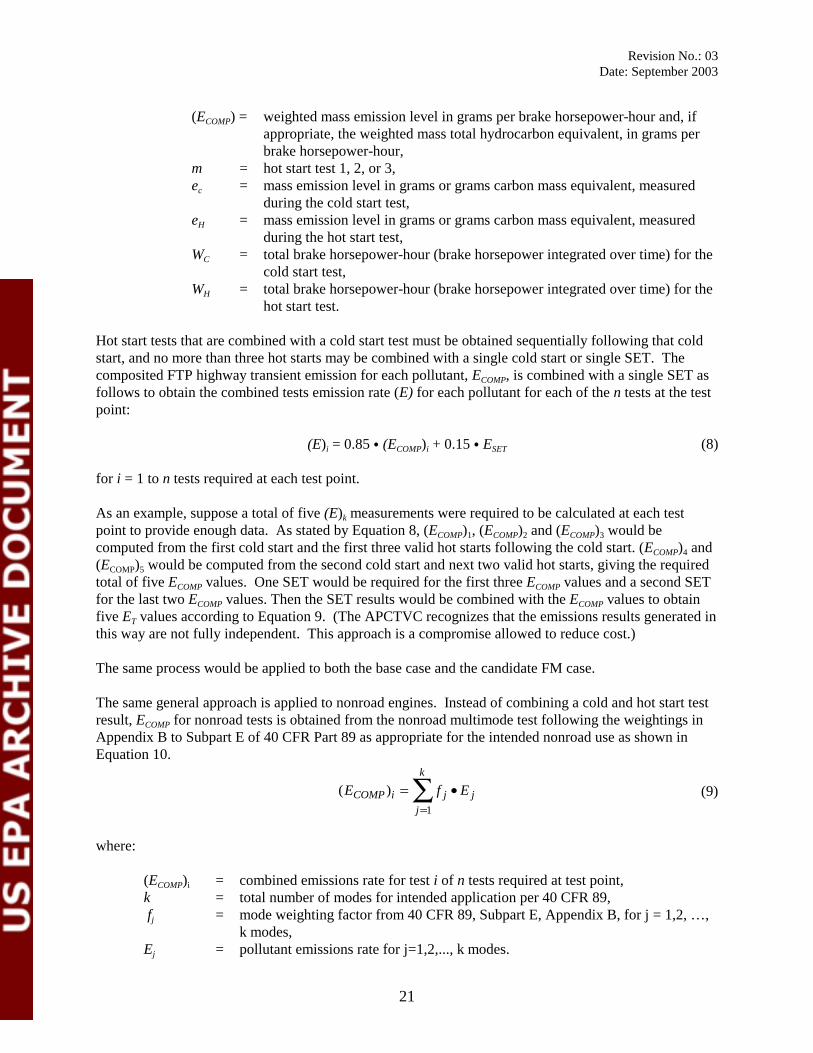
(ECOMP) = weighted mass emission level in grams per brake horsepower-hour and, if appropriate, the weighted mass total hydrocarbon equivalent, in grams per brake horsepower-hour,
m = hot start test 1, 2, or 3, ec = mass emission level in grams or grams carbon mass equivalent, measured
during the cold start test, eH = mass emission level in grams or grams carbon mass equivalent, measured
during the hot start test, WC = total brake horsepower-hour (brake horsepower integrated over time) for the
cold start test, WH = total brake horsepower-hour (brake horsepower integrated over time) for the
hot start test.
Hot start tests that are combined with a cold start test must be obtained sequentially following that cold start, and no more than three hot starts may be combined with a single cold start or single SET. The composited FTP highway transient emission for each pollutant, ECOMP, is combined with a single SET as follows to obtain the combined tests emission rate (E) for each pollutant for each of the n tests at the test point:
(E)i = 0.85 � (ECOMP)i + 0.15 � ESET (8)
for i = 1 to n tests required at each test point.
As an example, suppose a total of five (E)k measurements were required to be calculated at each test point to provide enough data. As stated by Equation 8, (ECOMP)1, (ECOMP)2 and (ECOMP)3 would be computed from the first cold start and the first three valid hot starts following the cold start. (ECOMP)4 and (ECOMP)5 would be computed from the second cold start and next two valid hot starts, giving the required total of five ECOMP values. One SET would be required for the first three ECOMP values and a second SET for the last two ECOMP values. Then the SET results would be combined with the ECOMP values to obtain five ET values according to Equation 9. (The APCTVC recognizes that the emissions results generated in this way are not fully independent. This approach is a compromise allowed to reduce cost.)
The same process would be applied to both the base case and the candidate FM case.
The same general approach is applied to nonroad engines. Instead of combining a cold and hot start test result, ECOMP for nonroad tests is obtained from the nonroad multimode test following the weightings in Appendix B to Subpart E of 40 CFR Part 89 as appropriate for the intended nonroad use as shown in Equation 10.
k
(ECOMP i ) =∑ f j • E j (9) j=1
where:
(ECOMP)i = combined emissions rate for test i of n tests required at test point, k = total number of modes for intended application per 40 CFR 89, fj = mode weighting factor from 40 CFR 89, Subpart E, Appendix B, for j = 1,2, …,
k modes, Ej = pollutant emissions rate for j=1,2,..., k modes.
21

Revision No.: 03 Date: September 2003
The nonroad transient test cycle takes the place of the SET for nonroad applications. Only a single nonroad transient test is required at each test point. The nonroad transient cycle emissions are combined with the combined multimode test emissions as follows:
Ei = X � (ECOMP)i + Y � ENTTC for i = 1 to n tests required at each test point (10)
where: X = constant determined by EPA-OTAQ, Y = constant determined by EPA-OTAQ, ENTTC = emissions from nonroad transient test cycle.
The emissions reductions for both highway and nonroad engines are then calculated using Equations 1 through 6 from Section 5.1.3.1.
5.2.5 FMs Delivering Cumulative Emission Reductions
5.2.5.1 ETV of single diesel engine tests of cumulative effect FMs. The general procedure discussed in Section 5.1.3.4 is applied for single engine tests.
5.3 ETV of Gasoline FMs
This section applies to fuels and fuel additives used in spark-ignition engines.
5.3.1 Base Fuels
The general requirement for a base gasoline fuel within ETV is that it be widely and consistently available within the region where the FM will be marketed and defined narrowly enough to give consistent test results. As part of the ETV test, the base fuel will be analyzed and the result reported in the ETV report and verification statement. The applicant will specify the desired base fuel in his application, with his choice based on the intended market.
5.3.2 Test Vehicles
5.3.2.1 General requirements. The gasoline FM applicant may select as the target of the verification results a specific engine family. The APCTVC specifies the general requirements for vehicles that will be used in the test and provides the single engine test protocol. General ETV requirements for gasoline test vehicles are as follows:
1. Test vehicles must be in their certified condition, have no obvious signs of tampering, and be in reasonably good repair. Vehicles may have no new emission control components.
2. Whether for single or multiple vehicle verification, the test/QA plan must specify the vehicle selection criteria and procurement method. Test vehicles must have at least 10,000 miles on their engines, be in good working condition, and not have been screened for sensitivity to the candidate FM.
3. All prior maintenance and repair information must be documented. 4. Rebuilt engines are not allowed. 5. Vehicles must not exceed 110% of the applicable emissions certification standard during baseline
testing. Exceeding any emissions standard must be the result of the normal distribution of emissions; that is, the vehicle and emission control system must be operating properly, with no obvious reason for the non-compliance.
22

Revision No.: 03 Date: September 2003
5.3.2.2 Number of test vehicles. For single LDV family verification, the specific LDV is the applicant’s choice. The application for the FM should state the desired vehicle, and the characteristics of that vehicle will be included in the test/QA plan. If eventually seeking full U.S. fleet verification, the applicant is required to coordinate with EPA-OTAQ.
5.3.2.3 Nonroad use gasoline engines for FM verification. Gasoline FMs may be verified for emissions reductions in nonroad gasoline engines. The applicant recommends the desired test engine, which must meet the general criteria in Section 5.3.2.1.
5.3.3 General Test Procedures
All equipment used in the ETV testing must be maintained and operated in accordance with applicable FTPs. Raw test results are to be retained by the testing organization in the electronic format required for certification tests and made available to the APCTVC if requested. Results for each test phase are to be reported separately as well as with final weighted FTP test results.
5.3.3.1 Vehicle preparation and maintenance. Prior to baseline testing, test vehicles must have normal maintenance performed such as oil and air filter changes. Other recommended maintenance, such as positive crankcase ventilation (PCV), spark plugs, crankcase filter, etc., shall be performed if the normally recommended interval is due or would become due during the test program. Vehicles will be checked for trouble codes and maintenance indicator lights (MILs) and repairs performed before beginning the ETV test. No trouble codes may be stored when beginning ETV testing. Trouble codes set during testing must be recorded and described in the test records.
To the extent practical, the engine and test conditions should be maintained the same between the base and candidate FM tests. This consideration applies to all aspects of engine operation and maintenance. Routine engine maintenance must be performed before beginning a verification test and, once testing has started, routine engine maintenance is generally not allowed. If use of an FM requires that an engine be tuned for the FM, this requirement must be detailed in the test/QA plan and will be included in the report as a requirement for use of the FM. Resumption of testing following engine or test stand breakdown and repair will be evaluated by the APCTVC on a case-by-case basis and will be allowable only for brief shutdowns for which no emissions impact is considered likely. A full fuel analysis is required on both base and candidate FM fuel.
Before initiating ETV testing, the fuel tank(s) shall be drained, base fuel added to the 40% full level, and a triple preparation (three 505-second hot-start tests per the EPA Dynamometer Procedure 40 CFR 86.135-90) performed.
5.3.3.2 Required test procedures. For on-road vehicles and engines, the FTP is described by 40 CFR Part 86. For nonroad engines, the FTP is described by 40 CFR Part 90. The FTP applicable at the time of the test is to be used. Whenever an FTP test is performed on a light duty vehicle or light duty truck, it will be followed by a US06 test (40 CFR 86.159-00). Heavy duty gasoline engines are tested on an engine dynamometer (40 CFR 86 Subpart N).
The highway fuel economy test, cold CO test, and evaporative emission testing will be required of any FM that may reasonably be expected to affect fuel volatility. When evaporative emission testing is not being performed, the heat build portion of the test will not be required after adding fuel.
Requests by applicants to use alternate or special gasoline vehicle or engine test procedures to better predict emissions and/or engine operation in use will not be rejected without consideration. They must
23
Revision No.: 03 Date: September 2003
be proposed in the application and will be discussed before preparing the test/QA plan, which must incorporate a complete description of the ETV test. The ETV testing data quality and QA requirements of this protocol must be met by any alternate test. Significant modification of the FTP sampling and analysis system is unlikely to be acceptable. Alternate test procedures that amount to rearrangements of existing portions of the FTP test for which the existing test descriptions and QA procedures remain valid are more likely to be acceptable. Specific modes of operation may be required to assess emission reductions for particular in-use operating conditions. Existing data may be used for test design.
5.3.4 Gasoline FMs Delivering Immediate Emission Effects
A single gasoline LDV test point consists of a complete composite FTP test (cold start test plus a valid hot start test) and the US06 test. In accordance with 40 CFR 86.137-94, emissions from the gasoline FTP tests are measured and recorded for all pollutants (HC, CO, NOX, PM) for both phases of the cold start (transient and stabilized) and for the transient phase of the hot start. A minimum of three test points is required for both the base fuel and the candidate FM. After the base fuel is used to conduct the prescribed minimum number of tests for the expected emission reduction, candidate fuel testing should be performed. After conducting the minimum number of prescribed tests on the candidate fuel, emission results for each pollutant should be analyzed. If the emission reduction achieved is less than expected, the applicant may run additional tests to support better FM performance. If additional testing on the candidate fuel is desired by the applicant, all testing on the candidate fuel should be completed before switching fuels.
Additional testing may be conducted if the minimum testing requirements do not demonstrate the targeted emission reductions by continuing to test with the candidate fuel and then performing a corresponding number of tests with the base fuel.
The weighted FTP mass emission rate Ecomp for each pollutant is obtained as described in 40 CFR 86.14494 as the sum of 43% of the cold start emissions per mile (EC) and 57% of the hot start emissions per mile (EH).
E = 0.43 � EC + 0.57 � EH (11)comp
The combined emissions for each pollutant from a single test, E, are computed as follows:
E = 0.72 � Ecomp + 0.28 � EUS06 (12)
where: EUS06 = emission rate for the US06 test.
Each value of ET is computed from separate FTP and US06 measurements. Therefore, if three tests are required to have sufficient data at a test point, a total of three full FTP tests and three US06 tests are required.
Calculation of the single engine emissions reduction is completed using Equations 1 through 6, with the combined emissions for each pollutant, E, for the base case being substituted for EB, and E for the FM case being substituted for EF.
The same general approach is applied to nonroad gasoline engines. Instead of combining a cold and hot start test result, E for nonroad tests is obtained from the multimode nonroad test following the weightings in 40 CFR Part 90 as appropriate for the intended nonroad use as shown in Equation 16.
24

Revision No.: 03 Date: September 2003
k
Ei =∑ f j • E j (13)
j=1
where:
Ei = emissions rate for test i of n tests required at each test point, k = total number of modes for intended application per 40 CFR 90, for j = 1,2, …, k modes, fj = mode weighting factor from 40 CFR 90,
Ej = pollutant emissions rate for j=1,2,...k modes.
5.3.5 ETV of Gasoline Cumulative Effect FMs
5.3.5.1 ETV of single gasoline vehicle with cumulative effect FMs. The general procedure discussed in Section 5.1.3.4 is applied for single engine tests.
5.3.5.2 ETV of multiple gasoline vehicles with cumulative effect FMs. For fleet-wide emissions reductions, the emissions reduction for each pollutant is computed from a linear regression on the data from the tested vehicles (as for diesel engines) as described in Appendix D.
5.4 ETV of Lubricant FMs
This protocol was developed to verify the performance of lubricant FMs that are straightforward replacements of conventional crankcase lubricants. Lubricant FMs tested are expected to provide equivalent or better performance than those recommended by the original equipment manufacturer (OEM) for the test engine(s). By providing emissions control and unchanged maintenance requirements, these FMs may provide a net emission reduction.
If a candidate lubricant is not a straightforward replacement for conventional crankcase lubricants or cannot meet the performance specifications required by the OEM, the applicant must provide an appropriate means to demonstrate that any emission reductions identified will be achieved in-use. For example, if the FM candidate lubricant cannot maintain the oil change interval recommended by the OEM, the applicant must provide a compliance and enforcement plan that will verify that the new interval will be followed in use to assure projected emission reductions are achieved in use. This plan will then be considered an integral part of the technology and the verification will be for the lubricant and its written plan for use.
If a candidate lubricant requires a special oil filter or other companion technology to function, the application must specify the requirement. The test will then be designed for both the FM lubricant and the companion technology, and the ETV verification will be for both technologies as a system.
As with the other FMs, verification of emissions reductions for lubricants is based on comparison of emissions during a base case test with those during a test using the candidate lubricant. For the base case and candidate lubricant test, the duration is approximately one oil change cycle, with emissions tests conducted periodically during that cycle. Tests done under this protocol do not evaluate the long term engine and emission control system deterioration/improvement from candidate lubricants; the applicant should be confident of and have conducted adequate tests to confirm the long term effects of the lubricant.
25

Revision No.: 03 Date: September 2003
The applicant is responsible for providing necessary information on candidate and base lubricants as well as OEM specifications for lubricants and their change intervals for each test engine. All applicable specifications and ratings must be fully referenced and documented by the applicant. All additives contained in the candidate lubricant must be fully described. Any exceptions to the applicable specifications must be noted for discussion with the APCTVC and/or EPA-OTAQ. Additionally, the application must describe the lubricant, its source, all additives, and provide information showing that the candidate lubricant does not contribute to increased engine or emission control system deterioration. Where procedures are not specified in this section, applicable procedures in the gasoline or diesel sections must be followed.
5.4.1 Candidate Lubricants
The suitability of candidate lubricants for the proposed application will be evaluated based on comparison of the candidate FM’s properties to those of a base lubricant for the tests referenced in Table 5. The lubricant FM application must report results for the tests in Table 5 (or their latest revision) for all grades proposed for use in the ETV verification. This table suggests ranges of results for these tests. Because test procedures and property standards may change, the protocol will not require compliance with these ranges. Instead, a verification will indicate how a candidate lubricant compares with an expected performance standard. All additives in the candidate lubricant must be fully described. This includes measurements of all properties listed in Table 5. The presence of additives or of performance specifications related to emission control system deterioration (such as phosphorus) will be specifically noted in the verification report because these could cause decreased emission control system durability or a reduced emission benefit after long term use.
26

Revision No.: 03 Date: September 2003
Table 5. FM Lubricant Properties and Testsa
Test ASTM Number Description Range of Result
Kinematic viscosity @ 100 °C
ASTM D 445 Measures flow resistance of fluid to gravity 3.5 (SAE 0W) to 16.5 cSt (SAE 50)
Pour point ASTM D 97 Measures temperature at which fluid sample will no longer flow by gravity
-25 to - 45 °C
Noack volatility ASTM D 5800 Measures evaporation of fluid at 250 °C for 1 hr
0 to 30%
Flash point ASTM D 92 or D 93
Temperature at which a spark will ignite a flame in the vapor space over test fluid
120 °C minimum
Rotating bomb oxidation test (RBOT)
ASTM D 2272 Measures time for uptake of 100 psi oxygen gas (by pressure drop) of fluid at 100 °C in closed, rotating vessel
30 minutes minimum
Chemical analysis ICP Spectra or XRF
Quantitative analysis of elements No halogens, Pb, catalyst poisons
Phosphorus content ICP Spectra or XRF
Quantitative analysis of elements 1500 ppm maximum
Copper corrosion ASTM D 130 Grades color change of copper surface after immersion in fluid for 3 hr at 100 °C
1B maximum
Rust prevention ASTM D 665 A&B
Counts size and number of rust spots on fluid-treated steel surface in fresh water (A) and sea water (B)
Pass A
Foam control ASTM D 892 Sequence I-IV
Measures foam head on fluid into which air is sparged under various conditions (Sequence I-IV)
None after 10 minutes in all sequences
Four ball wear ASTM D 4172 Measures diameter of spot worn on stationary ball bearings by a driven ball bearing under 20 kg load
0.5 mm maximum
Falex pin and vee block
ASTM D 3233 Measures friction and wear on a pin spinning between blocks under measured clamping load
Steady state coeff. of friction = 0.15 max
a Society of Automotive Engineers (SAE) Document J300, Viscosity Grades for Engine Oils, December, 1999.
The applicant must provide a single mixed batch of the candidate lubricant FM(s) in sufficient quantity for the entire program. The ETV report will list the lubricant grades tested and the emissions reduction obtained.
5.4.2 Base Lubricant and Test Fuel
The applicant must recommend potential base lubricating oils for the ETV verification. They are to be widely distributed, conventional technology lubricants, and are expected to be petroleum- based. The base lubricant must meet the most recent performance specifications for each engine or vehicle model. Where OEM specifications have been superseded by a new grade, the new grade must be used as the base lubricant. From the recommended list, the APCTVC will choose one brand of base lubricant for all ETVs, and the verification report will note emission reductions relative to that base lubricant.
If the applicant knows that the candidate lubricant may be affected by fuel properties, this should be described in the application, will be factored into the test design, and will be reported as characteristic of
27

Revision No.: 03 Date: September 2003
the FM. As described in more detail below, the ETV test includes periodic emissions test sequences separated by mileage (time) accumulation periods. Test fuels meeting the base fuel specifications in the gasoline or diesel sections must be used at each test sequence of the program. Commercial fuel may be used for mileage accumulation, provided it is used consistently throughout the entire test. The test/QA plan will identify specific fuel properties for all phases of the program, and the ETV will report the measured emissions reduction specifically for the gasoline or diesel fuel used during the test.
The base lubricant and the test fuel must be obtained and prepared as needed such that both are available in sufficient quantities for the entire program.
5.4.3 Highway Use Test Engines or Vehicles
Test vehicle(s) or engine(s) used in the lubricant FM tests must be stable as described in the applicable gasoline and diesel FM sections. The base and candidate lubricants must meet the lubricant specifications for the test vehicle(s) or engine(s). Documentation of these specifications must be provided for each vehicle or engine.
5.4.3.1 Types of vehicles. The types of test vehicles shall be selected in accordance with the gasoline and/or diesel FM sections. Where more than one vehicle or engine will be tested, an effort should be made to maximize the diversity of engine characteristics, such as engine speed and operating temperatures, that might affect oil performance.
5.4.4 Nonroad Engine Selection
The general requirements for engine selection for ETV of modified fuels remains applicable for lubricant FMs intended for nonroad applications. The applicant may propose test engines in his application, and these recommendations will be reviewed by the APCTVC.
5.4.5 General Test Procedures
To minimize carryover effects between the lubricants, a purge of the test vehicle (engine) shall be performed each time the oil type is changed. If the base or candidate oil is clearly labeled with a specific purge step as standard operating procedure (SOP), that SOP will be incorporated in the test/QA plan. If a purge SOP is not provided, the test vehicle or engine must be operated for a full oil change interval on the new lubricant before the oil change interval during which emission testing will occur. This operation will help insure that a normal residual amount of used oil (base or FM lubricant) is in the test vehicle when testing is conducted. Whenever the oil is changed or added, the volume of all oil added or removed must be recorded. Prior to making any oil changes (removal or addition), the crankcase oil level and condition must be recorded.
5.4.5.1 Vehicle preparation and maintenance. All test vehicles/engines are to be in good operating condition and to have been maintained in accordance with OEM requirements. Vehicle information must be recorded and maintenance documented through shop records. Prior to beginning the ETV test sequence, the crankcase oil level and condition must be recorded. After the engine/vehicle start condition has been noted, normally scheduled maintenance that is due or may become due during the test program should be performed; and, if so equipped, spark plugs, PCV valve, and air and breather filters are to be changed. The condition of the parts removed is to be noted and these parts are to be retained. An oil sample may be obtained to determine oil condition. No MIL/OBD fault codes are to be present. This vehicle information must be reviewed for acceptability prior to beginning testing.
28

Revision No.: 03 Date: September 2003
Similarly, at the end of the testing program, spark plugs, PCV valve, and air and breather filters will be removed, retained, and their condition noted. The vehicle/engine will be inspected, and any MIL/OBD faults noted. The condition of the vehicle/engine, indications of oil deposits, leaking, or any other oilrelated potential concerns will be noted and described in detail in the verification report.
For replacement lubricant FMs, the same brand and part number of oil filters (as specified by the vehicle or engine original equipment manufacturer) must be used throughout the program. The number of filters required for the entire ETV program must be procured prior to its beginning, and the oil filter used at any time randomly selected from that stock.
Base and candidate oils must each be batch-mixed to have enough for the entire program. All special mixing and/or handling procedures must be consistent with good engineering judgment and fully described in the test/QA plan. All storage, mixing, and/or handling instructions for the candidate oil must be fully described in the application.
5.4.5.2 Required test procedures. The required emission tests are described in the applicable gasoline and diesel FM test sections. Equipment and reporting requirements, are specified in the applicable federal regulations. If an oil analysis is performed on any oil from a test vehicle, the results of that analysis will be included in the verification report.
5.4.5.3 Service accumulation. The test/QA plan will specify a service accumulation schedule for each vehicle to follow over the oil change interval. The OEM oil change interval should be used unless a longer interval is needed to evaluate changes over a longer period of operation such as if the oil were not changed in time. An applicant may request a shorter oil change interval. Where more than one vehicle or engine will be tested, the service accumulation schedules for different vehicles should include severe and normal operation to confirm performance of the candidate oil over a broad range of operation. In all cases, the service accumulation on the base oil and candidate oil must be the same over the oil change interval.
5.4.6 Lubricant FM ETV Test Sequences
Figure 2 shows the form of lubricant FM effects that are contemplated in the GVP data analysis in its most complex form with both short-term and long-term deterioration. The same analysis applies in cases exhibiting no deterioration in either the short term (over a single oil change) or the long term, and with different slopes for the base and FM cases. The estimated log (emission reduction) is the difference between the base case and FM case emissions at the midpoint of the FM case service. The analysis is simplest when the test points are symmetrical as shown in Figure 2.
The ETV test for a single vehicle/engine consists of a purge with the new lubricant and alternating test sequences and mileage/hours accumulation periods. As implied in Figure 2, it is assumed within this protocol that the emissions effect will be measurable during the first oil change of the candidate oil (following the purge step). If cumulative effects are expected, additional mileage accumulation may be incorporated into the test/QA plan and steps taken to return the vehicle/engine to baseline operation as described in Section 5.1. The applicant will be expected to provide the mileage/hours required for the FM to reach full effectiveness and the time required to return the vehicle/engine to baseline operation.
29

Revision No.: 03 Date: September 2003
log
(Em
issi
ons)
Change in log (emissions)
Figure 2. Lubricant FM Testing
The lubricant FM tests for light duty gasoline and all diesel engines are essentially the same as those described above for FMs. Figure 2 provides a graphic overview of the lubricant FM ETV test, and Table 6 gives the testing procedure for lubricant FMs. Details of the testing at the individual test points are as described in Sections 5.2 and 5.3 for diesel engines and gasoline vehicles, respectively.
5.4.7 Evaluating Results Table 6. Lubricant FM Test Sequences
Light Duty Gasoline-Vehicle Test Sequencea
Fuel drain and 40% fill. Triple preparationFuel drain and 40% fill. Conduct FTP and US06 tests per Section 5.3.Fuel drain and 40% fill. Conduct FTP and US06 tests per Section 5.3.Fuel drain and 40% fill. Conduct FTP and US06 tests per Section 5.3.Assign weight and combine results as described in Sections 5.3.5 and 5.3.6 to obtain the fully combinedemission rates for each pollutant.
Heavy Duty Engine Test Sequence
Map engine.Practice FTP cycles.Run cold start test.Run up to three hot start tests without running another cold start.Run the SET.Weight and combine emissions results as described in Sections 5.2.4 and 5.2.5 to obtain the fully compositedemission rate for each pollutant.
a Highway fuel economy testing is optional; but, if used, it must be performed after required tests and consistently in each test sequence to maintain test uniformity.
30

Revision No.: 03 Date: September 2003
5.4.7.1 Single engine test data analysis. If there is no indication of emission system deterioration (the means of the base case test are the same), the single engine data may be analyzed applying Equations 1 through 6 as described in Section 5.1.3.1. All eight base case tests should be averaged to generate the base case mean. The resulting emission reduction for each pollutant will be reported.
If comparison of the two base case test series shows a measurable increase in emissions, a least-squares line should be fitted to the data applying the principles given in Appendix E. For an experiment in with a symmetrical design (Figure 2), the mean emission reduction, ∆� , is
∆� j = E2j − E1j + E3j (14)
2
where:
E1 = the mean of the first four base case tests (in log-scale units) for the pollutant of interest,
E2 = the mean of the four FM tests (in log-scale units) for the pollutant of interest,
E3 = is the mean of the second four base case tests (in log-scale units) for the pollutant of interest.
Equation 18 is a recast version of Equation E-5 in Appendix E. As a percentage, the emission reduction is computed as
∆ER = −(1 e �
j ) ×100% (15)
For non-symmetrical designs, the general form of the analysis in Appendix D will be applied.
5.4.7.2 Cumulative effect lubricant FM data analysis. The analysis of cumulative effect lubricant FM emission reductions is highly dependent on the type of cumulative effect caused by the FM. As of the date of this protocol, no data or theory were available describing the probable effect of cumulative effect FMs. As is shown in Appendix E, the effect of a lubricant FM is totally confounded with a long-term quadratic effect for a 12-test experimental design such as is shown in Figure 2. Therefore, more complex data analyses are not likely to bear fruit. In addition, no cumulative effect lubricant FM vendor has applied to ETV and no such effects have been postulated to the APCTVC. Therefore, all lubricant FM technologies will be treated as providing an immediate effect for the purposes of this protocol.
Should an applicant propose a cumulative effect lubricant, the APCTVC and the testing organization will develop a specific experimental design that applies the test design criteria stated or implied in this protocol for the other technologies.
6.0 REPORTING AND DOCUMENTATION
This section describes the procedures for reporting data in the verification report and verification statement. The specifics of what data must be included and the format in which the data must be included are addressed in this section (e.g., QA/QC summary forms, raw data collected, photographs/slides/video tapes). The verification report for each technology will include near the
31

Revision No.: 03 Date: September 2003
beginning a verification statement that summarizes the ETV results. An example draft is attached as Appendix A. The verification report, including the verification statement, will be written by the APCTVC based on the test report submitted by the testing organization. The verification report and verification statement will be reviewed by the APCTVC and the technology applicant before being submitted to EPA for review and approval as specified in the ETV QMP.
6.1 Reports
Based on the test report from the laboratory, the APCTVC will prepare the draft verification report, which includes the following topics:
1. Verification statement; 2. Introduction; 3. Description and identification of product tested; 4. Procedures and methods used in testing; 5. Statement of operating range over which the test was conducted; 6. Summary and discussion of results as required to
a. support the verification statement, b. explain and document necessary deviations from the test plan, and c. discuss QA issues;
7. References; and 8. Appendices:
a. QA/QC activities and results, b. Raw test data, and c. Equipment calibration results.
The verification statement will include the following:
9. Technology applicant’s name and technology’s descriptive information, 10. Summary of ETV test program, 11. Results of the ETV test, 12. Notice of control device warranty and any limitations of the ETV results, and 13. Brief QA statement.
Review and approval of the draft ETV report and statement are described in Section 3.0.
6.2 Data Reduction
Data from measurements made as part of the ETV test will be reported as emissions rates in grams/kilowatt-hour (g/kW-h) (grams/brake horsepower-hour [g/bhp-hr]) or grams/mile (g/mi) and as percentage emission reductions from the baseline engine. The confidence limits will be presented as well as the mean emissions reduction, as discussed in Section 5.1.2. When they would be helpful to the mobile sources community because of established usage, the appropriate English engineering units will be supplied parenthetically.
7.0 DISSEMINATION OF ETV REPORTS AND STATEMENTS
After an FM technology has been tested and the draft verification report and verification statement prepared by the APCTVC, the APCTVC will send a draft of both to the applicant for review prior to
32

Revision No.: 03 Date: September 2003
submission to EPA and release of the approved report to the public. This gives the applicant the opportunity to review the results, test methodology, and report terminology while the drafts remain working documents and are not publicly accessible. The applicant may submit comments and revisions on the draft statement and report to the APCTVC. The APCTVC will consider these comments and may suggest revisions of its own.
After incorporating appropriate revisions, the draft final verification report and verification statement will be submitted to EPA for review and approval. A signed original verification statement within the verification report will be filed and retained by the APCTVC, and signed originals will also be provided in verification reports to the applicant and to EPA. Three additional paper copies of the ETV report will be provided to the applicant. Further distribution of the ETV report, if desired, is at the applicant’s discretion and responsibility. However, approved verification statements and verification reports will be posted on the ETV Web site for public access without restriction. The verification report report appendices will not be posted on the Web site, but will be publicly available from the APCTVC.
8.0 APPLICANT’S OPTIONS SHOULD A TECHNOLOGY PERFORM BELOW EXPECTATIONS
ETV is not a technology research and development program; technologies submitted to ETV are to be commercially ready and with well-understood performance. Tests that meet the ETV data quality requirements (a valid FTP test) are considered valid and suitable for publishing; however, a technology may fail to meet the applicant’s expectations. Based on limited testing, for instance, the applicant might expect an emission reduction of 30% ± 7% result. However, the actual ETV result from the more complex FTP test cycle might be 20% ± 15%. The APCTVC will use its experience to avoid this situation, but it is possible. In this case, the applicant may choose to schedule additional tests, may accept the result and complete the verification, or may request that a verification statement not be issued. However, ETV reports are always in the public domain and will be posted on the ETV Web site. Verification reports will be written and will be available from EPA for review by the public regardless of a request not to issue a verification statement.
As another example, an applicant might expect a mean of 10% reduction with a confidence interval of ±5%, but testing results in an actual verification shows a mean reduction of 5% with a confidence interval of ±7% reduction. In this case, the ETV data are insufficient to verify that the technology provided any reduction at all. Additional tests must be scheduled and a statistically significant reduction obtained for a verification statement to be issued. Inability to detect a statistically significant emission reduction (or failure to have sufficient tests) will prevent completion of the ETV, and the results of the ETV will be reported publicly stating that performance could not be distinguished from 0% reduction. A verification statement will not be issued in this case.
In either of the above cases, the applicant may improve the product and resubmit it under a new model identification for ETV testing. ETV reports and statements for acceptable tests of the new product will be issued as they are processed by the APCTVC and EPA (except that the results for several identical tests performed in rapid succession will be released simultaneously).
9.0 LIMITATIONS ON TESTING AND REPORTING
To avoid having multiple ETV reports for the same product and to maintain the ETV testing as a cooperative effort with the applicant, the following restrictions apply to ETV testing under this protocol:
33
Revision No.: 03 Date: September 2003
• Applicants may submit only products they manufacture or whose distribution they control. Applicants may not submit for ETV testing control systems whose use is not in their control except with the agreement of the manufacturer or vendor.
• For a given product (e.g., brand and model), APCTVC policy is that only one ETV report and statement will be issued for any single application.
• Air pollution control technology frequently performs differently in different applications. Applicants may request additional tests of essentially identical technology if it is being applied to pollution sources that are clearly different from those for which verifications have been obtained.
10.0 REQUIREMENTS FOR TEST/QA PLAN
10.1 Quality Management
All testing organizations participating in this ETV Program must meet the QA/QC requirements defined below and have an adequate quality system to manage the quality of work performed. Documentation and records management must be performed according to the ETV QMP (U.S. EPA, 2002a) or its superceding document. Testing organizations must also perform assessments and allow audits by the APCTVC (headed by the APCT QA Officer) and EPA corresponding to those in Section 11.
All testing organizations participating in the Retrofit Air Pollution Control Technologies for Highway and Nonroad Use Diesel Engines Program must have an ISO 9000-accredited (ISO, 1994) or ANSI E4compliant (ANSI, 1994) quality system and an EPA- or APCTVC-approved QMP.
10.2 Quality Assurance
All ETV testing will be done following an approved test/QA plan that meets EPA Requirements for Quality Assurance Project Plans (U.S. EPA, 2001c) and Part B, Section 2.2.2 of EPA’s ETV QMP (U.S. EPA, 2002a). These documents establish the requirements for test/QA plans and the common guidance document, Guidance for Quality Assurance Project Plans (U.S. EPA, 2002b), provides guidance on how to meet these requirements. The APCT Quality Management Plan (RTI, 1998) implements this guidance for the APCTVC.
ETVs conducted under this generic protocol utilize test procedures described in the FTP (40 CFR Part 86 for highway engines and 40 CFR Part 89 for nonroad engines). The test/QA plan must describe in adequate detail how the FTP test methods are implemented by the testing organization. Replication of the FTP text is neither expected nor desired. The test/QA plan should reference the FTP in detail, by section and subsection, as appropriate for the topic under consideration. Any deviations from the FTP must be identified and explained. Internal SOPs may be referenced provided they are available for audit review. (SOPs need not be incorporated into the test/QA plan except by reference. If considered proprietary to the testing organization, they should be clearly marked.) When the FTP offers alternative test procedures or equipment, the test/QA plan must identify the alternative implemented. Similarly, if a range of operating parameters is allowed by the FTP, the specifics of the particular implementation must be provided. For a testing organization with multiple test cells, these details may be tabulated and incorporated by attaching a table and identifying the test cell on the test report. Steps the testing organization will take to ensure acceptable data quality in the test results are also identified in the test/QA plan. Detailed reference to SOPs, the calibration portions of the FTP, or other available documents is encouraged. Any needed SOPs will be developed in accordance with Guidance for Preparing Standard Operating Procedures (SOPs) (U.S. EPA, 2001b.)
34

Revision No.: 03 Date: September 2003
The testing organization must prepare a test/QA plan and submit it for approval by the APCTVC. The test/QA plan must also be approved by EPA before the testing organization can begin ETV testing.
A test/QA plan contains the 24 elements listed below, the contents of which may be stand-alone or include references to the FTP or other widely distributed and publicly available sources. Legible handnotated diagrams from the FTP are acceptable. If specific elements are not included, an explanation for not including them must be provided.
Group A Elements: Project Management
A1 Title and Approval Sheet A2 Table of Contents A3 Distribution List A4 Project/Task Organization A5 Problem Definition/Background A6 Project/Task Description A7 Quality Objectives and Criteria A8 Special Training/Certifications A9 Documentation and Records
Group B Elements: Data Generation and Acquisition
B1 Sampling Process Design (Experimental Design) B2 Sampling Methods B3 Sample Handling and Custody B4 Analytical Methods B5 Quality Control B6 Instrument/Equipment Testing, Inspection, and Maintenance B7 Instrument/Equipment Calibration and Frequency B8 Inspection/Acceptance of Supplies and Consumables B9 Non-direct Measurements B10 Data Management
Group C Elements: Assessment and Oversight
C1 Assessments and Response Actions C2 Reports to Management
Group D Elements: Data Validation and Usability
D1 Data Review, Verification, and Validation D2 Verification and Validation Methods D3 Reconciliation with User Requirements
The APCTVC will provide a test/QA plan template that illustrates its expectations.
10.3 Additional Requirements To Be Included in Test/QA Plan
The test/QA plan must include or reference a diagram and description of the extractive gaseous measurement system to be used for the testing and a list of the reference analyzers and measurement ranges to be used for quantifying the concentrations of all gaseous compounds to be measured, including both primary and ancillary pollutants.
35

Revision No.: 03 Date: September 2003
The test/QA plan must include or reference a schematic drawing showing all sample and test locations, including the inlet and outlet to the technology sampling locations. The location of flow disturbances and the upstream and downstream distances from the sampling ports to those flow disturbances must be noted. The number of traverse points that will be sampled must be provided.
The test/QA plan must include or reference the appropriately detailed descriptions of all measuring devices that will be used during the test.
The test/QA plan must explain or reference the specific techniques to be used for monitoring process conditions appropriately for the source being tested. It must also note the techniques that will be used to estimate any other operational parameters.
The test/QA plan must include and document estimates of historical measurement variability that will be used, as discussed in Section 5.1.1 and Appendix B, to compute the number of tests required and provide confidence intervals on single-test ETVs.
The test/QA plan must include a list of data quality indicator goals for individual measurements that conform to those specified in the relevant sections of the FTP and the corresponding acceptance criteria.
11.0 ASSESSMENT AND RESPONSE
Each independent testing organization must conduct internal assessments of its quality and technical systems and must allow external assessments of these systems by APCTVC QA personnel and by EPA QA personnel. After an assessment, the testing organization will be responsible for developing and implementing corrective actions in response to the assessment’s findings.
As appropriate, the APCTVC and/or EPA will conduct assessments to determine the testing organization’s compliance with its test/QA plan. The requirement to conduct assessments is specified in EPA’s ETV QMP (U.S. EPA, 2002a), and in RTI’s APCTVC QMP (APCTVC, 1998). EPA will assess RTI’s compliance with APCTVC’s test/QA plans. APCTVC will assess the compliance of other organizations with their test/QA plans. The assessments will be conducted according to Guidance on Technical Audits and Related Assessments for Environmental Data Operations (U.S. EPA, 2000) and Guidance on Assessing Quality Systems (U.S. EPA, 2001a.)
11.1 Assessment Types
Quality system assessment—Qualitative assessment of a particular quality system to establish whether the prevailing quality management structure, policies, practices, and procedures meet EPA requirements and are adequate for ensuring that the type and quality of measurements needed are obtained.
Technical systems audit—Qualitative on-site audit of the physical setup of the test. The auditors determine the compliance of testing personnel with the test/QA plan.
Performance evaluation audit—Quantitative audit in which measurement data are independently obtained and compared with routinely obtained data to evaluate the accuracy (bias and precision) of a measurement system.
Audit of data quality—Qualitative and quantitative audit in which data and data handling are reviewed and data quality and data usability are assessed.
36

Revision No.: 03 Date: September 2003
11.2 Assessment Frequency
Activities performed during verifications performance operations that affect the quality of the data will be assessed regularly and the findings reported to management to ensure that the requirements stated in the generic verification protocols and the test/QA plans are being implemented as prescribed.
The types and minimum frequency of assessments for the ETV Program are listed in Part A Section 9.0 of EPA’s ETV QMP (U.S. EPA, 2002a). Tests conducted by the APCTVC will have, at a minimum, the following types and numbers of assessments:
• Quality system audit: Self-assessments by the testing organization at least once, and at least one independent assessment of the testing organization.
• Technical systems audits: Self-assessments (qualitative) by the testing organization at least once per test, and at least one independent assessment of the testing organization.
• Performance evaluation audits: Self-assessments (quantitative) by the testing organization on each test, and at least one independent assessment of the testing organization.
• Audits of data quality: Self-assessments (quantitative and qualitative) by the testing laboratory of at least 10% of all the ETV data with detailed reports of the audit results to be included in the data packages sent to the APCTVC for review.
The independent assessments of tests conducted by RTI for the APCTVC will be performed by EPA. The independent assessments of other organizations will be performed by the APCTVC.
11.3 Response to Assessment
When needed, appropriate corrective actions shall be taken and their adequacy verified and documented in response to the findings of the assessments. Data found to have been taken from nonconforming technology shall be evaluated to determine its impact on the quality of the required data. The impact and the action taken shall be documented. Assessments are conducted according to procedures contained in the APCT QMP. Findings are provided in audit reports. Responses by the testing organization to adverse findings are required within 10 working days of receiving the audit report. Followup by the auditors and documentation of responses are required.
12.0 SAFETY MEASURES
12.1 Safety Responsibilities
The testing organization’s project leader is responsible for ensuring compliance with all applicable occupational health and safety requirements. Each individual staff member is expected to follow the requirements and identify personnel who deviate from them and report such action to their supervisor.
12.2 Safety Program
The testing organization must maintain a comprehensive safety program and ensure that all test personnel are familiar with and follow it.
37

Revision No.: 03 Date: September 2003
13.0 REFERENCES
APCTVC. Verification Testing of Air Pollution Control Technology – Quality Management Plan. Air Pollution Control Technology Program. Research Triangle Institute, Research Triangle Park, NC. 1998.
APCTVC. Generic Verification Protocol for Diesel Exhaust Catalysts, Particulate Filters, and Engine Modification Control Technologies for Highway and Nonroad Use Engines. Air Pollution Control Technology Program. Research Triangle Institute, Research Triangle Park, NC. 2002.
ASQC (American Society for Quality Control). Specifications and Guidelines for Quality Systems for Environmental Data Collection and Environmental Technology Programs ANSI/ASQC E4-1994. American Society for Quality Control, Milwaukee, WI. 1994.
ASTM. Standard Test Method for Sulfur in Petroleum Products by Wavelength Dispersive X-ray Fluorescence Spectrometry ASTM D 2622. ASTM International, West Conshohocken, PA. 1998.
ASTM. Standard Test Methods for Measurement of Extreme Pressure Properties of Fluid Lubricants (Falex Pin and Vee Block Methods) ASTM D 3233. ASTM International, West Conshohocken, PA. 1998a.
ASTM. Standard Test Method for Wear Preventive Characteristics of Lubricating Fluid (Four-Ball Method) ASTM D 4172. ASTM International, West Conshohocken, PA. 1999.
ASTM. Standard Test Method for Determination of Aromatic Content and Polynuclear Aromatic Content of Diesel Fuels and Aviation Turbine Fuels by Supercritical Fluid Chromatography ASTM D 5186. ASTM International, West Conshohocken, PA. 1999a.
ASTM. Standard Test Method for Density. Relative Density (Specific Gravity). or API Gravity of Crude Petroleum and Liquid Petroleum Products by Hydrometer Method ASTM D 1298. ASTM International, West Conshohocken, PA. 1999b.
ASTM. Test Method for Total Sulfur in Liquid Aromatic Hydrocarbons and Their Derivatives by Oxidative Combustion and Electrochemical Detection ASTM D 6428. ASTM International, West Conshohocken, PA. 1999c.
ASTM. Standard Test Method for Evaporation Loss of Lubricating Oils by the Noack Method ASTM D 5800. ASTM International, West Conshohocken, PA. 2000.
ASTM. Standard Test Method for Detection of Copper Corrosion from Petroleum Products by the Copper Strip Tarnish Test ASTM D 130. ASTM International, West Conshohocken, PA. 2000a.
ASTM. Standard Test Method for Distillation of Petroleum Products at Atmospheric Pressure ASTM D 86. ASTM International, West Conshohocken, PA. 2001.
ASTM. Standard Test Method for Kinematic Viscosity of Transparent and Opaque Liquids (the Calculation of Dynamic Viscosity) ASTM D 445. ASTM International, West Conshohocken, PA. 2001a.
ASTM. Standard Test Method for Cetane Number of Diesel Fuel Oil ASTM D 613. ASTM International, West Conshohocken, PA. 2001b.
38

Revision No.: 03 Date: September 2003
ASTM. Standard Test Method for Flash and Fire Points by Cleveland Open Cup Tester ASTM D 92. ASTM International, West Conshohocken, PA. 2002.
ASTM. Standard Test Methods for Flash-Point by Pensky-Martens Closed Cup Tester ASTM D 93. ASTM International, West Conshohocken, PA. 2002a.
ASTM. Standard Test Method for Pour Point of Petroleum Products ASTM D 97. ASTM International, West Conshohocken, PA. 2002b.
ASTM. Standard Test Method for Rust-Preventing Characteristics of Inhibited Mineral Oil in the Presence of Water ASTM D 665. ASTM International, West Conshohocken, PA. 2002c.
ASTM. Standard Test Method for Foaming Characteristics of Lubricating Oils ASTM D 892. ASTM International, West Conshohocken, PA. 2002d.
ASTM. Standard Test Method for Oxidation Stability of Steam Turbine Oils by Rotating Pressure Vessel ASTM D 2272. ASTM International, West Conshohocken, PA. 2002e.
CARB. Test Method for Soluble Organic Fraction (SOF) Extraction. California Air Resources Board, El Monte, CA. April, 1989.
CARB. Proposed Regulation Order (DRAFT) Verification Procedure for Diesel Retrofit Systems. http://www.arb.ca.gov/msprog/mailouts/msc0114/msc0114att1.pdf, California Air Resources Board, El Monte, CA. August, 2001.
ISO. ISO 9001-1994, Quality Systems Model for Quality Assurance in Design, Development, Production, Installation, and Servicing. International Organization for Standardization. Geneva, Switzerland. In USA, American National Standards Institute, New York, NY. 1994.
Lloyd, Alan C., and Thomas A. Cackette. Diesel Engines: Environmental Impact and Control. Journal of the Air & Waste Management Association. Air & Waste Management Association, Pittsburgh, PA. Volume 51, pp. 809-847, 2001.
U.S. EPA (Environmental Protection Agency). EPA Guidance for Quality Assurance Project Plans. EPA QA/G-5, EPA/240/R-02/009, http://www.epa.gov/quality/qs-docs/g5-final.pdf. Office of Research and Development, U.S. Environmental Protection Agency. Washington, DC. February 1998.
U.S. EPA (Environmental Protection Agency). Guidance on Technical Audits and Related Assessments for Environmental Data Operations, EPA QA/G-7. EPA/600/R-99/080, http://www.epa.gov/quality/qsdocs/g7-final.pdf, Office of Environmental Information, U.S. Environmental Protection Agency. Washington, DC. January 2000.
U.S. EPA (Environmental Protection Agency). Strategies and Issues in Correlating Diesel Fuel Properties with Emissions. EPA 420-P-01-001. Office of Transportation and Air Quality. U.S. Environmental Protection Agency. Washington, DC. July 2001.
U.S. EPA (Environmental Protection Agency). Guidance on Assessing Quality Systems (Quality Staff Draft). EPA QA/G-3. Office of Environmental Information, U.S. Environmental Protection Agency. Washington, DC. August, 2001a.
39

Revision No.: 03 Date: September 2003
U.S. EPA (Environmental Protection Agency). Guidance for Preparing Standard Operating Procedures (SOPs). EPA QA/G-6. EPA 240/B-01/004. http://www.epa.gov/quality/qs-docs/g6-final.pdf, Office of Environmental Information, U.S. Environmental Protection Agency. Washington DC. March, 2001b.
U.S. EPA (Environmental Protection Agency). EPA Requirements for Quality Assurance Project Plans, EPA QA/R-5. EPA/240/B-01/003, http://www.epa.gov/quality/qs-docs/r5-final.pdf, Office of Environmental Information, U.S. Environmental Protection Agency. Washington, DC. March 2001c.
U.S. EPA (Environmental Protection Agency). Environmental Technology Verification Program, Quality and Management Plan. EPA 600/R-03/021. National Risk Management Research Laboratory – National Exposure Research Laboratory, Office of Research and Development, National Homeland Security Research Center, U.S. Environmental Protection Agency. Cincinnati, OH. December 2002a.
U.S. EPA (Environmental Protection Agency). EPA Guidance for Quality Assurance Project Plans. EPA QA/G-5, EPA/240/R-02/009, http://www.epa.gov/quality/qs-docs/g5-final.pdf, Office of Research and Development, U.S. Environmental Protection Agency. Washington, DC. December 2002b.
U.S. Government. Protection of Environment. Title 40, Part 86, Code of Federal Regulations, as of July 1, 2002. Federal Register. Washington, DC. 2002.
U.S. Government. Protection of Environment. Title 40, Part 89, Code of Federal Regulations, as of July 1, 2002. Federal Register. Washington, DC. 2002a.
U.S. Government. Protection of Environment. Title 40, Part 90, Code of Federal Regulations, as of July 1, 2002. Federal Register. Washington, DC. 2002b.
U.S. Government. Protection of Environment. Title 40, Part 92, Code of Federal Regulations, as of July 1, 2002. Federal Register. Washington, DC. 2002c.
U.S. Government. Protection of Environment. Title 40, Part 94, Code of Federal Regulations, as of July 1, 2002. Federal Register. Washington, DC. 2002d.
40

Revision No.: 03 Date: September 2003
APPENDIX A: EXAMPLE VERIFICATION STATEMENT
Appendix A is an example verification statement written for a generic fuel modification intended to reduce engine emissions from mobile diesel engines. The technology is assumed to have an immediate effect and to be directed at a highway use engine. It is assumed to provide sufficiently large emissions reductions, requiring only the minimum number of tests by the minimum-number-of-tests calculation.
This generic verification statement is intended only to show the form of a verification statement. It will require modification for each technology verified, depending on the details of that technology’s design, construction, and operation. The test/QA plan written for each test will include a draft verification statement customized for the technology actually being tested. The text of that specific verification statement will address the significant parameters that apply to the technology tested.
A-1

THE ENVIRONMENTAL TECHNOLOGY VERIFICATION PROGRAM
U.S. Environmental Protection Agency
ETV Joint Verification Statement
TECHNOLOGY TYPE: MOBILE DIESEL ENGINE FUEL MODIFICATION INTENDED TO PROVIDE EMISSIONS REDUCTIONS
APPLICATION: CONTROL OF EMISSIONS FROM MOBILE DIESEL ENGINES IN (HIGHWAY) (NONROAD) USE BY (TECHNOLOGY TYPE)
TECHNOLOGY NAME: TECHNOLOGY NAME
COMPANY: ADDRESS:
WEB SITE: E-MAIL:
COMPANY NAME ADDRESS CITY, STATE ZIP http://www.company.com [email protected]
PHONE: FAX:
(000) 000-0000 (000) 000-0000
The U.S. Environmental Protection Agency (EPA) has created the Environmental Technology Verification (ETV) Program to facilitate the deployment of innovative or improved environmental technologies through performance verification and dissemination of information. The goal of the ETV Program is to further environmental protection by accelerating the acceptance and use of improved and cost-effective technologies. ETV seeks to achieve this goal by providing high quality, peer reviewed data on technology performance to those involved in the design, distribution, financing, permitting, purchase, and use of environmental technologies.
ETV works in partnership with recognized standards and testing organizations; stakeholder groups which consist of buyers, vendor organizations, permitters, and other interested parties; and with the full participation of individual technology developers. The program evaluates the performance of innovative technologies by developing test plans that are responsive to the needs of stakeholders, conducting field or laboratory tests (as appropriate), collecting and analyzing data, and preparing peer-reviewed reports. All evaluations are conducted in accordance with rigorous quality assurance protocols to ensure that data of known and adequate quality are generated and that the results are defensible.
The Air Pollution Control Technology Verification Center (APCTVC), one of six centers under the ETV Program, is operated by RTI, in cooperation with EPA’s National Risk Management Research Laboratory. The APCTVC has evaluated the performance of a TYPE fuel modification for mobile diesel engines, the TECHNOLOGY by COMPANY NAME.
A-2

Revision No.: 3 Date: September 2003
ETV TEST DESCRIPTION
All tests were performed in accordance with the APCTVC
and Light Duty Gasoline Engines and the specific technology test plan “ETV Test/QA Plan for TECHNOLOGY NAME” These documents include requirements for quality management, quality assurance, procedures for product selection, auditing of the testing organizations, and test reporting format.
The mobile diesel engine air pollution control technology was tested at TESTING ORGANIZATION. The performance verified was the percentage emission reduction achieved by the fuel modification for particulate matter (PM), nitrogen oxides (NOX), hydrocarbons (HCs), and carbon monoxide (CO) relative to the performance of the same engine on base fuel. Operating conditions were documented and ancillary performance measurements were also made. The basic modules of the test procedure are found in the Federal Test Procedures (FTPs) for emissions certification of diesel highway engines (40 CFR Part 86), diesel nonroad engines (40 CFR Part 89), and light-duty gasoline engines (40 CFR Part 86). Multiple replicate tests are required, depending on the type of fuel modification (FM) and the expected emissions reductions. A summary description of the ETV test is provided in Table A-1.
Table A-1. Summary of the Conditions for ETV Test of TECHNOLOGY NAME onENGINE DESCRIPTION
Test conducted Highway Transient Federal Test Procedure (FTP) Engine family ENGINE MFGR NAME Series XXXYYY, ??? operating hours prior to test Engine size YYY kW (XXX hp) Technology ACME Mark II Fuel Additive blended into CA 15 ppm ultra-low sulfur diesel
fuel (ULSD) Technology description Additive is blended at the terminal with the base fuel at 0.02% by weight. Test cycle or mode For both the base and FM-fueled tests, duplicate test sequences were run, each description consisting of 1 cold start, 3 hot starts, and 1 highway steady-state (SET) cycle. Base fuel description EPA standard diesel per 40 CFR Part 86.1313-98 Critical measurements PM, NOX, HCs, and CO per the FTP Ancillary measurements CO2, exhaust temperature, fuel consumption
VERIFIED TECHNOLOGY DESCRIPTION
This verification statement is applicable to the TECHNOLOGY NAME (to include model number and other identifying information as needed), which is a proprietary fuel additive manufactured by MANUFACTURER NAME. TECHNOLOGY NAME is distributed to fuel terminals and is blended into diesel fuel at the time all other additives are blended.
This verification statement describes the performance of TECHNOLOGY NAME on the diesel engine identified in Table A-1. The fuel additive, TECHNOLOGY NAME, is expected to provide similar emissions control performance on other engines having similar exhaust stream characteristics (similar fuel and engine technology) when properly sized for the application.
A-3

Revision No.: 3 Date: September 2003
VERIFICATION OF PERFORMANCE
TECHNOLOGY NAME achieved the emissions reduction shown in Table A-2 at the stated conditions. The number of required ETV tests required was estimated to be the minimum test, consisting of one cold start, three hot starts, and one SET for each of six baseline tests and two candidate FM tests. This estimate was confirmed by the ETV test results. For the purposes of determining the status of the technology in regard to EPA’s voluntary retrofit program, the prospective user is encouraged to contact EPA-Office of Transportation and Air Quality (OTAQ) or visit the retrofit program web site at http://www.epa.gov/otaq/retrofit/.
Table A-2. Verified Emissions Reductions for TECHNOLOGY NAME
Test Engine: Manufacturer’s Name and Model No. AA1
Technology Test
Base Fuel Candidate
FM
Emissions Reduction, %a
Rawb Discountedc
Critical Measurements of Emissions
Hot start PM, g/bkWh (g/bhp-hr)or g/mi Composited PM, g/bkWh (g/bhp-hr) Hot start NOX, g/bkWh (g/bhp-hr) Composited NOX, g/bkWh (g/bhp-hr) Composited HC, g/bkWh (g/bhp-hr) Composited CO, g/bkWh (g/bhp-hr)
Ancillary Measurements
Engine power, kW (hp) Peak torque, N-m (lbf-ft) Composited CO2, g/bkWh (g/bhp-hr) Exhaust flow, L/min (ft3/min) Exhaust temperature, °C (°F) Backpressure, kPa (in. Hg) Fuel usage,d % reduction Technology in/out temperature, °C (°F) Comments
aUnits of measure in rows are as indicated, except shaded columns in %. bERRAW from Equation 3 of the GVP. cERDSCT from Equation 6 of the GVP. d(Candidate PM-base fuel)/Base fuel x 100.
The APCT QA Officer has reviewed the test results and quality control data and has concluded that the DQOs given in the generic verification protocol and test/QA plan have been attained.
During the ETV tests, EPA or APCTVC QA staff conducted technical assessments at the testing organization. These confirm that the ETV tests were conducted in accordance with the testing organization’s EPA-approved test/QA plan.
This verification statement verifies the emissions characteristics of TECHNOLOGY NAME within the stated range of application. Extrapolation outside that range should be done with
A-4

Revision No.: 3 Date: September 2003
caution and an understanding of the scientific principles that control the performance of TECHNOLOGY NAME. This verification focused on emissions. Potential technology users may obtain performance information from the manufacturer.
In accordance with the generic verification protocol, this verification statement is valid commencing on DATE indefinitely for application of TECHNOLOGY NAME within the range of applicability of the statement.
Hugh W. McKinnon, MD MPH Date Jack R. Farmer Date Director Program Director National Risk Management Research Air Pollution Control Technology Verification
Laboratory Center Office of Research and Development RTI United States Environmental Protection
Agency
NOTICE: ETV verifications are based on an evaluation of technology performance under specific, predetermined criteria and the appropriate quality assurance procedures. EPA and RTI make no expressed or implied warranties as to the performance of the technology and do not certify that a technology will always operate as verified. The end user is solely responsible for complying with any and all applicable federal, state, and local requirements. Mention of commercial product names does not imply endorsement.
A-5

Revision No.: 3 Date: September 2003
APPENDIX B: DETERMINING MINIMUM NUMBER OF TESTS REQUIRED AT EACH TEST POINT
The ETV program for mobile source emissions requires that a testing program for a given technology attempt to achieve the following for each vehicle tested:
� The emissions reduction (ER) is to be tested using a t-test with significance level of 0.05; the null hypothesis is that the FM produces no reduction, and the alternative is that it reduces emissions.
� For the applicant’s expected ER, a statistical power of 0.90 is desired.
For FM, the t-test can be formulated in terms of a confidence interval as in equation (4) of the protocol document, or as the ratio (observed ER)/(square root of variance of ER). The goal of this appendix is to derive the sample size needed for this statistical test to achieve the desired level of power.
An approximate variance expression for the emissions reduction is embedded in eq. (4) of the protocol document. This variance is
2
F BVar ( ) ER ≈
E 1
B
ns
F
2
+ − ER )2
ns2
B
(B-1) (1
where EB = the mean of the baseline emissions
sF 2 = the variance of the FM emissions
sB 2 = the variance of the baseline emissions
nF = the number of emissions measurements in the FM sample nB = the number of emissions measurements in the baseline sample
To get an initial sample size, assume that
n = nB = nF and sB 2 = sF
2 = s2 .
Then (B-1) becomes
(2 [1 1( ) ]Var ER ) =
1 s + − ER 2
n EB 2
(B-2)
Let �B and �F denote the true mean emissions level for the given vehicle under baseline and FM conditions, respectively. Assume that we want to have a probability of 1-� of declaring significance if the FM results in an emissions level equal to kµB , where, for instance, k might be
B0.95. The true ER would then be given by µ − µF 1 k , or 0.05. Then, if we want n to be= − µB
B-1

Revision No.: 3 Date: September 2003
large enough to detect an true ER of (1-k) with power (1-�), an approximate formula for n would be given by,
2
n ≥(z + z1−β
(
) 1
2
−σ
k )
2
2
µB 2 1+ k
+ z1
2
2 −α
(B-3) 1−α
where µB = the true population mean baseline emissions rate
σ 2 = the true population measurement-error variance (for both baseline and fuel additive emissions)
Z1−α = the standard normal deviate associated with probability 1-�
Z1−β = the standard normal deviate associated with probability 1-�.
The n calculated in (B-3) is the sample size for both FM and baseline tests (i.e., the total number of tests is 2n); the calculated n should be rounded up to next highest integer. The first term in (B-3) is based on a modification of the standard sample size formula for a one sided z-test; note that it depends on the magnitude of the effect to be detected (k), the relative measurement-error variance (in the parentheses), and the specified error rates (� and �). The second term is a correction factor that accounts for the fact that a t-test rather than z-test (i.e., normal-distributionbased test) is used, since n will generally be small. A derivation of the correction factor is available in Appendix A of the EPA G-4 guidance document (Guidance on the Data Quality Objectives Process (EPA/600/R-96/055)).
As an example of applying (B-3), assume the following: �=0.05, so z1-�=1.645; �=0.10 when k=0.95, so z1-�=1.282; relative measurement error standard deviation = 0.02 (i.e., 2%).
Then substituting into (B-3) yields
2 2 2 2( . 1645 + 1282 . ) ( . 0 02 ) [ 1 + ( .0 95 ) ] ( .1645 ) n ≥ + = . + 135 .2 61 . = 3 96
(1 0 95 − . )2 2 (B-4)
In this situation, 4 baseline and 4 FM tests would be sufficient to demonstrate the emissions reduction with the desired confidence.
B-2
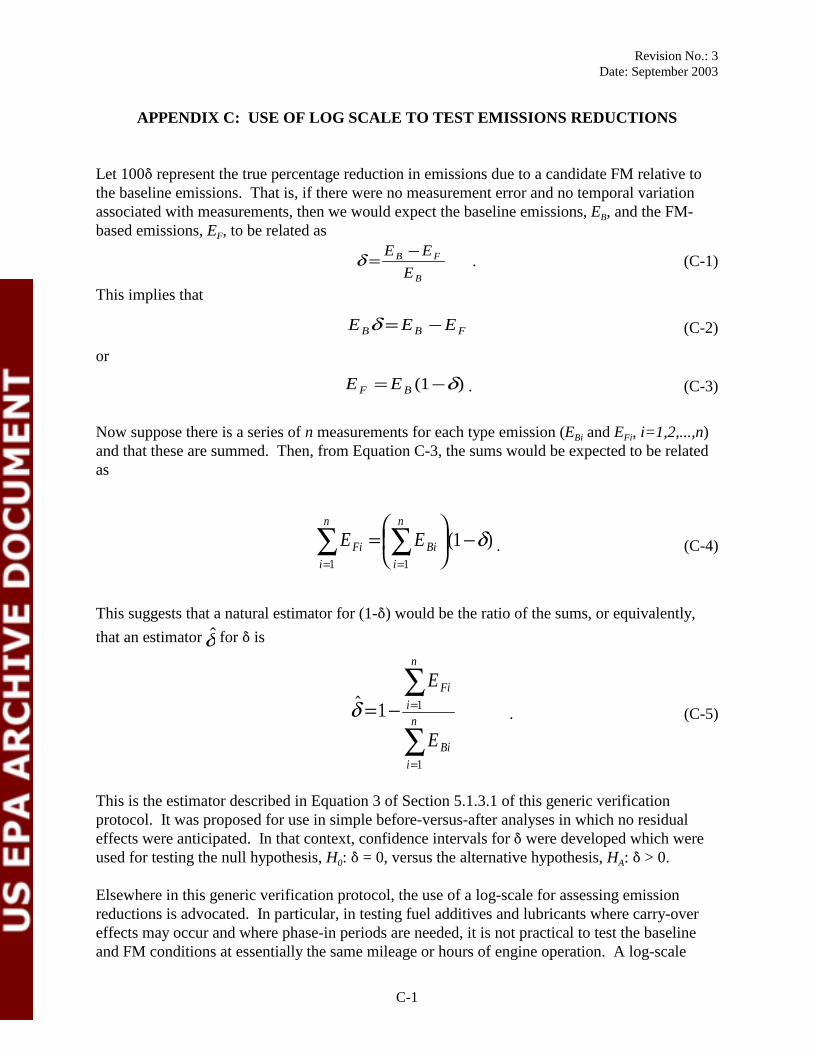
Revision No.: 3 Date: September 2003
APPENDIX C: USE OF LOG SCALE TO TEST EMISSIONS REDUCTIONS
Let 100� represent the true percentage reduction in emissions due to a candidate FM relative to the baseline emissions. That is, if there were no measurement error and no temporal variation associated with measurements, then we would expect the baseline emissions, EB, and the FMbased emissions, EF, to be related as
E −Eδ = B F . (C-1) EB
This implies that
EBδ =EB −EF (C-2)
or
E F =E B (1 −δ) . (C-3)
Now suppose there is a series of n measurements for each type emission (EBi and EFi, i=1,2,...,n) and that these are summed. Then, from Equation C-3, the sums would be expected to be related as
∑ n
EFi =∑
n
EBi
(1 −δ) . (C-4)
i=1 i=1
This suggests that a natural estimator for (1-�) would be the ratio of the sums, or equivalently,
that an estimator δ� for � is
n
∑E Fi
δ 1� = − i= n 1
. (C-5)
∑E Bi i=1
This is the estimator described in Equation 3 of Section 5.1.3.1 of this generic verification protocol. It was proposed for use in simple before-versus-after analyses in which no residual effects were anticipated. In that context, confidence intervals for � were developed which were used for testing the null hypothesis, H0: � = 0, versus the alternative hypothesis, HA: � > 0.
Elsewhere in this generic verification protocol, the use of a log-scale for assessing emission reductions is advocated. In particular, in testing fuel additives and lubricants where carry-over effects may occur and where phase-in periods are needed, it is not practical to test the baseline and FM conditions at essentially the same mileage or hours of engine operation. A log-scale
C-1

Revision No.: 3 Date: September 2003
model is proposed for estimating baseline emissions at that point where the FM tests areconducted. This is appropriate for several reasons.
First, the log-scale analysis is much easier to deal with statistically. Defining an estimator of � ina manner analogous to Equation C-5 would result in complex variance formulas and complexformulas for approximate degrees of freedom because, in the original scale, measurement errorvariances are likely to change with varying emission levels. Use of the log scale, whichpresumes that standard deviations of measured emissions are approximately proportional to theirmagnitude, allows the relevant variances to be calculated in a simple fashion and for degrees offreedom to be determined exactly.
Second, when measurement errors are relatively small (e.g., relative standard deviations [RSDs]less than 20%) and when effects to be detected are relatively small (e.g., 5% or 10%, rather than50%), the log-scale analysis will produce results nearly identical to that implied by Equation C-5. To see this, the log-scale equivalents of the above relationships are defined. Note thatEquation C-3 implies (all logs are natural logarithms)
ln( EF ) = ln( EB ) + ln( 1 −δ) . (C-6)
For a series of measurements, then
ln( 1 − = F µBδ) µ − , (C-7)
where �F and �B are the true ln-scale mean emissions for FM and base respectively.
A natural estimator of ln(1-�) is therefore the difference in the observed ln-scale means from a series of measurements:
ln( )1 − ≅δ YF −YB , (C-8)
~ where YF and YB are the observed log-scale means. This implies that the δ can be estimated
in terms of the ratio of the geometric means (GMs):
~ exp( )
exp( ) δ = −1
Y
Y F
B
≡ −1 GM
GM F
B
. (C-9)
Note that the hypotheses expressed in Equation C-6 can be equivalently stated in log-scale units as
H0: ln(1-�) = 0 versus HA: ln(1-�) < 0 (C-10)
or
C-2

Revision No.: 3 Date: September 2003
H0:�F = �B versus HA: �F < �B . (C-11)
The similarity of the results obtained via the alternate approaches for estimating, and testing for, emission reductions is demonstrated by the simulation results given in Table C-1. Three different sample sizes were considered. In each case, a log-scale measurement error standard deviation of 0.1 (essentially a 10% RSD) was used. The true effects shown in column 2 were used to generate normally distributed “data.” The estimated values of the effects and the results of the respective t tests are very similar, especially for the smaller effect sizes.
Table C-1. Summary of Simulation Results
Total na
True Effects Estimated Effects Standard Errors (s.e.s)
of Estimates p Values from
t Testsb
ln (1-�) � �δ � �µ µF B− ~ δ s e [ ]. . �δ s e F B. .[ � � ]µ −µ p1 p2
400 -0.03 0.030 -0.05 0.049 -0.10 0.095 -0.15 0.139 -0.20 0.181 -0.25 0.221 -0.30 0.259
0.027 -0.028 0.027 0.051 -0.053 0.052 0.086 -0.091 0.087 0.152 -0.164 0.152 0.166 -0.182 0.167 0.203 -0.227 0.203 0.260 -0.299 0.259
0.010 0.011 0.010 0.010 0.009 0.010 0.008 0.010 0.009 0.010 0.008 0.010 0.007 0.010
0.004 0.005 0.000 0.000 0.000 0.000 0.000 0.000 0.000 0.000 0.000 0.000 0.000 0.000
60 -0.03 0.030 -0.05 0.049 -0.10 0.095 -0.15 0.139 -0.20 0.181 -0.25 0.221 -0.30 0.259
0.014 -0.015 0.015 0.029 -0.028 0.028 0.056 -0.062 0.060 0.143 -0.155 0.144 0.158 -0.172 0.158 0.185 -0.206 0.186 0.273 -0.315 0.270
0.025 0.026 0.024 0.025 0.023 0.025 0.021 0.024 0.021 0.026 0.017 0.021 0.019 0.026
0.290 0.276 0.116 0.135 0.010 0.008 0.000 0.000 0.000 0.000 0.000 0.000 0.000 0.000
8 -0.03 0.030 -0.05 0.049 -0.10 0.095 -0.15 0.139 -0.20 0.181 -0.25 0.221 -0.30 0.259
0.108 -0.116 0.109 0.021 -0.019 0.019 0.135 -0.143 0.133 0.138 -0.148 0.138 0.289 -0.343 0.290 0.223 -0.253 0.223 0.111 -0.117 0.111
0.053 0.059 0.058 0.059 0.038 0.044 0.045 0.052 0.035 0.049 0.017 0.021 0.030 0.035
0.047 0.048 0.368 0.381 0.019 0.008 0.014 0.015 0.000 0.000 0.000 0.000 0.007 0.008
a n/2 observations each for FM and for baseline. b p1 is for t test based on δ� . p2 is for t test based on µ�F −µ�B
.
C-3

� �
�
�
Revision No.: 3 Date: September 2003
APPENDIX D: DATA ANALYSIS FOR CUMULATIVE EFFECT FMs
Assume that a series of emission measurements are made at each of four mileage points as indicated in Figure 1 of this generic verification protocol. In particular, assume that the third mileage point is for the candidate FM and that the other three points represent baseline measurements. Let X denote the mileage and let Y denote the natural log of the emissions for a given contaminant. Let X Fj and X Bj denote the average mileages associated with the FM measurements and baseline measurements, respectively, for vehicle j. For a single vehicle, the FM effect, ∆ j , is defined as the difference in ln(emissions) occurring at X Fj . The value ∆� j , which is an approximation of ∆ j , can be estimated as
� � � (D-1)∆ j =Y XFj ( Fj ) −YBj ( X Fj )
where Y XFj ( Fj ) is the predicted FM-based emissions at the (average) mileage associated with those measurements, and Y X( Fj ) is the predicted baseline emissions at that same mileage. Bj
With the measurement design indicated above, Y XFj ( Fj ) is simply the average of the FM-based ln{emissions):
nF
Y X( ) =Y = 1 ∑ y (D-2)
Fj Fj Fj ijnF i=1
where nF is the number of FM-based measurements, yij = ith observed ln(emission) for vehicle j, � )and the summation is over the FM-based measurements. On the other hand, Y X( must beBj Fj
estimated based on the assumed baseline relationship between Y and X. If this relationship is assumed to be linear, then a statistical model for simultaneously estimating �j and the parameters of the linear baseline relationship is the following:
yij =α j +∆ j Zij +β j (xij − X Fj ) +εij (D-3)
where yij = ith observed ln(emission) for vehicle j, xij = mileage associated with ith observation for vehicle j, Zij = 1 if ith observation for jth vehicle is for FM-based condition,
= 0, otherwise, �ij = random error for ith observation for vehicle j, and
( )α j , ∆ j , and +β j x are parameters to be estimated. With the model parameters defined
in this way, the resulting estimates from a least squares regression are as follows:
D-1

Revision No.: 3 Date: September 2003
j Y X Fj ) = estimated baseline (ln-scale) emissions at the mileage where the α� = � Bj (
FM-based tests are conducted,
∆� j , as defined by Equation (D-1), is the estimated effect of the FM, and
nB
Y∑ x yij ij −nB X Bj Bj
β� j = i=1 = estimated deterioration rate under baseline conditions, nB
x 2 −n X 2∑ ij B Bji=1
where nB is the total number of baseline measurements and YBj is the mean of the nB baseline measurements. It should be noted that this slope estimate is identical to the least squares estimate that would be obtained if only baseline data were included in the regression. Standard multiple regression software can therefore be used to produce both an estimate of the desired FM effect and of its standard error. Hence, confidence interval estimates for ∆� j (or hypothesis tests) are straightforward. The variance of the estimated effect can be estimated as
Var [∆ =� j ] s2
j
1 + 1 +
( X Fj − X Bj )2 (D-4)
nB nF nB 2 2 ∑ xij −nB X Bj i=1
where s2 j is the residual variance from the multiple regression performed on the vehicle j data. (If
the model is accurate, then s2 j is an estimate of the measurement error variance of the emissions.)
The degrees of freedom associated with Equation D-4 is nF +nB-3.
The primary single-vehicle hypothesis of interest is the following:
H0:∆ j = 0 vs . H A :∆ j < 0 (D-5)
This is tested by computing a t statistic on the estimated effect, ∆� j ,
∆� j= (D-6)
and comparing the result to tC, the 5th percentage point of a t distribution with nF +nB-3 degrees of freedom (e.g., if the total sample size is 24, then tC = -1.721). The null hypothesis, H0, is rejected if t < tC.
To achieve the desired ETV confidence level (95%) and level of statistical power (90% at the applicant’s anticipated effect level) for testing this hypothesis, one must ensure that the variance
t Var j( � )∆
D-2

Revision No.: 3 Date: September 2003
in Equation (D-4) is sufficiently small. Clearly, the magnitude on Equation (D-4) depends not only on the sample sizes and the underlying measurement error variance, but also on the design – namely, the spacing of the mileage points and the amount of replicate testing at each of those points. In general, smaller variance will be achieved by increasing the dispersion of the baseline mileage points used in the regression and/or by decreasing the absolute difference between X Fj
and X Bj . Note that all of the quantities appearing inside the brackets of Equation (D-4) depend solely on the particular design used. Hence, for any given design, the power of the test can be determined as follows.
• First determine the degrees of freedom and critical value, tC, of the test, as defined above (e.g., select the 95th percentage point from a table of percentage points of the t distribution).
• Based on prior data, assume a value for the true underlying measurement error variance; denote this quantity as �2.
• Then compute a noncentrality parameter, D, as
δD = (D-7)
σ 2 K j
where � is the anticipated effect (in ln-scale units, or relative difference) and Kj is the quantity inside the brackets in Equation (C-4). (Given the formulation of the hypothesis test, � should be negative.)
• The power (the probability of rejecting the null hypothesis when a true effect is equal to �) is then determined as
Pr[ ( ) < tC (D-8)T D ]
where T(D) denotes a random variable following a noncentral t distribution with noncentrality parameter D and nF +nB-3 degrees of freedom. (Standard statistical software packages such as S-Plus or SAS have built-in functions for calculating such percentage points from noncentral t distributions.)
• By varying the design and/or the sample sizes, one can determine when Equation (D-8) exceeds 0.90, the desired power.
D-3
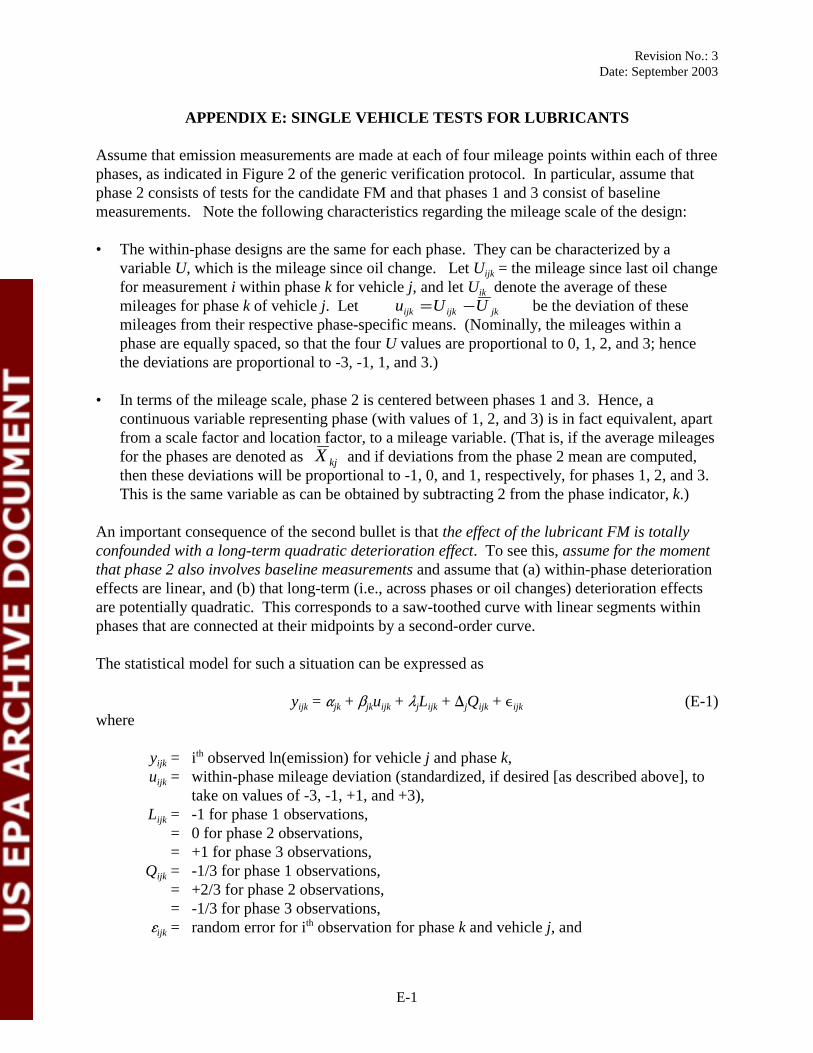
Revision No.: 3 Date: September 2003
APPENDIX E: SINGLE VEHICLE TESTS FOR LUBRICANTS
Assume that emission measurements are made at each of four mileage points within each of three phases, as indicated in Figure 2 of the generic verification protocol. In particular, assume that phase 2 consists of tests for the candidate FM and that phases 1 and 3 consist of baseline measurements. Note the following characteristics regarding the mileage scale of the design:
• The within-phase designs are the same for each phase. They can be characterized by a variable U, which is the mileage since oil change. Let Uijk = the mileage since last oil change for measurement i within phase k for vehicle j, and let Uik denote the average of these mileages for phase k of vehicle j. Let uijk =Uijk −U jk be the deviation of these mileages from their respective phase-specific means. (Nominally, the mileages within a phase are equally spaced, so that the four U values are proportional to 0, 1, 2, and 3; hence the deviations are proportional to -3, -1, 1, and 3.)
• In terms of the mileage scale, phase 2 is centered between phases 1 and 3. Hence, a continuous variable representing phase (with values of 1, 2, and 3) is in fact equivalent, apart from a scale factor and location factor, to a mileage variable. (That is, if the average mileages for the phases are denoted as X kj and if deviations from the phase 2 mean are computed, then these deviations will be proportional to -1, 0, and 1, respectively, for phases 1, 2, and 3. This is the same variable as can be obtained by subtracting 2 from the phase indicator, k.)
An important consequence of the second bullet is that the effect of the lubricant FM is totally confounded with a long-term quadratic deterioration effect. To see this, assume for the moment that phase 2 also involves baseline measurements and assume that (a) within-phase deterioration effects are linear, and (b) that long-term (i.e., across phases or oil changes) deterioration effects are potentially quadratic. This corresponds to a saw-toothed curve with linear segments within phases that are connected at their midpoints by a second-order curve.
The statistical model for such a situation can be expressed as
yijk = �jk + �jkuijk + �jLijk + �jQijk + �ijk (E-1) where
yijk = ith observed ln(emission) for vehicle j and phase k, uijk = within-phase mileage deviation (standardized, if desired [as described above], to
take on values of -3, -1, +1, and +3), Lijk = -1 for phase 1 observations,
= 0 for phase 2 observations,= +1 for phase 3 observations,
Qijk = -1/3 for phase 1 observations, = +2/3 for phase 2 observations,= -1/3 for phase 3 observations,
�ijk = random error for ith observation for phase k and vehicle j, and
E-1

Revision No.: 3 Date: September 2003
�jk, �jk, �j, and �j are parameters to be estimated.
With the model terms defined in this way, the resulting estimates, indicated by a ^, from a leastsquares regression on the vehicle j data are as follows:
α� = Y = average ln(emissions) for phase k and vehicle j, (E-2) jk jk
4
∑u yijk ijk
β� = i=1 = within-phase deterioration factor for vehicle j, (E-3) jk 4 phase k(expressed in thousand-mile [K] units, 2u∑ ijk where 6K is the number of miles between the
i=1 first and last tests within a phase),
λ� j = 05. (Yj 3 − Yj1) = linear component of long-term deterioration factor (E-4) (expressed in phase units), and
∆� j = Y j2 −Y j1 +Y j3
= quadratic component of long-term deterioration factor 2 (expressed in phase units). (E-5)
Now assume that the phase 2 measurements are for the lubricant FM rather than for baseline. Also assume that the long-term deterioration for baseline measurements is linear. This latter assumption is necessary if the effect of the FM for a given vehicle is to be defined as the “average FM emissions for phase 2 minus the baseline emissions that are predicted for phase 2,” since we cannot isolate the effect of the FM from the quadratic component of the long-term baseline deterioration factor. For these assumptions, the model of Equation (E-1) still applies, but now �j represents the effect of the FM and its estimate is given by Equation (E-5).
For the given design and the above model, fitting the model of Equation (E-1) to the data for a single vehicle will result in a variance for the estimated FM effect, ∆� j
, as
[ �Var ∆ =] 3s2 / 8 (E-6)j j
where s2 j is the residual variance from the multiple regression performed on the vehicle j data.
(If the model is accurate, then s2 j
is an estimate of the measurement error variance of the emissions.) The degrees of freedom associated with this variance is 4. The model of Equation (E-1) can also be fit using data from all tested vehicles; in that case, the variance of the estimated FM effect for vehicle j is
E-2

Revision No.: 3 Date: September 2003
Var ∆ =] s2 / 8[ � j 3 P (E-7)
where sP 2 is the (pooled) residual variance from the multiple regression performed on the m
vehicles in the fleet. The degrees of freedom associated with Equation (E-7) is 4m.
Standard multiple regression software can therefore be used to produce both an estimate of the desired FM effect and of its standard error. Hence, confidence interval estimates for �j (or hypothesis tests) are straightforward. The primary single-vehicle hypothesis of interest is the null hypothesis, H0:�j = 0, versus the alternative hypothesis, HA:�j<0.
This is tested by computing a t statistic, on the estimated effect, �j,
∆� j= (E-8)
and comparing the result to tC, the 5th percentage point of a t distribution with 4 or 4m degrees of freedom. The null hypothesis, H0, is rejected if t < tC.
To achieve the desired ETV confidence level (95%) and level of statistical power (90% at the applicant’s anticipated effect level) for testing this hypothesis, one must ensure that the variance in Equations (E-6) or (E-7) is sufficiently small. The power of the test can be determined as follows:
• First determine the degrees of freedom and critical value, tC, of the test, as defined above (e.g., select the 95th percentage point from a table of percentage points of the t distribution).
• Based on prior data, assume a value for the true underlying measurement error variance; denote this quantity as �2.
• Then compute a noncentrality parameter as
δ (E-9)
where � is the anticipated effect (in ln-scale units, or relative difference). (Given the formulation of the hypothesis test, � should be negative.)
t Var j( � )∆
D = σ 2 3 8( / )
E-3

Revision No.: 3 Date: September 2003
• The power, the probability of rejecting the null hypothesis when a true effect is equal to �, is then determined as
Pr[ ( ) < tC ] (E-10)T D
where T(D) denotes a random variable following a noncentral t distribution with noncentrality parameter D and 4 or 4m degrees of freedom. (Standard statistical software packages such as S-Plus or SAS have built-in functions for calculating such percentage points from noncentral t distributions.)
E-4

Revision No.: 3 Date: September 2003
APPENDIX F: SENSITIVITY OF NUMBER OF TESTS CALCULATION TO MEASUREMENT VARIABILITY
Table F-1 presents the results of a sensitivity analysis of the calculation of the required number of tests in the particular cases of high (85%) and low (10% and 5%) reductions in emissions. The number of tests reported in the final column is the number required to have a 90% probability of detecting the emissions reduction with 95% confidence. Equation B-3 in Appendix B was used to compute the required number of tests. As in these sections, all calculations utilize the normal distribution under the assumption that the test measurement error is known and constant.
Within Table F-1, the variability of the baseline engine measurement ranges from 2 to 30%, and the controlled engine measurement variability from 10 to 30%. All of the percentage numbers in the table are referenced to a baseline engine emission. To convert the percentages to absolute emission rates, they must be multiplied by a baseline engine emission rate, and at 30% variability the standard deviations are twice the emission rates in g/bhp-hr. The emissions and standard deviations in Table F-1 have all been calculated for a baseline engine emitting PM at the 1990 certification level of 0.6 g/bhp-hr. For example, from the first row, an 85% reduction means an absolute PM emission of 0.09 g/bhp-hr. A 10% controlled engine measurement variability means the standard deviation for that measurement is 0.06 bhp-hr. For the baseline engine, the variability is 2%, so the baseline engine standard deviation is 0.012 bhp-hr. The same approach can be used to make a similar table for any other emission rate by multiplying the percentages by the desired baseline emission rate.
While the number of required tests increases as the test variability increases, Table F-1 shows that the increase is modest at high emissions reduction levels. While higher variability is expected at higher levels of control because the absolute emissions concentrations are low, the large reduction in emissions is easily detected.
On the other hand, lower variability is expected for low emissions reductions, but the smaller changes are harder to detect and more tests are required. Therefore even modest variability levels (relative to those in the top block of Table F-1) lead to very large numbers of tests.
As was discussed in Section 5.1.2, calculation of the confidence intervals on the mean emissions reduction will be based on population statistics and will utilize the t-distribution. Thus, the number of tests calculated using Equation B-3 (population statistics) may be fewer than will be required by the data itself based on sample statistics. As mentioned in Appendix B, an approximate calculation can be made for sample variability utilizing the Student’s t-distribution rather than the normal (z-distribution) in Equation B-3. This use of Equation B-3 is not strictly valid, but may be useful for low emission reduction and/or high variability test designs to make a better estimate of the number of tests required.
F-1

Revision No.: 3 Date: September 2003
Table F-1. Sensitivity of Number of Tests to Measurement Variability
Exp
ecte
d em
issi
ons
redu
ctio
n, %
Con
trol
led
engi
ne e
mis
sion
s, g
/bhp
-hr,
rela
tive
to a
bas
elin
e en
gine
at t
he 1
990
PM c
erti
fica
tion
em
issi
on li
mit
Con
trol
led
engi
ne v
aria
bilit
y, %
of
base
line
engi
ne
Con
trol
led
engi
ne s
tand
ard
devi
atio
n,g/
bhp-
hr f
or b
asel
ine
emis
sion
of
0.6
g/bh
p-hr
Bas
elin
e en
gine
var
iabi
lity,
%, w
ith th
e19
90 c
ertif
icat
ion
limit
as b
asel
ine
Bas
elin
e en
gine
sta
ndar
d de
viat
ion,
g/bh
p-hr
, for
1990
em
issi
on li
mit
base
line
emis
sion
of
0.6
g/bh
p-hr
Num
bera
of te
sts
to a
chie
ve 9
0%pr
obab
ility
of
dete
ctin
g re
duct
ion
with
95%
con
fide
nce
85 0.09 10 0.06 2 0.012 1 85 0.09 15 0.09 2 0.012 1 85 0.09 20 0.12 2 0.012 1 85 0.09 30 0.18 2 0.012 1 85 0.09 10 0.06 10 0.060 1 85 0.09 15 0.09 10 0.060 1 85 0.09 20 0.12 10 0.060 1 85 0.09 30 0.18 10 0.060 1 85 0.09 10 0.06 30 0.150 2 85 0.09 15 0.09 30 0.150 2 85 0.09 20 0.12 30 0.150 2 85 0.09 30 0.18 30 0.150 2
10 0.54 2 0.012 2 0.012 1 10 0.54 4 0.024 4 0.024 3 10 0.54 6 0.036 6 0.036 6 10 0.54 8 0.048 8 0.048 10 10 0.54 10 0.06 10 0.060 16
5 0.57 2 0.012 2 0.012 3 5 0.57 4 0.024 4 0.024 11 5 0.57 6 0.036 6 0.036 24 5 0.57 8 0.048 8 0.048 42 5 0.57 10 0.06 10 0.060 66
a For ETV, the minimum number of tests is three.
F-2