Embed Size (px)
Citation preview

Copyright © 2017 The Nielsen Company. Confidential and proprietary. Prepared by Nielsen Vietnam – April 2018
Copyright © 2017 The Nielsen Company. Confidential and proprietary.
3 Cop
yri
gh
t ©
20
17
Th
e N
iels
en
Com
pa
ny.
Co
nfid
en
tia
l a
nd
pro
pri
eta
ry.

4 Cop
yri
gh
t ©
20
17
Th
e N
iels
en
Com
pa
ny.
Co
nfid
en
tia
l a
nd
pro
pri
eta
ry.
Total Vietnam - Value Contribution by Super category in FMCG
5.8 5.7
6.7 6.5
15.9 15.8
14.0 13.8
16.0 16.3
20.1 19.7
19.0 19.7
2016 2017
Beer
Non-Alc Beverage
Food
Milk Base
Cigarette
Personal Care
Household Care
6%
10%
7%
7%
4%
5%
3%
4%
Total FMCG
Total Vietnam - Value Growth 2017 vs 2016
Source: Nielsen Retail Audit

5 Cop
yri
gh
t ©
20
17
Th
e N
iels
en
Com
pa
ny.
Co
nfid
en
tia
l a
nd
pro
pri
eta
ry.
3.0 3.7 1.5 -3.7
4.5 6.9 6.1
18.5
4.0 1.3 2.7
3.0
0.1
5.0 1.9
2.5
7.0 5.0 4.2
-0.7
4.6
11.9
8.0
21.0
Food Instant Noodles Soy & Oyster
Sauce
Fish Sauce MSG - Bouillon Biscuits Cake Pie Snack
Total Vietnam – Growth 2017 vs 2016
Value contribution to Food
29.7 3.5 11.8 18.9 12.2 8.9 14.9
Regular Categories
Impulse Categories
Volume Change Price Change Nominal Value Growth
Source: Nielsen Retail Audit

6 Cop
yri
gh
t ©
20
17
Th
e N
iels
en
Com
pa
ny.
Co
nfid
en
tia
l a
nd
pro
pri
eta
ry.

7 Cop
yri
gh
t ©
20
17
Th
e N
iels
en
Com
pa
ny.
Co
nfid
en
tia
l a
nd
pro
pri
eta
ry.
Manufacturers are willing to push new products, but less than 15% of them are sizeable
2.3 4.1
-1.8
4.4 9.0
6.2
17.5
2.8 0.1
1.1
0.3
2.9
1.8
3.5
5.0 4.2
-0.7
4.6
11.9
8.0
21.0
Instant Noodles Soy & Oyster
Sauce
Fish Sauce MSG - Bouillon Biscuits Cake Pie Snack
Value Growth contribution by Existing & New launch
Existing 2016
New launch 2017
REGULAR IMPULSE
Source: Nielsen Retail Audit | New launch is defined at variant level
7%
127 #No of New launch
% New launch
contribute 80% sales
19%
16
6%
172
6%
35
13%
981
13%
173
8%
675

8 Cop
yri
gh
t ©
20
17
Th
e N
iels
en
Com
pa
ny.
Co
nfid
en
tia
l a
nd
pro
pri
eta
ry.
New Value/Proposition Sizeable Need Distribution Effort
Source: Breakthrough Innovations – Winning with innovation in Asia Pacific

9 Cop
yri
gh
t ©
20
17
Th
e N
iels
en
Com
pa
ny.
Co
nfid
en
tia
l a
nd
pro
pri
eta
ry.
GENERAL PROFILE BREAKTHROUGH PROFILE
Kokomi Dai
Instant Noodles
Launch: Aug 2017
Distinctiveness
Chewy & Non-soggy texture Big
size
Relevance
0.8% share after 3 months
GENERAL PROFILE BREAKTHROUGH PROFILE
Chocopie Dark
Cake Pie
Launch: Oct 2017
Distinctiveness
70% more cocoa
Premium price
Relevance
2.5% share after 3 months
With clear differentiator and real consumer needs
10 Cop
yri
gh
t ©
20
17
Th
e N
iels
en
Com
pa
ny.
Co
nfid
en
tia
l a
nd
pro
pri
eta
ry.
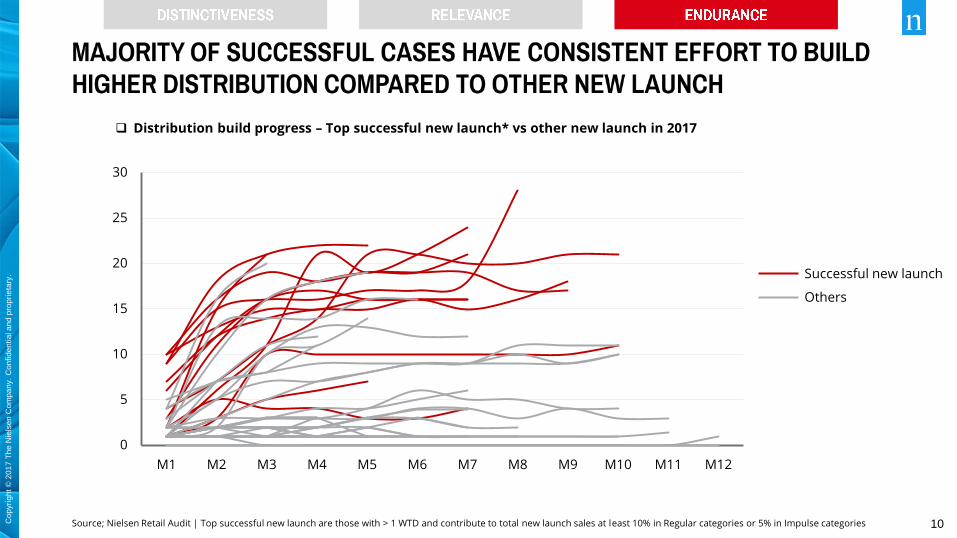
Distribution build progress – Top successful new launch* vs other new launch in 2017
Source; Nielsen Retail Audit | Top successful new launch are those with > 1 WTD and contribute to total new launch sales at least 10% in Regular categories or 5% in Impulse categories
0
5
10
15
20
25
30
M1 M2 M3 M4 M5 M6 M7 M8 M9 M10 M11 M12
Successful new launch
Others

11 Cop
yri
gh
t ©
20
17
Th
e N
iels
en
Com
pa
ny.
Co
nfid
en
tia
l a
nd
pro
pri
eta
ry.

12 Cop
yri
gh
t ©
20
17
Th
e N
iels
en
Com
pa
ny.
Co
nfid
en
tia
l a
nd
pro
pri
eta
ry.
Cop
yri
gh
t ©
20
17
Th
e N
iels
en
Com
pa
ny.
Co
nfid
en
tia
l a
nd
pro
pri
eta
ry.
WHAT CONSUMERS THINK HOW CONSUMERS ACT
37% consider
health as their concern,
ranked Top 2 as top
biggest concerns
80% concern about
long-term health impact of
artificial ingredients
(vs. 75% of global)
83% actively make
dietary choices to prevent
bad health conditions
(vs. 79% of global)
88% read packaging
labels carefully for nutrition
content
(vs. 75% of global)
89% willing to pay
more for foods that
promote health benefits
(vs. 76% of global)
Source; Nielsen Consumer Confidence Report Q3’17 | Global Ingredient and Dining-out Trends Report Aug’16 | Global Survey We are what we eat Jan’15
76% want to know
everything that is going into
their food
(vs. 74% of global)

13 Cop
yri
gh
t ©
20
17
Th
e N
iels
en
Com
pa
ny.
Co
nfid
en
tia
l a
nd
pro
pri
eta
ry.
Cop
yri
gh
t ©
20
17
Th
e N
iels
en
Com
pa
ny.
Co
nfid
en
tia
l a
nd
pro
pri
eta
ry.
Source: Nielsen Global Health Survey Q3’14.
Question: How willing are you to pay premium for foods that contain health attributes? How important are health attributes in influencing you to purchase more of a particular food/food products?
Top 15 attributes Vietnamese consumers consider when choosing healthy products
Calcium fortified
Vitamin fortified
Micronutrient fortified
Minerals fortified
Low / No cholesterol
Made from vegetables/ fruits
High in fiber
All natural
GMO free
Natural flavors
High in protein
No artificial colors
Organic
Ingredients sourced
sustainably/ fair trade
Low / No Fat
30
35
40
45
50
55
60
30 35 40 45 50 55 60
Impact on purchase intention (%)
Wil
lin
g t
o p
ay
pre
miu
m p
rize
fo
r (%
)
• Not differentiable
• Important/Expected attribute
• Differentiable
• Premium attribute
More is more
Less is more
Back to basic
14 Cop
yri
gh
t ©
20
17
Th
e N
iels
en
Com
pa
ny.
Co
nfid
en
tia
l a
nd
pro
pri
eta
ry.
Cop
yri
gh
t ©
20
17
Th
e N
iels
en
Com
pa
ny.
Co
nfid
en
tia
l a
nd
pro
pri
eta
ry.
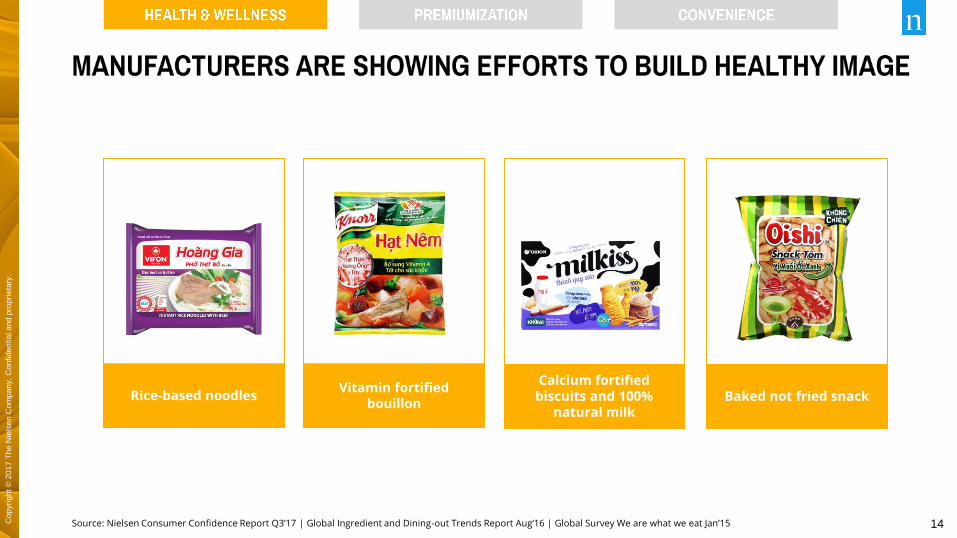
Source: Nielsen Consumer Confidence Report Q3’17 | Global Ingredient and Dining-out Trends Report Aug’16 | Global Survey We are what we eat Jan’15
Rice-based noodles Vitamin fortified
bouillon
Calcium fortified biscuits and 100%
natural milk Baked not fried snack

15 Cop
yri
gh
t ©
20
17
Th
e N
iels
en
Com
pa
ny.
Co
nfid
en
tia
l a
nd
pro
pri
eta
ry.
Cop
yri
gh
t ©
20
17
Th
e N
iels
en
Com
pa
ny.
Co
nfid
en
tia
l a
nd
pro
pri
eta
ry.
57%
63% 58%
60%
I trust health claims on food
packages
Health claims are just a way for
manufacturers to charge more
I feel more positively about
companies that are transparent
about how products were made
Global Vietnam
Source; Global Ingredient and Dining-out Trends Report Aug’16 | Global Survey We are what we eat Jan’15
73%
83%

16 Cop
yri
gh
t ©
20
17
Th
e N
iels
en
Com
pa
ny.
Co
nfid
en
tia
l a
nd
pro
pri
eta
ry.
Cop
yri
gh
t ©
20
17
Th
e N
iels
en
Com
pa
ny.
Co
nfid
en
tia
l a
nd
pro
pri
eta
ry.
Source; Nielsen Health Eating Survey, Ingredion Clean / Simple Label Report & Nielsen BASES
Clean + Concise + Traceable = Consumer Conviction
From CLEAN & CONCISE LABEL To TRACEABLE SOURCE
74% look for products
with simple & recognizable
list of ingredients
(vs. 64% of global)
Consumer Attraction Index
vs.
No/Untraceable claim
100 125
Traceable claim
Clean label Simple ingredients Trusted claim QRCode to trace
origin

17 Cop
yri
gh
t ©
20
17
Th
e N
iels
en
Com
pa
ny.
Co
nfid
en
tia
l a
nd
pro
pri
eta
ry.
Cop
yri
gh
t ©
20
17
Th
e N
iels
en
Com
pa
ny.
Co
nfid
en
tia
l a
nd
pro
pri
eta
ry.
Source; Nielsen Retail Audit | Price tier based on API: Economy (API<80), Mass (80<API<100), Mainstream (100<API<120), Premium (API>120)
11.8
30.7 23.0 22.0
32.2 31.8
4.4 2.0
19.8 18.4 12.0 12.9 12.4 12.4
53.9
31.2
2.4 2.6
0.8 1.0 47.5 49.6
23.8 25.2 36.6 33.5
49.8 48.8
1.8 1.9
29.4 27.1 0.9 0.9
39.8 39.6
19.7 18.1
34.9 35.4 13.0 15.7
32.5 36.2 45.2 48.3
66.1 66.3
8.3 8.8
36.7 38.3
16.5 18.2 24.8 23.0
2016 2017 2016 2017 2016 2017 2016 2017 2016 2017 2016 2017 2016 2017
Instant Noodles Soy & Oyster Sauce Fish Sauce MSG - Bouillon Biscuits Cake Pie Snack
Economy Mass Mainstream Premium
Value contribution by price tier

18 Cop
yri
gh
t ©
20
17
Th
e N
iels
en
Com
pa
ny.
Co
nfid
en
tia
l a
nd
pro
pri
eta
ry.
Cop
yri
gh
t ©
20
17
Th
e N
iels
en
Com
pa
ny.
Co
nfid
en
tia
l a
nd
pro
pri
eta
ry.
Volume % Impact when SKU’s price change more than 5%
Source; Nielsen Retail Audit
Depending on one certain stage of the category, price adjustments have to be taken with caution
-40
26
-1
-17 -19 -23
-7
14
-9
-55
-35
-12
-38
21
1
0 -3
5 7 6 14
-80
-60
-40
-20
0
20
40
Instant Noodles Soy & Oyster Sauce Fish Sauce MSG - Bouillon Biscuits Cake Pie Snack
Price increase more than 5% Price decrease more than 5% No change in price
Price conscious
Premium thirst
New value seeker
New value seeker
New value seeker
New value seeker
Price conscious
*
* *
* Low base: Less than 1% share
PIE Share FY16 Share FY17 Contribution
to decline
Pie And Sponge Cake Thanh Hai Choco Pan Banh Mem Phu Socola Box 350 1X350 GM
10.4 0.0 -10
Pie And Sponge Cake An Pha Sweet Pandan Flavour Khay 210 1X210
GM 6.4 2.4 -5
Pie And Sponge Cake Orion Custas Milk Cream Box 184 1X184 GM 5.7 0.4 -5
Pie And Sponge Cake Nhat Viet Solote BBL Cuon Kem Vi Com Khay
270 1X270 GM 5.7 2.0 -4
Pie And Sponge Cake BK Hung Hanh Sapion Custard Cake Khay 225
1X225 GM 5.0 1.1 -4
Pie And Sponge Cake Bao Hung Custard (B.H) Custard Cake Khay 165
1X165 GM 3.5 1.1 -3
Pie And Sponge Cake G&G Sopitel Strawberry Cream Roll Khay 240
1X240 GM 3.0 0.1 -3
Pie And Sponge Cake BK Hung Hanh Sapion Strawberry Custard Cake
Khay 225 1X225 GM 2.7 3.6 0
BISC Share FY16 Share FY17 Contribution
to decline
Biscuits URC Tivoli Choco Coat Wafer Fill W Vani Soft Pack 369.6
1X369.6 GM 2.6 2.0 -1
Biscuits Tan Tien Phat Zone Banh Quy Kem Sau Rieng Soft Pack 8
1X8 GM 18.2 1.2 -17
MSG Share FY16 Share FY17 Contribution
to decline
Nestle Maggi Bouillon + Meal Maker Bouillon Granules Xuong Ham 3
Ngot Pork Bag 450 37.0 28.5 -19
Ha Anh Hoang Phu Cuong A Seasoning Powder (Bot Canh) Seasoning
Powder (Bot Canh) Bot Canh Shrimp & Chicken Bag 180 22.4 6.6 -18
Fish Sauce Share FY16 Share FY17 Contribution
to decline
Uniben 3 Mien (U.N) Regular PLBT 500 34.5 25.4 -23
Duc Vien Duc Tin (D.V) Regular PLBT 5000 3.1 5.1 -1
Decrease Increase
SOYSAUC Share FY16 Share FY17 Contribution
to growth
Oyster Nestle Maggi Regular PLBT 1X350 GM 22.8 21.2 4
Oyster Nestle Maggi Regular PLBT 1X820 GM 20.4 19.4 4
Soy Nuoc Cham Nam Duong Hang Viet Regular PLBT 1X495 ML 19.4 31.1 20
MSG Share FY16 Share FY17 Contribution
to decline
Unilever Knorr Bouillon + Meal Maker Bouillon Granules Shinbones
Tenderloin & Medulla Bag 400 44.1 49.6 -3
Uniben 3 Mien Bouillon + Meal Maker Bouillon Granules Thit & Xuong
Bag 400 14.1 16.5 0
Unilever Knorr Bouillon + Meal Maker Bouillon Granules Shinbones
Tenderloin & Medulla Bag 55 12.9 11.6 -3
Hifaco Jsc Awana Seasoning Powder (Bot Canh) Seasoning Powder
(Bot Canh) Bot Canh Shrimp Bag 200 9.7 7.3 -4
Saigon Ve Wong A-One Seasoning Powder (Bot Canh) Seasoning
Powder (Bot Canh) Bot Canh Iod Bag 200 1.8 0.3 -2
A Au A Au (A.A) Seasoning Powder (Bot Canh) Seasoning Powder (Bot
Canh) Bot Canh Chicken Bag 185 1.7 1.5 -1
Nguyen Binh Queen Msg Msg Msg Regular Bag 1000 1.5 0.5 -1
Saigon Ve Wong A-One Bouillon + Meal Maker Bouillon Granules Nuoc
Ham Xuong Bag 400 1.4 0.0 -1
BISC Share FY16 Share FY17 Contribution
to decline
Biscuits Cty 22 Huong Thao (Cty 22) Regular Soft Pack 235 1X235 GM 4.4 4.5 -1
Biscuits Mondelez Kinh Do Cosy Marie Regular Box 200 1X200 GM 3.3 3.8 0
Biscuits Tan Hoang Gia France (T.H.G) Butter France Soft Pack 400
1X400 GM 3.3 0.0 -3
Biscuits Mondelez Kinh Do Cosy Marie Regular Soft Pack 64 1X64 GM 2.0 0.5 -2
Biscuits Thien Hong Phat Thien Hong Phat Banh Quy Gac A+ Soft
Pack 180 1X180 GM 1.7 0.9 -1
Biscuits Kim Thien Phat Many Biscuits Soft Pack 320 1X320 GM 1.5 1.3 0
Biscuits Hoang Chien Thang HCT Banh Vong Vung Soft Pack 200
1X200 GM 1.4 1.1 0
Biscuits Bibica Cindy Assorted Biscuits Box 330 1X330 GM 1.3 1.3 0
Biscuits Thanh Do Dai Phat Loc (T.Do) Biscuits Soft Pack 180 1X180
GM 1.1 0.9 0
Biscuits URC Cream O Choco Sand.Cook W.Choco Soft Pack 54 1X54
GM 1.1 1.9 0
Biscuits HaiHaCo Soheart Banh Crack Kem Dua Bo Soft Pack 275
1X275 GM 1.0 0.4 -1
Biscuits Mondelez Kinh Do LU Petit Lu_Veritable Tin 600 1X600 GM 1.0 1.3 0
Biscuits Viet Long Dai Phat Loc (V.L) Banh Quy Soft Pack 180 1X180
GM 1.0 0.9 0
Biscuits Hoang Chien Thang New Star Banh Vong Vung Soft Pack 200
1X200 GM 1.0 0.4 -1
Biscuits Tan Hoang Gia France (T.H.G) Butter France Soft Pack 250
1X250 GM 1.0 3.0 1
Biscuits Dai Thang Dabico Wafer Choco Box 270 1X270 GM 1.0 0.2 -1
Biscuits Kelsen Copenhagen Danish Butter Cookies Tin 454 1X454 GM 0.9 0.3 -1
CAKEPIE Share FY16 Share FY17 Contribution
to decline
Pie And Sponge Cake Mondelez Kinh Do Solite Pandan Creamy Roll
Cake Khay 180 1X180 GM 25.9 30.0 -3
Pie And Sponge Cake Hoa Binh Confec Silate Pandan Roll Cake Khay
220 1X220 GM 4.3 0.3 -4
Pie And Sponge Cake BK Huu Nghi Huu Nghi Custard Cake Box 300
1X300 GM 4.1 3.6 -1
Pie And Sponge Cake Huong Giang Custard (H.G) Custard Cake Khay
210 1X210 GM 2.7 0.6 -2
Pie And Sponge Cake Hiep Thanh Loi Huro Custard Cake Khay 380
1X380 GM 2.7 0.2 -3
Pie And Sponge Cake Bibica Hura Deli BBL Kem Com Box 336 1X336
GM 2.4 0.3 -2
Pie And Sponge Cake Huong Giang Sogold Custard Cake Khay 320
1X320 GM 2.4 0.1 -2
Pie And Sponge Cake Biscafun Confec Nice (Biscafun) Chocolate Kem
Sau Rieng Soft Pack 216 1X234 GM 2.0 4.4 1
Pie And Sponge Cake Bibica Hura Strawberry Flavour Layer Cake
Khay 180 1X180 GM 1.9 0.8 -1
Pie And Sponge Cake Bibica Hura BBL Kem Com Box 300 1X300 GM 1.7 5.5 2
Pie And Sponge Cake BK Huu Nghi Salsa Sping Rice Fla Mini Roll
Cake Khay 180 1X180 GM 1.7 1.4 -1
Pie And Sponge Cake BK Huu Nghi Huu Nghi Custard Cake Khay 200
1X200 GM 1.7 0.2 -2
NOODLE Share FY16 Share FY17 Contribution
to decline
TP Thai Minh Mihamex Mi Shrimp Mi Soft Pack 1X70 GM 16.2 3.3 -14
Uniben Reeva Mi Beef Bo Ham Cai Chua Soft Pack 1X85 GM 15.2 17.7 -4
Masan Chin Su Mi Fish Xot Ca Hoi Chua Cay Soft Pack 1X75 GM 14.8 0.1 -15
Kinh Do An Hao Mi Chicken Ga La Giang Soft Pack 1X62 GM 5.9 0.1 -6
Uniben Reeva Mi Vegetable Lau Nam Chua Cay Soft Pack 1X85 GM 4.0 25.6 11
Masan Omachi Mi Beef Xot Spaghetti Xot Bo Bam Soft Pack 30X91
GM 3.3 4.4 -1
Afotech Cung Dinh Mi Shrimp Lau Tom Chua Cay Cup 1X80 GM 2.5 3.8 0
Masan Omachi Mi Shrimp Lau Tom Chua Cay Soft Pack 30X79 GM 2.4 2.7 -1
Uniben Reeva Mi Pork Suon Non Cai Chua Soft Pack 1X85 GM 2.3 1.2 -2
Ngoc Ha Tadico Mi Shrimp Mi Soft Pack 1X60 GM 2.1 1.6 -1
*

19 Cop
yri
gh
t ©
20
17
Th
e N
iels
en
Com
pa
ny.
Co
nfid
en
tia
l a
nd
pro
pri
eta
ry.
Cop
yri
gh
t ©
20
17
Th
e N
iels
en
Com
pa
ny.
Co
nfid
en
tia
l a
nd
pro
pri
eta
ry.
API range of premium products
Source; Nielsen Retail Audit | Most successful: Highest share premium variant’s API | Average: Weighted average API of premium variant based on sales value | Most common: Mode of all premium variants’ API
For some categories, there is mismatch between what manufacturers offer and what consumers accept
120
140
160
180
200
220
240
260
Instant
Noodles
Soy & Oyster
Sauce
Fish Sauce MSG -
Bouillon
Biscuits Cake Pie Snack
Most successful Average Most common Optimal range
• Most successful/
Average API: Indicate at
what API level
consumers have the
most support
• Most common API:
Indicate at what API level
manufacturers are
mostly pushing into
20 Cop
yri
gh
t ©
20
17
Th
e N
iels
en
Com
pa
ny.
Co
nfid
en
tia
l a
nd
pro
pri
eta
ry.
Cop
yri
gh
t ©
20
17
Th
e N
iels
en
Com
pa
ny.
Co
nfid
en
tia
l a
nd
pro
pri
eta
ry.
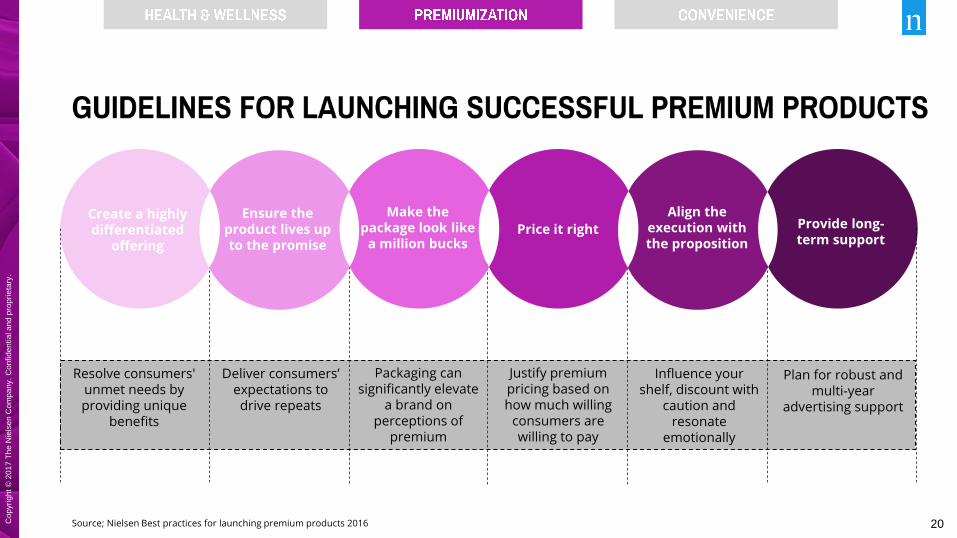
Resolve consumers' unmet needs by providing unique
benefits
Source; Nielsen Best practices for launching premium products 2016
Create a highly differentiated
offering
Ensure the product lives up to the promise
Make the package look like
a million bucks Price it right
Align the execution with the proposition
Provide long-term support
Deliver consumers’ expectations to drive repeats
Packaging can significantly elevate
a brand on perceptions of
premium
Justify premium pricing based on how much willing
consumers are willing to pay
Influence your shelf, discount with
caution and resonate
emotionally
Plan for robust and multi-year
advertising support

21 Cop
yri
gh
t ©
20
17
Th
e N
iels
en
Com
pa
ny.
Co
nfid
en
tia
l a
nd
pro
pri
eta
ry.
Cop
yri
gh
t ©
20
17
Th
e N
iels
en
Com
pa
ny.
Co
nfid
en
tia
l a
nd
pro
pri
eta
ry.
Source; United Nations, WUP, 2014 for population data. EIU for household & wage data.
Vietnam population dynamics 2015 – 2015
34% 40%
66% 60%
2015 2025
Urban Rural
% population by urbanity
% urban population by city size in people
49% 40%
3% 10%
6%
19% 26%
23% 23%
2015 2025
<300K 300k-500k 500k-1M
1M-5M 5M-10M 10M+
4.49 4.31
4.13 3.96 3.81 3.76 3.70 3.60 3.60 3.50 3.50
0
50
100
150
200
250
300
350
400
450
500
0.00
1.00
2.00
3.00
4.00
5.00
20
00
20
01
20
02
20
03
20
04
20
05
20
06
20
07
20
08
20
09
20
10
20
11
20
12
20
13
20
14
20
15
20
16
20
17
20
18
20
19
20
20
20
21
Average HH size (person) Average wages per month (USD)
Household size & Average wages per month

22 Cop
yri
gh
t ©
20
17
Th
e N
iels
en
Com
pa
ny.
Co
nfid
en
tia
l a
nd
pro
pri
eta
ry.
Cop
yri
gh
t ©
20
17
Th
e N
iels
en
Com
pa
ny.
Co
nfid
en
tia
l a
nd
pro
pri
eta
ry.
Number of Chained Convenient store & Minimart (stores)
Source: Retailers’ official website. CVS includes Circle K, B’s Mart, Family Mart, Shop & Go, Mini Stop, 7-eleven. MM includes: VinMart+, Coop Food, SatraFoods, Bach Hoa Xanh, Coop Smile, T-Mart, My Auchan. Nielsen Shopper Trend 2016 - Total Hanoi & Ho Chi Minh (All HM/SM shoppers n=1346)
700 699 711 728 731 745 744 774 783 788 795 818 827 823
1134 1281 1313 1227 1230 1278 1319 1358 1399 1456 1557
1726 1810 1817
0
500
1000
1500
2000
2500
3000
Convenient Store Minimart
Top 3 important attributes for shopping destination
(index)
Easy to find what I
need
Convenient to get to
Low prices
SUPERMARKET
CVS/MM
Efficient checkout Easy to find
what I need
Convenient to get to
7.7 6.6 5.7
9.7 9.0 7.8

23 Cop
yri
gh
t ©
20
17
Th
e N
iels
en
Com
pa
ny.
Co
nfid
en
tia
l a
nd
pro
pri
eta
ry.
Cop
yri
gh
t ©
20
17
Th
e N
iels
en
Com
pa
ny.
Co
nfid
en
tia
l a
nd
pro
pri
eta
ry.
WHAT IS HAPPENING HOW IT INDICATES
1
2
3
URBANIZATION
More and more people living
in Urban and high density
cities
HOUSEHOLD
Increase in single + non-
traditional households (with
more income and less
dependents)
RETAIL
Expansion of CVS/MM and
needs of convenience in
shopping occasions
• Focus on smaller packtype
• Capture demand for convenience, on-the-
go solutions
• Bridge gaps in consumer needs from
existing retail environment via E-commerce
and delivery options
• Create strategies to capture valued single
segment
• Explore premium and luxury opportunities
Source: Nielsen APAC – What’s next start now 2018

24 Cop
yri
gh
t ©
20
17
Th
e N
iels
en
Com
pa
ny.
Co
nfid
en
tia
l a
nd
pro
pri
eta
ry.
Cop
yri
gh
t ©
20
17
Th
e N
iels
en
Com
pa
ny.
Co
nfid
en
tia
l a
nd
pro
pri
eta
ry.
INSTANT NOODLES CUP
4.2
6.7
2016 2017
Value % Share
Value % Growth
69%
PRE-MIXED SOY SAUCE
11.9 12.1
2016 2017
Value % Share
Value % Growth
4%
BISCUITS (<= 150GM)
23.5 27.2
2016 2017
Value % Share
Value % Growth
30%
CAKE PIE (<= 150GM)
9.3 10.4
2016 2017
Value % Share
Value % Growth
21%
FROZEN FOOD/SAUSAGE
Source: Nielsen Retail Audit | Data for Total Vietnam exclude Frozen Food/Sausage is MT only
Value % Growth
9%
Frozen Food
26%
Sausage

25 Cop
yri
gh
t ©
20
17
Th
e N
iels
en
Com
pa
ny.
Co
nfid
en
tia
l a
nd
pro
pri
eta
ry.
26 Cop
yri
gh
t ©
20
17
Th
e N
iels
en
Com
pa
ny.
Co
nfid
en
tia
l a
nd
pro
pri
eta
ry.
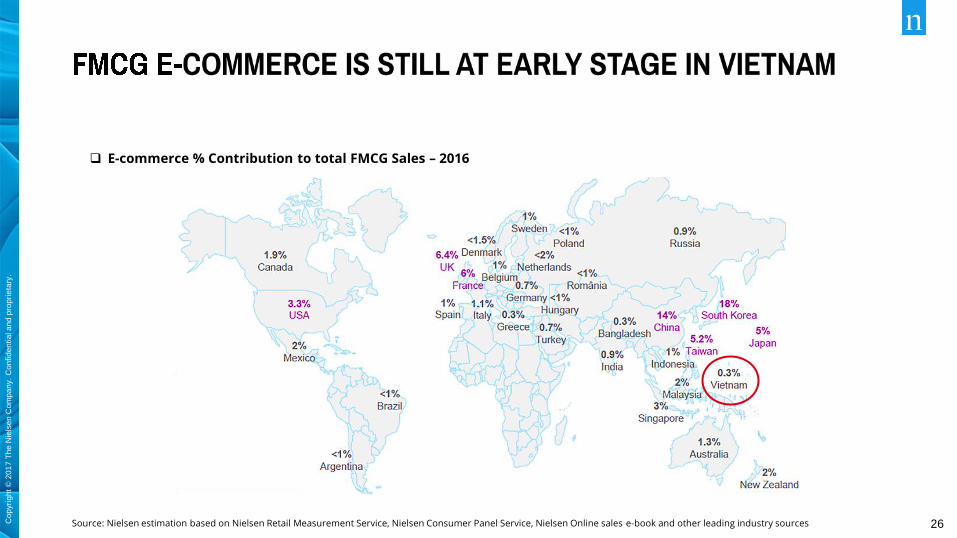
E-commerce % Contribution to total FMCG Sales – 2016
Source: Nielsen estimation based on Nielsen Retail Measurement Service, Nielsen Consumer Panel Service, Nielsen Online sales e-book and other leading industry sources

27 Cop
yri
gh
t ©
20
17
Th
e N
iels
en
Com
pa
ny.
Co
nfid
en
tia
l a
nd
pro
pri
eta
ry.
Vietnam FMCG E-commerce foundational elements
Source: CIA World Factbook; Nielsen: Cross Platform Insights 2016. *as compared to total 30 developed & developing countries – Nielsen global key drivers for Grocery E-commerce 2018
49 52 54 55
2017 2018 2019 2020
Minimum level for significant FMCG E-commerce size*
80
INTERNET PENETRATION
44 50
55 59
2017 2018 2019 2020
Minimum level for significant FMCG E-commerce size*
67
SMART PHONE PENETRATION

28 Cop
yri
gh
t ©
20
17
Th
e N
iels
en
Com
pa
ny.
Co
nfid
en
tia
l a
nd
pro
pri
eta
ry.
Have internet access Are willing to spend
discretionary income
WHO ARE THEY? HOW THEY ACT?
40 Million people in 2025 (x1.7 vs 2017)
99 Billion USD of annual spending in 2025 (x2.0 vs 2017)
48% Total consumer spending in 2025 (x1.3 vs 2017)
99 Normal Internet
User
117 Connected Spenders
Confidence Index
They stay connected with brands
Engage with other viewers on social media while
watching advertising
Appreciate learning about products through
advertising
Expect a relevant and personalized advertising
experience
77%
53%
54%
They review products online before making purchase
Read product
review and
feedbacks
73% Check
promotion
70% Check brand’s
reputation
and quality
Source: Demand Institutes, Nielsen Omni - Shopper Trend 2017
64%

29 Cop
yri
gh
t ©
20
17
Th
e N
iels
en
Com
pa
ny.
Co
nfid
en
tia
l a
nd
pro
pri
eta
ry.
Categories Vietnamese online shopper purchased in L3M
61
49 41 40 38 36 34 31 29 27 24 23
Fashion Cosmetics Personal
care
Books/
Stationary
IT & Mobile Consumer
electronics
Home care
products
Grocery
food
Travel Beverage Baby care
products
Event
tickets
Source: Nielsen Omni - Shopper Trend 2017 - All respondents Total (n=1005)

30 Cop
yri
gh
t ©
20
17
Th
e N
iels
en
Com
pa
ny.
Co
nfid
en
tia
l a
nd
pro
pri
eta
ry.
Actively engage with consumers throughout the
whole buying process via online platform,
especially during information searching and
purchase decision making
Ensure authentic products are sold on
online portals. Crackdown on counterfeit
products.
Invest in innovative and
personalized online
marketing experience for
consumers
FOOD E-COMMERCE
BUILD TRUST
DISRUPT PATH-TO-
PURCHASE
LEVERAGE BRANDING
OPPORTUNITIES
Source: Nielsen global key drivers for Grocery E-commerce 2018
Copyright © 2017 The Nielsen Company. Confidential and proprietary.
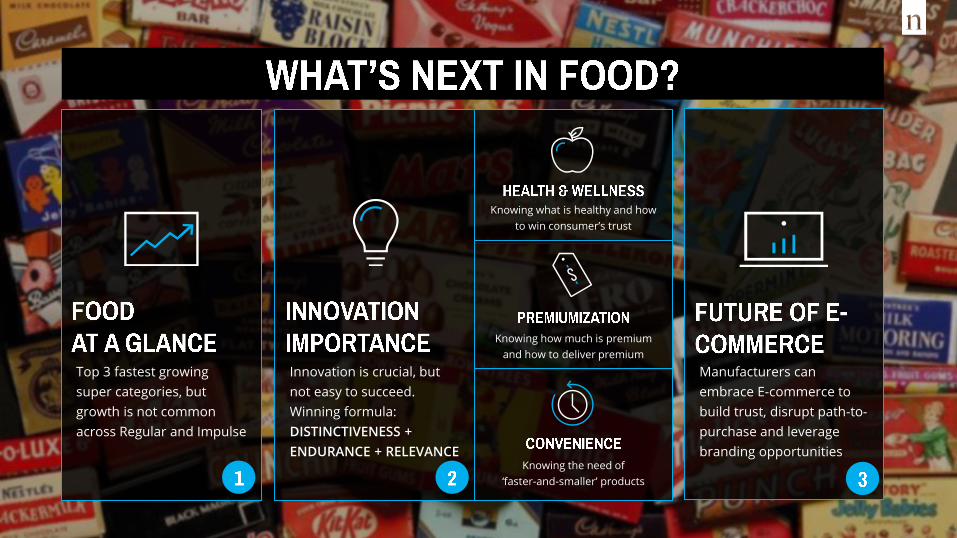
Top 3 fastest growing
super categories, but
growth is not common
across Regular and Impulse
Innovation is crucial, but
not easy to succeed.
Winning formula:
DISTINCTIVENESS +
ENDURANCE + RELEVANCE
Knowing what is healthy and how
to win consumer’s trust
Knowing how much is premium
and how to deliver premium
Knowing the need of
‘faster-and-smaller’ products
Manufacturers can
embrace E-commerce to
build trust, disrupt path-to-
purchase and leverage
branding opportunities

Copyright © 2017 The Nielsen Company. Confidential and proprietary.