Embed Size (px)
Citation preview

Preparation of nitrogen doped zinc oxide nanoparticles
and thin films by colloidal route and low temperature
nitridation process
Arnaud Valour, Francois Chevire, Franck Tessier, Fabien Grasset, Benjamin
Dierre, Tengfei Jiang, Eric Faulques, Laurent Cario, Stephane Jobic
To cite this version:
Arnaud Valour, Francois Chevire, Franck Tessier, Fabien Grasset, Benjamin Dierre, et al..Preparation of nitrogen doped zinc oxide nanoparticles and thin films by colloidal routeand low temperature nitridation process. Solid State Sciences, Elsevier, 2016, 54, pp.30-36.<10.1016/j.solidstatesciences.2015.12.009>. <hal-01245031>
HAL Id: hal-01245031
https://hal.archives-ouvertes.fr/hal-01245031
Submitted on 16 Dec 2015
HAL is a multi-disciplinary open accessarchive for the deposit and dissemination of sci-entific research documents, whether they are pub-lished or not. The documents may come fromteaching and research institutions in France orabroad, or from public or private research centers.
L’archive ouverte pluridisciplinaire HAL, estdestinee au depot et a la diffusion de documentsscientifiques de niveau recherche, publies ou non,emanant des etablissements d’enseignement et derecherche francais ou etrangers, des laboratoirespublics ou prives.


1
Preparation of nitrogen doped zinc oxide nanoparticles and thin films by
colloidal route and low temperature nitridation process
Arnaud Valour a)
, François Cheviré a)
, Franck Tessier a)
, Fabien Grasset b)
, Benjamin Dierre b)
,
Tengfei Jiang c)
, Eric Faulques c)
, Laurent Cario c)
, Stéphane Jobic c)
a) Institut des Sciences Chimiques de Rennes (UMR CNRS 6226), Université de Rennes 1, 263
avenue du Général Leclerc, 35042 Rennes cedex, France
b) Laboratory for Innovative Key Materials and Structures – National Institute of Material Science
(UMI 3629 CNRS/Saint Gobain) – Tsukuba, Japon
c) Institut des Matériaux Jean Rouxel, Université de Nantes, CNRS, 2 rue de la Houssinière,
44322 Nantes cedex 3, France
Abstract:
Nitrogen doped zinc oxide (ZnO) nanoparticles have been synthesized using a colloidal route and
low temperature nitridation process. Based on these results, 200 nm thick transparent ZnO thin
films have been prepared by dip-coating on SiO2 substrate from a ZnO colloidal solution. Zinc
peroxide (ZnO2) thin film was then obtained after the chemical conversion of a ZnO colloidal
thin film by H2O2 solution. Finally, a nitrogen doped ZnO nanocrystalline thin film (ZnO:N) was
obtained by ammonolysis at 250°C. All the films have been characterized by scanning electron
microscopy, X-ray diffraction, X-Ray photoelectron spectroscopy and UV-Visible transmittance
spectroscopy.
Keywords: Nitrogen doped ZnO, thin films, dip-coating, nanoparticles

2
1. Introduction
Zinc oxide (ZnO) is a material of great interest exhibiting pigmental [1], photocatalytic [2],
piezoelectric [3], antibacterial [4], or varistor [5] properties that have already been developed in
many different fields of industry [6]. Still novel applications emerge in various domains but they
often require the preliminary stabilization of a p-type ZnO, which is more difficult to achieve
than that of the unintentionally doped n-type ZnO. In optoelectronics for instance, the high
optical transparency of ZnO thin films coupled with their high electrical conductivity and their
strong room temperature luminescence could indeed open up the door to great improvement of
technologies such as flat panel displays [7], light emitting diodes [8] or lasers [9]. In a previous
study, we have reported the stabilization of p-type nitrogen doped zinc oxide nanoparticles with
metal vacancies up to 15-20% (ZnO:N) obtained through the decomposition of zinc peroxide
(ZnO2) at low temperature under ammonia flow [10]. Moreover, we have recently demonstrated
that the zinc vacancies segregate preferentially at the surface of the ZnO nanoparticles to form a
pseudo core-shell structure built upon a stoichiometric zinc oxide core coated with a few
angstroms thick Zn-free oxo-hydroxide shell [11]. These studies have to be extended for the
realization of p-type ZnO thin films to achieve n-ZnO/p-ZnO:N homojonctions which would lead
to various applications in optoelectronics.
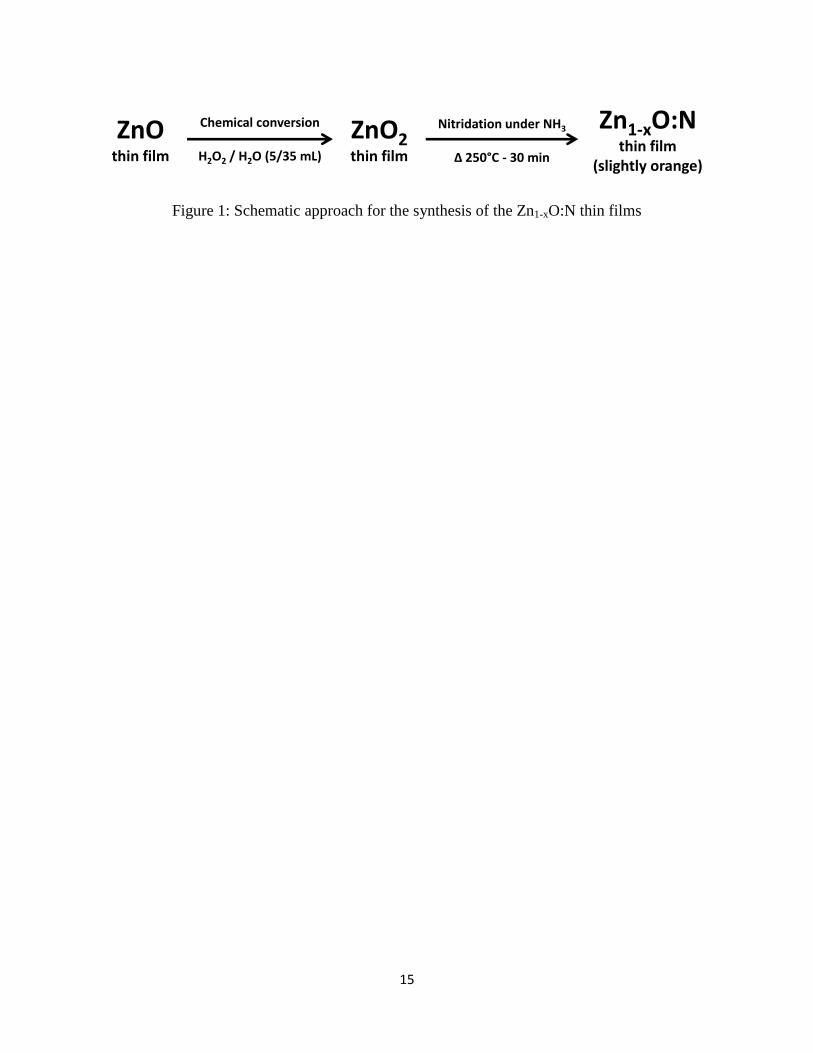
In this work, we report on a simple colloidal approach to form 200 nm thick ZnO:N thin films by
reacting ZnO2 precursors with flowing ammonia at low temperature as illustrated on Figure 1.
We will discuss on the synthesis of the ZnO, ZnO2 and ZnO:N nanoparticles as well as the
formation of the corresponding high quality thin films. Their structural and optical properties
were investigated by means of ultraviolet-visible (UV-Vis) spectroscopy, X-ray diffraction
(XRD), X-ray photoelectron spectroscopy (XPS) and scanning electron microscopy (SEM).

3
2. Experimental section
2.1 Nanoparticles synthesis of ZnO, ZnO2 and ZnO:N
ZnO based nanoparticles and thin films were obtained from ZnO colloidal solution. This solution
was prepared using similar route as published in references 12 and 13. In practice, 4.39 g of
Zn(CH3COO)2,2H2O (Fluka, 99.5%) were dissolved in 40 mL of 1-propanol (Acros, 99.9%).
After distillation of 9 mL of the as-obtained solution in a preheated (125°C) oil bath of a rotary
evaporator, 9 mL of tetramethylammonium hydroxide (TMAOH) in methanol (Alfa Aesar, 25 %
w/w in methanol) were rapidly added in the still hot solution. This addition induced the formation
of a turbid solution which immediately disappeared after a strong agitation, the mixture being
transformed into a clear colloidal suspension. This solution was kept 24 hours under magnetic
stirring before being precipitated with 80 mL of diethyl ether (Carlo Erba, 99.8%). The white
ZnO powders were separated by centrifugation (12 000 rpm during 5 min) and were dried with
acetone to obtain ZnO nanoparticles.
The ZnO powders were then dispersed into H2O2 / H2O mixture (5 / 95 mL) and were heated
under reflux and stirring at 100°C during 6 h to form a yellowish ZnO2 powder. After
centrifugation and drying steps (12 000 rpm / 10 min), 300 mg of the as-prepared products were
treated under ammonia flux (20 L.h-1
) at 250 °C during 30 min to form ZnO:N powders with an
orange / brown color.
2.2 Elaboration of ZnO, ZnO2 and ZnO:N thin films
ZnO thin films were deposited on SiO2 substrate by a dip-coating method at room temperature
with a withdrawing speed around 200 mm/min from a transparent ZnO colloidal solution
obtained by dispersion of the ZnO nanoparticles in absolute ethanol (Prolabo, normapur). The

4
ZnO concentration of the solution was determined to be 0.9 M by inductively coupled plasma
mass spectrometry (ICP-MS). The film was air dried in a chemical fume hood and annealed in air
at 150°C for 15 min. The ZnO thin film was then immersed into a H2O2 (Sigma Aldrich, 30% wt
in H2O) / distilled H2O mixture (5 / 35 mL) at room temperature under stirring for 2 hours to
convert ZnO into ZnO2. Finally, the ZnO2 film was reacted under flowing ammonia (20 L.h-1
) at
250°C for 30 min in order to obtain a slightly orange ZnO:N thin film.
2.3 Characterizations
2.3.1 Powders
XRD powder patterns were recorded by using a PANalytical X’pert Pro diffractometer (Bragg –
Brentano geometry, Cu Kα1,α2 (λ = 1.5418 Å) equipped with a PIXcel 1D detector). Data were
collected in the 5-120° 2θ range with an overall collection time of 2h. Data Collector and High-
Score Plus software were used, respectively, for recording and analyzing the patterns. For each
sample, the average crystallites sizes were estimated from the whole diffraction pattern
(5°<2θ<120°) using FullProf Suite software and based on the Scherrer equation [14]:
𝑡 = 𝜆
𝛽 cos 𝜃 (1)
with t the average crystallite size and β the integral width. Nitrogen and oxygen contents were
determined with a LECO TC-600 Analyzer using the inert gas fusion method in which nitrogen
and oxygen contents were measured by thermal conductivity and infrared analyses, respectively.
Diffuse reflectance (DR) spectra were collected using a Varian Cary 100 Scan spectrometer
equipped with a Varian WinUV software and the integrating sphere Labsphere (DRC-CA-30I).
Experimental data were collected within the 250–800 nm range with a 1 nm step. The band-gap

5
of the materials (Eg) were calculated using the Kubelka–Munk formalism [15]. Thermal stability
of the ZnO2 was determined from thermogravimetric and differential thermal analyses
(TGA/TDA) conducted in air at 2°C/min and performed with a TA instruments SDT 2960. The
overall accuracy of this instrument is expected to be within ± 2◦C. Density measurements on
ZnO:N powders were carried out with a Micromeretics AccuPyc 1330. XPS analyses were
performed on a Kratos Axis NOVA spectrometer. Spectra were collected using Al K
monochromatic radiation (hv = 1486.6 eV) on a ∼ 300×700 μm area at a pass energy of 160 eV.
All spectra were calibrated in energy using C 1s = 284.7 eV as reference.
2.3.2 Thin films
XRD patterns were recorded by grazing incidence X-ray diffraction (GIXRD) in order to limit
the substrate contribution using a Rigaku SMARTLAB apparatus equipped by D/TeX Ultra 250
detector and Cu radiation with - configuration. Data were collected in the 10-60° 2θ range
with a step of 0.02 and a speed of 1°/min. Transmittance UV-Vis spectra were collected using a
Perkin Elmer Lambda 35 UV-Vis spectrometer in the 200-700 nm range with a 1 nm step. The
film surface and cross-section observations (for thickness determination) were conducted using a
JEOL 6301F scanning electron microscope.
3. Results and discussion
Several theoretical studies [16-18] have pointed out that both nitrogen doping and metal
vacancies may stabilize shallow acceptors levels above the valence band in ZnO, thus triggering
the stabilization of a p-type conductivity. As reported in a recent work on the decomposition of
ZnO2 to prepare Zn-deficient ZnO, the nanostructuration of ZnO appears to be essential to control
the metal vacancies in ZnO particles [11]. Starting from a colloidal ZnO solution, we have
6
modified the ZnO2 approach in order to have a better control of the nanostructuration of ZnO:N
nanoparticles and thin films, i.e. a better control of the particle size and the size distribution. It is
interesting to note that preliminary investigations on the reactivity towards ammonia at 300°C of
ZnO nanoparticles issued from the colloidal process was very poor. Slightly brown materials
were obtained due to the insertion of very low amount of nitrogen. This prompts us to take
benefit of the strong reactivity of ZnO2 towards ammonia at low temperature to prepared N:ZnO
films.
3.1 ZnO:N nanoparticles
The XRD pattern of powders (Fig. 2) prepared from colloidal route indicates the formation of
ZnO nanoparticles with the wurtzite structure-type (JCPDS file 01-079-0206). Interestingly, no
acetate derivative zinc hydroxide double salts were observed as impurities at low angle [19].
After H2O2 treatment, the diffraction peaks corresponding to ZnO2 are well indexed in the pyrite
structure (JCPDS file 01-077-2414, a = 4.871 Å), which confirms the conversion of ZnO into
ZnO2. At last, the XRD pattern of the nitrided ZnO:N powder presents similar diffraction peaks to
ZnO powder with a higher crystallization state. Calculations of the average crystallites sizes were
performed on the different samples and are listed in Table 1. ZnO and ZnO2 nanoparticles display
similar average crystallites sizes around 4-5 nm. The growth of the average size of ZnO:N
nanoparticles (up to 45nm) during the low temperature nitridation (250°C) is attributed to the
locally increase of the reaction temperature due to the highly exothermic decomposition of ZnO2.
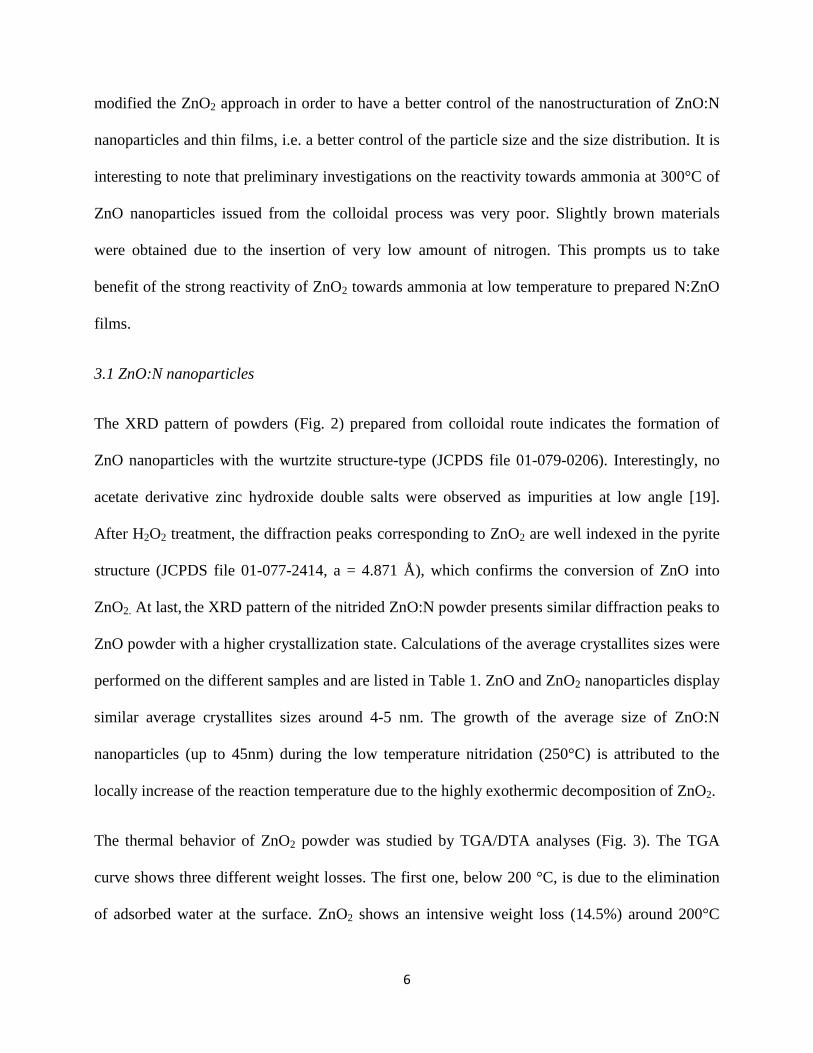
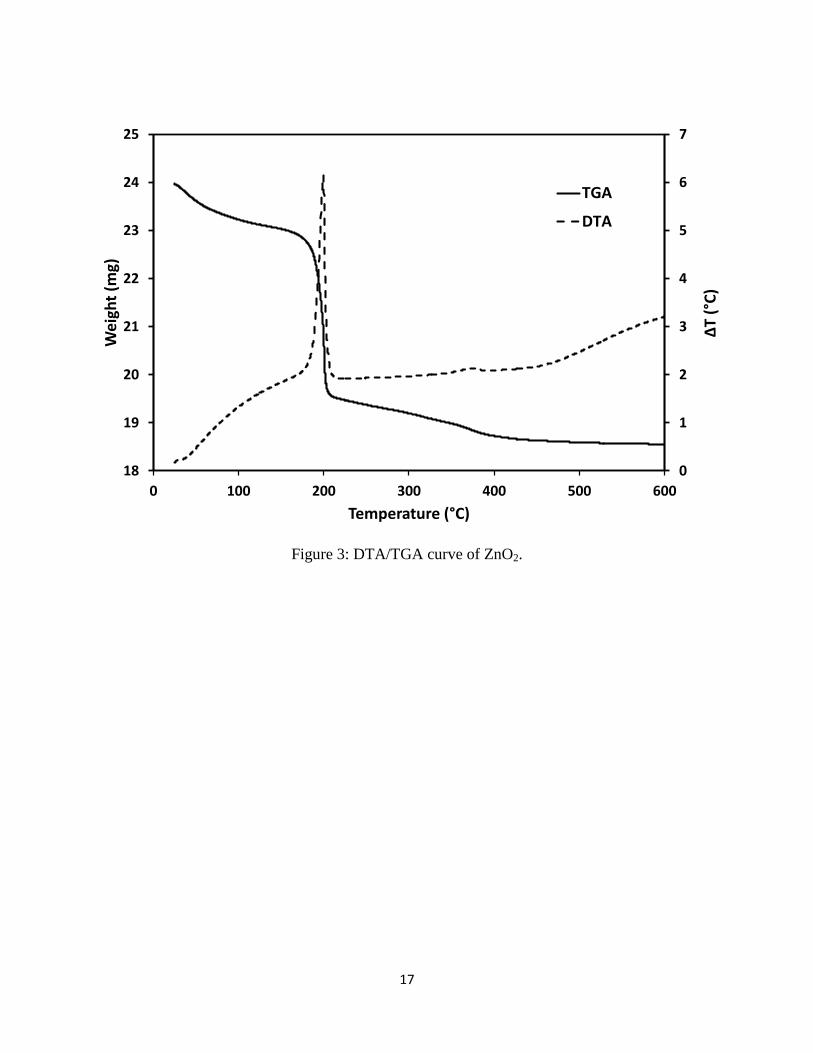
The thermal behavior of ZnO2 powder was studied by TGA/DTA analyses (Fig. 3). The TGA
curve shows three different weight losses. The first one, below 200 °C, is due to the elimination
of adsorbed water at the surface. ZnO2 shows an intensive weight loss (14.5%) around 200°C

7
corresponding to the decomposition of ZnO2 into ZnO with metal vacancies (Zn1-xO). This
phenomenon is well known to be highly exothermic [20,21], as the DTA curve also shows in
Figure 3 with an important exothermic signal at 200°C. The last weight loss (3.9%) from 200°C
to 400°C illustrates the progressive conversion from Zn1-xO to a stoichiometric ZnO with
temperatures identical to those reported in previous works [10, 11]. Indeed, density measurement,
carried out on the ZnO:N powder obtained at 250°C, gives an experimental value of 5.1, that is
lower than the theoretical density of ZnO (d = 5.6).
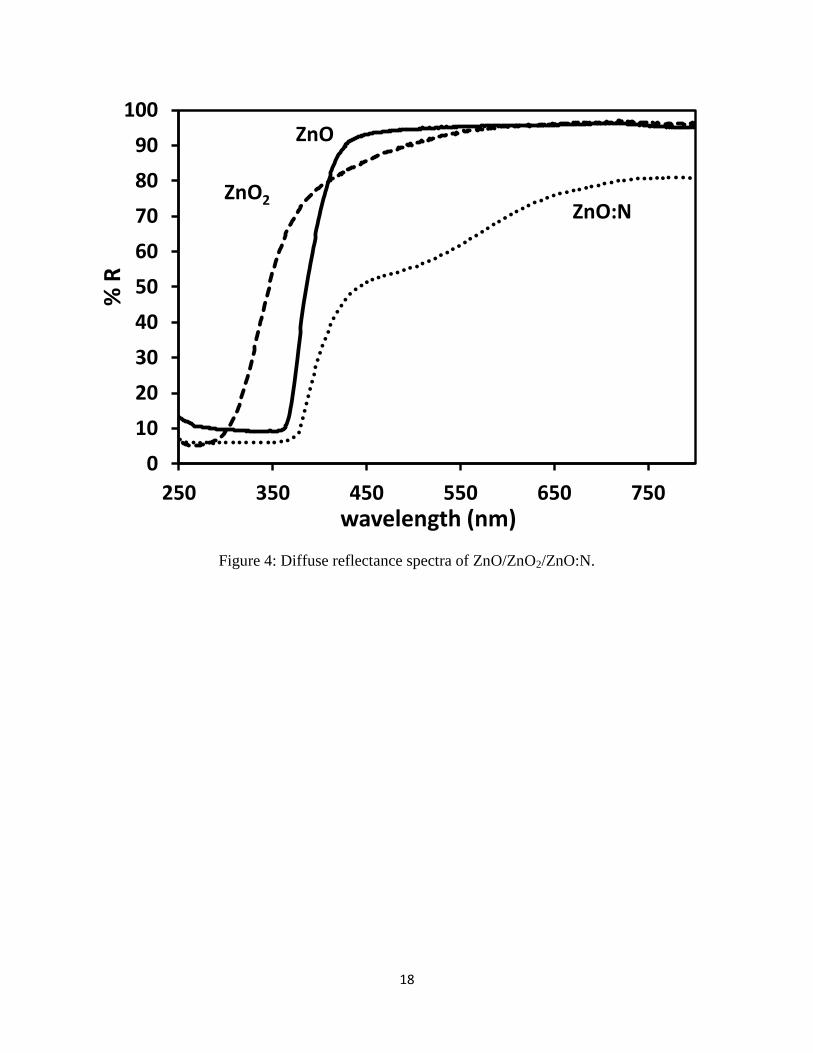
Diffuse reflectance analyses performed on ZnO reveal a typical absorption band around 390 nm
corresponding to the 2p (O) – 4s (Zn) electronic transition (Fig. 4), from which a band-gap value
Eg= 3.24 eV is extracted (Table 1). The conversion of ZnO into ZnO2 goes along with a shift of
the absorption threshold 340 nm (Eg= 3.79 eV). Finally, after the nitridation step, the ZnO:N
spectrum displays two diffuse reflectance bands: one around 400 nm corresponding to the 2p (O)
– 4s (Zn) transition with a band gap of Eg= 3.09 eV and a broad signal between 450-650 nm
attributed to the nitrogen doping. Due to the difference in electronegativity between oxygen and
nitrogen, i.e. 3.5 and 3.0 respectively, nitrogen doping in ZnO may induce the insertion of
localized nitrogen states above 2p (O) states at the top of valence band. Moreover, the slight red
of the absorption threshold from 390 eV in ZnO to 400 eV in ZnO:N may be attributed to
particles growth effect due to heating at 250°C.
Oxygen and nitrogen contents were determined for the ZnO, ZnO2 and ZnO:N nanoparticles.
They are listed in Table 1. ZnO sample presents a high oxygen content compared to the theory
(19.6 wt %) which can be partially due to adsorbed water or acetate molecules at the surface of
the ZnO nanoparticles [22-24]. Such large oxygen content in metal oxides nanoparticles is not
surprising as the nanoscale will strongly affect the stoichiometry of the nanoparticles compared to
8
the corresponding bulk material. For such small particles (~ 5nm), the contribution of the surface
over the “bulk” of the particle is quite large and can lead indeed to large oxygen/metal non
stoichiometry due to passivation/hydroxylation of surface metal sites [11]. As shown in Figure 5,
N1s XPS analysis on the as-prepared ZnO nanoparticles reveals the presence of residual nitrogen
atoms (0.4 wt %) that likely originates from TMAOH used during the synthesis, the N1s peak at
402.9 eV being ascribed to (CH3)4N+ species [25]. After conversion, ZnO2 nanoparticles present
an oxygen content close to the theory (32.8 wt %) and a very low nitrogen content that indicates
the good purity of the materials with elimination of the nitrogen containing impurities. At last, the
oxygen content measured in ZnO:N sample around 21 wt % suggests the presence of zinc
vacancies in the material in good agreement with the DTA/TGA and density analyses as well as
with previously reported works [10,18]. The increase of the nitrogen content in ZnO:N sample at
0.5 wt % confirms the effective insertion of nitrogen in the compound along with the slight
orange/brown coloration and UV-Vis results [23,24]. Moreover, XPS spectrum of the nitrided
sample exhibits a N1s peak at 399.6 eV that could be attributed to NHx species at the surface of
the nanoparticules [26].
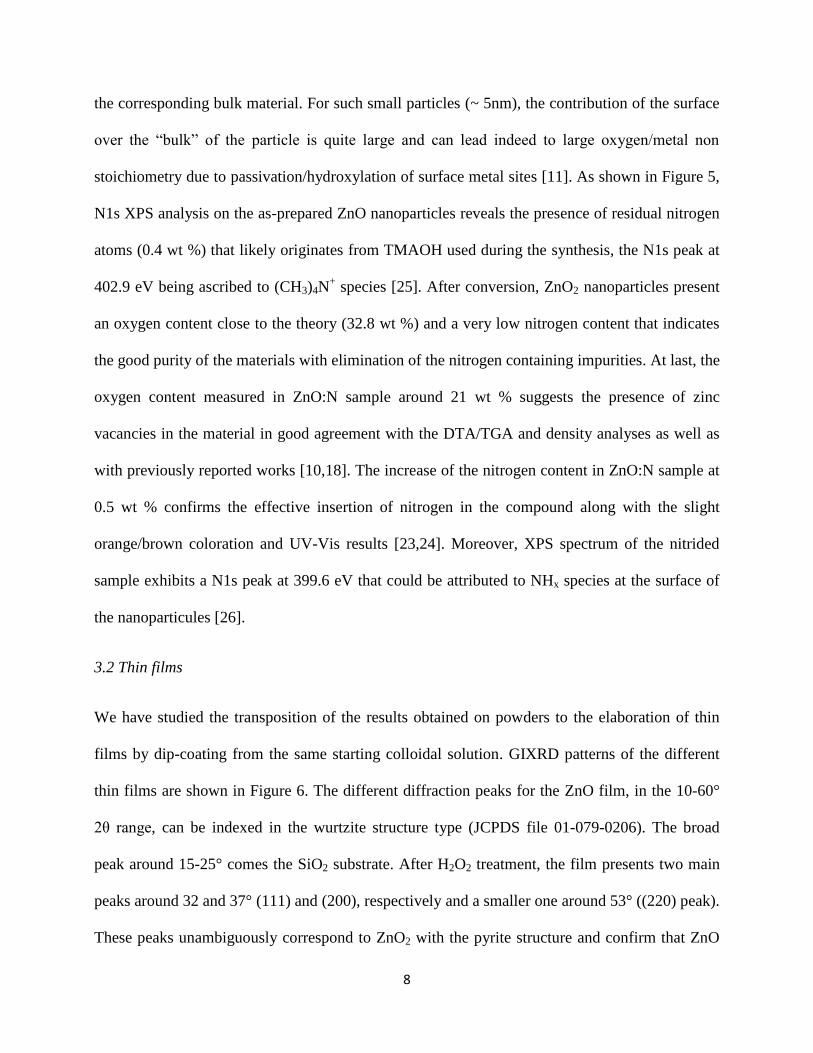
3.2 Thin films
We have studied the transposition of the results obtained on powders to the elaboration of thin
films by dip-coating from the same starting colloidal solution. GIXRD patterns of the different
thin films are shown in Figure 6. The different diffraction peaks for the ZnO film, in the 10-60°
2θ range, can be indexed in the wurtzite structure type (JCPDS file 01-079-0206). The broad
peak around 15-25° comes the SiO2 substrate. After H2O2 treatment, the film presents two main
peaks around 32 and 37° (111) and (200), respectively and a smaller one around 53° ((220) peak).
These peaks unambiguously correspond to ZnO2 with the pyrite structure and confirm that ZnO

9
films were successfully converted into zinc peroxide. These results are also in good agreement
with those obtained for powders (Fig. 2). XRD pattern of the ZnO:N film appears similar to that
of ZnO film with a lower crystallization state, confirming the decomposition of the ZnO2 film
into ZnO:N under ammonolysis conditions. The broad diffraction peaks of the different samples
suggest the nanoscale size of the particles within the thin films. The lower apparent
crystallization of the ZnO:N film compared to the corresponding powder sample comes from
different amounts of ZnO2 precursor used in powders and thin films experiments. While both
powder and thin film samples have been reacted under ammonia in the same conditions (250°C –
30 min - ammonia flow = 20L.h-1
), the amount of ZnO2 in the case of thin films (~ 1.5 mg, film
size ~ 25 x 50 x 25.10-5
mm ) was about 200 times lower than for powder samples (~300 mg). As
the decomposition of ZnO2 around 200°C leading to the zinc deficient Zn1-xO is very exothermic,
the much larger quantity of precursor used in the case of powders would lead to a significant
increase of the local temperature during the nitridation thus causing the observed growth of the
nanocrystallites.
SEM images of the thin films show that the ZnO film consists of a dense and homogeneous film
with a thickness around 200 nm (Fig. 7A). The SEM images are in agreement with the broad
profile of the diffraction peaks suggesting the small size of the ZnO particles. ZnO nanoparticles
of less than 10 nm size agglomerate to form, after annealing at 150°C, aggregates with a size
around 50 nm. As illustrated in Figure 7B, after conversion in H2O2 solution, the surface of the
film appears less dense with an increase of the particles sizes. Moreover, Figure 7B shows an
increase of the thickness of the ZnO2 film up to 250 nm. The increase of the thickness is
concomitant with the structural change of the film from wurtzite-type ZnO into pyrite-type ZnO2.
This suggests that the film can tolerate a phase conversion without destruction. In the same way,

10
the thickness of the ZnO:N nanocrystalline thin film decreases around 210 nm after nitridation at
250°C under NH3, and a slight densification of the layer is observed (Fig. 7C). This is in
agreement with the thermal decomposition of ZnO2 into ZnO:N and support the formation of a
ZnO:N thin film with metal vacancies by analogy with the results obtained on powders. It is
worth pointing out that the highly exothermic decomposition of ZnO2 which is associated with an
important in-situ release of oxygen gas, do not degrade the quality of the ZnO:N film during the
ammonolysis step at 250°C.
UV-Vis transmittance analyses carried out on the thin films (Fig. 8) reveal an absorption band in
the UV region for the ZnO transparent film around 370 nm. After chemical conversion in H2O2
solution, the ZnO2 thin film remains transparent and the adsorption is blue shifted to the UV
region (<300nm). Finally, the slightly orange ZnO:N thin film presents a ZnO characteristic
absorption edge around 370 nm and a broad absorption in the visible between 400 and 500 nm
attributed to the insertion of nitrogen in the material during the decomposition of ZnO2 under
NH3. We note an important difference about absorption values for ZnO and more especially for
ZnO2 between powders and thin films samples. All the transmittance curves present a
transmittance higher than 80 % and fringes above the absorption limit, due to the interference of
the reflection of the light on transparent substrate and film surfaces. This phenomenon depends
on the refractive indexes and the thickness of the film [27]. The higher the thickness, the stronger
the oscillations. Figure 9 shows the XPS spectra of N 1s for both ZnO and ZnO:N thin films. The
N 1s spectrum of ZnO film dip-coated from the colloidal solution and annealed at 150°C
indicates some residual TMAOH species (peak at 402.8 eV [25]) as observed for the powder
sample. In addition to the orange coloration observed for the ZnO:N thin film, the N1s peak at

11
399.2 eV confirms the nitrogen insertion in the film after nitridation as it can be attributed to NHx
species [26].
4. Conclusion
In summary, ZnO:N powders with zinc vacancies were synthesized following a colloidal route
and nitridation process at low temperature. These results were successfully transposed to the
realization of ZnO:N nanocrystalline thin films by dip-coating from a colloidal solution on SiO2
substrates. ZnO film was converted into ZnO2 using a H2O2 solution in order to obtain, after a
nitridation step at 250°C under NH3, a slightly orange ZnO:N transparent thin film. The resulting
film presented a dense and homogeneous surface with a regular thickness around 200 nm. The
supposed presence of Zn vacancies coupled with nitrogen insertion in the ZnO thin film is the
key to access stable p-type conductivity for future p-n ZnO homojunction.
Acknowledgments
We are grateful to M. Nakatsu (MANA-NIMS), F. Gouttefangeas, L. Joanny, (CMEBA-Rennes),
B. Lefeuvre (ISCR) and Jonathan Hamon (IMN) for their help in XRD, SEM, ICP-MS and XPS
studies respectively. This work was supported by the French Research Agency (ANR) under the
grant ANR-13-BS08-0010 devoted to the stabilization of p-type ZnO with ZnO2 as precursor.
References
[1] N. Kiomarsipour, R. Shoja Razavi, K. Ghani, M. Kioumarsipour, Appl. Surf. Sci. 270 (2013)
33–38.
[2] G. Patrinoiu, J.M. Calderón-Moreno, D. C. Culita, R. Birjega, R. Ene, O. Carp, Solid State
Sci. 23 (2013) 58–64.
[3] Z.L.Wang, J. Song, Science 312 (2006) 242–246.
[4] C. Karunakaran, V. Rajeswari, P. Gomathisankar, Solid State Sci. 13 (2011) 923– 928.
12
[5] T. K. Gupta, J. Am. Ceram. Soc. 73(7) (1990) 1817-1840.
[6] Ü. Özgür, Ya. I. Alivov, C. Liu, A. Teke , M. A. Reshchikov, S. Dogan, V. Avrutin, S.-J.
Cho, H. Morkoç, J. Appl. Phy. 98(4) (2005) 041301.
[7] B.S. Chua, S. Xu, Y.P. Ren, Q.J. Cheng, K. Ostrikov, J. Alloys Compd. 485 (2009) 379-384.
[8] S.H. Park, S.H. Kim, S.W. Han, Nanotechnol. 18 (2007) 055608.
[9] L. Znaidi, G.J.A.A. Soler Illia, S. Benyahia, C. Sanchez, A.V. Kanaev, Thin Solid Films 428
(2003) 257–262.
[10] B. Chavillon, L. Cario, A. Renaud, F. Tessier, F. Cheviré, M. Boujtita, Y. Pellegrin, E. Blart,
A. Smeigh, L. Hammarström, F. Odobel, S. Jobic, J. Amer. Chem. Soc. 134 (2012) 464-470.
[11] A. Renaud, L Cario, X. Rocquefelte, P. Deniard, C. Payen, E. Gautron, E. Faulques, F.
Cheviré, F. Tessier, S. Jobic, Scientific Reports 5 (2015) 12914.
[12] F. Grasset, L. Spanhel, S. Ababou-Girard, Superlat. Microstruct. 38 (2005) 300–307.
[13] F. Grasset, G. Starukh, L. Spanhel, S. Ababou-Girard, D. Su, A. Klein, Adv. Mater. 17(3)
(2005) 294-297.
[14] P. Scherrer, Nach. Gesell, Gott. Wissens, Math. Phys. 1-2 (1918) 96–100.
[15] D. Kubelka, L. Munk, Z. Tech. Phys. 12 (1931) 593-601.
[16] J. G. Reynolds, C. L. Reynolds Jr., A. Mohanta, J. F. Muth, J. E. Rowe, H. O. Everitt, D. E.
Aspnes, Appl. Phy. Lett. 102 (2013) 152114.
[17] A Boonchun, W. R. L. Lambrecht, Phys. Status Solidi B 250 (2013) 2091-2101.
[18] J. Bang, Y. Sun, D. West, B. Meyer, S. Zhang, J. Mater. Chem. C 3 (2015) 339-344.
[19] F. Grasset, O. Lavastre, C. Baudet, T. Sasaki, H. Haneda, J. Colloid Interface Sci. 317
(2008) 493–500.
[20] K.A. Kim, J.R. Cha, M.S. Gong, J.G. Kim, Bull. Korean Chem. Soc. 35 (2014) 431-435.
[21] N. Uekawa, N. Mochizuki, J. Kajiwara, F. Mori, Y.J. Wu and K. Kakegawa, Phys. Chem. 5
(2003) 929–934.
[22] S. Sakohara, M. Ishida, M. A. Anderson, J. Phys. Chem. B 102 (1998) 10169-10175.
[23] D. Li, H. Haneda, J. Photochem. Photobiol. A Chem. 155 (2003) 171–178.
[24] D Li, H. Haneda, Chemosphere 54(8) (2004) 1099-1110.

13
[25] M. Chigane, M. Ishikawa, J. Chem. Soc., Faraday Trans. 94 (1998) 3665-3670.
[26] N. Herring, L. Panchakarla, M. Samy El-Shall, Langmuir 30 (2014) 2230-2240.
[27] R. Swanepoel, J. Phys. E: Sci. Instrum. 16 (1983) 1214-1222.

14
Figures and Tables
Table 1: Oxygen/nitrogen determination, average crystallites sizes and band gaps of
ZnO/ZnO2/ZnO:N powders.
Figure 1: Schematic approach for the synthesis of the Zn1-xO:N thin films
Figure 2: XRD patterns of ZnO/ZnO2/ZnO:N powders (*sample holder).
Figure 3: DTA/TGA curve of ZnO2.
Figure 4: Diffuse reflectance spectra of ZnO/ZnO2/ZnO:N.
Figure 5: N 1s XPS spectra of ZnO and ZnO:N powders.
Figure 6: XRD patterns of ZnO, ZnO2 and ZnO:N thin films on SiO2 substrate.
Figure 7: SEM images of thin films: (A) ZnO (B) ZnO2 (C) Zn1-xO:N. On the left: side view of
the cross-section, on the right: top view of the films.
Figure 8: UV-Visible transmittance spectra of ZnO, ZnO2 and ZnO:N thin films on SiO2
substrate.
Figure 9: N 1s XPS spectra of ZnO and ZnO:N thin films.
15
Figure 1: Schematic approach for the synthesis of the Zn1-xO:N thin films
ZnO thin film
ZnO2thin film
Zn1-xO:N thin film
(slightly orange)
Chemical conversion
H2O2 / H2O (5/35 mL)
Nitridation under NH3
Δ 250°C - 30 min

16
Figure 2: XRD patterns of ZnO/ZnO2/ZnO:N powders (*sample holder).
5 15 25 35 45 55 65 75 85
Inte
nsi
ty (
u.a
.)
2θ (°)
(11
1)
(20
0)
(21
0)
(21
1)
(22
0)
(31
1)
(22
2)
(40
0)
(33
1)
(10
0)
(00
2)
(10
1)
(10
2) (1
10
)
(10
3)
(20
0)
(11
2)
(20
1)
(00
4)
(20
2)
(10
4)
(20
3)
* *ZnO:N
ZnO2
ZnO
17
Figure 3: DTA/TGA curve of ZnO2.
0
1
2
3
4
5
6
7
18
19
20
21
22
23
24
25
0 100 200 300 400 500 600
ΔT
(°C
)
We
igh
t (m
g)
Temperature (°C)
TGA
DTA
18
Figure 4: Diffuse reflectance spectra of ZnO/ZnO2/ZnO:N.
0
10
20
30
40
50
60
70
80
90
100
250 350 450 550 650 750
% R
wavelength (nm)
ZnO:NZnO2
ZnO

19
Figure 5: N 1s XPS spectra of ZnO and ZnO:N powders.
396398400402404406
Inte
nsi
ty (
a.u
.)
Binding energy (eV)
399.6
ZnO:N
ZnO
402.9 399.7
N1s

20
Fig.6: XRD patterns of ZnO, ZnO2 and ZnO:N thin films on SiO2 substrate.
10 20 30 40 50 60
Inte
nsi
ty (
a.u
.)
2θ (°)
(11
1)
(20
0)
(11
0)
(10
2)
(10
1)
(00
2)
(10
0)
(22
0)
ZnO:NZnO2
ZnO

21
Figure 7: SEM images of thin films: (A) ZnO (B) ZnO2 (C) Zn1-xO:N. On the left: side view of
the cross-section, on the right: top view of the films.
≈ 200 nm
A
B
C

22
Figure 8: UV-Visible transmittance spectra of ZnO, ZnO2 and ZnO:N thin films on SiO2
substrate.
0
10
20
30
40
50
60
70
80
90
100
200 300 400 500 600 700
%T
wavelength (nm)
ZnO:N
ZnO2ZnO

23
Figure 9: N 1s XPS spectra of ZnO and ZnO:N thin films.
396398400402404406
Inte
nsi
ty (
a.u
.)
Binding energy (eV)
ZnO:N
ZnO
N1s402.8
399.2